2020 was a challenging year for the whole Country, including Bartow. It was especially challenging to conduct a city-wide visioning and planning effort of this scope and scale in the middle of a global pandemic. With all the lockdowns, social distancing, and tele-working that became the norm during that year, the triedand-true methods and activities of community planning were suddenly not available in the same way they were before. But Bartow was facing challenges long before COVID that will continue to shape it’s future long after, so these matters could not wait. With the City’s blessing, the entire process received a virtual makeover, and continued to press forward. The Bartow Plan team offers our sincere appreciation to all those who participated in this effort and thanks for the flexibility that the community, staff, and elected officials have shown through the entire process.
Throughout this planning process, we heard two things very clearly from the community. The first was that Bartow’s character is incredibly important to the people who live here. Bartow is a tight-knit, well connected community that comes together to get things done. They are proud of what they have: their history and institutions, their unique neighborhoods, their downtown, and their County Seat status. The second was that Bartow’s character is in danger. A variety of contributing factors (both internal and external) were offered as sources for that danger, but the overarching goal of protecting and enhancing the character of Bartow was paramount. We have taken these points to heart and have placed community character firmly at the foundation of the Bartow Plan.
As Bartow moves forward into implementation, we truly hope that the Bartow Plan inspires several things:
• Renewed confidence in a positive vision for the future;
• Rekindled civic pride through quality public spaces, parks, and streets; and
• Reinvestment in Bartow by the City, the County, small businesses, and residents alike.
This is exactly the opportunity that Bartow needed to break free from what some would characterize as an extended season of “paralysis of analysis”, and it couldn’t have come at a better time.
Inflection Points
Bartow is rapidly approaching numerous critical inflection points. Though some are more apparent than others, these inflection points have been building for years. These are big complex topics and are linked on many levels, but Bartow has never been in a better position to tackle the wide range of critical issues and use the inflection points to tip towards positive change for the community.
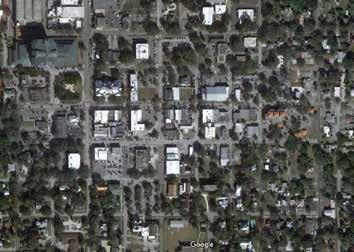
Housing/Growth – Perhaps no other topic has such a visible impact on the character of a place as the topic of land use and development. The recent slow pace of development in Bartow is deceiving and big changes may be coming. Bartow has an opportunity that many other communities in Polk County and the region have not, in that they can see change coming and have time to prepare. Bartow will be able to establish regulatory frameworks that both protect its character and also accommodate future growth.
Water – Water is an incredibly important issue for Polk County as growth closes in from both Tampa and Orlando. Discussion of the topic can no longer just be about supply. It must address head on our responsibility to the greater Peace River watershed and the critical role Bartow plays as the headwaters for the entire basin. This inflection point is inseparably linked to Housing/ Growth.
Mobility – Like the topic of Water, Mobility is directly linked to Housing/Growth. Though most close in neighborhoods are within walking distance of downtown, and many surrounding streets have sidewalks, Bartow is an automobiledependent town. Every day thousands of people
commute into Bartow for government-related jobs, and thousands of people commute out of Bartow for service-related jobs. How can Bartow accommodate automobiles while safely promoting alternative transportation options for those who would otherwise be willing to use them.
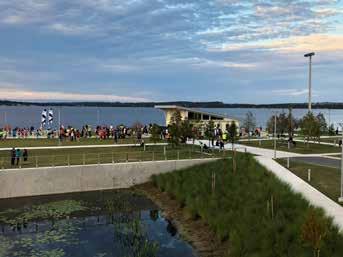
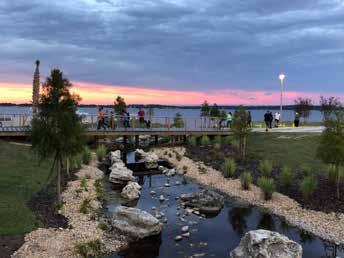
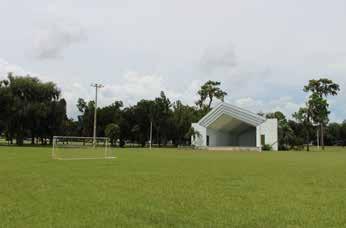
Parks – Parks are an integral part of everyday life for residents of Bartow. They are a very visible indicator of community health and stability. Though Bartow has a many amazing parks with diverse recreation options, resources have been spread thin, so maintenance, planning, and quality have suffered. Though many inspiring ideas related to parks have been born out of the Bartow Plan process, the heavy lifting will be carried by a future Parks and Recreation Master Plan that will take things to the next step.
Fiscal Position – The fiscal topic cannot be just about keeping taxes low. This inflection point is about being able to provide the quality of life that people who live, work, and play in Bartow want, while keeping the finances of the City healthy for the future. It starts by understanding how Bartow stacks up to truly relevant peers and what options might be open for realignment.
Where do we grow from here?
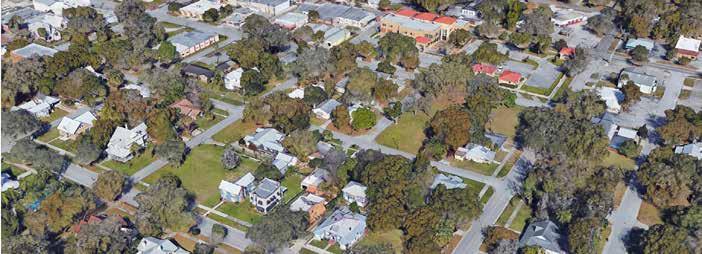
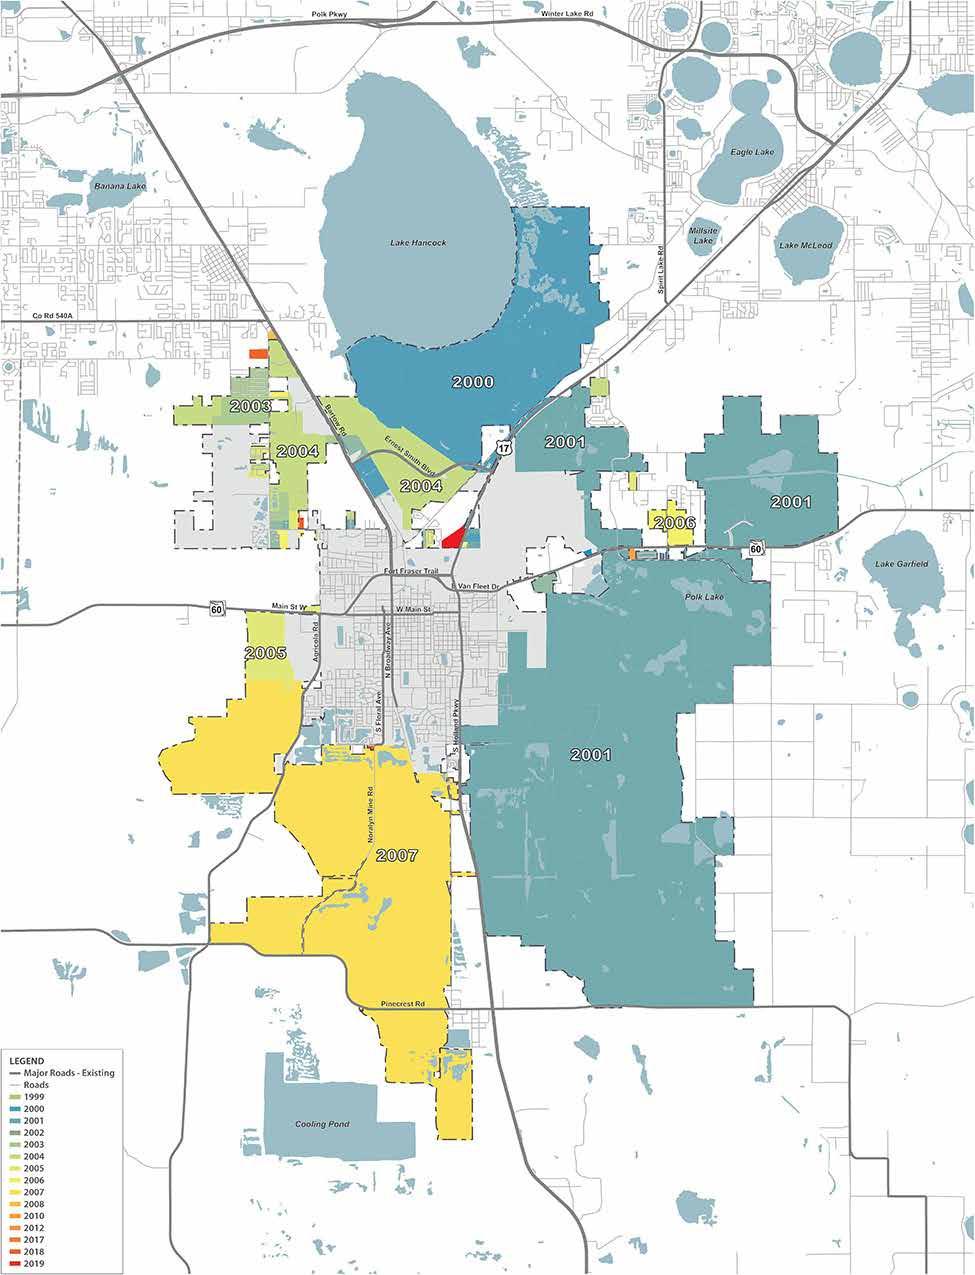
Polk County has seen incredible growth as development pressures from Orlando and Tampa extend steadily towards each other along the I-4 corridor. Since the year 2000 the City of Lakeland has grown by 50%. Winter Haven, Haines City, Lake Alfred, and even Lake Wales have nearly doubled in size. Davenport has tripled. Because Bartow is farther off the beaten path of I-4, it has not yet seen the growth rates that these other communities have. The result is that Bartow’s share of Polk County growth has been steadily declining for decades. Though that doesn’t mean
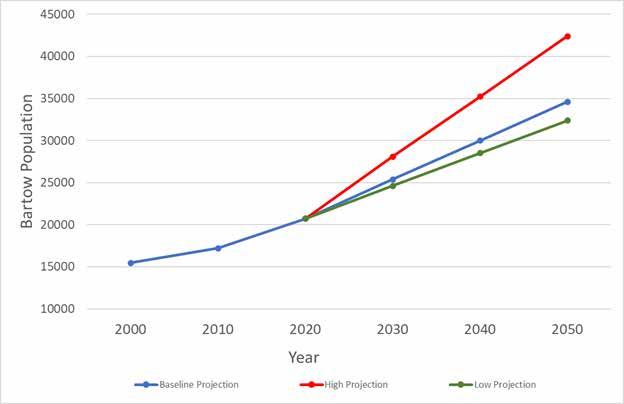
that Bartow hasn’t been growing, it means that its growth has been easier to overlook. But now a different trend may be developing, and the City cannot ignore it. Over the last few years, Bartow’s share of Polk County’s growth has started to climb, meaning that development pressures may be making their way even to Bartow. Though Bartow may never see growth rates as high as the I-4 corridor, a doubling of the population by 2050 is not out of the question, especially with regional transportation projects such as the Polk Parkway extension in the works.
Already, change is clearly taking place. Residential subdivisions are steadily replacing the farms and range lands along US 98 and US 17 north of Bartow. As Bartow pushes outward, growth from the cities of Lakeland and Winter Haven extends south to meet it. In the traditional city, vacant parcels are gradually filling in at a rate that, for now seems business as usual, but where do we
The Housing section in Chapter 3 discusses development trends and drivers in much more detail and the full report on Population Projections can be found in the Appendix to this report.
grow from here? If the projections are true how will Bartow accommodate this future growth and what risks does growth pose to the character of the community? These new residents will be looking for housing, jobs, and City services. This Bartow Plan attempts to tackle those difficult questions head on from multiple angles.
An Economic Highwater Mark
A historic surge in competition for housing, brought on by many factors which the COVID-19 global pandemic intensified, may provide a window into what the “highwater mark” is for demand in the Bartow.
The Redfin Compete Score1 uses housing market data to rate how difficult it is to win a home in an area. With the heat turned up during this time of intense competition, we might be able to distinguish potential growth trends in the area.
According to the scores, Bartow is very competitive, as is Lakeland, Mulberry, and Fort Meade. We might expect available land between these completive markets, along U.S. 98 and west on SR 60, to experience relatively higher development pressure. Housing inventory is historically low, so this area may not yet be realizing this growth. Bartow Plan aspires to capture this growth to help enhance quality of life and character in Bartow.
Bartow has experienced waves of rapid housing demand throughout its history but what makes this era unique is the region’s inability to meet demand with new supply.
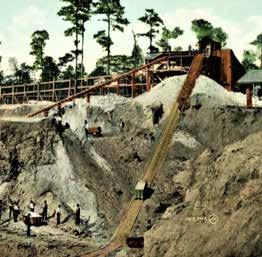
Lawrence Bernard Brown arrives to Bartow during an economic boom sparked by the discovery of rich deposits of phosphate within the “Bone Valley”. L B. Brown develops 50 to 60 houses throughout Bartow of the next few years. Mining industry expands(1910s) The phosphite mining industry grows to become the largest in the nation. Mining companies buy large tracts of land surrounding Bartow.
Florida land boom ensues (1920s)
A significant share of Bartow’s core lots are platted during this period, typically 25 to 50-ft wide.
First zoning Bartow’s population and the City zoning ordinance, zoning.
Bartow
01 Before the Seminole Wars, the Peace River watershed consisted of dense tree stands and deep wetlands. Vegetation and the land contour allowed for water to filter and flow into the Floridan Aquifer.
02 With the discovery of deposits of phosphate and new soils revealed by wetland drainage, a mining and agriculture boom transformed the contours of land within the Peace River watershed.
03 Growth and development along the I-4 corridor remains among the fastest in the nation, increasingly converting agriculture and wetlands into roads, houses, and work places.
Primary Drivers of Land Cover Change
As mining & ag. activities diminish, urbanization has emerged as the dominant driver of changes in land cover across the watershed.
zoning codes are adopted (1955) population booms post WWII adopts its first citywide ordinance, codifying single family
Environmental Quality
Mining & Agriculture
Urbanization
Mining operations move south (1990s)
Housing Scarcity Crisis (2016- ) New construction is slow to recover after the 2008 Financial Crisis as a wave of first-time home buyers enter our regional housing market.
Infill vs Greenfield Development
All Cities accommodate growth between infill and greenfield development, with infill taking place on vacant and redeveloped sites within the developed area of the City, and with greenfield taking place on undeveloped property usually on the periphery. In the vast majority of jurisdictions infill development is a small fraction of what greenfield development can generate. Bartow is
no exception to this; however, Bartow presents some unique factors and context that could greatly increase the roll of infill in the future. These unique factors play out in the Bartow Plan in the form of very deliberate land use, mobility, and other recommendations that balance out infill and greenfield development.
Infill & Redevelopment Next Generation Greenfield
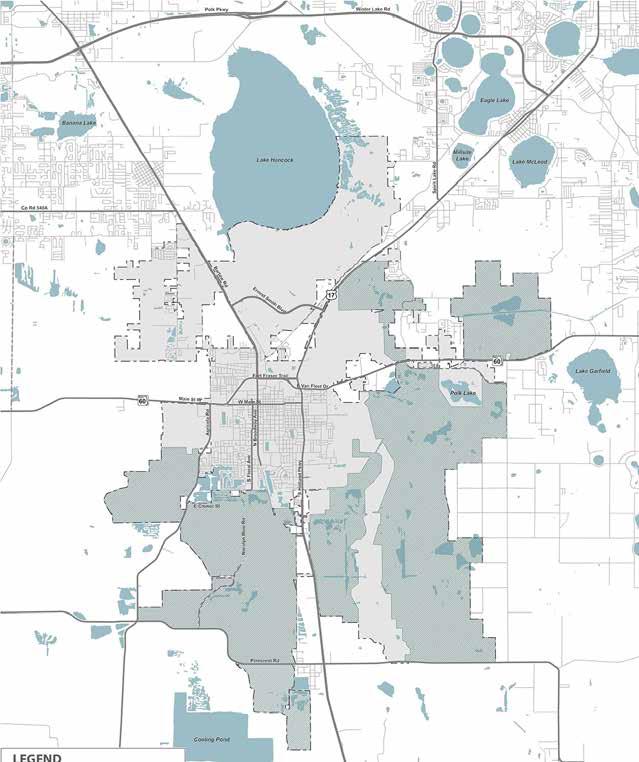
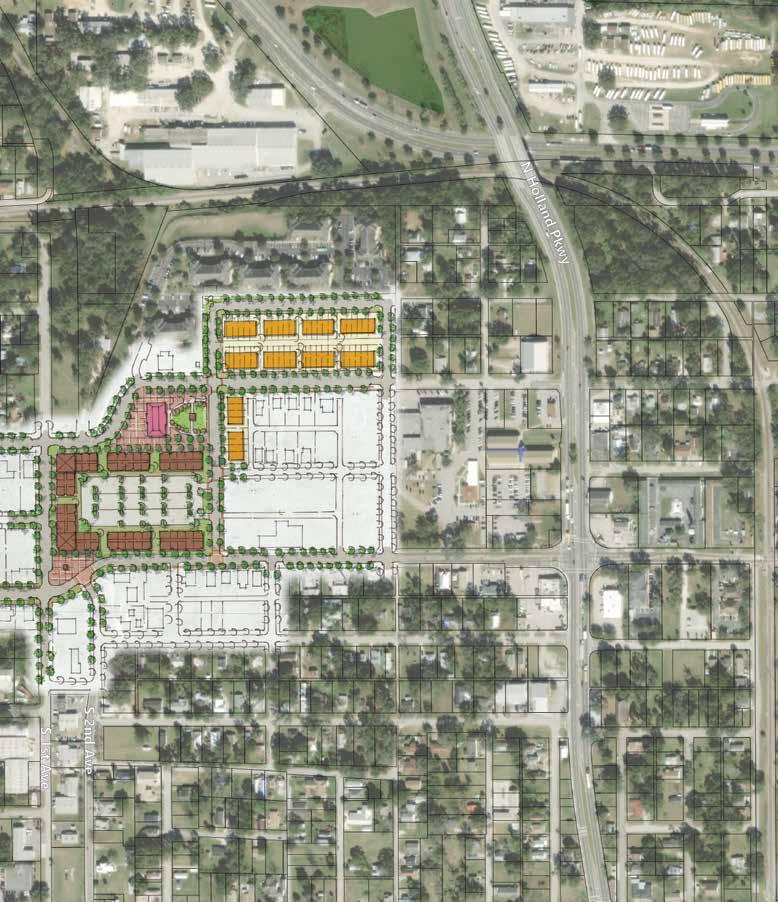
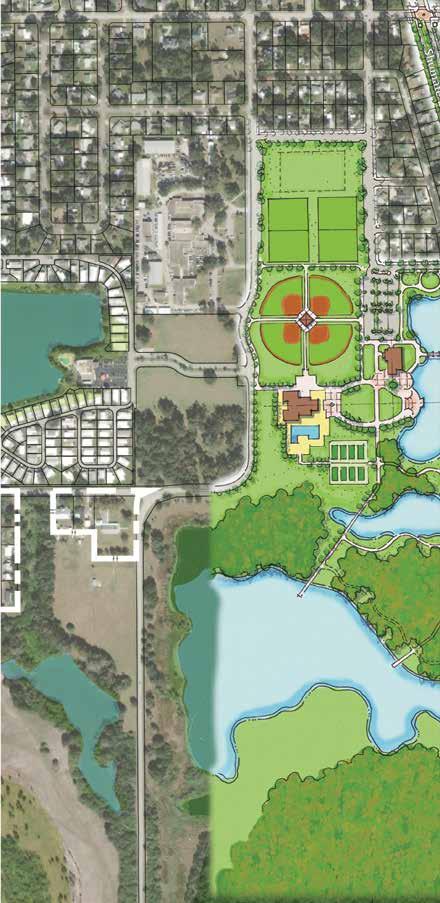
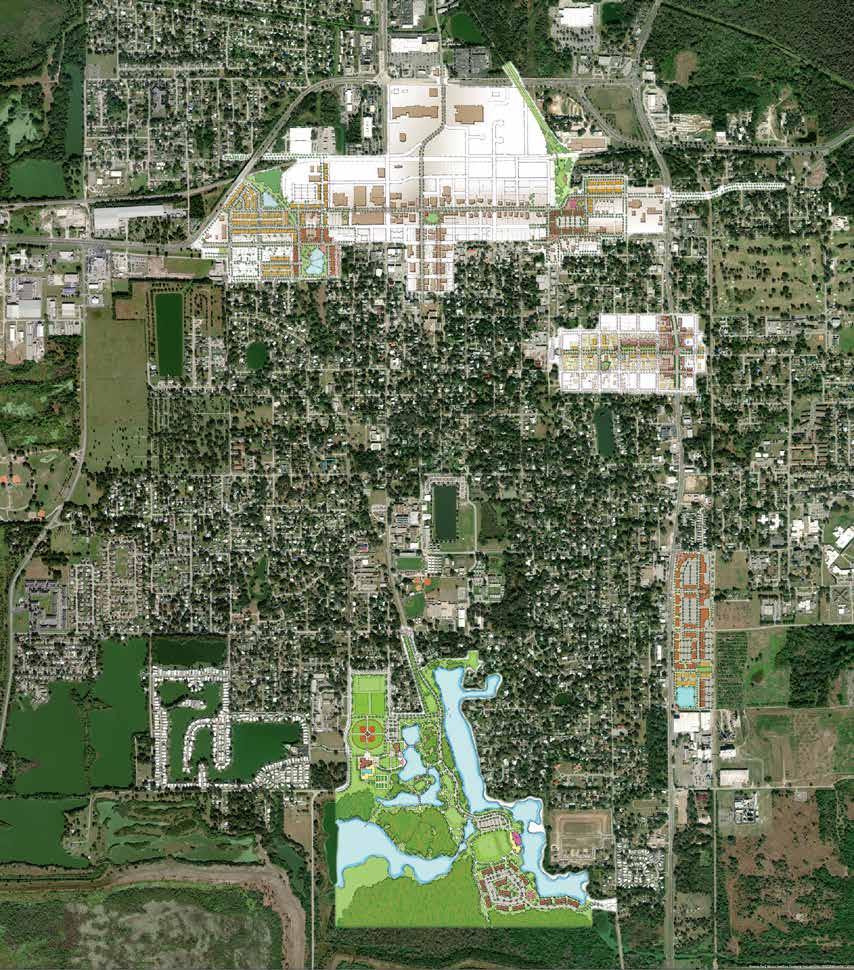
Clear Springs
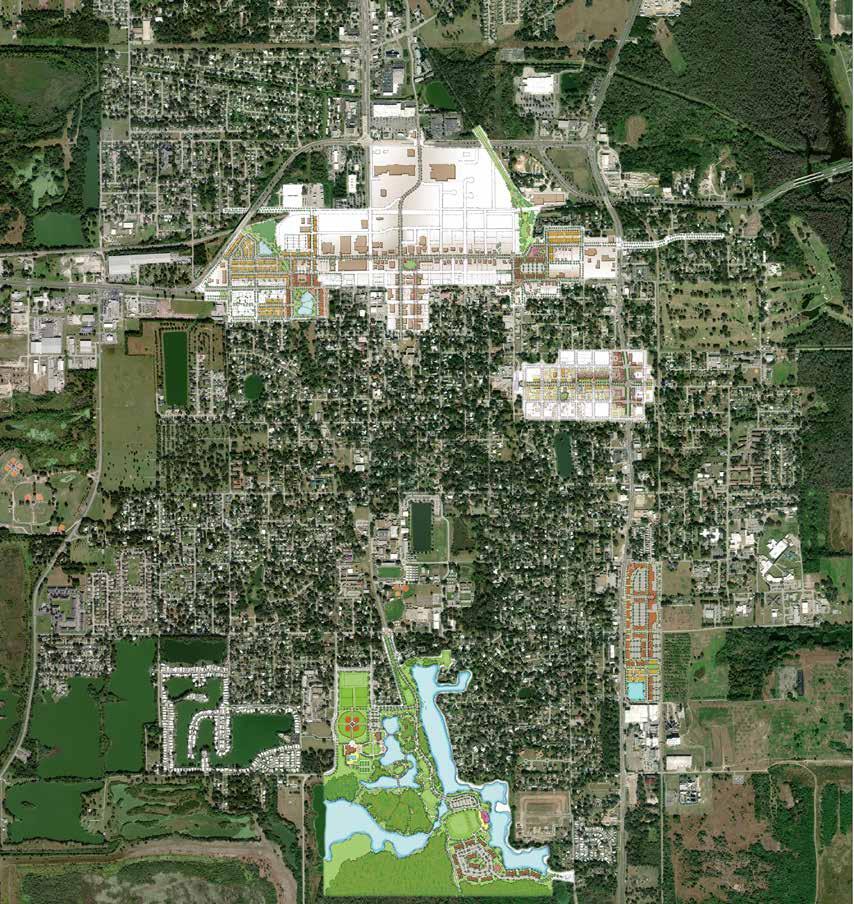
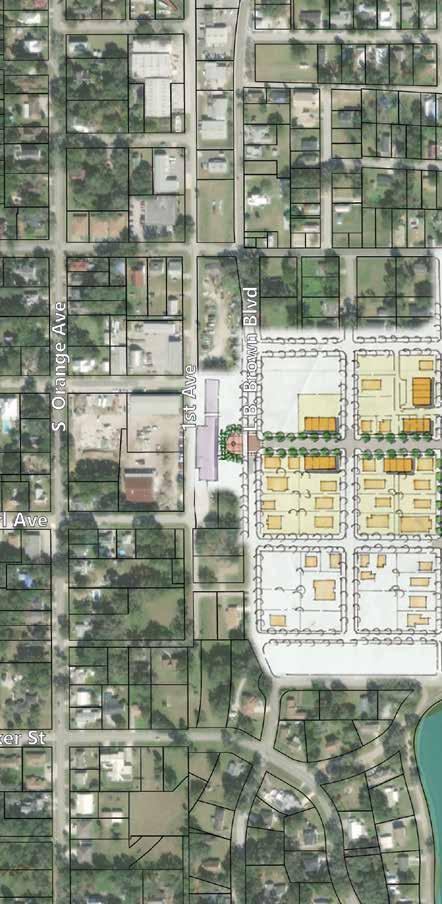
Clear Springs is a large land holding comprised of former phosphate mining properties to the east and south of the traditional city. These lands represent over half the area within the city limits of Bartow, though much of the land is reclaimed wetlands, floodplain, and conservation. The area was annexed into the City between 2001 and 2007 and portions were approved for major development through a Specific Area Plan in 2009. DSAP #1 entitled the property for nearly 10,000
residential units and 22 million square feet of non-residential uses. Though the project was to be phased through 2030, to date, only the Polk State College Clear Springs Advanced Technology Center has been built.
As a greenfield site, Clear Springs would represent an overwhelming percentage of the City’s future growth projection. But since it is all under single ownership, that potential is locked up until such time as the developer determines to begin
building. Until then, Clear Springs forms a de facto growth boundary. This is certainly no indictment on Clear Springs, just a simple reality. Even if Clear Springs decided to start building tomorrow, significant investments in utilities, roads, and other
infrastructure would have to be made first to provide services and access to the properties. That alone would take a long time to accomplish, not including the time to deliver physical houses.
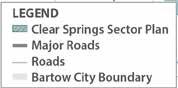
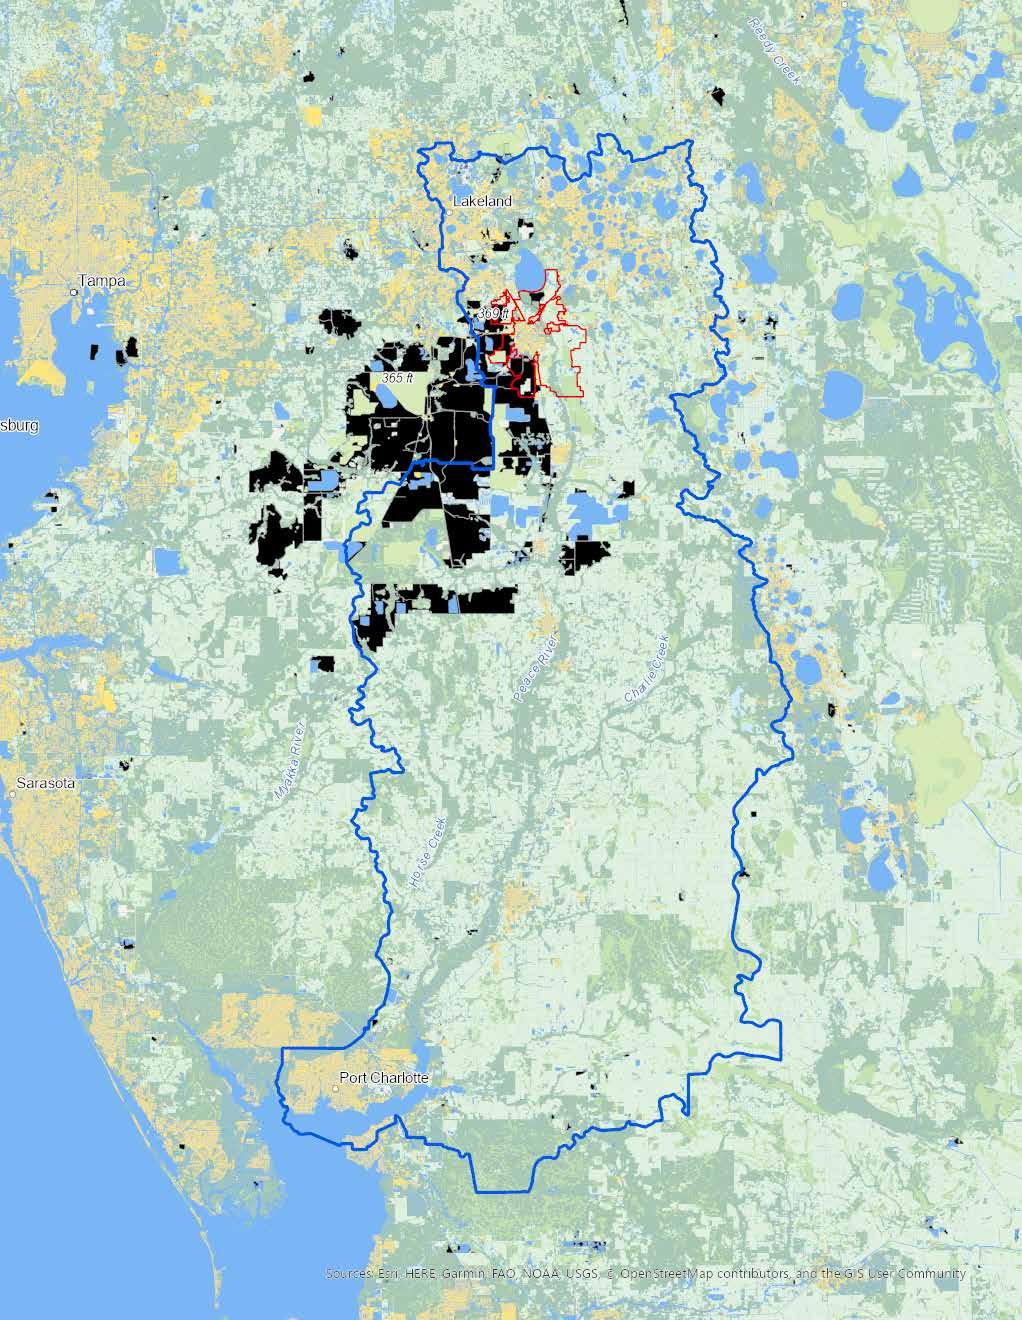
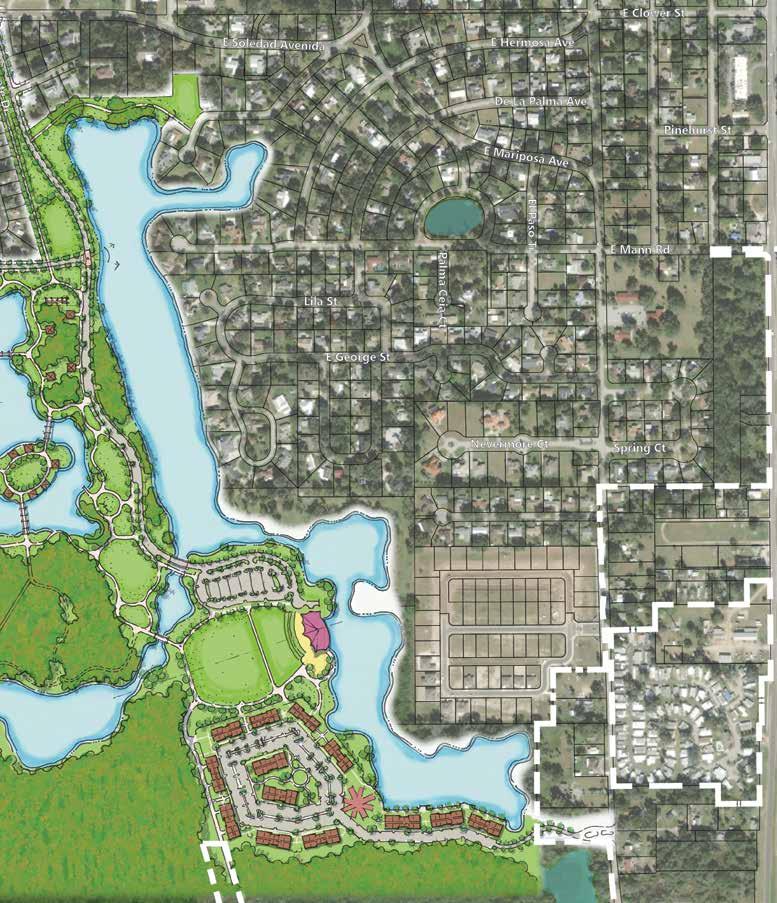
Land Constraints
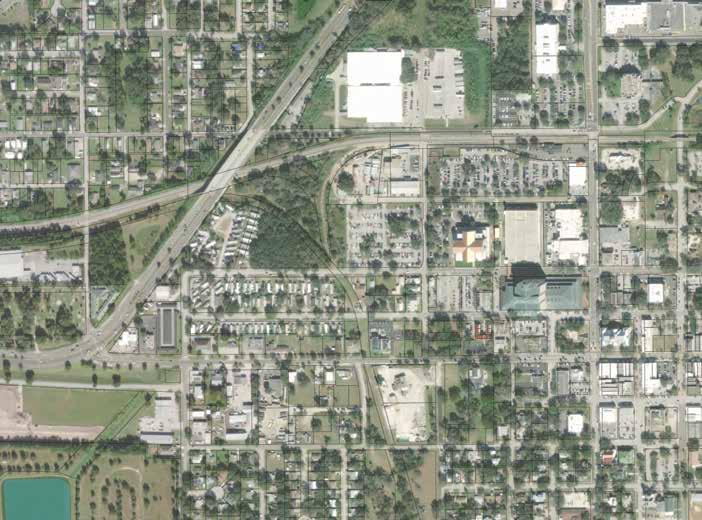
Clear Springs is by no means the only growth constraint Bartow faces. To the west of Bartow lies miles of active and reclaimed phosphate mines, gypsum stacks, landfills, and other barriers that offer no potential for future growth. Wetlands, floodplain, and conservation lands encircle the traditional city from the south west, counterclockwise to the north, with only isolated pockets around US 98, SR 60, and US 17 available for annexation and/or ready development. Three formerly residential and mixed-use projects in the City were recently converted to solar farms, further limiting future development options. The US 98 corridor northwest of the City continues to offer some opportunities for greenfield development, but it is rapidly disappearing as Bartow, Lakeland, and Polk County take down the remaining pieces. The map below shows all these development constraints and more filled in black to quickly hammer home the point – that Bartow’s future growth scenarios are “complicated”, much more complicated than most jurisdictions face. They will only be solved with a wholistic approach to infill and greenfield development.
Note: The Clear Springs DSAP is colored black as a development constraint. It could theoretically start development and would no longer be a “constraint” per se. The balance of Clear Springs would remain a constraint, however.
Community-Based Themes
The Bartow Plan team spent a significant portion of early and mid 2020 gathering data and community input to better understand the issues, values, and vision on which the plan would be built. These major efforts were documented in detail in two stand-alone reports entitled Existing Conditions Technical Memorandum and the Community Themes Summary, both of which are included in the Appendix to this report. We highly recommend reviewing those documents as they will explain much of the reasoning behind the recommendations and actions found in this plan.
Community Based Themes
Using focus groups, the public kickoff, and technical analysis, our team was able to formulate and validate a set of comprehensive Themes. Addressing a variety of issues, the themes encompass many of the needs and aspiration of the community.
• Strengthen Downtown
• Revitalize Centers & Corridors
• Reinvest in Public Infrastructure
• Connect Parks & Public Spaces
• Diversify Housing
• Our Best Foot Forward
Character
Framework Regulatory Framework
The Community Character Framework uses a common language to describe the relationships between people and places in Bartow. Community Themes describe a vision for what Bartow residents think their city could be.
• Downtown Core
• Centers
• Corridor Redevelopment
• Infill Neighborhood
• Suburban Neighborhood
• Greenfield
• Workplace
The Regulatory Framework policy strategies and implementing Bartow three key focus areas:
• Housing
• Water
• Mobility
Regulatory Framework Action Framework
Framework outlines concepts for Bartow Plan through areas:
The Action Framework sets the stage for identifying the strategies and actions that the city and community will pursue to implement Bartow Plan.
• Built Environment
• Economic Development
• City Services
• Regulatory Environment
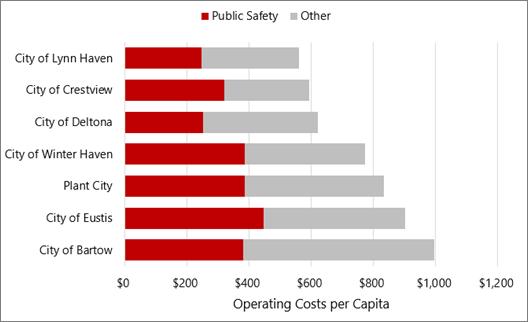
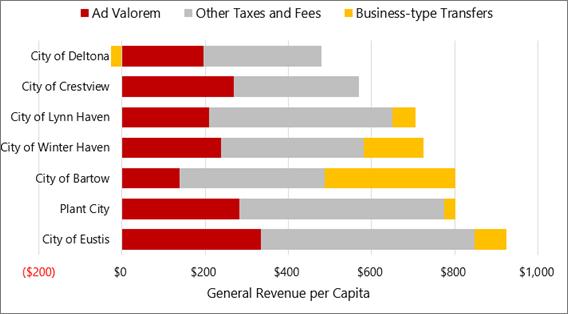
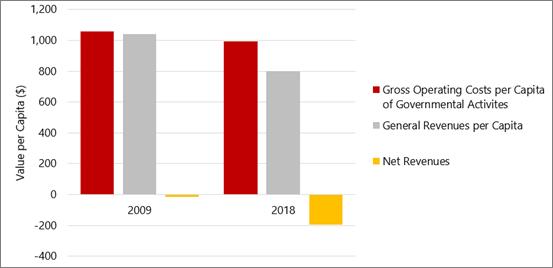
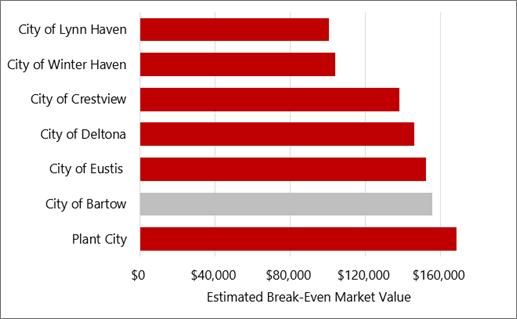
Fiscal Assessment & Benchmark
The Fiscal Assessment & Benchmarking section presents a statistical analysis comparing Bartow’s fiscal position with that of analogous jurisdictions based on land area, population, density, and population growth. These jurisdictions are:
• City of Eustis
• City of Lynn Haven
• City of Crestview
• City of Winter Haven
• Plant City
• City of Deltona
CHARACTER FRAMEWORK
CHARACTER FRAMEWORKS
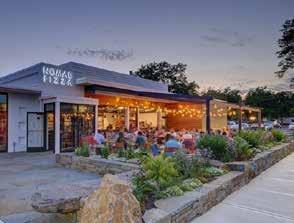
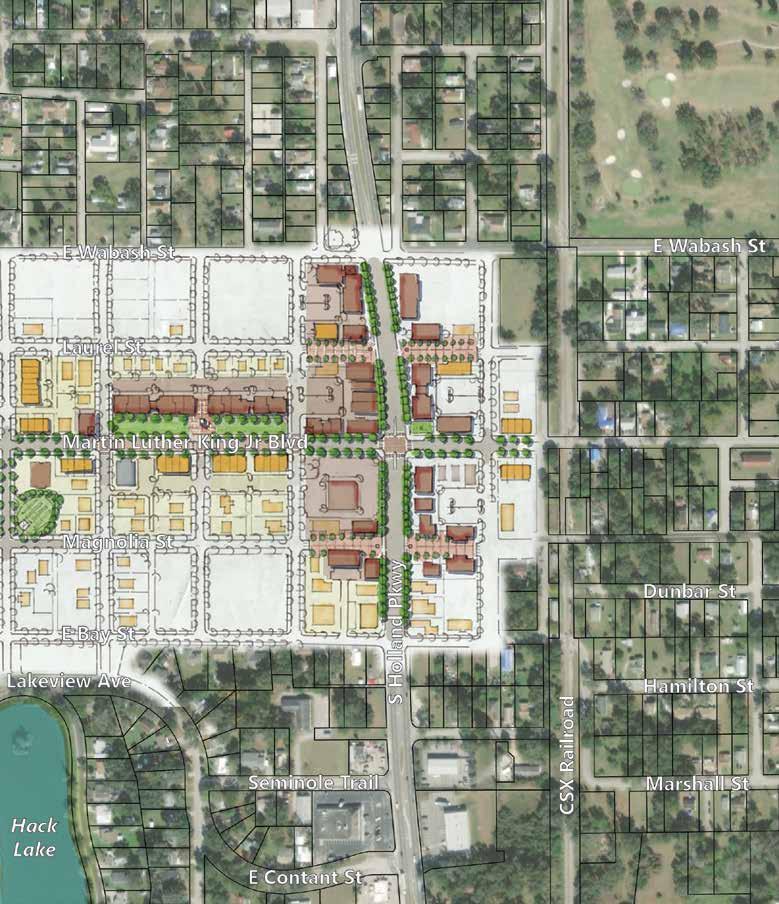
DOWNTOWN CORE
CLUSTERS
CORRIDORS
URBAN NEIGHBORHOODS
SUBURBAN NEIGHBORHOODS
WORKPLACES
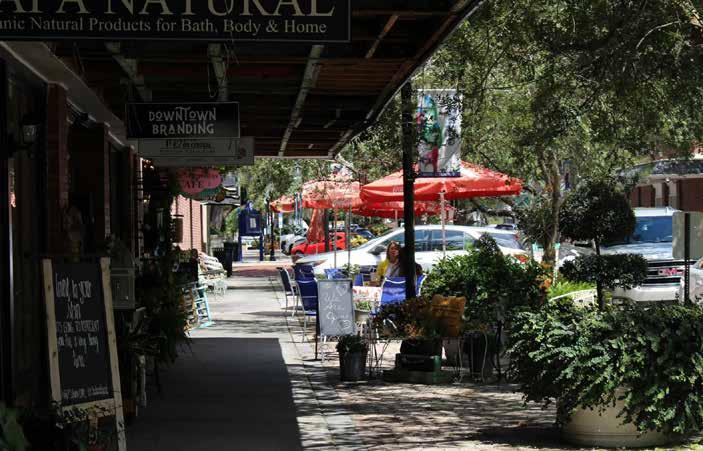
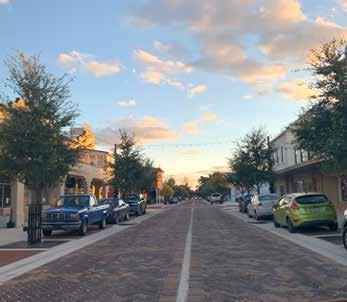
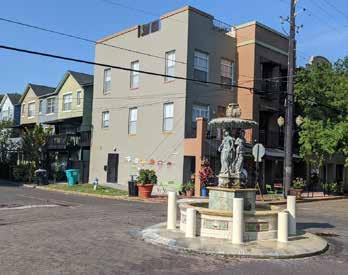
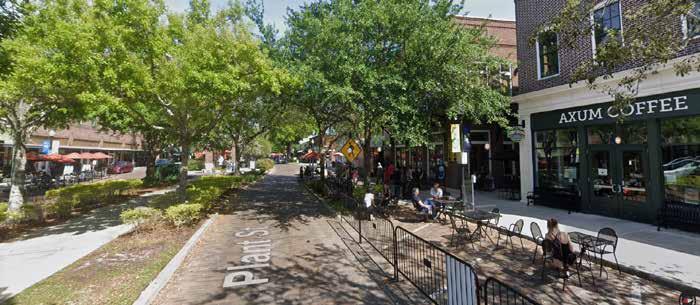
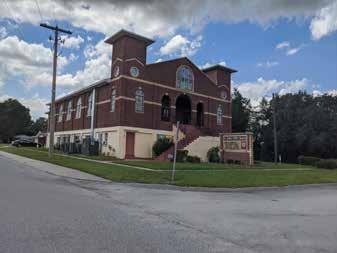
Downtown Core
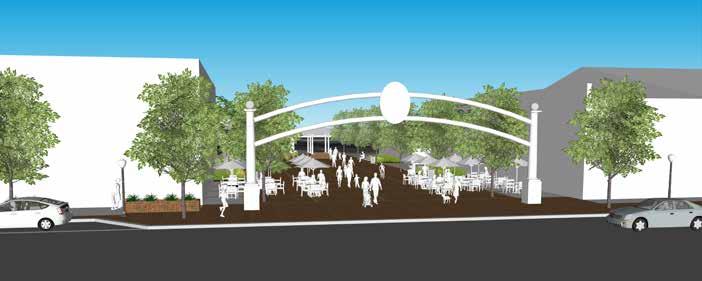
The Downtown Core is the ideal expression of Bartow’s history, culture, and community kinship embodied as a place for people. The core celebrates public life where folks of all ages, backgrounds, and economic dispositions gather and share space.
Today Vision
“Downtown needs more housing, I want to live downtown!”
“It’s hard to walk from 200 to 300 block because of inactivity.”
“Our craft festival draws 20,000 people to Bartow each year.”
“Bring Ft. Fraser trail into downtown.”
“We need a downtown with multiple destinations to keep people there longer.”
“There isn’t really anything for kids to do downtown.”
“Improve sidewalk connectivity south of the Downtown core.”
“The sidewalks roll-up at 5 o’clock.”
“As County seat, we need to neatly maintain Downtown Bartow.”
“I need a place to start my business.”
Downtown is a place of work, serving as the County Seat, but also a place where people live and play. Renovated lofts and newly constructed townhomes and apartments provide fresh housing options for young professionals and retirees seeking a connected, downtown lifestyle.
Street trees, wide sidewalks, and inviting storefronts create a cozy environment year-round. Streets are flexible and can be closed down for festivals.
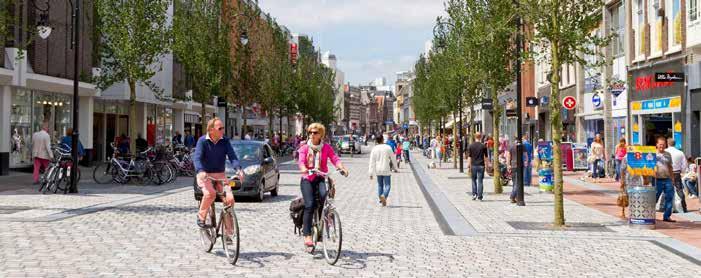
Every weekend, waves of bicyclists ride into Downtown, first convening at the gazebo on Church and Wilson, then dispersing in all directions along Main Street by foot.
As Bartow Elementary lets out, parents and caregivers walk and talk to each other as their kids safely run, jump, tag, and tumble along the pedestrian mall. Field trips to the stormwater park on West Main are frequent, where students learn about form and function of City infrastructure through play and recreation.
Main Street is polished, serving the County administration lunch crowd by day, but loosens at night, eminating with live music and festoon lit sidewalks.
Secondary streets like Summerlin Ave play a vital role in providing affordable lease space for budding entrepreneurs to test their business models.
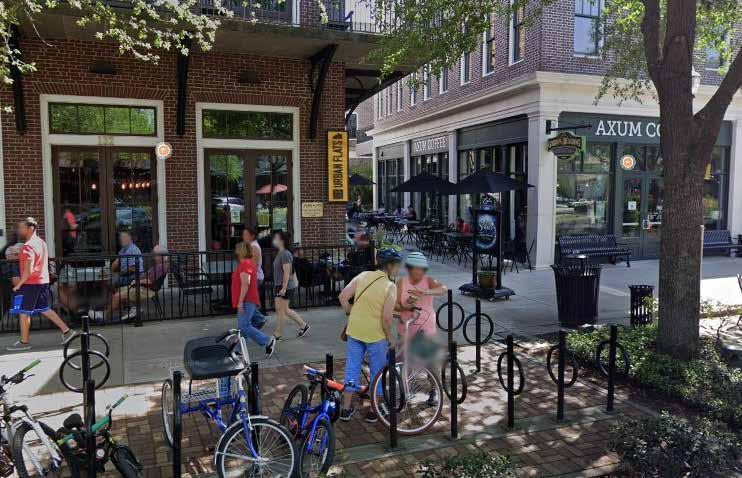
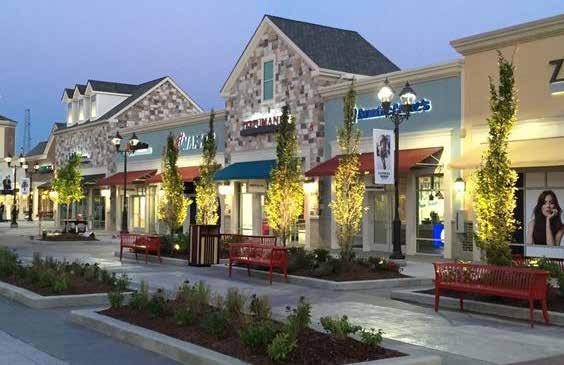
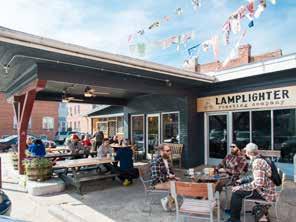
Outside the Downtown Core, Clusters are the primary activity centers for their surrounding community. Clusters prioritize access to commercial goods and services but also allow for a mix of residential, workplace, and civic uses.
Today Vision
“The eyesore intersection needs to change.”
“Show better front doors to the city.”
“These areas lack identity.”
“East Bartow has the potential to redevelop the old Hospital.”
“I have to drive far to get to access daily needs like the bank.”
“I don’t feel safe walking to the store.”
“I have to walk far to get from the bus stop to my job.”
“We need more workforce housing.”
“Where can we add more multifamily housing options?”
Clusters are well-connected with walkable block sizes, an orientation toward public parks and trails, and a wide mix of commercial, office, and attached residential types. An orientation to public spaces, including ample sidewalks and buildings oriented to the street, gives character to these places.
Clusters provide daily services closer to where people live, making it easier to access by foot or bicycle. Clusters include premium transit stops that are co-located with civic spaces internal to the cluster.
New workforce and multifamily housing options are a source of vitality for clusters, helping to support a mix of neighborhood scale commercial uses. Housing near clusters benefit from access to transit and nearby parks and open spaces.
L y l e P k w y
Co u n t y R oad 555 S
ft US Hig hway 17 W M a i n S t NVan
Dr
N M a p l e A v e E C h u r c h S t E C h u r c h S t N W i l s o n A v e S W i l s o n A
M a i n S t E S t u a r t S t E M a i n St C o u n t y R o a d 5 5 5 S B a r t o w
S t u a r t S
W M c L e o d S t W P a r k e r S t W S t e w a r d S t W V i n e S t W C h u r c h S t
S 1 s t A v e E G e o r g i a S t W C l o w e r S t S O a k A v
L a u r e l S
E B a y S t
S G o l f v i e w A v
E Cl o w e r S t W a b a s h S t E
S K i s s e n g e n A v e O l d
Clusters
Storefront seating, lighting, tree canopy
Dwell / gathering space
Amenitized open space
Experiencial retail
Corridors
Corridors are busy streets that prioritize the comfort and safety of people moving by foot, bicycle, bus, and car. Connections into surrounding residential areas make Corridors the “main streets” of Bartow neighborhoods.
Today Vision
“I have to walk far from the bus stop to access my job.”
“We need more walkable developments near residential neighborhoods.”
“We need more workforce housing.”
“Where can we add more multifamily housing options?”
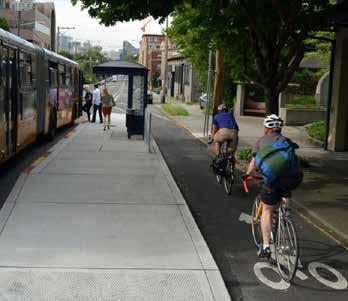
Corridors provide multimodal mobility options, including transit service. Transit stops should colocate with parks, open spaces, and places where significant ground floor activity occurs to help enhance access and comfort for transit riders.
Corridors allow a mix of multi-family residential types (e.g. townhomes or small apartments). These areas may also support intensification of community-scale commercial or non-residential uses.
“These areas lack a distinct character”
“Corridors are our gateways into Bartow”
Street trees and buildings placed close to the street edge help frame the corridor, offer visual interest and queuing drivers to slow down. Corridors provide comfortable connections into the surrounding neighborhoods enabling walkable access to the corridor which help corridors grow as neighborhood “main streets”.
L y l e P k w y
Co u n t y R oad 555 S
M a i n S t NVan
N M a p l e A v e E C h u r c h S t E C h u r c h S t N W i l s o n A v e S W i l s o n A v
M a i n S t E S t u a r t S t E M a i n St C o u n t y R o a d 5 5 5 S B a r t o w
S t u a r t S
W M c L e o d S t W P a r k e r S t W S t e w a r d S t W V i n e S t W C h u r c h S t
S 1 s t A v e E G e o r g i a S t W C l o w e r S t S O a k A v
L a u r e l S
E B a y S t
S G o l f v i e w A v
E Cl o w e r S t W a b a s h S t E
S K i s s e n g e n A v e O l d
Building pushed to street
Side street courtyard
Off-street bikeway
Rear parking & drive-thru
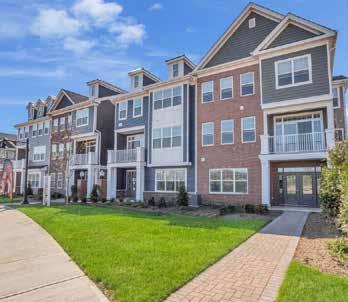
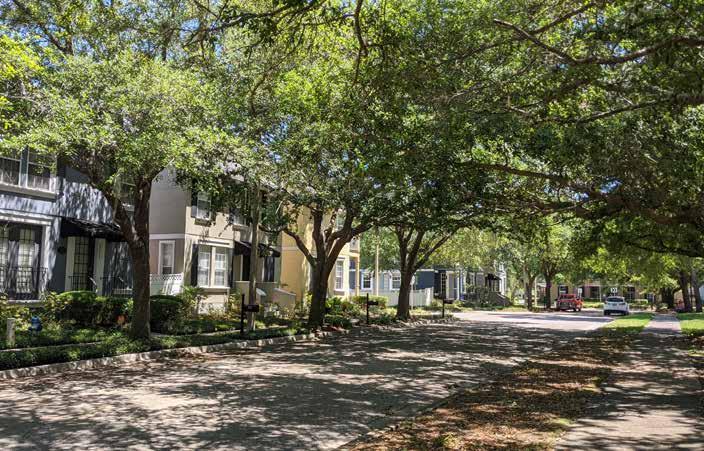
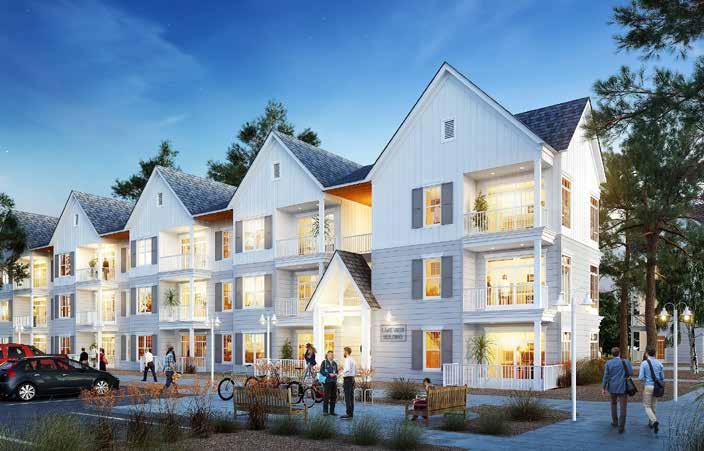
Urban Neighborhoods
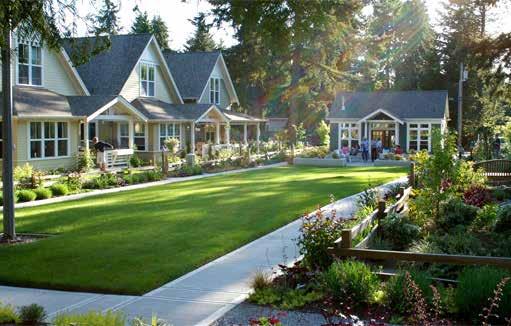
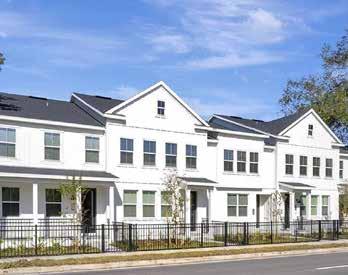
Urban Neighborhoods are charming, tree-lined, and smallblock residential areas that provide a variety of housing choices allowing people stay in the neighborhood as their lifestyle needs change. A mix of single-family, duplex, and multiplex housing blend seamlessly with each other and are within walking distance to restaurants, coffee shops, small grocery stores, transit, and schools.
Today Vision
“We love the azaleas and oak trees throughout our neighborhood”
“We don’t want to harm the character of our neighborhood.”
“There are many historic homes throughout Bartow.”
“We need more housing in Bartow.”
“No more ‘cookie-cutter’ homes.”
“We need more flexible lot size requirements.”
“Many blocks lack sidewalks.”
“I like walking to the park.”
“We need to support the CRA’s efforts to build affordable housing on infill lots.”
“I want to be able to age in this neighborhood rather than go to a retirement home.”
Urban neighborhoods are exciting places to live, providing quiet comfort within walkable distances to schools, parks, and commercial activity areas. Preserving tree canopy, both along public streets and within private lots, is a high priority as trees help soften and blend a variety of housing types. The size, scale, and architecture of new duplex, triplex, and quadplex buildings support more households while harmonizing with existing single-family units.
Flexible zoning requirements within urban neighborhoods enable infill developers to build housing types distinct from the large-tract builders we see in greenfield areas. These infill developers tend to be smaller and more local relative to the national builders.
Fees and tax revenues from new infill development supports public infrastructure maintenance and improvements, such as new sidewalks, parks, and water/sewer systems.
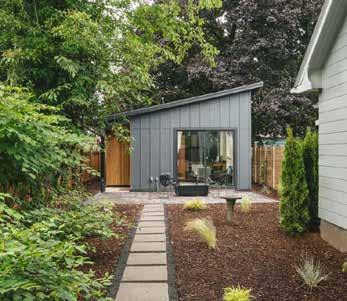
CRA and other local partnerships help build a significant stock of housing, including accessory dwelling units (a.k.a. mother-in-law cottages), which help people afford living in the neighborhood for as long as they wish.
Urban Neighborhood
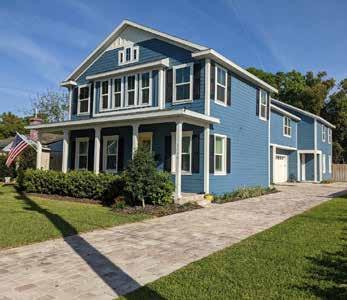
Suburban Neighborhoods
Suburban neighborhoods are located further from city amenities but offer greater private space and room for larger families. These areas have marginal capacity to add density, limited to new accessory dwellings and duplexes.
“We don’t want to harm the character of our neighborhood.”
“There are many historic homes throughout Bartow.”
“We need a variety of housing options.”
Suburban neighborhoods are less likely to experience signficant redevelopment over long periods of time.
Suburban neighbrhoods offer single-family, duplex, and accessory dwelling units that can accommodate households of varying size. Architecture complements exisiting character.
Today Vision
Suburban Neighborhood
Tree canopy & large lawns
Suburban duplex
Shared open-space
Accessory Dwelling
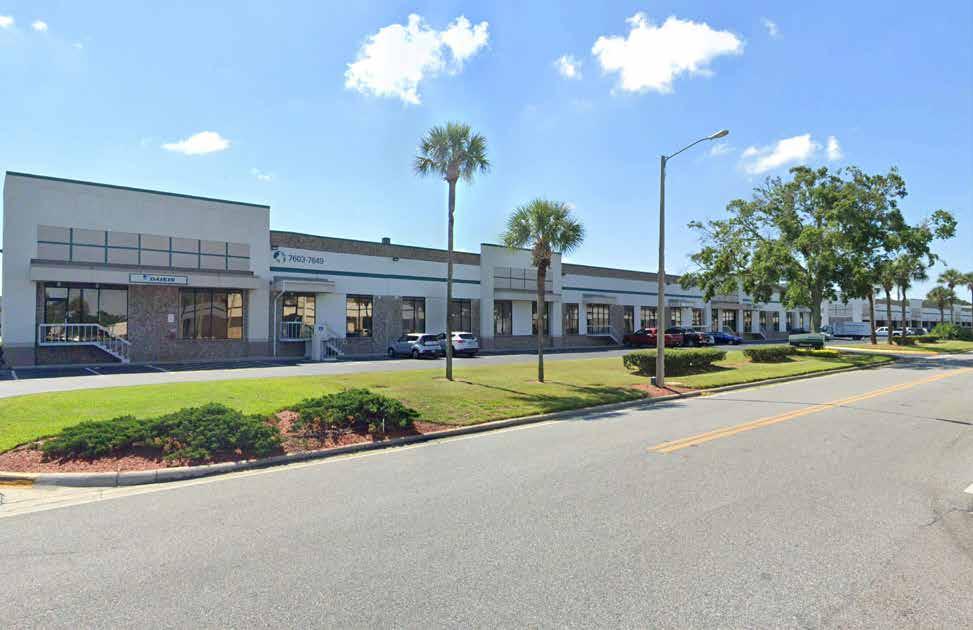
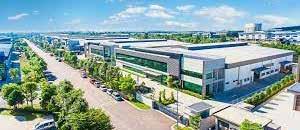
Workplace
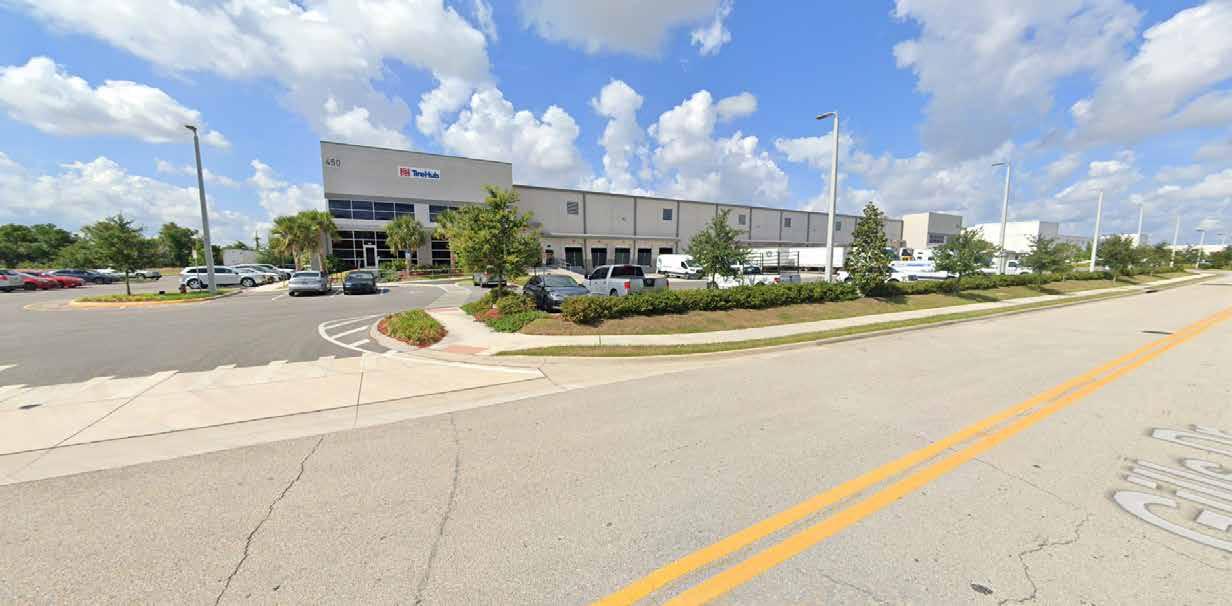
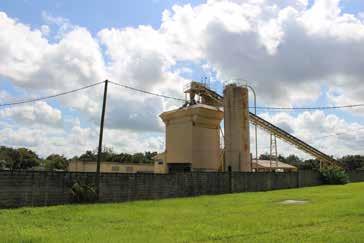
Workplaces support the needs of industrial businesses in Bartow by providing warehousing, freight/distribution access, and other non-residential uses.
Today Vision
“We need to pursue opportunites to swap industrial lands to allow for redevelopment in the city.“
“We want to attract new industries to Bartow - including tech and eSport enterprises.”
Workplace uses slowly consolidate into key areas with access to state highways and CSX railways; making room for redevelopment within the traditional city.
Modern workplace building stock provides a flexible, scaleable platform for new industries to emerge in Bartow.
Workplace
Heavy streetscape buffer
Rear truck parking/distribution
Image capture:
Sidewalk connectivity
Workforce housing
Downtown Core
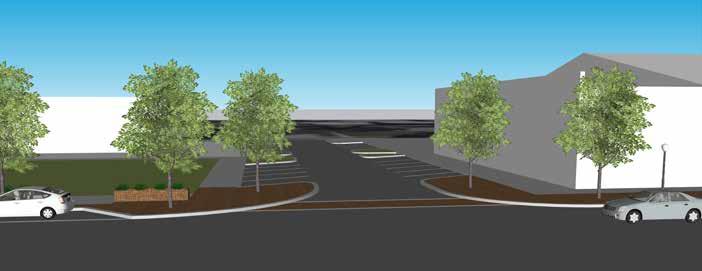
• Prioritize walkability by investing in infrastructure improvements such as curbless streets, street trees, park, and plaza areas.
• Examine opportunities to reduce regulatory barriers that obstruct housing renovation in historic buildings, including parking requirements.
• Partner to provide affordable incubator/accelerator floor area that invites entrepreneurs to lease and test their business models.
Clusters
• Incentivize and require greater walkable connections within Clusters, particularly to and from transit stations.
• Allow higher intensities of housing to locate within Clusters.
• Incorporate public space within Clusters such as plazas and amenitized stormwater ponds.
Corridors
• Partner to improve quality and comfort at transit station shelters.
• Reduce parking requirements but minimize parking allowed between building and street.
• Invest in catalyst sites along Corridors to strategically spark redevelopment (see Chapter 3).
• Allow higher intensities of housing to locate along Corridors (commercial space not required)
Urban Neighborhood
• Expand allowed uses to include multiplex and live/work units, including within historic districts.
• Prioritize development of “missing middle” housing on City/CRA owned properties.
• Require tree preservation / new tree canopy throughout Urban Neighborhoods.
• Prioritize park maintenance and investment within Urban Neighborhoods.
Suburban Neighborhood
• Expand allowed housing types to include accessory dwellings and duplexes.
• Partner to provide greater abundance of street and private yard trees.
• Improve sidewalk connections between Suburban Neighborhoods and park/civic spaces.
Workplace
• Partner to consolidate workplace areas where access to state roads and railways is greatest.
• Partner to connect local institutions and programming with emerging industries.
Greenfield/Rural Development
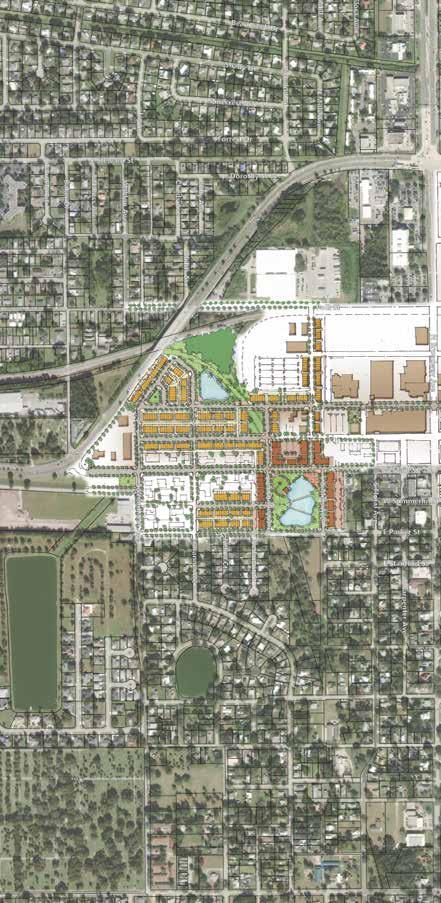
“In-town” Greenfields
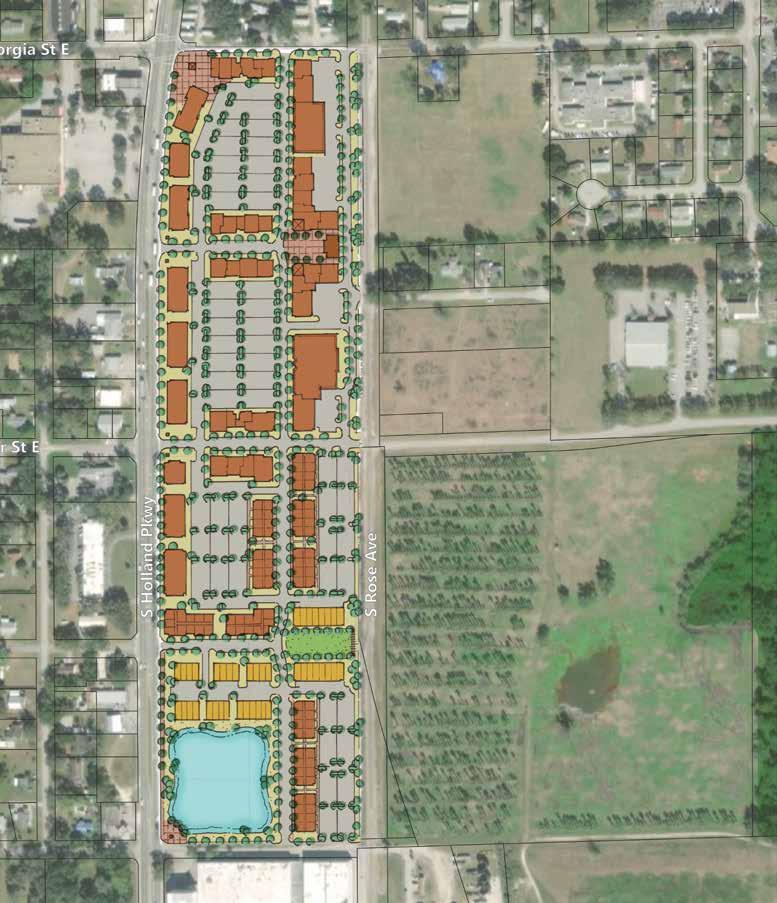
Some does exist close to Bartow’s traditional core. The City has already approved development for these properties, such as Stuart Crossing and the Crystal Springs sector plan. Additional properties along Agricola and South Holland Pkwy offer opportunity for new residential subdivisions however once these lands are developed, remaining greenfield is located beyond a 3-mile radius of City Hall.
“Out-town” Greenfields
Mines and environmentally sensitive lands push potential greenfield development outside of a 3-mile radius from Bartow’s City Hall. Providing services to isolated areas of incorporation can compound the challenge of providing adequate city services to new developments while maintaining quality of service for existing development. These greenfield areas are likely to continue a sprawling pattern of development, generating car congestion rather than supporting walkable neighborhoods connected to public amenities.
Oak Ave Stanford St
Vacant lots near the Downtown Core are prime areas to layer in density to put “people pressure” in support of Downtown activity.
These houses at Standford and Oake Ave represent a size and scale that is compatible with “missing middle” housing types.
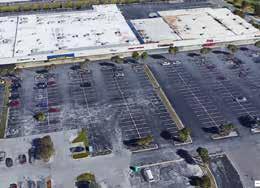
Clusters tend to include large and unsightly parking lots but sidewalks, raised pedestrian crossings, and landscaped seating areas are simple ways to enhance the comfort and character of Clusters.
REGULATORY FRAMEWORK
WHAT ARE LAND USE POLICIES?
BARTOW HOUSING
STRATEGY: REDUCE EXCLUSIONARY CODES
BARTOW WATER
PEACE RIVER WATERSHED
STRATEGY: WATER EFFICIENT LAND USE
BARTOW MOBILITY
STRATEGY: SAFE & CONVENIENT ALTERNATIVES
APPLYING STRATEGIES TO THE CHARACTER AREAS
CHARACTER AREA POLICIES
What are Land Use Policies?
Land use policies exist in response to managing growth.
Land use policy refers to a combination of policies and regulations that influence or determine land development in Bartow. This includes the goals, objectives, and policies described in Bartow’s Comprehensive Plan, the standards and requirements of the land development code, fees assessed for permits, as well as strategic objectives championed by various municipal departments, such as the Community Redevelopment Agency. Effective land use policies help guide and coordinate land development efforts toward a shared vision of Bartow’s future.
Today, Florida state statutes enable jurisdictions, like the City of Bartow, to regulate local land development to “preserve and enhance present advantages; encourage the most appropriate use of land, water, and resources, consistent with the public interest; overcome present handicaps; and deal effectively with future problems that may result from the use and development of land within their jurisdictions.”
This chapter provides strategies and tactics for incorporating land use policies that implement the vision of Bartow Plan.
Growing while maintaining character.
The Community Based Themes, described in Chapter 1, show that Bartow’s stakeholders want to see Bartow grow, and with that growth, more amenities in the downtown and along corridors, improved connectivity between parks and public spaces, and greater housing choice. However, Bartow’s stakeholders also signaled an ardent desire to maintain Bartow’s close-knit community character, the very thing that tends to unravel as a city grows. Bartow Plan’s land use policy framework offers recommendations and concepts that intend to allow city growth while protecting and enhancing the elements that people associate with Bartow’s distinct character.
Character as quality of life.
Character is a subjective notion, with as many interpretations as there are people to interpret it. These interpretations reflect the desires people hold about a place. This might include a need for safety, an expectation for access,
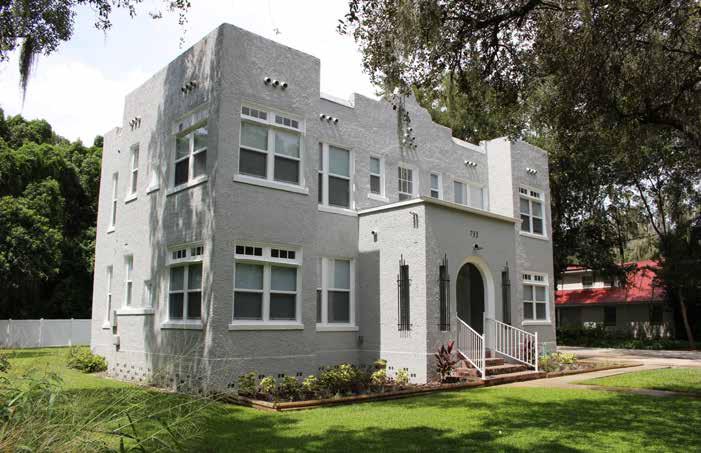
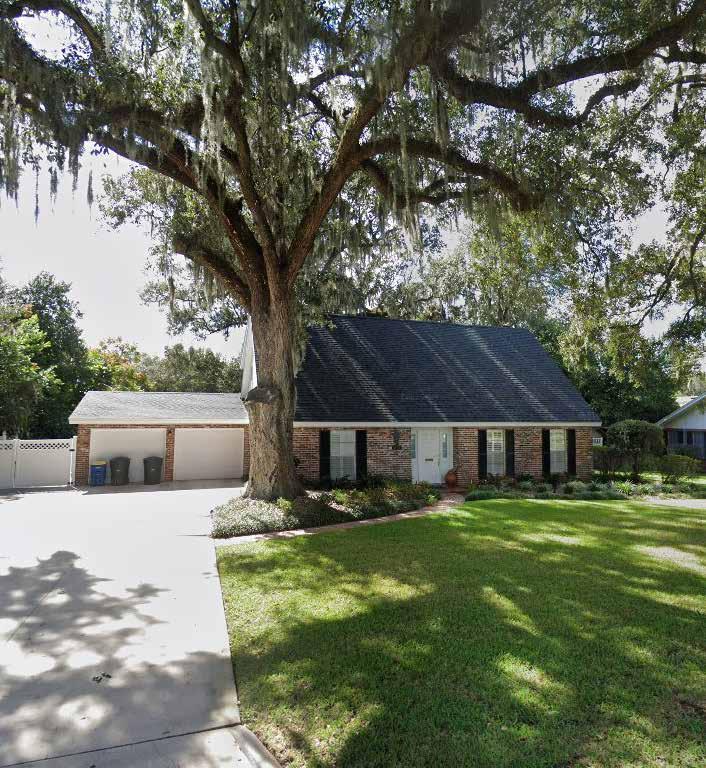
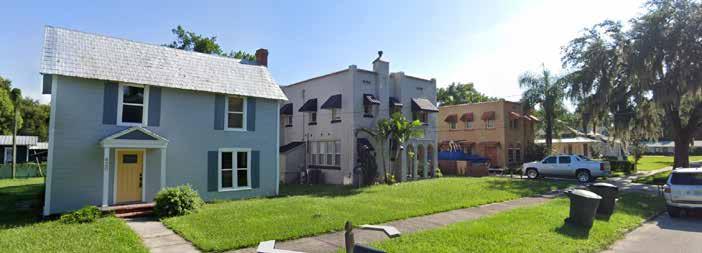
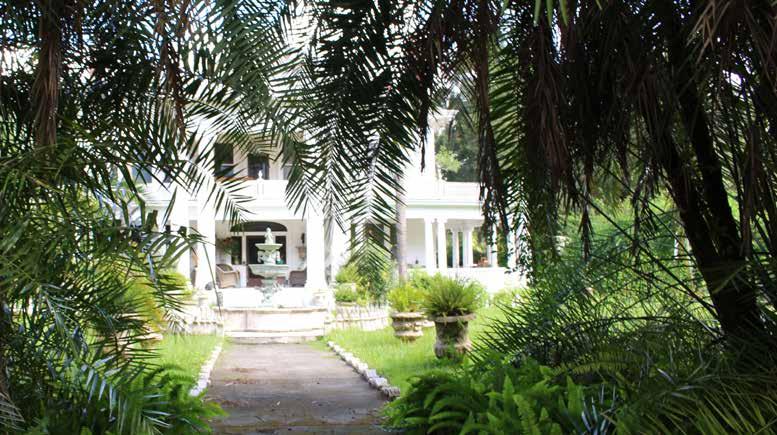
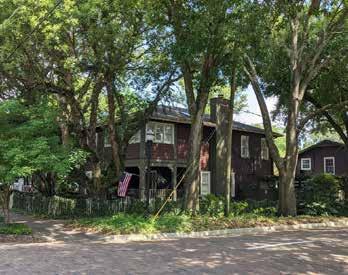
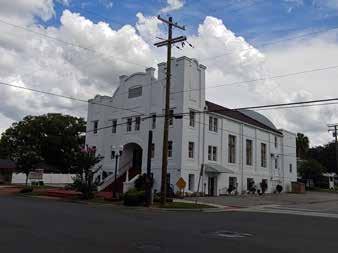
Oaks and Azaleas Character is a subjective notion that is more easily experienced than described. Bartow’s city tagline, “City of Oaks and Azaleas” attempts to describe a community character lush with Florida vegetation. This view of a historic Bartow home shows that the combination of vegetation and built form blends to portray a character that is distinctly Floridian.
and an aspiration for belonging. Cultural, economic, and environmental factors shape our ideas of character in complex ways, but for simplicity’s sake, we can sum up our stakeholder’s desire for community character as a desire for quality of life.
This land use policy framework identifies the three policy areas with the highest likelihood to influence quality of life in Bartow:
1. Housing: safe and affordable housing allows people to call Bartow home.
2. Water: adequate water quality and supply supports the viability of Bartow and reflects its environmental character.
3. Mobility: safe and convenient transportation makes it easy for people to move about their day, accessing work, school, and “third places”.
For each policy area, this section outlines the challenges, strategies, and policy recommendations that will help implement Bartow Plan’s vision.
Bartow Housing
The Challenge We Face
In 2021, Bartow is among the most competitive housing markets in Polk County as the average home listing is pending within five days1. Local real estate agents say that part of Bartow’s distinct appeal is its historic housing stock, much of it built before the mid century, that is affordable relative to nearby markets, at least for now. Home values in Bartow increased 15.8 % between May 2020 and May 2021, faster than Polk County’s increase of 13.6% during the same period2. Zillow predicts that Bartow home values will increase another 10.7% through May 2022. A highly competitive housing markets is a sign that housing demand is outstripping housing supply. This misalignment threatens to stunt economic and social development within Bartow and surrounding areas. Housing is not only necessary for our health and safety it is also supplies the workforce that enables our economy to grow.
A Housing Scarcity Crisis
The COVID-19 global pandemic complicated what was already a historic rise in home values across the U.S. over the last few years. Home values in Bartow increased 10% each year between February 2015 and February 2020, on par with the national average during the same period. The pandemic had the effect of increasing already high housing demand and decreasing already low housing supply.
Factors increasing housing demand
Millennials – Delayed by the 2008 Great Recession and saddled with student debt, Millennials are finally entering the housing market representing about 38% of total home buyers today. Like the Baby Boomers, Millennials are generally looking for safe and affordable housing near their employment, family, and friends but a rise in “remote work” might expand the potential locations that this workforce-aged population is willing to buy in.
2Zillow Home Value Index https://www.zillow.com/bartow-fl/home-values/
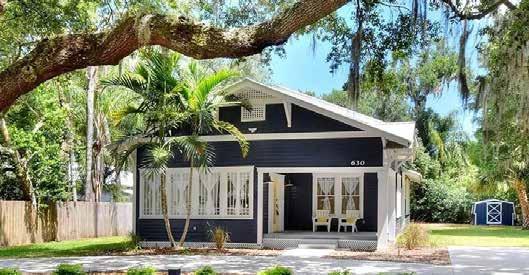
This single family bungalow, built in 1917, was pending sale within two days of listing at $339K (June 2021).
Located on East Pearl Street, the 1,788 square foot unit features 3 bedrooms, 3 bathrooms, and sits on a 0.27 acre lot.
Mortgage Rates – Lower mortgage rates make it cheaper to borrow money for home purchases, playing some role in driving housing demand. Average rates have been falling since 2018, correlating with a significant rise in mortgage applications. Federal Reserve officials have indicated that rate hikes could come in 2023.
Migration – Florida continues to receive new residents as evident by the latest Census figures. Though home values are on the rise, Florida is still affordable relative to other states and Polk County remains more affordable relative to other Florida counties. County-to-County migration data show that over a quarter of new arrivals in Polk between 2014-2018 were moving from neighboring counties (Hillsborough, Orange, Pinellas, etc.).
Factors decreasing housing supply
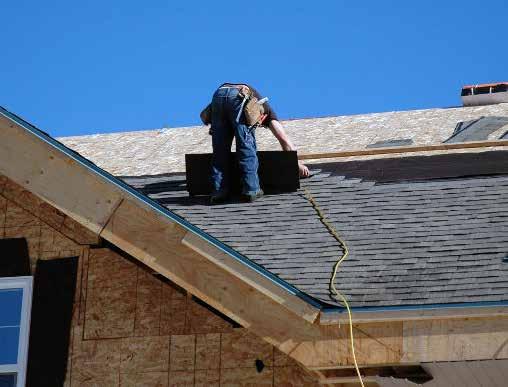
Labor – Home building has been relatively slow since the Great Recession, in part because of a construction labor shortage. According to Federal Reserve Economic Data (FRED), the construction industry lost 1.5 million jobs during the financial crisis. Construction employment was nearing prerecession levels when COVID-19 disruptions hit the reset button on some of those gains. Despite a rise in average wage, contractors report finding skilled labor as a persistent challenge.
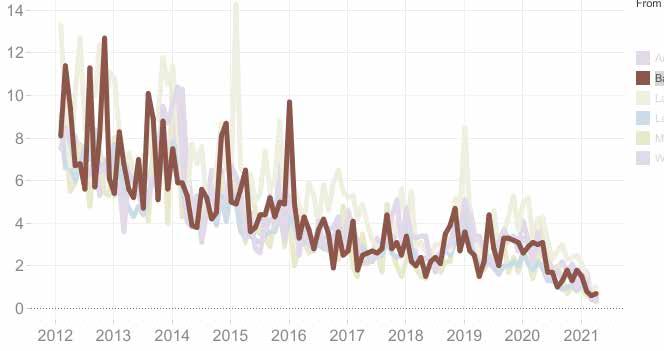
Months of supply
The region’s supply of housing has been dwindling since the start of the economic recovery c. 2011 demand outpaces the availability of new construction and resale.
As of June 2021, there is less than 3 weeks of housing inventory.
Materials – Supply chain disruptions from COVID-19 resulted in surging prices for softwood lumber, up some 83% year over year in March 20213. The National Association of Home Builders reports that increased lumber costs added about $36,000 to the average price of a new singlefamily home. Overall, common construction materials costs increased 14% year over year in March 2021.
Land – Developable land in and around major metropolitan areas, where jobs are located, is increasingly scarce. Workers are willing commute up to 30-minutes, one way, from their homes to work each day. Limited public transportation and congestion play a role in further narrowing the range of land within a labor market. In Bartow’s case, environmental and mining industry-owned lands act as a de-facto growth boundary around Bartow’s core, further limiting availability of land for housing.
Regulation – Zoning laws curb housing supply by adding cost and complexity to building. These laws intend to protect the health and safety of residents but became increasingly exclusionary throughout the 20th Century by prohibiting non-single-family housing types. Demographic changes over the last 50 years demand a greater variety of housing types in Bartow.
Strategy: Reduce Exclusionary Codes
Overview
Of the factors that are constraining housing supply, the City of Bartow is best suited to influence land development regulations. There is nothing inherently wrong with today’s code or its interpretation and implementation; it is a democratically established legal framework for exercising Bartow’s City Charter. Having said that, it is important to understand that today’s zoning code influences the supply and affordability of local housing in Bartow. Recognizing how development codes effects local housing will help us understand the changes we need to make to balance housing supply with neighborhood character.
Exclusionary codes have the effect of inhibiting or outright barring housing options that would otherwise exist by popular demand. SingleFamily Zoning is the quintessential example of an exclusionary zoning practice because it makes illegal the development of any housing type other than single unit detached homes.
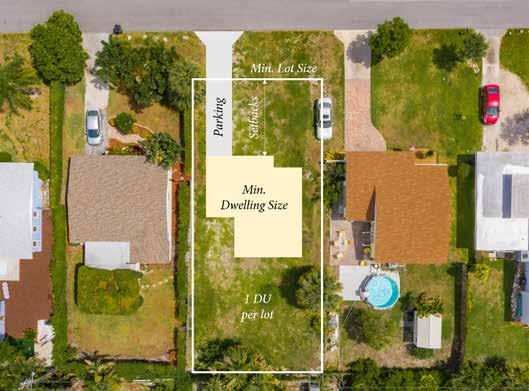
Other exclusionary zoning policies include minimum lot size requirements, minimum dwelling size requirements, minimum parking requirements, and minimum setback requirements. These regulations work in concert to force a housing product that is often larger and more costly than what the market would otherwise demand.
Reduce or remove minimum requirements for lot size, dwelling size, and parking.
Minimum development standards for lot size, dwelling size, and parking significantly limit the
efficient use of land for the purpose of housing. These codes do not protect human health and safety but dictate low density and car-oriented development.
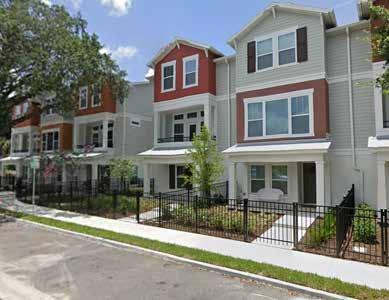
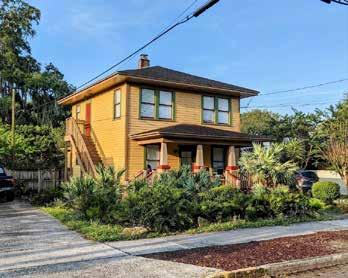
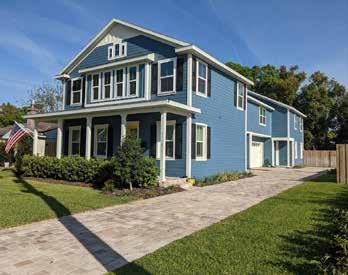
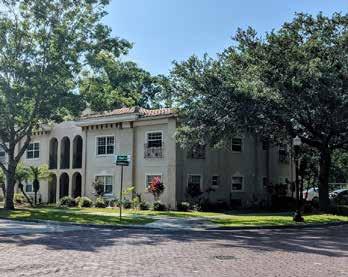
Restore “missing middle” housing.
Before the mid-20th Century, Bartow’s housing stock included a greater variety of housing types that zoning codes have since rendered illegal. Known as the “missing middle” these housing types allow for higher density living while maintaining “human-scale” character. A variety of architectural styles help to blend these types seamlessly into single family neighborhood contexts. Moreover, adjustments to setback and parking requirements can help mitigate the primary pains of higher density, cars.
Bartow’s Typical House
• Single-family units account for 85% of Bartow’s total residential floor area.
• Half of all residential units were built before 1968.
• The median unit size is 1,950 square feet.
• The median lot size is 0.22 acres.
Exclusionary Codes
Bartow’s land development code is very prescriptive in that it dictates the location, type, and size of house.
Remove or reduce minimum lot size and lot width requirements.
Zoning ordinances often justify the use of minimum lot size requirements as a means for ensuring that lots are buildable. Paradoxically, minimum lot size requirements legally render many lots unbuildable, particularly in infill conditions where lots are more likely to have size irregularities or are smaller than the minimum standard. In the case of Bartow, lot size requirements for properties zoned R-2 and R-3 are right-sized for suburban lots, rather than urban infill lots. Bartow Plan recommends either removing minimum lot size and width requirements for residential zones within the walkable core or significantly reduce the requirements. The language used to describe lot size requirements for C-2 districts is suitable to apply to R-2 and R-3: “Development site shall be large enough to accommodate all required setbacks, parking, stormwater management and other standards and facilities.”
Adjust setback requirements.
Setbacks historically played a role in separating buildings to accommodate human waste removal, fire prevention, and access to utilities. In practice, many of these historic rationales are no longer necessary and instead setbacks tend to reflect visual preferences for a specific pattern and frequency of building form. Bartow’s setbacks for zoning districts within the walkable core render a sizable portion of each property unbuildable, making it particularly challenging to develop smaller lots. Moreover, minimum front yard setbacks force buildings off the street, detracting from its relationship to the street and promoting the use of that space for parking. Building forms with stronger relationship to the street make for more walkable public realms.
Allow two-units on all residential properties and four-units within targeted-infill and greenfield contexts, by right.
From lending institutions, to insurance providers, to Florida State statutes, the definition of a singlefamily residence does not only include singleunit buildings, but also includes up to four-unit buildings (or six-unit buildings according to Florida Statutes). Only land development codes have gone so far to narrow the concept of a single-family residence to a building with only one unit. This definition is too onerous and is exacerbating the housing supply crisis.
Bartow should expand the definition of singlefamily buildings to allow, at the least, two-units on all residential zoned properties, and four-units in targeted infill and greenfield contexts. Lending institutions and home insurance providers are already set up to accommodate these property types. Building height, form, and architectural standards will help maintain human-scale character.
The second unit on an already-built single family property is likely to be an accessory dwelling unit (ADU). ADUs are smaller, independent residential dwelling units located on the same lot as a standalone (i.e., detached) single-family home. ADUs go by many different names including accessory apartments, secondary suites, and granny flats. Allowing accessory dwelling units across the city is a straightforward way to increase density without altering the existing character of a neighborhoods.
Allow live-work units in targeted-infill and greenfield contexts.
Live work units refer to buildings or spaces within a building used for business and residential purposes where the residential use by the business owner and/or their family, an employee of the
business, or a tenant is secondary or accessory to the primary use as a place of business. Live work units are an expanded version of home occupations and can include personal service uses, eating and drinking uses, and artisan manufacturing. In practice, live work units have a marginal impact on neighborhood character, particularly within an urban infill context.
Establish garage/parking-location criteria.
It is important to prioritize the presence of buildings, porches, and trees along the public right-of-way to establish a comfortable and aesthetically pleasing public realm. Codes should not allow parking to locate between buildings and public sidewalks, but to the side or rear of the building. Garages and carports facing the primary street should not occupy more than 50% of a building’s principal façade so that living area remains the dominant feature of the building’s face.
Eliminate minimum parking requirements.
Parking requirements inflate the parking supply regardless of parking demand. As a result, many communities have excess supply of parking spaces that needlessly occupy developable land. The city can and should regulate on-street parking but should not encroach on private property rights to regulate off-street parking. Where parking in the right-of-way becomes a problem, the City can employ various parking management solutions.
Examples of “missing middle” housing
Second House
Second House
Front & Back
Bartow Water
The Challenge We Face
Fresh water is a prerequisite of all human habitats so as the Heartland region of Florida faces very real limits to water supply, communities like Bartow must respond to ensure water security and sustainability into the future.
Over the last 150 years, streamflow and lake levels have drastically declined throughout the Peace River Watershed, a sign that the Upper Floridan aquifer water level, Bartow’s main source of water, is also in decline. Agriculture (improved pasture, citrus, row crops, etc.), development (residential, commercial, and industrial), and extraction (primarily phosphate mining) uses are consuming water while also impacting native upland habitats, reducing flows, and degrading water quality.
State statutes provides the Southwest Florida Water Management District (SWFWMD) the authority to manage water supplies to meet existing and future needs through a water use permitting system. In 1992, the SWFWMD created the Southern Water Use Caution Area (SWUCA), including Polk County spurring to action a coordinated management plan to restore water flows to the upper Peace River, among other water resource restoration measures. Permits issued within the SWUCA are subject to a minimum flows and levels recovery strategy which places limits on the total water use authorized by SWFWMD. Included in the SWUCA strategy are a series of ordinances to influence water conservation, including a year-round water conservation and shortage ordinance that allows
the city manager to restrict water use for certain activities, such as lawn irrigation and car washing, during periods of drought.
Water Budget Imbalance
A water budget describes what happens to water entering and leaving a watershed. The components of a water budget include the amount of rainfall; surface water and groundwater flows; the amount of water stored in lakes, wetlands, and aquifers; the amount of water taken up by plants; and the effects of natural conditions such as sunlight, rain, and wind.
The peninsular Florida hydrologic divide, which extends from Cedar Key to New Smyrna Beach, renders the southern half of Florida as an island, hydrologically speaking. Almost no surface or
1. Rainfall
2. Runoff
3. Groundwater inflow
4. Surface water inflow
5. Imported water
6. Evaporation
groundwater flows south of this divide meaning the region is dependent entirely on its own rainfall for freshwater. Water withdrawals that exceed annual rainfall begin negatively impact groundwater levels, leading to the issues that underpin the SWUCA.
The primary reasons for water budget imbalances are high aquifer withdrawals and low acquirer recharge.
High Aquifer Withdrawal
Groundwater withdrawals for mining, agriculture, and public water supply have lowered the potentiometric surface (the rise of water under pressure) of the Floridan aquifer about 30 to 50 feet in the northern Peace River basin. This drop has effectively caused the river to drain into the karstic features in the riverbed between Bartow
7. Transpiration
8. Surface water outflow
9. Groundwater outflow
10. Irrigation
11. Industrial uses
12. Residential uses
13. Waste water outflow
and Homeland. During periods of drought, especially coinciding with the low rainfall spring period, the riverbed goes dry because of losses to the aquifer.
Low Aquifer Recharge & Water Storage
Human activities have drastically altered the Peace River Watershed, first by draining area waters via dredging and canals resulting in a significant loss of water storage capacity. Next, the clearing of upland forests to make way for mining and agriculture has led to soil erosion and loss of biomass, further diminishing storage capacity while increasing stormwater runoff. Finally, as urbanization becomes the dominant factor of watershed alteration, the use of impervious surfaces such as asphalt and concrete physically prevent the infiltration of water to recharge the aquifer.
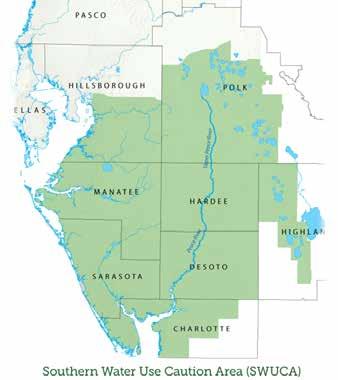
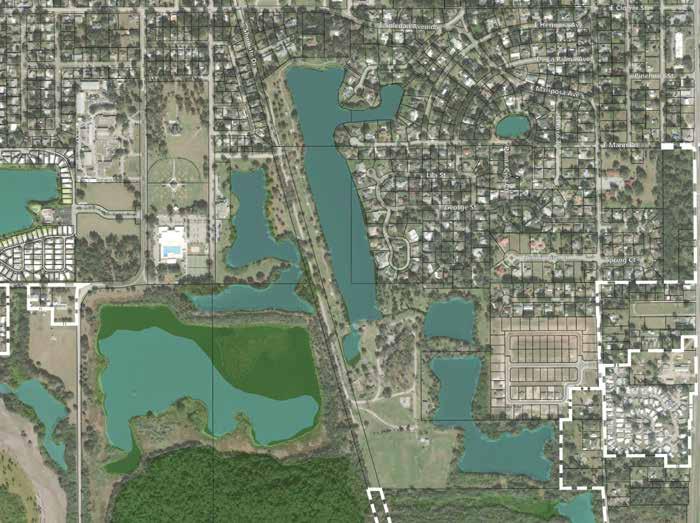
Peace River Watershed
The Peace River Watershed spans 2,334.5 square miles and contains 288 named lakes/ponds, 132 named rivers/streams/canals and 2 named bays/ bayous. Nearly 500,000 people live within the Peace River watershed, and all of them get their water from the Upper Floridan aquifer. However, as this population grows the aquifer’s water level is in decline, making it increasingly costly to access this supply.
Growth along the I-4 corridor accounts for the majority of population increase over the few decades. Housing market data suggests that Bartow and Fort Meade are the edges of urbanization in the short term. 10%
Bartow
Fort Meade
Winter Haven
Arcadia
Wauchula
Strategy: Water Efficient Land Use
Overview
Land development primarily impacts our water resources by replacing the natural environment (such as forests and wetlands) which provide water storage and filtration services with the built environment (such as houses and roads) which generally consume, pollute, and waste water resources. Water efficient land development policy aims to balance and blend the built and natural environments to make the most use and reuse of water.
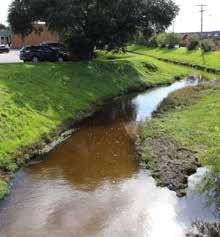
Protect and restore, green infrastructure to increase water storage and aquifer recharge.
It is far more efficient and cost-effective to use the watershed’s natural infrastructure to provide multiple long-term water resource benefits than to restore lost hydrologic function using structural, human-made means. It is essential to preserve and protect whatever is left of the watershed’s existing natural landscape, which help mitigate floods, clean air & water, reduce the urban heat-island effect, and provide places for recreation.
Optimize the urban footprint by reducing land waste and impervious surfaces to decrease stormwater runoff.
Enabling water-efficient land development is as much about eliminating water waste as it is about eliminating land waste. Unfortunately, some land use policies unintentionally waste land (and water) resources by forcing extra land consumption and/ or impairing hydrological function. The following four regulations tend to do this:
1. Regulations that segregate land uses (e.g., single-family zoning) reinforce a sprawling pattern of development.
2. Regulations that prioritize automobile transportation (e.g., minimum parking requirements) inflate the amount of land we cover with pavement and other impervious surfaces.
3. Regulating density (dwellings per acre) forces larger but fewer homes that tend to consume water in greater amounts per capita and generate more fertilizer runoff.
4. Regulation gaps that allow wetland impact credit to occur outside the local watershed are also externalizing the benefits to the local watershed hydrological function.
Compliment investments in stormwater infrastructure with opportunities for recreation and active mobility.
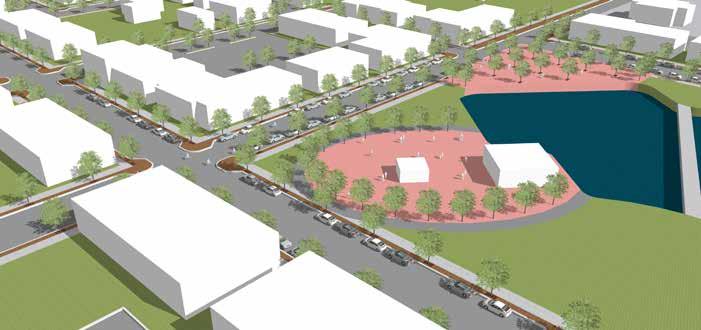
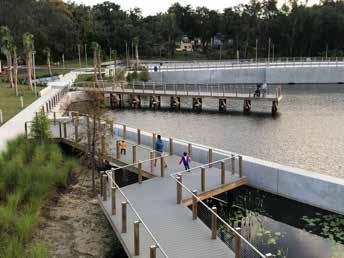
Nature parks, trails, and water bodies are places where people can access the health and recreational benefits of our shared water resources. Expanding park space where aquifer recharge or water storage potential is high can help restore hydrological functions. Investing in safe and equitable access, such as walking and biking trails, to and between these recreation resources magnifies their benefits and supports community awareness and buy-in.
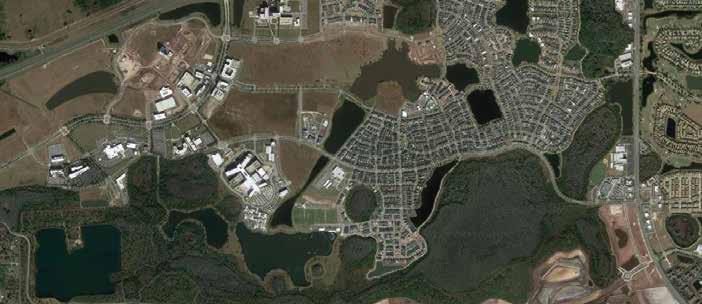
The Southeast Orlando Sector Plan protects a connected network of wetlands and forests. This aerial image of Laureate Park shows how this conservation network interfaces with the residential neighborhood. Trails along the network facilitate access to nature with connections that finger into the neighborhood. Amenitized stormwater facilities interior to the neighborhood also contribute to the recreation network.
Establish a Primary Conservation Network
The ecosystem services we hope to enjoy require maintenance from diverse and balanced wildlife communities. Connected and contiguous conservation lands provide greater quality green infrastructure services than fragmented conservation lands because they facilitate wildlife diversity and movement, factors of habitat resilience. As such, many communities try to preserve large tracts of uplands and wetlands, with corridor connections to achieve higher order ecological functionality.
After a series of intensive planning workshops in the late 1990s, the City of Orlando established the Primary Conservation Network (PCN) for their Southeast Sector Plan, protecting a robust system of wetlands and the upland connections between them. Coupled with the PCN the City created a new Future Land Use designation called Urban Village, which offered landowners a higher degree of development flexibility for their lands outside the PCN. Twenty years later, much of the original PCN designation remains intact, providing critical green infrastructure services for the area. By collocating recreation facilities such as parks and bikeways with the PCN, City officials believe that greater public access and awareness of this critical environmental resource plays a role in the PCN’s continued success.
Bartow could follow in these footsteps, working with developers and landowners to identify the combination of wetlands, floodplains, and the uplands that provide the greatest conservation connectivity. In doing so, Bartow is taking a proactive step to secure the green infrastructure resources that will one day become the source of scenic recreation and enjoyment for future Bartow citizens.
Laureate Park
Primary Conservation Network
Require minimum tree canopy
Increasing tree canopy cover is among the most practical and politically expedient options for providing local green infrastructure. The advantages of growing tree canopy are many and can help define the character of a place, particularly in a city known for their oaks and azaleas.
A tree canopy cover ordinance requires developers to include a minimum amount of tree canopy coverage per site or development. There are a variety of options for drafting these ordinances such as setting canopy minimums by percentage or area, specifying requirements for residential, commercial, and/or industrial uses, or differentiating the requirement based on lot or development sizes.
City of Lake Alfred recently updated their land development code to include a minimum tree canopy cover requirement of 30% for all new development. The code defines a “coverage credit” for each type of tree (for instance, live oak trees have a 2,000 square foot credit while souther n magnolias, which are smaller than live oaks at maturity, have a 500 square foot credit). Canopy cover is calculated by dividing the tree canopy coverage credit by the lot area. Street trees within right-of-way are not eligible toward canopy cover credit.
Incorporate Low Impact Design in new street construction
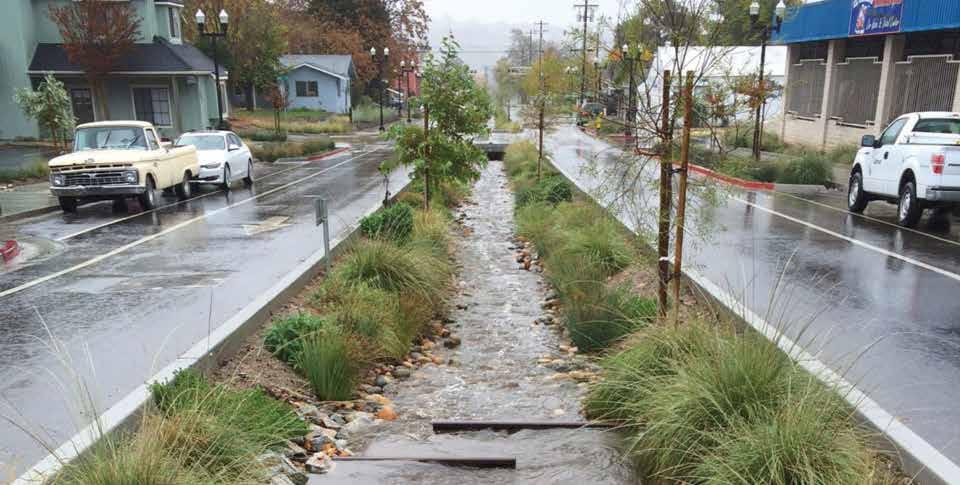
Also known as “green streets,” incorporating low impact design (LID) into the construction of new streets is a way to access the benefits of green infrastructure while supporting a safer and more comfortable public realm.
Typical streets use concrete and asphalt to direct stormwater runoff. The imperviousness of these materials results in higher velocities of runoff that
carry street pollutants into water ways. Green streets use swales, trees, and permeable pavement to slow the flow of stormwater, allowing it to infiltrate into soils and deposit pollutants so that natural bacteria and fungi can decompose them.
Bartow can introduce green street design requirements to their street engineering standards. There are many resources available to help guide the appropriate implementation of standards including the Urban Street Stormwater Guide by NACTO. Numerous Florida cities have examples of green street implementations such as Ft. Myers, Tampa, Orlando, and Gainesville.
Adopt a Parks & Recreation master plan
The City can pursue a comprehensive parks vision that supports a connected parks network within a 10-minute walk of every household. Public investments in multimodal connections between parks and nature spaces will make it easier for people to safely access parks. New and infill development projects can do more to finance parks and natural land expansion as a strategy for long-term property value appreciation. Park design can provide stormwater and/or reclaimed water storage and filtration as well as aquifer recharge where soils and topography permit.
Adopt a One Water master plan
Recognizing Bartow’s aspirations to secure their water supply and steward one of Florida’s most valuable waterways, the Peace River, Bartow Plan recommends that the City of Bartow establish a One Water master plan to guide an integrated water management approach. “One” insinuates that water resources matter to everyone and that our approach to managing this shared resource needs to involve coordination and cooperation across a diverse spectrum of stakeholders - within the city and among the public.
Communities across the nation, including the City of Winter Haven, are pursuing their own One Water master plans, making the shift in their water resource management: from managing water as waste to managing water as resource. Every drop matters for the health of our regional economy, communities, and environment.
Stormwater Median
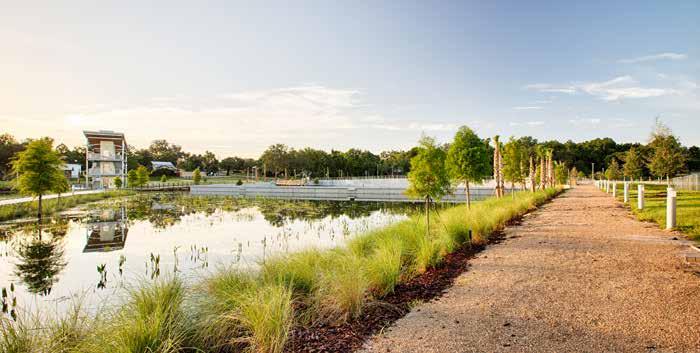
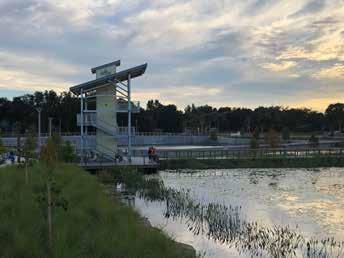
Stormwater Park
Bartow Mobility
The Challenge We Face
Mobility describes the time and cost required by people to move about their city. High mobility (low transport time and costs) enables people access to a greater number of potential jobs as well as the social and cultural destinations that bring richness to their lives. High mobility facilitates efficient matching between workers and employers, leading to higher wages and overall economic vitality. Conversely, low mobility (high transport time and costs) limits the opportunity for employment and erases some of the advantages afforded by urban living such as social exchange and leisure time.
Although mobility is indispensable to the welfare of a city, transportation infrastructure generates costs in the form of congestion pollution, noise, and accidents. These costs can hamper mobility and diminish a city’s quality of life and sense of character. As cities grow, transport systems must
adapt to maintain or enhance mobility. Land use policy plays a significant role in determining the potential mobility of a city and its impacts to city character.
Link between Land Use and Transportation
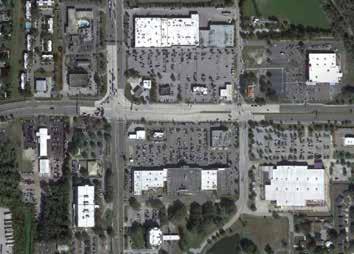
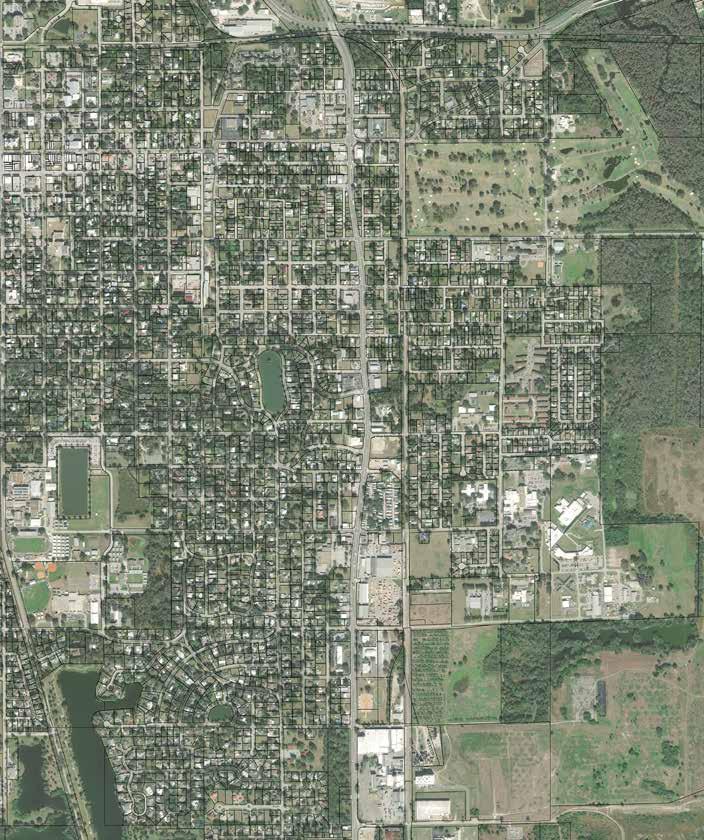
The design and available modes within a transport system influence land use and vice versa. Consider State Road 60, a major east-west route that connects Clearwater and Vero Beach. This route originally ran directly through Bartow’s main street, but engineers later realigned it to bypass along the north side of downtown, in part to remove truck traffic from the city center. Once complete, the center of Bartow’s commercial activity shifted from the downtown, north toward where the SR-60 bypass intersects US-98. The land around this intersection developed into big box retail with design features that reflect a car-oriented transportation system such as large
Downtown Bartow
North Bartow Center
Bikeability & Land Use
The West Orange Trail connects small towns and neighborhoods along a 22-mile off-street bicycle route on the south side of Lake Apopka in Orange County, Florida. Downtown Winter Garden is the trail’s most popular destination offering eating, drinking, retail, residential, and office space, most of which did not exist before the trail. The trail provides thousands of people convenient and fun access to the downtown, and land uses are changing in response, opting to provide more bicycle parking and space for outdoor eating and drinking in place of automobile parking.
parking lots and drive-thru restaurants. This demonstrates that transportation influences land use, enabling the North Bartow Center, and that land use influences transportation in that Downtown land uses precluded the expansion of SR-60, forcing it to bypass the core.
Moreover, transportation networks and land use share a positive feedback loop, meaning that the features of one reinforce the features of the other. In the case of North Bartow Center, car-oriented land uses reinforce the value of the car-oriented transportation network. This relationship encourages other land uses along the extents of the transportation network to also orient around the car, further reinforcing the car-orientation of the transportation network, and so on. A transportation network entrenched with car-oriented land uses makes it challenging for communities trying to diversify their mobility options to include other modes such as walking and bicycling.
Congestion
Congestion threatens the mobility of a growing city, arising when demand for transportation facilities, such as roads, outstrips supply. Congestion is the result of many people making the decision to use the same facility at the same time. This decision depends on many factors, but the price of travel and the availability of alternative options are among the most significant. Congestion is a significant challenge to society and is inevitable in the face of urban growth. Congestion threatens economic productivity by inhibiting mobility while also inducing stress on people, wasting fuel, and increasing environmental pollution. Policies, including land use policies, can help manage congestion by addressing demand for transportation via price mechanisms and supply of transportation by expanding alternative mobility options.
West Orange Bike Trail
Safety
Unfortunately, people make mistakes on roadways that result in property damage, injuries, and fatalities. Traffic related injuries and fatalities are staggeringly high in the U.S. compared to other industrialized countries and Florida is among the deadliest in the nation, particularly for pedestrian. According to the National Association of City Transportation Officials, pedestrian fatalities have been on the rise since 2009. Land development and related policies can help prevent roadway injuries, by addressing systemwide issues that create unsafe conditions.
Unsafe roadway conditions threaten quality of life and detract from the productivity benefits of mobility. Therefore, safety for all transportation users must inform our policies and design decisions. By taking a holistic and systems approach to street design, cities can reduce speeds, build safer streets, and save lives.
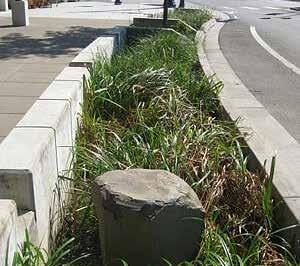
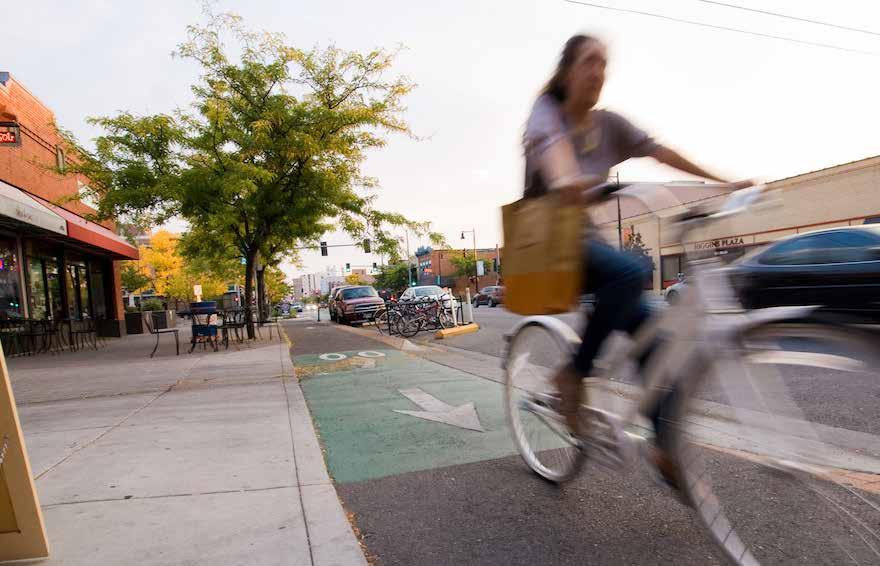
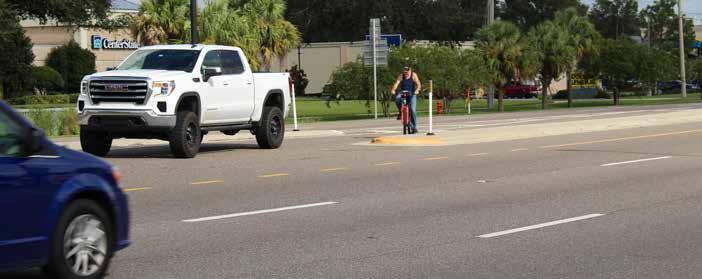
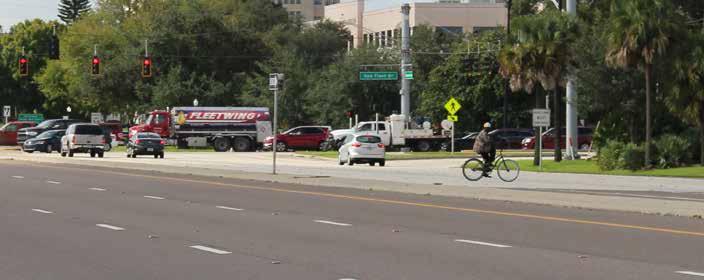
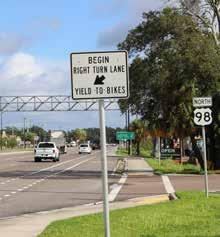
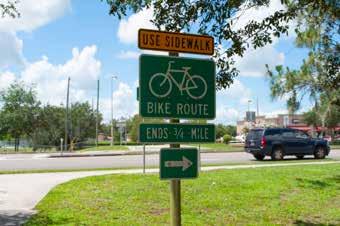
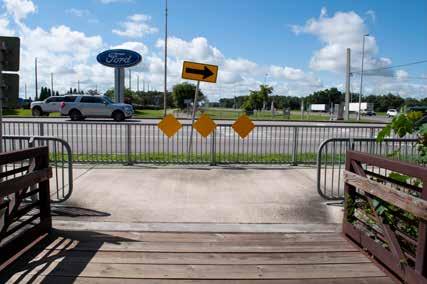
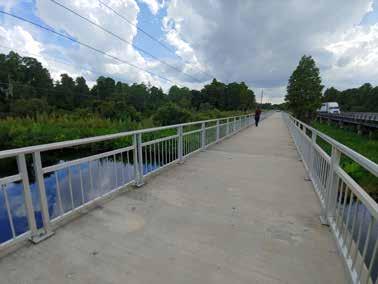
Bicycling in Bartow Bartow has minimal bicycle infrastructure, much of which is inadequate for protecting bicyclists from conflicts with drivers. Lack of protected/ off-street bikeways and street crossings force people to use unsafe alternatives, such as crossing eight lanes of highspeed highway as depicted below.
Let’s move away from this
Strategy: Safe & convenient alternatives
Overview
Bartow is a car-dependent city with an average Walk Score of 28 (out of 100)1. As a car-dependent city, Bartow risks acute vulnerability to congestion, increased environmental degradation, excessive noise, and unsafe travel conditions, all of which detract from quality of life. Bartow’s land use policies can promote safe and convenient alternative mobility infrastructure to diversify.
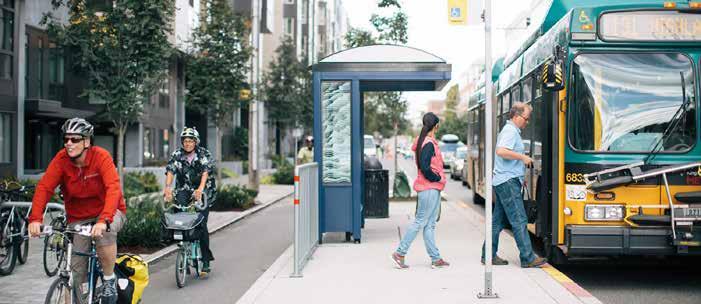
Establish a multimodal transportation network that offers users mobility options beyond car-dependence.
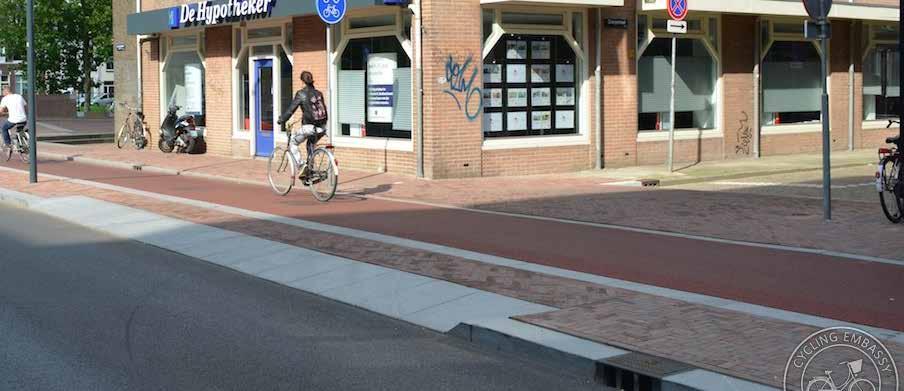
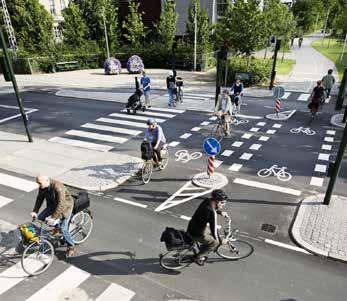
Transportation systems that offer a limited variety of travel modes and/or routes force people to use the same scarce resources. By expanding the options for mobility – such as providing walkway, bikeways, reliable transit, and overall network connectivity – some people will decide alternative modes or routes for their journey. The utility or value of any given mode is dependent on the network associated with that mode. The more destinations connected by roads the more valuable road-based transportation becomes. Likewise, the more destinations connected by bike lanes the more valuable using bicycle transportation becomes. Thus, it is important that the alternative modes come with connected networks.
Design streets and intersections that reduce conflict between different modes by managing speeds and assuring visibility of all users.
Bartow must design streets and intersections to safely accommodate all transportation users. Keeping vehicle speeds low, designing intersections that prioritize pedestrians, and providing facilities that accommodate separation between modes are ways Bartow can keep people safe.
Introduce pricing mechanisms that account for the cost of congestion, starting with parking.
Unlike other public utilities such as water, electricity, and public transit, private users of public roads do not directly pay for their use of the road. Of course, governments build roads using public monies raised through taxes or impact fees, however, in this instance, taxation is an indirect, rather than a direct cost and does little or nothing to influence the decision of a driver to congest a road. As the transportation mode that connects the most destinations in Florida, personal vehicle travel is the preferred mode by most people. However, their direct cost to drive does not include the costs they impose on society by congesting a road. This externalized cost induces people to consume vehicle travel beyond what they naturally would if they incurred the cost of their own congestion.
Prices are an informational tool that signals a relationship between supply and demand. As the demand for a good increase and/or supply decreases, the price of that good will rise and people will consume less of it.
1Bartow Walk Score https://www.walkscore.com/FL/Bartow
Establish multimodal network requirements based on speed.
Transportation networks become more useful as the number of connected destinations, potential routes, and mode options increases. New development in Bartow should help grow a multimodal transportation network that accommodates walking, bicycling, public transit, and automobiles with the goal of ensuring safety and comfort for all network users.
A multimodal network should establish a hierarchy of modes in which bicycling takes precedent over driving where conflicts arise, and walking takes precedent over bicycling and driving where conflicts arise. No pedestrian should feel vulnerable to injury while moving about Bartow on foot. All buildings in the city should have direct access to the walkway network.
In addition to managing speed based on a hierarchy of modes, a multimodal network should require a minimum level of connectivity. This can be done in a few ways, but the simplest is to specify a maximum perimeter, or “block size”, for each mode.
Walkways. Walkways feature street furniture and greenery that create safe and lively paths for pedestrians whether they are trying to get somewhere quickly or just want to stroll through the neighborhood. Walkway blocks should have perimeter distances no greater than 1,320 feet. Walkways are off-street or separated where street design speeds exceed 10 MPH. Uses along walkways should include plazas, seating, park space, and storefronts. Buildings should be human scale and distances. (shared streets can be walkways at 10-15 MPH design speeds). Lighting must support a safe environment. Walkways allow slow bicycling (and other active transport modes).
Bikeways. Bikeways promote comfortable cycling for a range of cyclist age and abilities. Bikeway blocks should have perimeter distances no greater than 2,880 feet. Bikeways are off-street or separated where street design speeds exceed 15-20 MPH (average bike riding speed of commuters). Buildings along walkways can be taller and distances small. Bikeways vehicles should be permitted on Bikeways
Vehicle streets. Vehicle streets accommodate automobiles, including public transit and emergency vehicles. Vehicle blocks should have perimeter distances no greater than 4,440 feet. Vehicle streets should allow for automobile-oriented uses while maintaining safe conditions for all transportation users. Buildings can be taller and more intense but fuel stations (other than electric charge) should still be limited in neighborhood contexts.
Multimodal layering
A multimodal network consists of multiple infrastructure networks that layer over top each other. This overlap is a strength in that it offers users multiple options to move about their city, but it also comes with its share of conflicts. Safe street and intersection design becomes vital for preventing traffic conflicts.
Walkway
Bikeway
Vehicle Street
Shared Street
Specify multimodal street sections.
After establishing multimodal network requirements, Bartow should provide guidance and engineering standards for street sections that demonstrate how to address the hierarchy of modes within a variety of contexts. Street sections can range from shared streets, where all modes mix at very slow speeds, to major thoroughfares where walkways, bikeways, automobiles all have separate facilities.
Multimodal streets coupled with safe and efficient intersections, such as roundabouts, can move more people per hour, while also enhancing the character experience of the public realm.
Along major corridors and main street:
• Walkways should be wide enough to allow families to walk side-by-side while not impeding other pedestrians.
• Bikeways (one-way both sides of the street) should be wide enough to allow two people to bike side-by-side while not impeding other bicyclists from riding by.
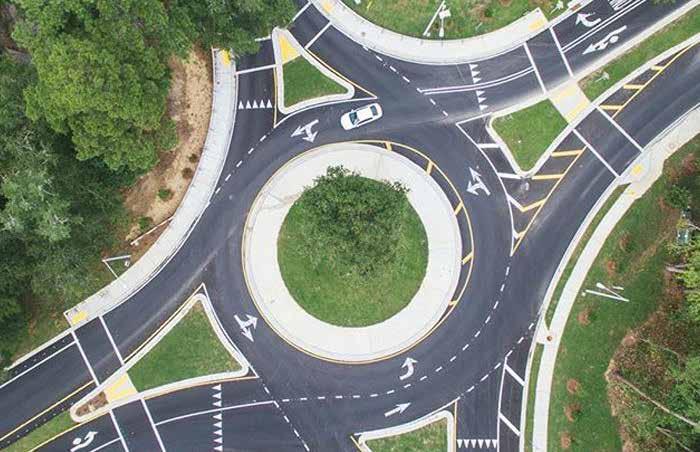
Build roundabouts and other safe and efficient intersections
Well-designed roundabouts are the most safe, efficient, and aesthetically pleasing intersection configurations available1. Roundabouts are safer because they eliminate collision conflict points, particularly the risk for T-bone and head-on collisions, reduce collision impact speeds, and increase visibility of pedestrians and bicyclists. They are efficient because they move a greater number of road users per hour, thus reducing travel times during periods of congestion, and do not require traffic lights which are vulnerable to malfunction due to storm events or other electrical issues. Moreover, roundabouts require less land area and fewer lanes than conventional intersections to achieve the same vehicle throughput. Finally, roundabouts are far more aesthetically pleasing than conventional intersections and offer greater opportunity for incorporating public art and open space into the right-of-way.
Bartow can introduce roundabout design requirements to their street engineering standards. There are many resources available to help guide the appropriate implementation of these standards including the Roundabout Toolkit by the Florida Department of Transportation. Numerous Florida cities have implemented roundabouts such as Sarasota and Gainesville.
Intersections
The name, intersection, insinuates some level of conflict as this is where modes intersect. Intersections need to manage speeds and create space where users are mutually aware of one another.
The image below depicts a roundabout and the diagram on the next page (directly from NACTO’s intersection implementation guide) describes design features that enable visability and speed management..
1 FDOT Educates Central Florida Residents about the Benefits and Safety of Roundabouts (https://tinyurl.com/3nkkxwes)
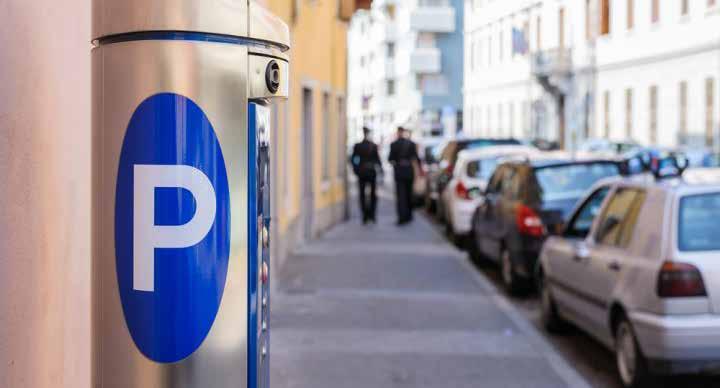
Price on-street parking before adding more parking
At this point in time, it is not practical for Bartow to impose congestion pricing on the use of its public roads. However it is practical and desirable to institute pricing for parking, particularly in areas where maximizing access to urban amenities, such as Bartow’s Downtown, is a goal. On its face, it seems counterintuitive that priced parking would maximize access to urban amenities, but pricing helps deter overconsumption of parking and can help fund multimodal infrastructure improvements, such as bike-friendly amenities, that enable greater access to the district or neighborhood.
People repel at even the notion of paying for parking, but an oft-overlooked fact is that we are all already paying for parking, it is just that the cost is hidden in the price of rent, goods and services, and time spent looking for parking. Unfortunately, hidden and indirect costs obscure the information we need to make rational decisions about the resources we consume.
Moreover, hidden costs tend to enable “free riding” in which non-parking users end up paying for parking users.
Today, on-street and public parking in Bartow is free, though some merchants complain that there is not enough parking supply. It is likely that there is actually an oversupply of parking except at key times of day or days of the week. Rather than increase parking supply, further inducing demand for car-oriented travel, existing parking spaces should increase in price of use, to reflect the dynamic demand for parking. The right price is the lowest price that will leave one or two open spaces on each block, so there will be no parking shortages.
Ultimately, priced parking is a far more costeffective and targeted policy for managing parking compared to requiring off-street parking through the development code. This tool requires a series of steps involving parking studies pricing pilots, and investments in metering technology. Pricing helps offset some of the costs for these implementation steps.
Applying Strategies to the Character Areas
We can use the character area framework as a way to implement many of these land use policy concepts. Moreover, the character area framework can help guide targeted changes to the land development code.
Character area policies use six elements of land development, intensity, form, use, streetscape, frontage, and parking to address the aspects of development most likely to impact the character of a place.
Intensity/density
Regulations that control the amount of building floor area allowed on a property which has implications on expected level of activity and building form.
Form
Regulations that control the form of buildings, including setbacks, height, lot size, lot coverage, and similar restrictions. In many places regulations designed for suburban setbacks and buffers have been applied to downtowns, main streets, and adjacent neighborhoods, reducing the value of existing buildings and properties.
Use
Restrictions on the use of buildings and properties, and the ability to combine multiple uses, both on the parcel and within a single building
Streetscape
Streetscapes are designed according to the intensity of land use through which the street passes. In core and corridors, streetscape design should focus on the success of businesses as much as it might focus on vehicular movement. In
neighborhoods, streetscape design should focus on the safety and comfort of residents ahead of vehicular movement. The design of building facades and yards that face the sidewalk.
Frontage
Frontage quality affects the likelihood that people will walk along a street. This is independent of architectural style. Most issues relating to frontage are regulated to increase vibrancy, which is reflected in the amount of pedestrian activity
Parking
The amount and location of parking. The effects of parking requirements are often underestimated in their ability to improve or detract from the success of downtowns and main streets.
Mobility Network Context
Consider the mobolity facility and its influence on land use and built form.
Walkways. Uses along walkways should include plazas, seating, park space, and storefronts. Buildings should be human scale and distances. (shared streets can be walkways at 10-15 MPH design speeds). Lighting must support a safe environment.
Bikeways. Buildings along walkways can be taller and distances between them small.
Vehicle streets. Vehicle streets should allow for automobile-oriented uses while maintaining safe conditions for all transportation users. Buildings can be taller and more intense but fuel stations (other than electric charge) should still be limited in neighborhood contexts.
Character Area Policies
Downtown Core
Bartow’s Downtown Core represents the historic city center where the greatest diversity of ownership, activity, and available amenities occur. The core should emphasize human scale design and a cozy public realm experience.
• Intensity: Density/intensity regulations are unnecessary within Bartow’s Downtown Core as form, use, and public realm standards are sufficient for regulating appropriate land use compatibility.
• Form: Lot coverage requirements are not necessary within the Downtown Core. The district should encourage green infrastructure, including green roofs, but impervious surface regulations are unnecessary as the district should have a master stormwater system. Minimum “walkable block” sizes help assure that building footprints are human scale. Use and district buffer requirements are not necessary within the Downtown Core (except for parking uses). Building height requirements should allow at least four stories, ideally six for additional flexibility.
• Use: Core should allow commercial, office, lodging, residential, civic (including recreation), institutional, and “artisan” industrial. All Core properties should require a (lean) minimum mix of uses (~10%). The Core should encourage temporary/interim uses to promote activity on vacant lots.
• Parking: Minimum parking requirements are detrimental to the form and efficiency of Bartow’s Downtown Core. Public parking lots and garages should consolidate downtown parking to encourage walkability within the core. Buildings that meet minimum frontage requirements should line lots and garages within the center of the core but are unnecessary for lots and garages at the core’s edges.
Cluster
Clusters are activity destinations outside Bartow’s Downtown Core anchored by commercial and/or institutional uses. Clusters are walkable with a mix of uses and connected by transit.
• Intensity: Floor Area Ratio (FAR) should be the preferred method of measuring residential and commercial density/intensity as units per acre unnecessarily force homogeneity of
• Frontage: A maximum front setback (10 ft) and minimum frontage requirement (70%) promotes a continuous line of buildings that help frame the public realm. Likewise, consider a minimum façade height along Main Street (10 ft) to promote street enclosure without requiring a minimum height which can be economically deleterious. Buildings should have frequent and functioning entries facing onto sidewalks. Architectural treatment requirements should only pertain to ground floor facades and not expand beyond minimum transparency and maximum blank wall requirements.
residential unit sizes. Existing FAR restrictions are too low to enable future redevelopment, consider increasing from 0.5 FAR to 2.0 FAR.
• Form: Lot coverage requirements are not necessary within cluster developments however requiring impervious or open space where master stormwater systems are not feasible should assure proper stormwater management. Minimum “walkable block” sizes help assure that building footprints are human scale. Cluster districts should allow building heights up to 4 stories.
• Use: Clusters should allow commercial, office, lodging, residential, civic, institutional, and “artisan” industrial uses. Requiring a vertical mix of uses is unnecessary but consider requiring a (lean) minimum mix of uses (~10%) across the district. Buffers for uses other than parking within the district are not necessary however district buffers will enable a compatible transition to adjacent districts.
• Frontage: Frontage: A maximum front setback (~55 ft allows for single row of parking) and minimum frontage requirement (~20%) promotes a continuous line of buildings that help frame the public realm. Cluster development should require transparency (min 30%) where building faces a sidewalk.
• Parking: Minimum parking requirements are not necessary within Cluster districts however a maximum parking requirement will reduce underutilized parking surface area. Parking should primarily occur behind building form (maximum setbacks help with this).
Corridor
• Corridors support human-scale commercial, service, residential and office uses extending along and oriented to thoroughfares and
collectors, at intensities compatible with adjacent neighborhoods.
• Intensity: Floor Area Ratio (FAR) should be the preferred method of measuring residential and commercial density/intensity as units per acre unnecessarily force homogeneity of residential unit sizes. Existing FAR restrictions are too low to enable future redevelopment, consider increasing from 0.25 FAR to 1.0 FAR.
• Form: Lot coverage requirements are not necessary within Corridor developments however requiring impervious or open space where master stormwater systems are not feasible should assure proper stormwater management. Cluster districts should allow building heights up to 4 stories.
• Use: Corridors should allow commercial, office, lodging, residential, civic, institutional, and “artisan” industrial uses. Requiring a mix of uses is unnecessary. Consider prohibiting drive-thrus or restricting them entirely to the building rear. Buffers for uses other than parking within the district are not necessary however district buffers will enable a compatible transition to adjacent districts.
• Frontage: A maximum front setback (~1020 ft) and minimum frontage requirement (~25%-65%) promotes a continuous line of buildings that help frame the public realm. Buildings should have frequent and functioning entries facing onto sidewalks. Minimum transparency (60%) and maximum blank wall (30 ft) requirements.
• Parking: Minimum parking requirements may be necessary within Corridor developments to assure that parking does not spill into adjacent neighborhoods. Parking must occur behind building form. Corridors require cross-access between all properties and should share parking.
Urban Neighborhood
Urban neighborhoods are small-scale residential areas that are walkable and allow for a variety of housing types as well as a small amount of nonresidential uses.
• Intensity: Floor Area Ratio (FAR) should be the preferred method of measuring residential density/intensity as units per acre unnecessarily force homogeneity of residential unit sizes. Residential FAR should not exceed 0.50. Non-residential uses (other than institutional use) should have an absolute maximum floor area of up to 2,000 square feet (and not to exceed 0.5 FAR for the property).
• Form: Urban neighborhoods substantially reduce minimum lot size requirements. Maximum FAR is sufficient for regulating lot coverage. Urban neighborhoods regulate impervious surface however can allow a blended ISR with master stormwater systems. Urban neighborhoods should require consistent and complete architectural style for all buildings. Urban neighborhoods should allow building heights up to 3 stories.
• Use: Urban neighborhoods should allow residential uses including single-family (attached and detached) and multiplexes (up to 10 units). Non-residential uses and parking lots should have buffer yards when adjacent to residential uses.
• Frontage: A minimum and maximum front setback (~10 to 20 ft) promotes building presence along public realm. Urban neighborhoods should regulate the frequency and width of driveways along primary streets.
• Parking: Consider a very low minimum parking requirement that is based on unit
size. Urban neighborhoods design standards should diminish the presence of garages and carports by requiring minimum living area along primary building face and as well as additional setbacks.
Suburban Neighborhood
Suburban neighborhoods are lower density, car oriented, and do not allow for non-residential uses (except potentially as a conditional use).
• Intensity:“Units per acre” should be the standard measure of residential density (6 du/a).
• Form: Suburban neighborhoods regulate impervious surface on a per-lot basis. Open space and environmental conservation requirements may encourage a cluster development pattern.
• Use: Single family detached are the primary building type. (can consider allowing single family attached and multiplexes with significant buffers to surrounding residential and not to exceed the maximum density – this is particularly the case for cluster developments)
• Frontage: Requires a minimum front setback (20-25 ft). No regulation on garages or driveway frequency (may still have maximum driveway widths and right-of-way).
• Parking: Minimum parking required.
Rural Neighborhood
Rural neighborhoods are the lowest density residential areas (also serve as holding zones for annexations).
• Intensity: “Units per acre” should be the standard measure of residential density (3
du/a).
• Form: Rural neighborhoods allow for an absolute maximum impervious surface area. Open space and environmental conservation requirements may encourage a cluster development pattern.
• Use: Single family detached are the primary building type. (can consider allowing single family attached and multiplexes with significant buffers to surrounding residential and not to exceed the maximum density – this is particularly the case for cluster developments)
• Frontage: Requires a minimum front setback (20-25 ft). No regulation on garages or driveway frequency (may still have maximum driveway widths and right-of-way).
• Parking: Minimum parking required.
ACTION FRAMEWORKS
INTRODUCTION
DOWNTOWN
WEST MAIN
EAST MAIN
NORTH BARTOW CENTER
US 17
MLK JR. CORRIDOR
SOUTH BARTOW
BIKE & PEDESTRIAN NETWORK
FIBER INFRASTRUCTURE
ACTION ITEM LIST
Introduction
As discussed in the previous chapters, the Community Themes and Character Frameworks lay the groundwork for thinking about the future vision for Bartow in light of the potential pressures of growth. That vision will play out in regulatory, infrastructure, economic development, and governance moves by the City to ensure that the desired character of Bartow is preserved and enhanced. This and the following sections will describe in more detail some of the specific outworkings of each of those four aspects.
Here, in the Catalyst Area Plans section, the rubber meets the road in real places that have unique issues and opportunities. For several key areas we will focus on the nuts and bolts of the built environment including infrastructure, parks, public facilities, and redevelopment in critical areas of the City. We refer to these areas as Catalyst Areas since the ideas described within them are meant to spur direct investment from the public and private sector, and stem directly from the vision put forth in the Community Themes and Character Frameworks. The map on the opposite page shows the location of the Catalyst Areas. They include:
1. Downtown
2. West Main
3. East Main
4. North Bartow Center
5. US 17/98 Corridor
6. Martin Luther King Jr. Blvd
7. South Bartow Parks
8. Bike & Pedestrian Network
9. Fiber Infrastructure
The ideas expressed in these Catalyst Areas range from as small as simple wall murals, all the way to huge stormwater infrastructure projects. For now, they are just ideas, and many of them will require significantly more vetting before they can move forward. Not all the ideas in these plans will take hold and the ones that do won’t be done right away. Some projects will play out over a number years and will take significant dedication and funding commitment to see them through. Some will spawn even more and better ideas, and that is truly their purpose – to help Bartow’s citizens and leaders look past the status quo and visualize the potential for what their community could be.
Downtown
Catalyst Area Description
During the Community-Based Themes development process described in Chapter 1, the focused “Strengthening the Downtown” theme emerged as the #2 overall theme; however, closer examination of the other themes shows that the a majority of all specific interventions identified by residents (regardless of the theme) were located in or near the downtown area. While we cannot and do not ignore other important areas of the City and their role in preserving and enhancing its character, it is clear that the downtown will remain a major focus of the City’s efforts for the long term.
Downtown is the governmental, cultural, and historic heart of the City. Though more generally bounded by SR 60 and Parker Street, the main core of downtown is from the railroad tracks in the north, to Floral Avenue in the west, to Oak Street in the east. Since Bartow serves as the County seat for Polk County, here one finds a concentration of County and City government buildings, which are very large, and along with their extensive parking lots, occupy multiple city blocks.
Main Street is the principle retail corridor in downtown featuring many local businesses and restaurants within the historic buildings. Much effort has been made over recent years to improve the pedestrian experience here, including street trees, sidewalks, brick planters, landscaping, and on-street parking. Many of the side streets
between Main Street and Summerlin Street have also received similar streetscape treatments. Main Street is a direct connection to SR 60 in the west and merges onto Flamingo Drive in the east, which also connects to SR 60.
There are other key streets in downtown besides Main Street. Summerlin Street is a slower secondary retail street that parallels Main Street, with great potential, but not a lot of previous attention when it comes to streetscapes. Broadway Avenue is the direct connection to US 98 and the main retail center of the City. It extends south through downtown all the way to Mary Holland Park. Wilson Avenue is a key local facility that parallels Broadway/US 98 through downtown, north to the hospital.
The one park space downtown is Fort Blount Park, an urban plaza adjacent to the County Courthouse. There are no dedicated bike facilities and the Fort Frasier Trail ends north of downtown and does not directly connect to the core.
There are several close-in single family neighborhoods immediately adjacent to the downtown with historic houses, narrow lots, and endearing eclectic architecture.
The Challenge:
Despite its clear strengths, the downtown faces a number of fundamental challenges to its ability to expand beyond its current situation.
The downtown, and Bartow in general, is off the beaten path, so to speak; therefore, competing with other nearby communities with better access
County Courthouse
County Administration
City Hall
Historic Courthouse
Cigar Factory
Fort Frasier Trail
Fort Blount Park
Cement Plant
ROW
to I-4 is a significant hurdle from a tourism or passer-by standpoint. Another significant challenge is the daily importing of thousands of government workers who commute to the City and leave by 5. They don’t linger in Bartow, and thus the downtown businesses are geared towards breakfast and lunch crowds. Evenings and weekends are very quiet in the downtown, as most establishments are closed. Bartow residents have frequently lamented this lack of community-oriented activities downtown.
The Vision:
The vision for the downtown is to create a place that attracts visitors and locals alike and allows them to stay and spend time in multiple experiences while they are here. The downtown will be an attractive and accessible stop for bike riders, automobile riders, and pedestrians alike. We will increase the number of residents within walking distance of downtown to provide a broader and more regular base of users for downtown businesses and amenities. We will provide definitive and positive entrance experiences into downtown. We will be creative in your thinking about the use of our own street ROWs and of adaptive reuse opportunities for properties that will spark interest and provide community gathering places.
Note: Additional detail is paid to the east and west ends of downtown in other character areas.
Design Objectives
• Identify opportunities for park space downtown.
• Enhance pedestrian experiences and community gathering places.
• Connect bike facilities through downtown to the regional network.
• Ensure adequate parking.
Action Items
• Park site acquisition
• Park design and construction
• Pedestrian Mall pilot project
• Pedestrian Mall Phase 1 design and construction
• Summerlin St streetscape improvements
• Wilson St bike path
• Church St bike path
• Smart Meter pilot project
• Interim Use Project
Downtown Gathering Places
A major design objective of the Downtown Catalyst Area is to find new opportunities to improve the pedestrian experience and create new places for people to gather for food, civic activities, and everyday life. Here we present two strategies for accomplishing this objective, one public, and one private.
Public Gathering Places – Pedestrian Mall
A pedestrian mall is a road or section of a road in a downtown that is permanently closed to automobile traffic in order to promote a safe place for pedestrians and premium space for restaurants and retailers. Pedestrian malls are nothing new. Over the last 60 years, hundreds of pedestrian malls have been installed in cities around North America and Europe in an effort to attract attention to their downtowns. Some have succeeded while others have failed. In the last few decades many studies have been conducted regarding the factors that contribute to pedestrian malls’ success or failure and we believe that a compelling case can be made for a successful pedestrian mall in downtown Bartow.
Catalyst Area Plan
There are numerous potential landmines with pedestrian malls if they aren’t done right, as many of the early examples discovered the hard way. Many of the original pedestrian malls were installed on main streets that were critical to the movement of automobiles, and thus made it too difficult for cars to access the downtown. They were also too long, with block sizes that made it intimidating and difficult for pedestrians to traverse. Many of these early cities had the “build it and they will come mentality” and did not take other critical actions to bring pedestrians into the downtown. These areas were already substantially devoid of people and the pedestrians never came. We believe that Bartow can avoid most of these potential pitfalls with a careful implementation strategy.
Before
After
We propose that Bartow explore the possibility of a pedestrian mall on one of several north-south streets in downtown, including: Central Avenue, Florida Avenue, or Hendry Avenue. All three of these examples are side streets, without significant pass-through traffic. They all have small blocks which would make a pedestrian mall more comfortable, accessible, and never far from parking. Beyond this, there are pro’s and con’s to consider for each street.
Central Avenue
Pro’s
In the heart of the downtown core.
• Close to the major County government buildings –within easy walking distance.
• Already has a significant base of retail and restaurants facing the street.
• Anchored by the historic courthouse on the north end.
Con’s
• Portions of the street have already had significant pedestrian investments.
• Would eliminate existing onstreet parking on a critical parking street.
• Not as much potential for future redevelopment along the street.
• Would result in more disruption of businesses during construction.
Florida Avenue
Pro’s
• Greater potential for redevelopment and infill.
• Could integrate with a new park space located at Wilson Avenue and Church Street.
• Less disruption of businesses during construction.
Con’s
• On the fringe of easy walking distance from the major County government buildings.
• Most existing buildings don’t front on Florida Street.
• Several existing government buildings on the street are not likely to redevelop or meaningfully contribute to the pedestrian realm.
• Would eliminate significant existing on-street parking.
Hendry Avenue
Pro’s
• Almost no existing on-street parking to lose.
• Some opportunities for redevelopment and infill.
Con’s
• Much narrower ROW.
• Just outside walking distance from the major County government buildings.
• No existing buildings fronting the street.
How to Help a Pedestrian Mall Succeed
• Design the space to be an interesting and inviting place for pedestrians.
• Include features such as fountains, pavilions, landscape planters, etc.
• Flexible design with the capability of hosting a variety of events.
• Program the space with festivals, markets, and events and coordinate to make it part of larger downtown events.
• Commit to downtown-wide efforts related to infill, residential, and other
• Implement it in stages to allow for experimentation and responding to successes and failures. Start off by just blocking off the street during weekends with temporary bollards. Focus on only one block at a time and don’t try to tackle the whole project at once.
Private Gathering Places – New Life for Old Architecture
In addition to the public gathering places downtown, there are private properties with the potential to function as gathering places that also attract activity. Successful private gathering places make use of existing spaces and structures with unique character and retro architecture to create desirable places. We see potential in one such property downtown - the old gas station at the corner of Main Street and Oak Avenue.
Similar abandoned gas station properties across the country have been repurposed into popular cafes and hang-out spots. These types of projects typically require less capital to open, and small private investments can go a long way. They have generous space for dining and events and are popular with younger demographics. Though they can be highly successful long-term uses, they are also useful as interim uses until higher density redevelopment can occur on the site.
West Main
Catalyst Area Description
To the west of the core of downtown is a transitional area leading to the western intersection of Main Street and SR 60. This area is characterized by light industrial, heavy industrial, and light office/retail uses surrounding the Main Street corridor. To the north of Main Street, wedged between SR 60 and abandoned CSX ROW, is a mobile home park under single ownership. The area has a general character of age, disrepair, and neglect and does not present a desirable first impression of downtown or an effective gateway.
The Challenge:
Presenting a clear and inviting gateway experience into Bartow is of major importance to allowing the downtown to advance to the next level of prosperity; however, the extent to which properties on West Main have deteriorated presents a significant hurdle to this effort. The City must find ways to promote significant redevelopment in this part of downtown and make significant investments in infrastructure and beautification in order to truly be a benefit downtown and not a detriment.
The Vision:
The vision for West Main is to create a strong anchor on this side of downtown featuring new park space, new residential redevelopment, and strong bike/pedestrian connectivity. As an anchor, the area will function as a true gateway that encourages
passersby to turn off SR 60 and venture into downtown. It will also expand residential opportunities within close
Design Objectives
• Provide a positive entrance experience into downtown from the west.
• Locate a public space to anchor the west side of downtown.
• Envision a catalyst opportunity for the cement plant site.
• Connect the regional bike network into downtown.
• Explore redevelopment opportunities for the mobile home park.
Action Items
• Cement Plant acquisition
• CSX ROW acquisition
• Stormwater Park and catchment system design
• ROW acquisition for new road connections
• Main St streetscape improvements
• Church St streetscape improvements and bike path
Cement Plant to Stormwater Park
Ask any Bartowan today, and few would dispute the importance of protecting the headwaters of the Peace River. Ensuring that stormwater runoff is adequately treated is critically important to that end, however, few realize that most of the runoff from the historic Bartow core finds its way directly into the tributaries feeding the Peace River with little or no treatment. Though not an obligation, this is an environmental situation that can and should be addressed, as many towns in Florida like Bartow have done in recent years. Like these towns, Bartow can simultaneously solve the stormwater treatment issues for portions of downtown while also providing high quality open space for residents and visitors.
The mothballed cement plant south of Main Street presents an excellent opportunity for an urban stormwater park, as it sits at a significant low point in the vicinity. If an agreement can be made with the owners to
Catalyst Area Plan
New stormwater park on current cement plant site.
Redevelopment fronting onto the stormwater park.
Redevelopment of current mobile home park.
New bike route into downtown.
New road connections.
CSX ROW converted to green space.
move the cement plant out of downtown and take over the abandoned CSX ROW, the site could be transformed into an environmental and recreational amenity for the downtown and beyond. Not only would it improve the water quality of the Peace River, but it would help provide that anchor that West Main so desperately needs.
3D Perspective of what a stormwater park could look like at this location.
Redevelopment opportunities BikeTrail
The following are photos of Victory Pointe in Clermont, FL. This project, like the one proposed for East Main, treats stormwater from downtown before it enters Lake Minneola. The project was funded by the City of Clermont, the St. Johns River Water Management District, EPA, and FDEP. Not only does it serve a vital environmental purpose, it has also become the centerpiece for festivals, races, and other downtown activities. Victory Point opened in 2018.
MainSt
DudleyAve
Stormwater Park
East Main
Catalyst Area Description
To the east of the downtown core is another transitional area, centered around a distinct jog in Main Street. The area is identified by its older light retail buildings and offices in converted residences. Here, two different grid patterns converge between 1st and 2nd Avenues, creating offset intersections and small, oddly shaped blocks. The most noticeable effect of this convergence is the intersection of Main Street and 2nd Avenue, where the geometry of the streets has created confusing turning movements. Though the City has attempted to make the best of this situation with enhanced landscaping and public art, the intersection still presents a challenging vehicular and pedestrian environment.
Just north of the center of the Catalyst Area is the badly deteriorated “cigar factory”. At one time the cigar factory was the small town version of the larger cigar factories in Tampa and Ybor City, and with its distinctive architecture, anchored the east side of downtown for decades; but now the building is fenced in and boarded up. The City (and the CRA) owns the property and a significant number of other properties in this area and is poised to make transformational changes to this part of Main Street.
The Challenge:
The cigar factory has been a divisive topic between residents of Bartow for a number of
years. Some have argued that the building should be demolished and the site used for new development. Others have fought to save and restore the building as a unique local landmark, worthy of historic preservation. Ever since it acquired the site, the City has held out hope that a public-private partnership could be struck to both save the building and promote economic development on the surrounding property; but after years of inaction, the building has continued to degrade. The damage is so extensive at this point that it is highly unlikely that anyone would be willing to contribute the necessary funds to restore it, if it is possible to save at all. The challenge for this Catalyst Area now is to move beyond the cigar factory issue, and find a way to redevelop that will both knit the neighborhood together, while presenting a positive anchor for the east side of downtown.
The Vision:
This Catalyst Area presents a tremendous opportunity for anchoring the downtown with new residential, park space, and even mixed use. Like the West Main Catalyst area, opportunities for a mix of residential types, including multifamily and townhomes, will increase the market for downtown businesses. Reconfiguring and combining blocks will allow for more developable building sites and realigned road connections. Bringing bike connections across on Church Street and down from the Fort Frasier Trail will make this Catalyst area uniquely accessible within the City. Unlike West Main, the City is well positioned in
East Main to start making these big moves today due to the amount of land it already owns. Early wins here can spur further investment and transformation on the east side of downtown and beyond.
This vision, as articulated, does not contemplate a future for the cigar factory. We recommend that the site be cleared to make way for any number of other uses, from additional residential development to park space. Though it might have been possible at one time to save the building and incorporate it into the broader idea of East Main, that time has passed and the City must move on to new opportunities that await.
Design Objectives
• Provide a positive entrance experience into downtown from the east.
• Provide an anchor for the east side of downtown that compliments the western anchor.
• Reconfigure the intersection of 2nd Avenue and E Main Street to improve legibility and safety.
• Consolidate small and odd-shaped blocks and reposition for redevelopment.
Action Items
• L B Brown Ave intersection study
• L B Brown Ave intersection improvements
• Cigar Factory/East Main Center demo and site prep
• Multi-family RFP
• Public art commissioning
• Main St streetscape improvements
• Church St bike path connection to Ft. Frasier Tr.
• Church St streetscape improvements
Multi-Family Anchor
As in the West Main Catalyst Area, the east side of downtown will benefit greatly from a significant residential anchor. The combination of the Cigar Factory, vacant East Main site, and acquired CSX ROW make for a very efficient site for a multi-family redevelopment project. We envision the development comprised of 3-story, surface parked buildings. Some buildings could incorporate ground floor retail, but we do not envision this as a significant retail hub. As a City-led project, an RFP for a private development partner could be used to ensure the vision for the site is preserved.
Catalyst Area Plan
Church
Redeveloped Cigar Factory site.
Small blocks consolidated between 1st and 2nd Ave.
Multi-family redevelopment.
Corner plaza with art terminating the view along Main Street.
Complicated intersection geometry eliminated and special pavement treatment added to L B Brown Ave.
Residential infill.
Connections to Fort Frasier Trail and bridge over SR 60. Bike route to downtown.
North Bartow Center
Catalyst Area
Description
The North Bartow Center is an important hub for the City, where the majority of the town’s daily shopping, restaurants, and hotels are located. The bulk of the center sits at the intersection of SR 60 and US 98, but it also and extends north on US 98 for half a mile. The current character of the area is highly suburban, with large strip-style retail, big box stores, and outparcels. Though the parcels on the southern end of the center are very large, the further north on US 98, the narrower the parcels become, resulting in smaller and smaller buildings. This northern portion of US 98 also has many more curb cuts due to the parcel sizes, creating an even more dangerous pedestrian environment.
Both SR 60 and US 98 are very large FDOT roads with wide ROWs and significant daily traffic volumes. That combined with the highly suburban built form of the surrounding development, makes for a very unfriendly bike/pedestrian environment. Though there are sidewalks and bike lanes, they are seldom used, and the area does not present a positive entrance experience into the City. It certainly does not reflect the distinctive character of historic Bartow.
The Challenge:
Two of the main challenges for the North Bartow Center are the roads themselves. As SR 60 and US 98 are major FDOT corridors, the City’s ability
to affect change to the roads is limited. If any improvement to the pedestrian environment and the overall character of North Bartow is to be done, it will have to come on the adjacent parcels. The challenge, therefore, will be to allow these parcels to transition and improve over time, according to a thoughtful and well articulated vision for the future.
The Vision:
The vision for the North Bartow Center is a more diverse, human scale place, that better reflects the desired character of the community. This must be done while not compromising its ability to serve as the main retail center for Bartow. This can be accomplished with design standards tailored to incorporate more effective landscaping, signage, circulation, stormwater, and architectural requirements. Piece by piece, as properties and buildings turn over, the center will transition to a much different place.
Design Objectives
• Maximize the redevelopment opportunities for larger aging commercial centers to include a variety of building forms and uses.
• Improve design standards for the smaller retail development on constrained sites.
• Improve the pedestrian environment with enhanced landscape and access requirements.
• Low Impact Design (LID) principles that can have a positive effect on water quality and user experience.
• Treat the canal as an amenity, rather than a barrier.
Action Items
• US 98 design overlay
• Wilson St bike path connection to Ft Frasier Trail
• Bear Creek Beautification
US 17/98
Catalyst Area Description
US 17/98 is a four-lane divided highway with a consistent 85’ in-town ROW and 150’ north of town ROW and speeds that feel much faster than they are. US 17 approaches the city from the northeast and joins with US 98 at the intersection of SR 60. They remain concurrently numbered until Fort Meade. For simplicity, we will refer to it as just US 17.
Like SR 60, the US 17 corridor is a vital transportation artery for the state which happens to pass right through Bartow. The corridor is home to a number of important employers including the Bartow Airport, Central Florida Truss, Pallet One, UF/IFAS Extension Office, Peace River Citrus, and more. Also like SR 60, the road is a major barrier separating neighborhoods and hindering pedestrian and bike movement through the City. Along the entire 7-mile span of the City there are only six pedestrian crossings: Ernest Smith Blvd, SR 60, Main St, Wabash, MLK Jr Blvd, and Georgia St. The span between MLK and Georgia St. is 0.6 miles and there are no crossings south of Georgia.
Major overhead utilities parallel US 17 on the west side, precluding significant shade trees from being planted on that side.
The Challenge:
The corridor’s expression of character undergoes multiple transitions as it traverses the city, from rural, to residential, to commercial, back
to residential, to industrial, then back to rural. Except for a few notable examples, the scale of development within the traditional city is small, with shallow parcels and numerous curb cuts. Through all those transitions in character a few constants remain: disinvestment in adjacent properties, a harsh pedestrian experience, and no sense of place.
The Vision:
The vision is to position the corridor so that redevelopment can incrementally improve the aesthetic of the road, increase pedestrian activity and comfort, and provide for more of the everyday needs of the adjacent neighborhoods. The corridor must also afford the large industrial and institutional users the ability to stay as long as they want, but also capitalize on the opportunity if they chose to relocate. These properties have the ability to catalyze significant change on the corridor and increase opportunities for additional east-west connections across US 17.
Clower
Design Objectives
• Promote better urban design practices along the corridor to improve the pedestrian experience and the City’s overall image.
• Permit the redevelopment of current industrial and institutional sites without compromising their ability to continue operations.
• Continue the city’s grid pattern of streets to the east of US 17 as sites redevelop.
• Increase the number of pedestrian crossings across US 17
Action Items
• Design Overlay
• Citur Mural commissioning to the east of US 17 as sites redevelop.
• Clower St intersection and pedestrian crossing
Catalyst Area Plan
Block size and shape maximizes flexibility for redevelopment. All three options are interchangeable. Mostly commercial/ mixed-use option. Mix of commercial and residential option. Mostly residential option.
Mid-block streets terminate in a public open space.
Central stormwater facility at low point.
New signal and pedestrian crossing at Clower St. Mural opportunity
MLK Jr. Corridor
Catalyst Area Description
The Martin Luther King Jr. Blvd corridor and surrounding neighborhood is a historically African American community and has served as the traditional black main street for decades. The neighborhood was traditionally bounded by Wabash St in the north, Bay St in the south, railroad tracks that paralleled 10th St on the east, and no longer existing rail road tracks that paralleled 2nd Ave on the west. The neighborhood features blocks and lots that are smaller than most of the surrounding neighborhoods. A number of historic black churches are scattered among the blocks and serve as centers of faith and culture in the community. The construction of US 17/98 has significantly eroded the integrity of the neighborhood, dividing the corridor into east and west sections, with properties on the east side suffering the most.
Over the years the neighborhood has slowly declined and lost population. Numerous vacant lots persist, though some blocks have resisted this trend and have remained largely intact. MLK Blvd itself also has a number of vacant lots and struggles to maintain its buildings and tenants. In the past, the City has made efforts to improve the streetscape of MLK Blvd by installing decorative sidewalks, on-street parking, street lights, and street trees. Recently, a Family Dollar was built on the corner of MLK and US 17/98, and although the character and urban design of the site leaves much to be desired, its presence has vastly improved access to basic groceries and every-day needs for the neighborhood.
The Challenge:
The challenge is how to slow and reverse decades of decline and out-migration of residents while being culturally sensitive and avoiding gentrification.
James AME Church
The Vision:
The Vision is to make the right strategic moves that build on previous investments, allow the neighborhood to preserve and celebrate its authentic history and culture, and encourage people to return and invest in the neighborhood. This means, solving any regulatory barriers to infill housing or main street uses in order to bring people and businesses back to the neighborhood. It means introducing culturally sensitive parks, gathering places, and art into the community. It means restoring pride and ownership in the neighborhood and re-establishing trust with the community. Mt. Gilboa Missionary Baptist Church
Design Objectives
• Strategically infill neighborhood-serving retail and residential without endangering the heritage or character of the neighborhood.
• Strengthen the connections of MLK Jr Blvd across US 17/98.
Retail on US 17/98 addressing the street with parking behind.
New plaza/art/memorial.
Mural opportunity.
garden.
South Bartow Parks
Catalyst Area Description
Mary Holland Park and Mosaic Park, two of Bartow’s most iconic park spaces, lie at the southern end of the city. Together, these two parks encompass nearly 100 acres (not including water) and contain significant recreation facilities including the civic center, pool, band shell, library, sport courts, ball fields, playgrounds, skate park, picnic pavilions, dog park, and more. They are the backbone of Bartow’s organized recreation offerings. Yet, despite their literal adjacency, there is not even a sidewalk that connects the two parks. They stand alone as two separate ideas. This one issue is emblematic of even greater issues (and opportunities) that face the parks and South Bartow.
Mary Holland Park is very long and linear with one single entrance and road. All its active uses are tucked away into the most secluded and difficult to access portion of the park. Unless you live in one of the adjacent houses with access to
the pedestrian bridge, automobiles are your only viable option to access these uses. Once there, there is a distinct feeling of isolation and lack of observation, which is the opposite of what a park should have. There should be many “eyes on the park”, as the principles of CPTED have taught for years. The soccer fields, at the most southern tip of the park have significant drainage and engineering issues and are not near parking. This precludes them from being suitable for tournaments, camps, and other events.
Mosaic Park, though not as long or linear as Mary Holland Park, still suffers from similar layout issues. The pool and sport courts are behind the civic center with poor visibility and no relation or connection to the rest of the park. Even the library feels isolated and disconnected. The band shell occupies the most prominent location in either park, and though it is an important community asset, it is seldom used for concerts, much less marketed as a venue.
Both parks have incredible access to water but have made poor use of them. They have essentially hidden the water by programming them with their most passive uses, denying access, or simply ignoring them. The potential for incorporating the water as amenities to both parks is great.
The Challenge:
There is no doubt that these parks are well loved and well used by the community and have been for many years. Aside from their general disrepair and a maintenance backlog that lingers
they each suffer from a number of fundamental flaws that hinder their ability to maximize citizen enjoyment, management efficiency, and general utility. The challenge, therefore, is how to connect and reorganize the two park spaces into a single cohesive park space, that is more accessible, useable, and capable.
The Vision:
The vision is to position the corridor so that redevelopment can incrementally improve the aesthetic of the road, increase pedestrian activity and comfort, and provide for more of the everyday needs of the adjacent neighborhoods. The corridor must also afford the large industrial and
institutional users the ability to stay as long as they want, but also capitalize on the opportunity if they chose to relocate. These properties have the ability to catalyze significant change on the corridor and increase opportunities for additional east-west connections across US 17.
Clower St
Mary Holland Park Rd
Design Objectives
• Link Mosaic Park and Mary Holland Park into one seamless park space.
• Reposition parks to be more efficient and useable.
• Reorient active uses towards the north.
• Allow for better access into the park.
• Put more “eyes on the park”.
Action Items
• Park Master Plan (Mosaic and Mary Holland)
• Phase 1 Park Civil and LA Design
• Phase 1 Construction
• Soccer Fields interim stabilization
• Kissengen connection env/civil investigation
Catalyst Area Plan
Soccer fields relocated from southern end of Mary Holland Park.
Pavilions and playgrounds moved to north end of the park. Stronger linkages between Amenitized peninsula.
New band shell and concert venue.
Greater access to the water Multi-family development opportunity.
Secondary connection to Kissingen Avenue.
Bike & Pedestrian Network
Catalyst Area Description
The last two community catalysts to be discussed are not specific areas like the others, but cover the majority of the City – Trails and Fiber Infrastructure.
On its surface, one might not expect the idea of trails to be particularly important catalysts for communities, but that would be wrong. Trails are increasingly used by communities as a way to provide multiple overlapping benefits whose effects tend to snowball over time, including connectivity, health and wellness, economic development, tourism, as well as recreation. “Trail Towns” has become a nickname for communities (particularly those with destinations along longerdistance trails) who have learned to shift their paradigm and embrace the role of the trail as economic engine and focal point of community life, such as Winter Garden on the West Orange Trail.
The Challenge
When it comes to trails and bike facilities, Bartow is at the very beginning stages of providing any kind of connected system. The only existing facilities are the Fort Frasier Trail, the bike lanes on portions of SR 60 and US 98, and the new trail along Earnest Smith Blvd. There are no trails to City parks, no trails into downtown or any other significant destination, and no trails to schools. The City has identified a number of “future” trails,
such as those found in the City’s comprehensive plan and within the Clear Springs DSAP approvals; however, these future trails have no clear path to implementation. To date, no residential development has occurred within Clear Springs, and thus, no trails have been built. There are also no long-term plans to implement the others elsewhere in the City. The bike/ped bridge over SR 60 remains an FDOT project and is currently being studied, but there is no timetable for construction. The situation on the ground remains very much status quo for trails in Bartow.
The Vision
The Vision for Bartow’s trail system is to create a community feature that is not just a means to an end, but an attraction all its own. The system will be an interconnected network and will link Bartow’s major destinations with the outside world, as well as provide safe routes to parks and schools for residents. The system will be made up of a variety of facility types including off-
Proposed Bike and Pedestrian Network
Existing
Proposed On-street
Proposed
Existing
CONFLICTS
LEGEND 1. Crossing needed at Polk Parkway
Potential enhanced crossing needed
Crossing needed
Crossing needed 5. Enhanced crossing needed over railroad
Enhanced crossing needed
needed
Crossing needed
Crossing
118 Bartow Plan
street trails, bike lanes, and designated shared lanes, as appropriate to accommodate safe travel for all users and abilities. The system will also be well marked with effective wayfinding to enhance usability and encourage users to seek out new destinations. Though Bartow has some catching up to do and some significant hurdles to overcome, we believe that Bartow’s future trail system has the potential to transform everyday life for the community.
Design Objectives
• Connect Bartow’s park spaces with trails and bike facilities
• Connect into and through the heart of downtown
• Connect to the regional bike system
• Provide safe routes to school
• Improve east-west connectivity
• Improve the safety of Bartow’s streets overall
• Enable alternative mobility options
Action Items
• Complete Parks and Rec Master Plan
• Coordinate with FDOT on SR 60 ped bridge project
• Evaluate road restriping projects
Fiber Infrastructure
Building Bartow’s Future
Background
Bartow began installing its own fiber network in the late 1990’s as a way to provide secure connectivity between its electric substations. Soon after this initial effort, the Polk County School Board, which has multiple facilities in and around the City, approached Bartow with a request: Would the City be willing to also provide secure fiber connections for its critical facilities as well? The City agreed, which then made the City a de facto fiber services provider of sorts. Since then, the City has added additional users to its fiber network such as the 911 Center, County Radio, and Bartow Municipal Airport, and has installed over 100 miles of fiber backbone. Because the number of current customers is relatively low, billing for fiber services is processed manually through the City’s Accounting Department. The IT Department provides tech support to existing users, but the calls are few, and there is a moratorium on any new connections.
Building the Future
Fiber is the backbone on which many future technologies are being built. 5G Wireless Internet, smart meters, smart street lighting, and autonomous vehicles are just a few emerging technologies that get lumped into the broader “Smart City” basket; not to mention the basic availability of reliable broadband internet
connectivity for residents and businesses. All these technologies and services will ultimately depend on fiber networks for high-speed connectivity.
These are technologies and services that will be demanded by future residents and employers in Bartow. To maintain County Seat services, attract new residents, and promote economic development, Bartow must not fall behind peer Cities in the region in access to such technologies. Continuing to invest in expansions to the fiber network is one way that Bartow will build the future. Even now, the City is contemplating a pilot project for implementing smart meters in the downtown area. Though a small step forward, the project would go a long way to making Bartow future-ready, as the new fiber installations will be available to accept future technologies.
Existing Fiber Infrastructure
Bartow Plan Implementation
The list below and the map on the previous page call out major implementation projects identified throughout the Bartow Plan process. These projects were drawn from catalyst area plans, public engagement, staff input, and consultant team recommendations. Projects are listed as being either short term (1-2 years out), mid-term (3-5 years out), or long term (+5 years out), to indicate priority, potential availability of funding,
or level of effort.
This list is intended to be flexible, so the priorities and time frames will change as conditions change or opportunities arise. The actual implementation of projects will be influenced by many factors, such as: ROW acquisition, funding availability, land assembly, private development, etc. Also, the list is not all-inclusive. Only major steps and milestones are shown. Many other smaller steps must be taken to bring the larger vision to reality.
5
FISCAL ANALYSIS AND BENCHMARKING
OVERVIEW
Fiscal Assessment & Benchmarking
Overview
In the context of statistical analysis, making comparisons between and among groups or entities (“benchmarking”) generally allows for specific inferences or potential conclusions to be drawn from individual metrics. Benchmarking does not require that groups or entities are identical in every aspect or on every dimension, but only one or two specific attributes. In fact, the many potential differences among groups or entities that share something in common is a main contributor to the process of making inferences or drawing conclusions. The main challenge with selecting “comparable” locations for this type of economic analysis is a result of the many qualitative perceptions that make locations more or less alike. Based on past experience, we initially identify locations using quantitative metrics to include land area, population, density, and population growth.
There are more than 410 cities, towns, and villages in the State of Florida. The vast majority of these local jurisdictions, as expected, represent smaller areas. Only 2.2% or 9 cities in the state have a land area greater than 75 square miles. More than 71% or 292 cities, towns, and villages have land area of less than 10 square miles. Based on multiple analyses and past experience with fiscal and economic impacts, two attributes of cities and towns that have a very strong relationship with governmental revenues and costs are land area (service area) and density (population or housing per sq. mi.). Between
2000 and 2010, the City of Bartow (“City”) more than doubled their land area, from 11.2 square miles to 45.9 square miles, resulting in a reduced gross density. For the purpose of our analysis, the comparables identified below, based on 2018 values, were selected due to similar land area and density to the City within 2000 and 2018, these distinctions were categorized into two tiers. Tier one reflects population, land area and gross density for the City in 2000, prior to the numerous annexations of undeveloped land. Tier two represents 2018 values for the City, compared to other cities of similar land area – these cities represent the potential for what the City may be able to achieve at their current land area of 45.9 square miles.
Source: US Census; GAI. Notes: (1) The City of Bartow represents 2000 (Tier 1) and 2018 (Tier 2) values. (2) Gross Density is measured as 2018 total population per square mile.
The significant findings following our initial benchmark analysis show that the City is spending the greatest amount on gross operating costs per capita of governmental activities compared to the other cities. Our analysis indicates that there is a consistent pattern of gross operating (excluding capital) spending per capita with Public Safety accounting for a majority of total spending. This is evident in the City’s allocation of spending; with
about 38% of their spending on public safety, and an additional 21% on general government, 27% on culture and recreation, and 13% on the physical environment (including transportation and public works). The figure below illustrates the breakdown of gross operating costs per capita of governmental activities for all the benchmark cities in 2018.
2018 Gross Operating Costs per Capita of Governmental Activities
The analysis also examined the consistent pattern between the sources of general revenues used to fund net operating costs. All of the differences in ad valor em contributions are explained either by taxable value per capita or millage rate. The largest differences in funding sources for general revenues comes from the proportion of revenue transferred from business-type activities.
Compared with the other cities, the City has the smallest revenue generated from ad valor em contributions at $139. Whereas, the City has significantly greater revenue generated from business-type transfers. Overall, the City has one of the highest total general revenues per capita of governmental activities, as illustrated in the figure on the following page.
2018 General Revenues per Capita of Governmental Activities
In addition, the City’s gross operating costs per capita of governmental activities decreased by 6% from 2009 to 2018. During this same time frame, the City’s general revenues per capita also decreased by 23%. As a result of this significant decrease in general revenues per capita, largely driven by a decline of 38% in revenue generated from business-type transfers, the City’s total net
revenue loss increased significantly by 1,041%, from a loss of $17 in 2009 to a loss of $194 in 2018. This indicates the City has continuously not been generating enough revenue to cover their operating and capital costs. The figure below illustrates the overall declines in gross operating costs, general revenues per capita, and net revenues within the City from 2009 to 2018.
2018 General Revenues per Capita of Governmental Activities
The analysis also examined the estimated breakeven market value that would be required in order to cover the existing operating and capital costs generated within each comparable city, as illustrated in the figure below. From the benchmark comparables, there appears to be a relatively consistent range of break-even market value between $100,000 to $155,000.
Plant City slightly deviates from this range by having a break-even market value of $168,495. Whereas, the City also slightly deviates from this range by having one of the highest break-even market values compared to the other cities. This indicates that the City would need to achieve approximately $155,816 in market values to cover the costs of their operating and capital costs.
Estimated Break-Even Market Value
The analysis concludes that the City has continued to incur greater operating costs per capita than they have generated from revenues per capita for governmental activities. This has caused the City to require more business-type transfers and/or access reserves in order to cover their operating and capital expenditures. This trend has significantly impacted their net revenue over the last 10 years.
The attached appendix provides additional detailed tables which reflect the summary of various metrics among the comparative set of cities selected utilizing their 2018 Comprehensive Annual Financial Reports.
APPENDIX
EXISTING CONDITIONS TECHNICAL MEMORANDUM
COMMUNITY THEMES SUMMARY
POPULATION PROJECTIONS AND REGIONAL GROWTH OPPORTUNITIES
FISCAL ASSESSMENT AND BENCHMARKING
Fiscal Assessment and Benchmarking Appendix
The following detailed tables reflect a summary of various metrics among the comparative set of cities selected utilizing their 2018 Comprehensive Annual Financial Reports.
Gross Operating Costs (2018)
There appears to be a consistent pattern of gross operating (excluding capital) spending per capita with Public Safety accounting for a majority of total spending. The City spends approximately 38% on public safety; and an additional 21% on general government, 27% on culture and recreation, and 13% on the physical environment (including transportation and public works). Compared with the other cities, the City has the greatest gross operating costs per capita of governmental activities.
2018 Gross Operating Costs per Capita of Governmental Activities
Notes:
General Revenues per Capita (2018)
There is a consistent pattern of sources of general revenues used to fund net operating costs. All of the differences in ad valorem contributions are explained either by taxable value per capita or millage rate. The largest differences in funding sources for general revenues comes from the proportion of revenue transferred from Business-type activities. Compared with the other cities, the City has the third greatest total general revenues per capita of governmental activities, driven significantly by business-type transfers. The City also has the smallest revenues per capita driven by ad valorem contributions. 2
Net Revenues (2009-2018)
activities decreased by 6% and their general revenues per capita also decreased by 23%. Subsequently, increasing their total net revenue loss significantly by 1,041% from 2009 to 2018. It is important to note that public safety expenses and general revenue collected from other taxes and fees were the only two categories to increase over this time period. 3
Total Taxable Value per Gross Acre (2019)
There is a consistent pattern in the proportion of taxable value per gross acre, however, there are some measurable differences between the amount of taxable value derived from residential uses. The City has a considerably lower taxable value per gross acre, this may be due to the significant amount of undeveloped land area following the annexations between 2000 to 2010. Land area classified as agriculture, which comprises approximately 70% of the total land area within the City, typically includes a smaller amount of taxable value relative to land area then other land uses. Therefore, resulting in a taxable value per gross acre of $22,010. If we were to exclude agriculture land use from this analysis, the taxable value per gross acre would be approximately $72,662.
Notes: Ranked highest to lowest in terms of value
Taxable Value per Developed Acre (2019)
The measurable differences in taxable value per acre remains when considering only developed acres. The City has a considerably lower taxable value per developed acre compared to the other cities, this may be due to the significant amount of undeveloped land area following the annexations between 2000 to 2010. In addition, taxable value per single-family unit is relatively consistent ranging between approximately $60,000-$100,000, with the City also having the lowest taxable value per single-family unit.
Total Taxable Value per Developed Acre and Value per Single-Family Unit
Notes:
Net Single-Family Development (2019)
Net Density is measured as total single-family housing units per acre. There appears to be a consistent pattern in net density within single-family housing developments ranging between 3.3-3.5. However, the City of Crestview deviates from this relationship with the lowest net density of 2.9. Whereas, the City of Winter Haven has the highest net density of 4.0. In addition, the City of Deltona has a similar net density to the City of Bartow, but has a significantly greater amount of single-family housing units and total acres. Compared to the other cities, the City has the smallest amount of acres and total single-family housing units.
Single-Family Housing by Year Built (2019)
There is a consistent pattern in development of single-family housing. Generally, the majority of single-family units were built pre-1999 with the smallest average living area. In addition, the current market is typically developing larger single-family housing units resulting in increases in market values per unit exceeding inflationary increases. Within the City, approximately 74% of the single-family housing units were built prior to 1999, 14% were built between 1999 and 2008, and 11% were built between 2009 and 2018. The City appears to have one of the smallest amount of total single-family units built between 2009 to 2018 as compared to the other cities. In addition, the units between 2009 to 2018 within the City has the largest average living area per single-family unit.
Total Single-Family Units by Year Built
Notes: Ranked highest to lowest in terms of total single-family units built in 2009-2018.
Average Living Area of Single-Family Housing
Notes: Ranked highest to lowest in terms of average living area of single-family units built in
Average Market Value of Single-family Housing
Taxable Value of Single-Family Housing by Year Built (2019)
The measurable differences in taxable value per acre remains when considering only developed acres. The City has a considerably lower taxable value per developed acre compared to the other cities, this may be due to the significant amount of undeveloped land area following the annexations between 2000 to 2010. In addition, taxable value per single-family unit is relatively consistent ranging between approximately $60,000-$100,000, with the City also having the lowest taxable value per single-family unit.
Average Taxable Value of Single-Family Housing
Notes: Ranked highest to lowest in terms of
Estimated Break-Even Market (2019)
The estimated break-even market value is the required value which must be obtained in order to cover existing operating and capital costs. The break-even market value can be measured by multiplying the household taxes based on persons per household by the residential share of ad valorem taxes, assuming an addition of $50,000 in exemptions. Analyzing the comparable cities, there appears to be a relatively consistent range of break-even market value between $100,000 to $155,000. Plant City slightly deviates from this range by having a break-even market value of $168,495. Whereas, the City of Bartow has the second greatest break-even market value compared to the other cities, indicating that the City would need achieve market values of approximately $155,816 in to break-even on their operating and capital expenditures.
Estimated Break-Even Market Value
Notes: Ranked highest to lowest in terms of break-even market value.
Non-Residential Total Building Area (2019)
There is a consistent pattern in terms of the commercial building area comprising the majority of non-residential total building area. Plant City deviates from this relationship with Industrial encompassing the majority of the non-residential building area. The total building area for non-residential use of all the comparable cities range between 3-6 million square feet, with the City of Winter Haven and Plant City being outliers with greater than 14 million square feet of non-residential building space. The City of Bartow falls between this range with approximately 5.4 million square feet of non-residential building space; with commercial, industrial, and institutional comprising about 47%, 33%, and 20%, respectively.
Non-Residential Total Bldg. Area by Land Use (000s)
Notes: Ranked highest to lowest in terms of total non-residential building space.
Market Value of Non-Residential Property (2019)
There appears to be a consistent pattern between the market value per square feet for commercial, industrial and institutional non-residential land uses. Commercial typically has the greatest market value per square foot, closely followed by institutional. Industrial land uses tend to have a relatively smaller market value per square foot. The City follows this similar pattern with commercial property having the highest market value per square foot over both industrial and institutional uses within the city. In addition, the total market value per square foot of these non-residential land uses fall between a range of $45-$75 per square foot. The City falls on the lower end of this range with approximately $50.76 per square foot of non-residential building area.
Non-Residential Market Value per Sq. Ft.
Non-Residential Taxable Value per Acre (2019)
There is a consistent pattern in the proportion of taxable value per acre, however, there are some measurable differences between the amount of taxable value derived from non-residential uses. Of the benchmark comparables, the taxable value per acre of nonresidential land has a range of $200,000-$350,000. The City falls in the higher end of this range with $292,716 taxable value per acre. In addition, the City also has the second highest percent of taxable value derived from non-residential uses at 40%.