
PROSPECTUS
ACKNOWLEDGMENTS
MAYOR JANE CASTOR
CITY COUNCIL
Guido Maniscalco, District 6 Chairman
Joseph Citro, District 1 At-Large
Charlie Miranda, District 2 At-Large
Lynn Hurtak, District 3 At-Large
Bill Carlson, District 4
Orlando Gudes, District 5
Luis Viera, District 7
CITY OF TAMPA STAFF
Nicole Travis, Administrator for Development and Economic Opportunity
Carole Post, Past Administrator for Development and Economic Opportunity
Ocea Wynn, Administrator for Neighborhood & Community Affairs
Rob Rosner, Director of Economic Opportunity
Natalia Verdina, Communications
Abbye Feeley, Director of Development & Growth Management
Stephen Benson, Director of City Planning
Randy Goers, Retired Director of City Planning
Michelle VanLoan, Real Estate Director
Janelle McGregor, Community Engagement and Partnerships Manager
Marley Wilkes, Director of Strategic Initiatives – Office of the Mayor
Ian Whitney, Associate Director of Government Affairs – Office of the Mayor
Whit Remer, Sustainability and Resilience Officer
Jeremy Rex, Creative Communications Manager
TAMPA BAY ECONOMIC DEVELOPMENT COUNCIL
Craig J. Richard, CEcD, FM, President and CEO
Steve Morey, Senior Vice President, Economic Development
Tony T. Brown, Director of Community Development
VISIT TAMPA BAY
Santiago C. Corrada, President & CEO
Ashley Valentine, National Account Director
Keir Magoulas, Digital Marketing Specialist
EAST TAMPA CRA
Cedric McCray, Manager
Eva Hughes, Office Support Specialist
East Tampa Community Advisory Committee
YBOR CRA
Courtney Orr, Manager
Corine Linbrink, Urban Planner III
Brenda Thrower, Economic Development Specialist
Ybor Community Advisory Committee
Ybor Economic Growth and Mobility Committee
DOWNTOWN, CENTRAL PARK, & TAMPA HEIGHTS CRAs
Jeff Burton, Manager
Mike Callahan, Urban Development Project Coordinator
Central Park Community Advisory Committee
Downtown Community Advisory Committee
Tampa Heights Riverfront Community Advisory Committee
WEST TAMPA & DREW PARK CRAs
Jesus Nino, Manager
Ashlyn Shrewsbury, Economic Development Specialist
Drew Park Community Advisory Committee
West Tampa Community Advisory Committee

PROJECT TEAM
Peter Sechler, Vice President, Director Community Solutions Group
(407) 423-8398

(917) 744-6455


SECTION TWO OPPORTUNITY ZONE PROSPECTUS
SECTION ONE MARKET REPORT
The City of Tampa has invested in creating this Market Report and Prospectus to highlight and promote the City's Opportunity Zones in five defined sub-districts within the Tampa area.
Included in this Market Report section is an overall snapshot of the City, as well as a quick introduction to the five sub-districts; an economic outlook for the U.S. and the State of Florida as of year-to-date 2021; and an overview of the business and employment trends within the City and its five unique sub-districts.
This section also provides a data-driven review of the historic and current market trends occurring within the City and its subdistricts' rental unit, retail, industrial, and office industry sectors; as well as provides concentrated mapping to depict where clusters of specific property uses reside within each unique area.
This section within the overall publication helps the City and interested third parties understand the complex market-driven statistics, performance indicators, and historical trends occurring within Tampa as a whole.


ABOUT THIS MARKET
TAMPA BAY REGION | OVERVIEW
The Tampa Bay Region (“Region”) is located on the west coast of Florida, along the Gulf of Mexico. The region includes parts of Hillsborough County and Pinellas County, as well as the major cities of Tampa, St. Petersburg, Clearwater, and several smaller communities. The region is a densely populated metropolitan area; with 3.1 million people, it is the second-largest after Miami and the thirdfastest growing in Florida. The population is expected to grow in the coming years as well, with recent projections indicating Hillsborough County population could grow up to 30% by 2040. With low unemployment rates, a stable per capita median income, world-class airport, and prominent business, education, technology, and health corridors, the region is an attractive metropolitan area for all generations.
As the economic hub of west central Florida, the City of Tampa’s (“City” or "Tampa") economy is founded on a diverse base that includes tourism, health care, finance, insurance, technology, construction, and maritime industry based out of Port Tampa Bay, Florida's largest port. Its natural beauty, diversified economy, regional assets, and desirable location for residents and tourists alike make it an attractive location for business investment and job creation.
Tampa is experiencing unprecedented growth in both development and population. Outpacing the nation in
job growth, the City saw a 6% increase in job postings between 2015 and 2020. In addition, as the county seat and largest city in Hillsborough County, Tampa is the thirdmost populous city in Florida. Approximately one-third of Hillsborough County's population resides within or in proximity to Tampa.
Tampa is also home to many great neighborhoods and unique districts, ranging from active multi-family communities on the downtown waterfront to more relaxed single-family detached neighborhoods nestled under grand oaks. Current strategies of the City prioritize five distinct areas where many opportunities for dynamic growth and investment, such as Opportunity Zones and Community Redevelopment Areas ("CRAs"), intersect. These areas are described in detail along the following pages.
TAMPA SUB-DISTRICTS
URBAN CORE

Urban Core generally encompasses Downtown, Central Park, and Ybor—areas that continually build the reputation as a high-caliber urban center featuring quality residential, commercial, and recreational assets. Boasting great views of the Downtown skyline and convenient access to Tampa’s urban job center, the Urban

Core is also emerging with new residences, business opportunities, and great recreational amenities. Recent historic building preservation and facade improvement initiatives are helping to ensure that the area’s unique architectural character remains alive and well, and new business ventures are helping to grow the local economy. By blending the incredibly rich cultural history of the neighborhoods within the Urban Core with the best principles of sustainable urban design, rebirth of the distinctive character known to the area is active.
EAST TAMPA

East Tampa is a culturally rich and historically diverse area of Tampa, ideally situated between Downtown, the Port of Tampa, and the University of South Florida—offering convenient access to three interstates and Tampa International Airport. Property values within the East Tampa area have increased more than 60% over the past five years, and the community continues to attract private investment throughout its 7.5-square-mile area. The East Tampa CRA is currently in the process of updating its Strategic Action Plan, which will be complete by year-end 2021. A central component of this Strategic Action Plan includes the leveraging of commercial and industrial resources available along the major corridors of Hillsborough Avenue and Columbus Drive and their connectivity via 40th Street.
WEST TAMPA

West Tampa’s combination of the old and the new, residential and commercial, and easy access to I-275 makes it a prime location for investment. A portion of West Tampa is designated as a National Historic District, with many contributing structures, including cigar factories, African-American churches, city parks, and ethnic clubs as well as a stock of historic homes dating from the late 1900s and early 20th century. The West River redevelopment project and new developments in North Hyde Park illustrate the potential of West Tampa to share in the future economic growth of the Tampa real estate market. West Tampa, by its location between Downtown and West Shore, is a growing competitive factor in the Tampa housing and commercial real estate markets.
Tampa Convention Center, Waterfront View Photo Courtesy of Visit Tampa Bay
DREW PARK/AIRPORT

Drew Park/Airport is located in western Tampa, generally situated between Tampa International Airport and Raymond James Stadium. The neighborhood can be traced back to 1928 when its namesake Drew Field Municipal Airport was officially opened. The neighborhood surrounding Drew Field, now Drew Park, served many military uses during World War II. Since then, it has been the site of residential, industrial, commercial, educational, and other institutional uses. It is also adjacent to the Tampa International Airport, the largest and most heavily used airport in the region.
With its close proximity to Tampa International Airport, Hillsborough Community College, professional sports and recreational facilities, and major employers, Drew Park/ Airport is ideally positioned for private investment. As one of the few remaining areas in Tampa with affordable industrial land and space, the area continues to attract new residents and businesses.
UNIVERSITY AREA

University Area is located on the south side of the University of South Florida Tampa campus in northern Tampa, encompassing Busch Gardens and Adventure Island amusement parks. Located within the larger Uptown District, the University Area contains an mix of retail outlets, residential neighborhoods, and restaurants, with a multitude of medical treatment and research facilities, including H. Lee. Moffitt Cancer Center, AdventHealth, James A. Haley Veterans’ Hospital, and Johnnie B. Byrd, Sr. Alzheimer’s Institute located nearby. Here, diverse industry clusters of technology, health care, education, and entertainment coexist. Busch Boulevard, a major east-west thoroughfare in Tampa, serves many neighborhoods as well as residents in the University Area. Leaders envision making Busch Boulevard an entertainment corridor and hope to see it transformed into fun and enriching businesses that serve both tourists and locals in the community.

AREA MAPS
CITY OF TAMPA

LEGEND
City of Tampa, FL
Urban Core
East Tampa
West Tampa
Drew Park/Airport
University Area
TAMPA SUB-DISTRICTS

LEGEND
City of Tampa, FL
Urban Core
East Tampa
West Tampa
Drew Park/Airport
University Area
ECONOMIC OUTLOOK
U.S. ECONOMIC OUTLOOK | YEAR-TO-DATE 2021
The COVID-19 pandemic (“Great Lockdown”) made 2020 an historic year for the U.S. economy, marking the worst economic downturn in employment and production since the Great Depression. In February 2020, the U.S. economy ended its longest period of expansion since 1945, a consequence of the global response to the COVID-19 pandemic. March 2020 marked the beginning of nationwide stay-at-home orders, following the declaration of a National Emergency, with many states shutting down nonessential businesses to thwart the spread of COVID-19. This resulted in a violent economic downturn, ending 128 months of economic expansion—the longest in U.S. history.
The current business cycle, which began in December 2007, will continue until it has reached the bottom of the current contraction. While this has yet to officially be announced by the National Bureau of Economic Research (“NBER”), most indications show that the U.S. economy effectively began recovering only months after the economic peak. Because a recession is defined as a broad contraction of the U.S. economy, not confined to one sector, NBER emphasizes economy-wide indicators of economic activity when officially recognizing a complete business cycle. In the current situation, the breadth and depth of the Great Lockdown is obvious—the worst economic downturn in employment and production since the Great Depression.
The broadest measure of the U.S. economy, gross domestic product (GDP), grew by 1.6% in the first quarter of 2021, compared with 1.1% in the fourth quarter of last year. On an annualized basis, the first quarter growth rate was 6.4 percent. This growth is largely attributable to the combined impact of a mass vaccination roll-out and federal stimulus payments triggering a surge in consumer spending. The initial optimism and general thinking indicated that total economic output could return to prepandemic levels by summer 2021, as health conditions continue to improve, policy support remains in place, and employment strengthens.
Aided by federal stimulus payments, households held a collective $4.1 trillion in savings in the first quarter of 2021, up from $1.2 trillion before the Great Lockdown
began. This translated into purchases of cars, furniture, and household appliances as well as clothes and food. There was a similar jump in income last year after the first round of federal stimulus payments, as well as an increase in spending on goods. Consumer spending rose 2.6% in the first quarter of 2021, with a 5.4% increase in purchases of goods accounting for most of the growth. Spending on services, which had slumped throughout the Great Lockdown, rose by 1.1%.
While the economy may have turned a corner, the road ahead is long for the millions who remain unemployed. The recovery in U.S. jobs growth remains soft; despite recent gains of 266,000 jobs in April 2021, the labor market is 9.5 million jobs short of the pre-pandemic peak. The unemployment rate has been steadily improving following the 20.5 million jobs lost in April 2020 when the unemployment rate reached 14.7%. The unemployment rate in April 2021 was 6.1%, which is 0.1 percentage points higher than March 2021. More than 1 million new jobs
were created in each of the first three months of 2021, and on a non-seasonally adjusted basis, which has never happened until this particular recovery. As of April 2021, just over 2 million workers were on temporary layoff, less than half the number reported in September 2020.
The economy is still evolving at unprecedented rates and in atypical ways. Both the Consumer Price Index ("CPI") and Producer Price Index ("PPI") have seen increases, with April 2021 CPI rising 0.8% from March 2021 and 4.2% yearover-year, and April 2021 PPI up 0.6% from March 2021 and 6.2% year-over-year. Prices for construction materials in April 2021 jumped 19.7% year-over-year, the largest gain in the 35-year history of the price series. Prices for lumber, copper, and polyvinyl chloride are impacting the housing market. Housing starts fell 9.5% in April 2021 to 1.57 million from March 2021, with single-family housing starts down 13.4%. Inflation remains a concern, as well as whether the upswing in prices is transitory or will become an impediment to long-term economic expansion.
U.S. ECONOMY OUTLOOK | YEAR-OVER-YEAR CHANGE
Sources: Secondary Research; GAI Consultants
MOVING BEYOND 2021
Moving beyond 2021, the primary driver of the expansion will be consumer spending as the economy fully reopens. High and increasing vaccination rates and reduced new COVID-19 case numbers indicate that the reopening process may be complete for much of the country by the end of the summer. Following a robust recovery in 2021, economic growth could reach 3.7% (year-over-year) in 2022, and 2.9% (year-over-year) in 2023. However, the economy remains at least a couple of years away from fully recovering from the Great Lockdown.
A few factors representing a drag on U.S. economic growth include impacts of major disruption in global trade from the Great Lockdown, which are expected to continue; slow productivity growth; constraints on fiscal spending and stimulus; and rising income inequity, which continues to pose a significant challenge on consumers’ perceptions of economic security. During 2020, the U.S. national debt held by the public rose to 100% of GDP for the first time since the end of the Second World War, and the Congressional Budget Office projects that U.S. debt-to-GDP will hold between 101% and 107% through 2031.
Despite the impact of the Great Lockdown on U.S. economic growth through at least 2021, the U.S. economy is fundamentally sound and is expected to continue to grow and build on the most recent, longest economic expansion. Addressing the COVID-19 pandemic with a more proactive approach, along with an expected wider distribution of a vaccine by summer, has provided a better recovery opportunity for certain sectors lagging in recovery, such as food service, travel, and tourism. In addition, continuing growth in technology is expected to provide a boost in productivity and allow the short-term accumulation of national debt burden to be addressed with sound financial and economic policies. The economic response to this recession has aided in the acceleration of several market trends that existed pre-pandemic, many of which are expected to contribute to stronger productivity gains (e.g., logistics and transportation, online retail, remote workforce).

ECONOMIC OUTLOOK
FLORIDA ECONOMIC OUTLOOK | YEAR-TO-DATE 2021
Consistent with the balance of the U.S., the Florida economy lost significant momentum in economic growth beginning in February 2020, falling into recession in March 2020. However, the Florida economy gained momentum at the end of 2020 with the addition of 16,800 jobs in December 2020. This countered the downward trend for the U.S. as a whole, which saw a net loss of 227,000 jobs for the same month.
The Florida economy saw a solid first half of 2021. Florida real GDP grew at a 7.0% annual rate in Q1 and likely gained momentum in Q2 as stimulus boosted household and business spending and domestic travel supported more activity in the Florida’s tourism industry this summer.
Florida’s unemployment rate fell to 5.0% in August 2021, below the 5.2% rate nationally and down 9.2 percentage points from its peak in May 2020. Florida lost over 1.2
million jobs between March and April 2020. Since then, the state has regained over half of the jobs lost (+974,300 jobs). Nine of ten major industries posted positive yearon-year job growth in August 2021; among the strongest gainers were leisure and hospitality (+14.6%), other services (+10.5 %) and information (+8.1%).
The most recently available data on the state’s tourism sector shows that an estimated 31.7 million tourists visited Florida between April 1 and June 30, 2021. This represents a 223.4% increase over the same period in 2020, and is only 2.2% below the second quarter of 2019. Florida saw 30.6 million domestic visitors, a 6% increase over 2019, but only 1.1 million overseas visitors (down 57.9% from 2019). The rebound in leisure tourism has been good news for state finances, as it resulted in a larger-than-expected increase in tax collection. Florida’s
general-revenue collections exceeded expectations by 24% in July 2021. Collections of revenue such as sales taxes were $619.8 million above what state economists projected in April 2021; this was in part due to sales taxes from tourism, which were 32.8% above forecast.
Real estate prices in Florida continue to climb, with median home prices rising at double digit rates for the fourth consecutive month in July 2021. The risk to the housing market is a rising inventory of delinquent mortgages, which could eventually turn into distressed sales as thousands of mortgages exit forbearance. Overall, the Florida economy is charting a path through the clouds. Economic growth is expected at 5.3% for 2021, downshifting marginally to 5.1% and 4.2% in 2022 and 2023, respectively.

Downtown Tampa Development
Photo Courtesy of Visit Tampa Bay
EMPLOYMENT TRENDS
EMPLOYMENT AND BUSINESS ACTIVITY | CITY OF TAMPA
The City of Tampa strives to serve the business interests of both small and large businesses across a broad spectrum of industry sectors. A favorable tax structure, quality infrastructure, development incentives, and a strong labor force are just a few of the features that make Tampa a top choice for business innovation and development.
Over the past couple of years, Tampa has welcomed a number of new and expanding businesses to their community, offering assistance programs such as financial support; small-, women-, and minority-owned business incentives; and partnerships with economic development organizations to attract a robust group of industries to the City. Tampa's major industries include:
Financial and Professional Services
Home to many of the nation’s leading banking, finance, and insurance corporations, Tampa is known as one of Florida’s preferred business destinations, with over 79,000 financial and professional services employees comprising 56% of the County workforce.
Information Technology
Tampa leads the state in high-wage STEM jobs and has also become a hub for IT companies of all shapes and sizes, a budding entrepreneurial scene, and a leader in specialized areas such as cybersecurity and data science. Information sector employees within the City comprise nearly half of the information employees within the County.
Life Sciences and Healthcare
Tampa has emerged as a driving force behind the state’s fast-growing life sciences industry, with more than 3,000 life sciences and healthcare companies employing nearly 92,000 in the County and 42,000 in the City.
Retail and Accommodation Services
As one of Florida's tourist destinations, as well as maintaining a diverse shopping and eating scene, Tampa's fast-growing retail, accommodation, and food service industry employs over 146,000 within the County and 60,000 within the City.
Educational Services
Home to numerous primary and secondary schools, as well as major universities, such as University of South Florida and the University of Tampa, the City's educational services employ nearly 35,300, comprising 81% of the employees within the County.
In the City, professional employment includes the following industry sectors: information; finance and insurance; real estate and leasing; professional services; management of companies; administration, support, and waste management; and educational services. Tampa's largely white collar, or professional, work force comprised nearly
JOBS BY INDUSTRY SECTOR | YEAR END 2019
47% of total employment in 2019, which is consistent with the City's image as a major commercial center.
Overall, approximately 48% of total County jobs are located within the City. In addition, total employment in the County increased 0.5% and decreased in the City by 2.4%, over the prior year, from 2018 to 2019.
It is important to note, the most current employment by sector data provided by the U.S. Census Bureau for Economic Studies for the County and the City is year-end 2019, as represented in the table below.
EMPLOYMENT TRENDS
ANNUAL EMPLOYMENT TRENDS

Over the 10-year-period from 2010 to 2019, total employment within the County and City has grown at a compound annual growth rate ("CAGR") of 2.7% and 2.0%, respectively. During this same time frame, the County has experienced an increase of over 173,000 employees; whereas, the City has experienced an increase of just over 63,000 employees. Currently, the City composes approximately 48% of the total employment within the County, which has seen a slight decline over the last 10year period, from 51% observed in 2010.
INDUSTRY LOCATION QUOTIENT

A location quotient ("LQ") is an analytical statistic that measures how concentrated a particular industry is within an area. The above figure illustrates the concentration of employment by industry sector within the City, as compared to the County for year-end 2019. Transportation and utilities, accommodation and food services, and other services are the industries in which the City and the County are equally specialized (LQ equals 1.0). The City has a higher concentration of industry professionals when LQ is greater than 1.0 and vice versa.
MAJOR EMPLOYERS
As of year-to-date 2021, the City is home to 20 corporate headquarters with over $1 billion in annual revenue, 8 of which are Fortune 1000 companies; as well as 500 foreign-owned companies representing more than 40 nations.
Companies operating in the City enjoy low labor costs, favorable corporate tax policies, no personal income tax, and stable, pro-business leadership. Collaboration between state and local government and industry has resulted in effective development packages, targeted financial incentives, expedited permitting, and streamlined regulatory processes. These conditions have made the City an ideal place for numerous companies, health systems and networks, as well as multiple institutions.
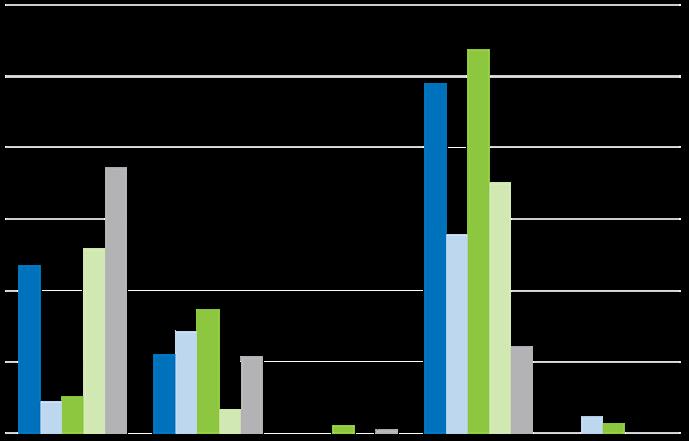
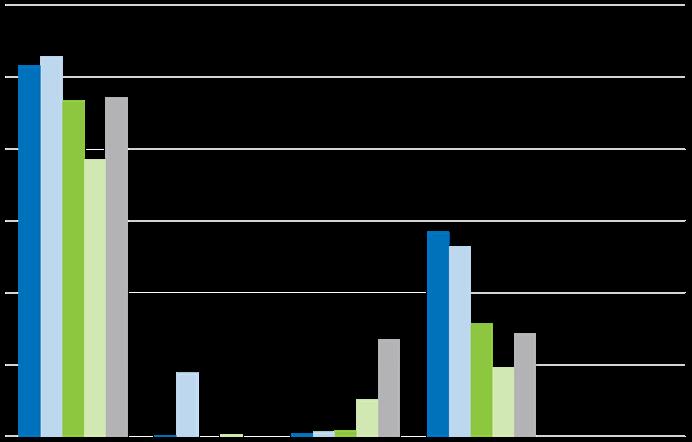
CONSUMER SPENDING
As of November 2021, total expenditures by residents within the City were estimated to be about $12.3 billion, with consumers spending about 32% on housing, 29% on retail goods, 12% on food, 8% on health care, and 4% on entertainment and recreation. In addition, total expenditures within the City make up approximately 29% of the consumer spending within the County, with over $42.7 billion in total expenditures as of year-to-date 2021. Similar to the City, housing and retail goods comprise the majority of consumer spending within the County. The City's average consumer spending for year-end 2020 is represented in thousands within the adjacent figures.


RETAIL GOODS $4,001,700 HOUSING $940,600 HEALTH CARE


EMPLOYMENT TRENDS
EMPLOYMENT AND BUSINESS ACTIVITY | TAMPA SUB-DISTRICTS
As of year-end 2019, the Urban Core sub-district comprised a significantly larger share of total employment within the City, at 22.2%, compared to the other subdistricts. Drew Park/Airport, University Area, and East Tampa comprised relatively modest shares at 5.8%, 2.2%, and 1.9%, respectively, of the City's total employment. The West Tampa sub-district contained the smallest share of total employment within the City at 0.8%, as illustrated in the table below.
JOBS BY INDUSTRY SECTOR | YEAR END 2019
Utilizing the same metrics for professional employment within the City, the highest industry sectors include the following: information; finance and insurance; real estate and leasing; professional services; management of companies; administration, support, and waste management; and educational services. The Urban Core's largely white collar, or professional, work force comprised nearly 62% of total employment in 2019. Comparatively, the Drew Park/Airport, West Tampa, and East Tampa sub-


districts have a professional work force that composes approximately 37%, 29%, 26%, respectively, of the subdistrict's total employment in 2019. The University Area comprises the smallest share of professional work force, at only 7.3% of the sub-district's total employment. This is not surprising, as the majority of the area contains students; however, the arts and recreation industry comprises the largest capture of City employment, with nearly 55% in 2019.


MARKET TRENDS | RENTAL UNITS

MARKET OVERVIEW
As of year-to-date ("YTD") 2021, January through August 2021, a total of 7,191 rental units in 52 buildings meet the minimum size criteria (market rate and mixed-income properties having at least 10 units) within the combined Tampa sub-districts, accounting for 7.3% of the total rental units in the City using these same parameters. There are 115 properties within these discrete areas containing less than 10 units, accounting for 29% of the total units, which were not included in this analysis to avoid misrepresentation of real rental unit properties.
Within the sub-districts, the Urban Core comprises the majority of rental units, closely followed by the University Area. Year-over-year, total inventory of rental units significantly increased in West Tampa due to the addition of the Boulevards at West River with 371 units; as well as the Heron in the Urban Core sub-district with 420 units.
The City also experienced a gross absorption of 3,768 units as of yearto-date 2021, which composed nearly 77% of the absorption within the County. Gross absorption increased 52% in the County and 0.6% in the City, year-over-year. During this same time frame, gross absorption increased for all the Tampa sub-districts.
Average rental rates per unit also increased in all the Tampa sub-districts, which may be driven by increase in demand and supply for desirable rental space. Urban Core and West Tampa sub-districts had rental rates slightly higher than that of the City and County, at over $2,000 per unit. Comparatively, the average rental rates in the County and the City increased 23% and 24%, respectively, year-over-year.
YEAR-OVER-YEAR KEY SNAPSHOT

URBAN CORE

Rental units increased 16%, with the addition of 420 units in one apartment building. Vacancy of rental properties increased 26% Average rental rates per unit increased 16%.
Average rental rates per sq. ft. increased 16%. Market sales
increased 13%.
DEVELOPMENT
As of year-to-date 2021, the Urban Core market is the only sub-district to experience rental development activity that meets the minimum criteria, as illustrated in the graphic below.
Within the Urban Core, there are 1,785 rental apartment units in five mid- to high-rise properties currently under construction and ready for tenant occupancy by 2023. In addition, there are 2,099 units proposed and/or in the final planning stages of development. This indicates a total of about 3,884 units of apartment development activity within the Urban Core as of year-to-date 2021.


EAST TAMPA

Rental units stayed at 850 units in three apartment buildings.
Vacancy of rental properties decreased 95%
Average rental rates per unit increased 3.2%.
Average rental rates per sq. ft. increased 3.8%.
Market sales price per sq. ft. increased 7.4%.

WEST TAMPA
Rental units increased 82%, with the addition of 371 units in one apartment building.
Vacancy of rental properties increased 857%
Average rental rates per unit increased 28%.
Average rental rates per sq. ft. increased 28%.
Market sales price per sq. ft. increased 13%.

DREW PARK/ AIRPORT
Rental units remained unchanged at 209 units in nine apartment buildings.
Vacancy of rental properties decreased 25%
Average rental rates per unit increased 1.4%.
Average rental rates per sq. ft. increased 1.7%.
Market sales price per sq. ft. increased 20%.

UNIVERSITY AREA
Rental units remained unchanged at 2,322 units in 24 apartment buildings.
Vacancy of rental properties decreased 67%
Average rental rates per unit increased 8.0%.
Average rental rates per sq. ft. increased 8.8%.
Market sales price per sq. ft. increased 19%.


AVERAGE RENTAL RATE

Over the last five years, total inventory of rental units meeting the minimum criteria significantly increased in West Tampa with the addition of 685 units, and in the Urban Core sub-district with the addition of 1,657 units. During this same time frame, total inventory of rental units remained unchanged in the other Tampa sub-districts. Comparatively, total inventory of rental apartment units increased 11% in the County and 10% in the City, with the addition of 12,879 and 8,904 units, respectively, over the last five years.
TAMPA’S
Vacancy rates significantly increased in the West Tampa sub-district, from 1.4% in 2017 to over 44% in 2021, which may be driven by a decline in desirable rentable spaces within the sub-district. During this same five-year period, vacancy rates declined for all the other Tampa sub-districts. A decline in vacancy rates may be attributed to an increase in healthy spending behaviors and a rise in apartment demand. Comparatively, vacancy rates fell in the County and City by 35% and 45%, respectively, over the last five years.
RENTAL APARTMENT MARKET,
Over the last five years, average rental rates per rental unit increased for all Tampa sub-districts. The West Tampa sub-district experienced the greatest increase in average rental rates at 45%, followed by the Urban Core sub-district at 27%. An increase in average rental rates can be accredited to an increase in demand, as well as an increase in the fixed costs to upkeep a property. Comparatively, the County and City both saw an increase in average rental rates per unit of 38% and 39%, respectively, over the last five years.
AT 96% OCCUPANCY,
HAS OVER 3,430 UNITS UNDER CONSTRUCTION AS OF YEAR-TO-DATE 2021.
Drew Park/Airport
Note: Year-over-year snapshot represents 3rd
MARKET TRENDS | RETAIL

MARKET OVERVIEW
As of year-to-date ("YTD") 2021, January through August 2021, the East Tampa, Drew Park/Airport, and West Tampa sub-districts have retail occupancy levels that are slightly higher than that of the County and the City. Additionally, the Drew Park/Airport sub-district with nearly 3.1 million square feet, has significantly more retail space than all other sub-districts, closely followed by Urban Core and University Area with 1.8 million and 1.7 million square feet, respectively.
In addition, the City experienced over one million square feet of retail absorption, accounting for nearly 73% of the absorption within the County. Gross absorption decreased 32% in the County and 14% in the City year-over-year. During this same time frame, gross absorption decreased for the Drew Park/Airport and University Area sub-districts. A decline in gross absorption may be a result of new inventory coming onto the market without a committed tenant, or vacancy increasing as tenants do not renew leases on the properties they previously occupied, due to the lasting impacts of the COVID-19 pandemic on the economy.
Average rental rates in Drew Park/Airport, Urban Core, and West Tampa were slightly higher than that observed within the County and City, as of year-to-date 2021. Year-over-year, average rental rates increased 3.4% in the County and 4.3% in the City. During this same time frame, average rental rates increased significantly in the University Area, East Tampa, and West Tampa sub-districts at 18%, 9.1%, and 8.7%, respectively, which may be driven by increase in demand and supply for desirable retail space within the area.
RETAIL MARKET CHARACTERISTICS | YEAR-TO-DATE 2021
URBAN CORE
Retail space increased 3.0% from the prior year, to 1.8M sq. ft.
Vacancy of retail properties increased 13%.
Average rental rates decreased 4.2%.
Leasing activity of retail space increased 20%. Market sales price per sq.
increased 4.2%.
LEASING ACTIVITY

As of year-to-date 2021, there were a total of 41 retail lease transactions within the five sub-districts, resulting in nearly 212,000 square feet. Of these transactions, there were 37 minor leases (less than 10,000 square feet) totaling nearly 100,000 square feet. Additionally, there were four major leases (greater than 10,000 square feet) totaling over 112,000 square feet, as illustrated below.
NOTABLE LEASING ACTIVITY


EAST TAMPA
426,006 sq. ft. of retail space remained constant over the prior year.
Vacancy of retail properties fell by 100%.
Average rental rates increased 9.1%.
Leasing activity of retail space increased 4,994 sq. ft. from zero in 2020.
Market sales price per sq. ft. increased 4.5%.
WEST TAMPA
Retail space increased 28% from the prior year, to 182,255 sq. ft.
Vacancy of retail properties rose by 435%.
Average rental rates increased 8.7%.
Leasing activity of retail space increased 48,500 sq. ft. from zero in 2020.
Market sales price per sq. ft. increased 3.2%.
DREW PARK/ AIRPORT
3.1M sq. ft. of retail space remained constant over the prior year.
Vacancy of retail properties increased 135%.
Average rental rates decreased 16%.
Leasing activity of retail space increased 3.3%.
Market sales price per sq. ft. increased 3.3%.
1.7M sq. ft. of retail space remained constant over the prior year.
UNIVERSITY AREA
ANNUAL INVENTORY

Over the last five years, total inventory of retail space has increased significantly within the West-Tampa subdistrict, at 130%. Inventory within the Drew Park/Airport and Urban Core sub-districts have also experienced a slight increase of 1.8% and 3.2%, respectively. During this same time frame, inventory decreased 0.3% and 0.6% within the East Tampa and University Area sub-districts. Comparatively, total inventory of retail space increased 1.7% and 1.3% within the County and the City over the last five years.
VACANCY RATE

Vacancy rates decreased for the East Tampa, University Area, and Drew Park/Airport sub-districts over the last five years. A decline in vacancy rates may be attributed to an increase in healthy spending behaviors and a rise in building demand. Whereas, the Urban Core and West Tampa sub-districts experienced increases in vacancy rates during this same time frame, which could be driven by a decline in desirable rentable spaces. Comparatively, vacancy rates fell in the County by 9% and increased in the City by 10% over the last five years.
Vacancy of retail properties decreased 15%. Average rental rates increased 18%.
Leasing activity of retail space decreased 47%. Market sales price per sq. ft. increased 5.4%.
AVERAGE RENTAL RATE

Over the last five years, average rental rates of retail space have increased for all the Tampa sub-districts. West Tampa and the University Area experienced the greatest increase in average rents by 164% and 57%, respectively. During this same time frame, the average rental rates within the County and the City also experienced an increase of 20% and 22%, respectively. An increase in overall retail demand within the County and City may be driving the higher average rents within the comparable sub-districts.
MARKET TRENDS | INDUSTRIAL

MARKET OVERVIEW
As of year-to-date ("YTD") 2021, January through August 2021, the East Tampa, West Tampa, Drew Park/Airport, and University Area sub-districts have industrial occupancy levels that are slightly higher than that of the County and City. The West Tampa sub-district has the greatest occupancy at 100%. Additionally, the Drew Park/Airport sub-district with nearly 2.7 million square feet, has significantly more industrial space than all other sub-districts, closely followed by East Tampa with 2 million square feet.
The City experienced over 3.6 million square feet of retail absorption, accounting for nearly 79% of the absorption within the County. Gross absorption decreased 22% in the County and 0.6% in the City year-overyear. During this same time frame, gross absorption decreased for all the sub-districts, except for West Tampa, which experienced a significant increase in gross absorption as a result of all properties becoming fully occupied at 100%. A decline in gross absorption may be a result of vacancy increasing as tenants do not renew leases on the properties they previously occupied, due to the lasting impacts of the COVID-19 pandemic.
Average rental rates in Drew Park/Airport, University Area, and West Tampa were slightly higher than that observed within the County and City as of year-to-date 2021. Year-over-year, average rental rates increased 9% in the County and 7.9% in the City. During this same time frame, average rental rates increased significantly in the Drew Park/Airport sub-district by 32%, which may be driven by increase in demand and supply for desirable retail space within the area. Average rental rates remained unchanged for the West Tampa and University Area sub-districts, year-over-year.
INDUSTRIAL MARKET CHARACTERISTICS | YEAR-TO-DATE 2021
YEAR-OVER-YEAR KEY SNAPSHOT URBAN CORE
946,649 sq. ft. of indust. space remained constant over the prior year.
Vacancy of indust. properties remained unchanged at 17%. Average rental rates increased 1.4%.
Leasing activity of indust. space increased 44%. Market sales price per sq. ft. increased 6.2%.
LEASING ACTIVITY
As of year-to-date 2021, there were a total of 11 industrial lease transactions within the five subdistricts, resulting in over 121,000 square feet. Of these transactions, there were nine minor leases (less than 10,000 square feet) totaling nearly 36,000 square feet. Additionally, there were two major leases (greater than 10,000 square feet) totaling over 85,000 square feet, as illustrated below.
NOTABLE LEASING ACTIVITY


EAST TAMPA
2.0M sq. ft. of indust. space remained constant over the prior year.
Vacancy of indust. properties fell by 49%.
Average rental rates decreased 2.7%.
Leasing activity of indust. space significantly increased by 223%.
Market sales price per sq. ft. increased 6.3%.
WEST TAMPA
146,692 sq. ft. of indust. space remained constant over the prior year.
Vacancy of indust. properties fell by 100%.
Average rental remained unchanged at $8.00.
Leasing activity of indust. space increased 1,014 sq. ft. from zero in 2020.
Market sales price per sq. ft. increased 2.7%.
DREW PARK/ AIRPORT
2.7M sq. ft. of indust. space remained constant over the prior year.
Vacancy of indust. properties decreased 39%.
Average rental rates increased 32%.
Leasing activity of indust. space decreased 66%.
Market sales price per sq. ft. increased 5.9%.
UNIVERSITY AREA
556,302 sq. ft. of indust. space remained constant over the prior year.
Vacancy of indust. properties rose by 153%. Average rental rates remained constant at $9.77.
Leasing activity of indust. space remained at zero.
Market sales price per sq. ft. increased 8.3%.


AVERAGE RENTAL RATE

Over the last five years, total inventory of industrial space decreased significantly within the Urban Core subdistrict, at 7%; whereas, total inventory increased 0.7% in the Drew Park/Airport sub-district. Total inventory of industrial space remained unchanged within the other sub-districts. The Drew Park/Airport and East Tampa subdistricts have the greatest amount of industrial space at over 2.0 million square feet of space. Comparatively, total inventory of industrial space increased 0.3% and 0.1% within the County and the City over the last five years.
Vacancy rates decreased for East Tampa, West Tampa, and Drew Park/Airport over the last five years. A decline in vacancy rates may be attributed to an increase in healthy spending behaviors and a rise in building demand. Whereas, the University Area and Urban Core sub-districts experienced increases in vacancy rates during this same time frame, which could be driven by a decline in desirable rentable spaces. Comparatively, vacancy rates fell in the County and City by 9% and 35%, respectively, over the last five years.
Over the last five years, average rental rates of industrial space significantly increased in the University Area subdistrict by 128%, and increased in the Drew Park/Airport sub-district by 28%. During this same time frame, the average rental rates remained unchanged within West Tampa, and decreased for the East Tampa and the Urban Core sub-districts. Comparatively, the County and City both saw an increase in average rental rates by 28% and 36%, respectively, over the last five years.
TAMPA’S INDUSTRIAL MARKET, AT 95% OCCUPANCY, HAS OVER 6.2M SQ. FT. OF LEASING ACTIVITY AS
2021.
Drew Park/Airport
MARKET TRENDS | OFFICE

MARKET OVERVIEW
As of year-to-date ("YTD") 2021, January through August 2021, the East Tampa and University Area sub-districts have office occupancy levels at 100%, which are slightly higher than that of the County and the City. Additionally, the Urban Core has significantly more office space than all other sub-districts, with over 10 million square feet, followed by the Drew Park/Airport sub-district with 1.8 million square feet of office space.
In addition, the City experienced over 3 million square feet of office absorption, accounting for nearly 88% of the absorption within the County. Gross absorption decreased 24% in the County, and 22% in the City yearover-year. During this same time frame, gross absorption decreased for all the Tampa sub-districts. A decline in gross absorption may be a result of new inventory coming onto the market without a committed tenant, or vacancy increasing as tenants do not renew leases on the properties they previously occupied, due to the lasting impacts of the COVID-19 pandemic on the economy.
Average rental rates in the Drew Park/Airport, Urban Core, and West Tampa sub-districts were slightly higher than that observed within the County and City as of year-to-date 2021. Year-over-year, average rental rates increased 3.0% in the County and 2.3% in the City. During this same time frame, average rental rates increased in the Drew Park/Airport and West Tampa sub-districts by 3.4% and 0.1%, respectively. Whereas, average rental rates decreased in the Urban Core and East Tampa subdistricts, which may be driven by a decrease in demand and supply for desirable office space within these areas.
OFFICE MARKET CHARACTERISTICS | YEAR-TO-DATE 2021
YEAR-OVER-YEAR KEY SNAPSHOT
URBAN CORE
Office space increased 0.5% from the prior year, to 11.3M sq. ft.
Vacancy of office properties increased significantly by 60%.
Average rental rates decreased 1.2%.
Leasing activity of office space increased 22%. Market sales price per sq. ft. increased 2.4%.
LEASING ACTIVITY
As of year-to-date 2021, there were a total of 102 office lease transactions within three of the five subdistricts, resulting in over 748,200 square feet. Of these transactions, there were 85 minor leases (less than 10,000 square feet) totaling nearly 204,800 square feet. Additionally, there were 17 major leases (greater than 10,000 square feet) comprising more than 543,400 square feet.
NOTABLE LEASING ACTIVITY


EAST TAMPA
215,545 sq. ft. of office space remained constant over the prior year.
Vacancy stayed unchanged at 100%
Average rental rates decreased 1.1%.
Leasing activity of decreased 100% from 3,000 sq. ft. in 2020.
Market sales price per sq. ft. increased 2.6%
WEST TAMPA
481,974 sq. ft. of office space remained constant over the prior year.
Vacancy of office properties fell by 72%.
Average rental rates increased 0.1%.
Leasing activity of office space increased 159% from the prior year.
Market sales price per sq. ft. increased 6.3%.
DREW PARK/ AIRPORT
1.9M sq. ft. of office space remained constant over the prior year.
Vacancy of retail properties increased 13%.
Average rental rates increased 3.4%.
Leasing activity of retail space increased 49%.
Market sales price per sq. ft. increased 5.0%
UNIVERSITY AREA
164,873 sq. ft. of office space remained constant over the prior year.
Vacancy of office properties fell to 0%.
Average rental rates remained unchanged at $18.79.
Leasing activity stayed the same at zero sq. ft.
Market sales price per sq. ft. increased 4.9%
ANNUAL INVENTORY

Over the last five years, total inventory of office space has increased significantly within the West-Tampa subdistrict, by 156%. Inventory within the Urban Core subdistrict also experienced a slight increase of 1.7%. During this same time frame, inventory of office space remained unchanged within the East Tampa, Drew Park/Airport, and University Area sub-districts. Comparatively, total inventory of office space increased 3.4% and 3.0% within the County and the City, respectively, over the last five years.
VACANCY RATE

Vacancy rates decreased significantly for the East Tampa and University Area office markets over the last five years. A decline in vacancy rates may be attributed to a rise in building demand. Whereas, the Urban Core, West Tampa, and Drew Park/Airport sub-districts experienced increases in vacancy rates during this same time frame, which could be driven by a decline in desirable rentable spaces. Comparatively, vacancy rates also increased in the County and City by 32% and 36%, respectively, over the last five years.
AVERAGE RENTAL RATE

Over the last five years, average rental rates of office space have increased for all the Tampa sub-districts. East Tampa and the University Area experienced the greatest increase in average rents by 98% and 37%, respectively. During this same time frame, the average rental rates within the County and the City also experienced an increase at 23% and 21%, respectively. An increase in overall office demand within the County and City may be driving the higher average rents within the comparable sub-districts.
TAMPA’S OFFICE MARKET, AT 91% OCCUPANCY, HAS OVER 1,000,000 SQ. FT. OF NEW OFFICE DEVELOPMENT UNDER
Drew Park/Airport
MARKET TRENDS | OFFICE
MARKET OVERVIEW | CLASS OF OFFICE SPACE
The following tables and figures summarize the office market by class of space within the County, City, and the Tampa sub-districts for year-to-date 2021, January through August 2021.
As of year-to-date 2021, Drew Park/Airport, West Tampa, and Urban Core sub-districts contain significant amounts of Class A office space; whereas, East Tampa and the University Area have zero square feet of Class A office space, along with a significantly larger percentage of Class C space, as compared to the other Tampa sub-districts. Comparatively, the County and City have a greater amount

of Class B office space than Class A. Over the last five years, this inventory of office space by class has remained relatively unchanged for each of the Tampa sub-districts.
Occupancy levels for Class A space were lower than the occupancy observed in both Class B and Class C space within the County, City and the Tampa sub-districts. Lower occupancy rates for Class A space may be driven by higher average rental rates within this class of space and a lack of tenants unable to achieve those rates. Although Class C space had the highest occupancy, this space comprises the smallest share of total office space within the County and


CLASS A OFFICE SPACE MARKET CHARACTERISTICS | YEAR-TO-DATE 2021
the City. In addition, Class B space comprised the majority of total gross absorption within the County, City, and Drew Park/Airport sub-district; gross absorption of Class A space was greater in the Urban Core and West Tampa sub-districts. The University Area only experienced gross absorption within Class C space, as of year-to-date 2021.
The average rental rates within the Tampa sub-districts were comparable to that of the County and City in each class of space. The Drew Park/Airport and West Tampa sub-districts had the highest rental rates for Class A, Class B, and Class C space as compared to the other sub-districts.


CONCENTRATION MAPS
The following concentration maps depict the general clusters of specific property uses within each of the City's five unique sub-districts:
Rental Unit Properties
(10 or more units)
Retail Properties
Industrial/Flex Properties
Office Properties
It is important to note, these concentration maps are not to scale and are intended only to show location and concentration of properties relative to the individual subdistricts, as well as compared to the other sub-districts within the City.
URBAN CORE

EAST TAMPA

WEST TAMPA DREW PARK/AIRPORT


UNIVERSITY AREA

Sources: CoStar Group; Hillsborough County Property Appraiser; GAI Consultants.
SECTION TWO OPPORTUNITY ZONE PROSPECTUS
The City of Tampa has invested in creating this Market Report and Prospectus to highlight and promote the City's Opportunity Zones in five defined sub-districts within the Tampa area.
Included in this Prospectus section is an introduction to understanding what Opportunity Zones are, as well as the advantages they provide to the community. This section also provides a district overview of each sub-district, along with the census tracts that are contained within each unique area, highlighting the community investment, anchor development, current activity, and priority projects in each area.
Additionally, this section provides a comparison of demographic data, business employment trends, current property values, existing inventory, and income data for each of the five sub-districts and their census tracts.
The purpose of this section is to provide a tool to promote and market the City's Opportunity Zones and their current socio-economic and existing market conditions; as well as provide prospective and future developers insight into the potential redevelopment and investment opportunities within the five unique sub-districts.

Tampa Downtown Skyline

OPPORTUNITY ZONES
ABOUT OPPORTUNITY ZONES
The Opportunity Zone Program, as established in the Federal Tax Cut and Jobs Act of 2017, was designed to drive long-term capital to rural and low-income urban communities throughout the nation. The program also encourages private investment by providing tax incentives, including temporary deferrals on capital gains taxes when investors reinvest those gains in Qualified Opportunity Funds (“QOF”). These funds are then invested in low-income communities from designated census tracts, known as Opportunity Zones.
An Opportunity Zone is an economically distressed community where new investments, under certain conditions, may be eligible for preferential tax treatment. Florida is home to 427 of these Federally Designated Opportunity Zones. The purpose of these zones are to act as an economic development tool by spurring development and job creation in distressed communities, and by providing tax benefits to investors.
HOW DOES THE OPPORTUNITY ZONE PROGRAM WORK?
Investors receive tax credits when they reinvest capital gains, or profits from the sale of an asset, into Opportunity Zones. Investors may benefit in three ways:
1. They can defer paying taxes on the original capital gain until they dispose of the investment or until 2026.
2. If they hold the investment for at least five years, they will have to pay 10% less taxes on the original capital gain.
3. If they hold the investment for at least 10 years, they will not have to pay any capital gains tax on their Opportunity Zone investment.
For example, an investor sells their company stock for $1 million and has $100,000 in capital gains from that sale. The investor puts the $100,000 into a QOF that invests in a new business within an Opportunity Zone.

QUALIFIED OPPORTUNITY FUNDS
A Qualified Opportunity Fund ("QOF") specializes in attracting investors with similar risk and reward profiles to collect and place capital in rural and low-income urban communities. Specific requirements of QOFs include:
▪ Need to be funded by private capital and guided by market principles.
▪ Need to invest 90% of their assets in Opportunity Zone assets.
▪ May invest in Opportunity Zones via stock, partnership interests, or business property.
▪ Need to use assets to create new business activity.
▪ Need to double the investment basis over 30 months if investing in an existing business.
▪ Can create new businesses or new real estate or infrastructure.
▪ May not invest in certain types of business, such as golf courses, country clubs, gambling establishments, and a few other specifically excluded types of business.
If an investor has realized capital gains, then those gains would need to be invested into a QOF within 180 days. The QOF then needs to place 90% of the funds into a qualified Opportunity Zone property or business within six months.
The investor can defer paying capital gains tax until they have disposed of the Opportunity Zone investment or December 31, 2026, whichever comes first.
If they hold the investment for five years, they can reduce the deferred capital gains tax owed on the original gain by 10%. This would mean that only $90,000 of the $100,000 gain is taxable. Assuming a 20% capital gains tax, they would owe $18,000 instead of $20,000.
If they continue to hold the Opportunity Zone investment for another five years, they will not have to pay any capital gains tax on that investment. If their $100,000 Opportunity Zone investment appreciates 100% over 10 years, they owe $0 in capital gains tax instead of $20,000. Investors can hold funds there until 2046 before needing to pay capital gains tax on the Opportunity Zone investment.


City of Tampa Aerial
Photo Courtesy of Ryan French
WHAT BUSINESSES ARE ELIGIBLE FOR A QOF INVESTMENT?
Businesses will need to meet these qualifications to take advantage of the Opportunity Zone program.
70% of the business’ tangible property needs to be:
▪ Acquired after 2017 from an unrelated party.
▪ Used in any Opportunity Zone 70% or more of the time.
▪ Original use property or be substantially improved.
A business needs to:
▪ Receive 50% of its revenue from active conduct in any Opportunity Zone.
▪ Use 40% or more of its intangible property in any Opportunity Zone.
▪ Not hold non-qualified financial property beyond reasonable working capital.
▪ Operate in eligible business sectors (ineligible activities include golf courses, country clubs, gambling establishments, and a few other specifically excluded types of business).
These qualifications are defined by U.S. Treasury regulations. For more information, a tax advisor should be consulted.
Investors should also consider the following:
▪ Willing to give up equity in the business.
▪ Likelihood the business will grow significantly over the next 10 years.
▪ Likelihood of the business remaining within a qualified Opportunity Zone for the 10 years.
INVESTMENT AND REDEVELOPMENT OPPORTUNITY INDEX MODEL
APPROACH & METHODOLOGY
The Investment and Redevelopment Opportunity Index (“ROI”) provided in this publication has been developed using weighted values that can be used to identify potential investment and redevelopment properties located within a specific area. For the purpose of this report, investment and redevelopment opportunities were examined for the each of the five unique sub-districts within the City of Tampa, as well as the individual census tracts which make up each of the sub-districts.
The ROI model defines investment opportunities as current for-sale commercial properties or available vacant land. Whereas, the ROI model defines redevelopment opportunities as select properties—including commercial, residential, and industrial—based on DOR property use codes, with an opportunity index score greater than 80.
These redevelopment opportunities generally represent developed properties that may be in active use and are, in most cases, not currently on the market for sale. While many legal, physical, and economic factors ultimately play a role in the viability of redeveloping properties, the general factors used in the ROI model include:
▪ Property Utilization in terms of a Floor Area Ratio (“FAR”).
▪ Age of the Improvements.
▪ Relationship between Land and Improvement Value.
▪ Total Market Value, including Land and Improvements per square foot of Property.
▪ Size of Parcels.
Each of these factors for these properties is weighted to provide a measure between 0 and 100. Values closer to 100 reflect factors in favor of redevelopment, and values closer to 0 reflect less favorable indicators for redevelopment. For this analysis, properties scoring an 80 or above are considered significant redevelopment targets. It is important to note, the ROI Model does not consider any other legal, physical, or economic factors that may influence development opportunity.
Additional information regarding the investment and redevelopment properties within the five subdistricts, as well as their individual census tracts, can be located within each sub-district's Opportunity Index sections.

OPPORTUNITY ZONES
TAMPA'S OPPORTUNITY ZONES
The City of Tampa has 18 Opportunity Zones, as designated at the Federal level, within the five defined sub-districts in the Tampa area, as illustrated on the following map. These Opportunity Zones are defined at the census tract level within each sub-district.
QUALIFIED OPPORTUNITY FUNDS INVESTING IN FLORIDA
Based on public reports, Security and Exchange Commission filings, and press releases, QOF investment activity in the final six months of 2021 represented the largest dollar amount in any period for which such investments have been tracked. The 978 QOFs that have reported year-end fundraising numbers have received an aggregate amount of $24.40 billion of equity from investors.
The five states with the most planned QOF investment (total equity raised), include the four largest states by population: California ($2.411 million), Texas ($1.119 million), New York ($1.044 million), and Florida ($784.4 million); as well as Arizona ($1.344 million).
QOFs focused on a single city or multiple cities for their investments continue to make up the majority of funds and equity raised at 29.5% and 27.7%, respectively, of the total. QOFs with a nationwide focus have raised 27% of total equity.
Residential development is the leading area of investment for QOFs. As of September 30, 2021, of the QOFs reporting a specific equity amount, $15.56 billion was raised by QOFs with at least some focus on residential development. QOFs with at least some focus on commercial development had raised $12.19 billion, while QOFs with some focus on hospitality raised $3.02 billion; those with some focus on operating businesses raised $680.2 million; and those with some focus on renewable energy raised $642.5 million.
The following table illustrates the Qualified Opportunity Funds investing in Florida by area of focus, specific to the City's Opportunity Zones within the five unique subdistricts in the Tampa area.
LEGEND
City of Tampa, FL Urban Core East Tampa West Tampa
Drew Park/Airport University Area


FLORIDA QUALIFIED OPPORTUNITY FUNDS BY AREA OF FOCUS
Fund
2021 Florida Opportunity Fund, LLC
701 Whiting Street Development
Arch Opportunity Zone Strategic Fund
Estate Commercial, Mixed-use Development, Multifamily Residential, Single Family Residential, Workforce Housing
Estate Multi-Family Housing
Estate Single Family Residential
Banyan Opportunity Zone Fund Real Estate Commercial, Hotel, Mixed-Use, Office, Residential
Catalyst Montage OZ Fund
Central Florida RE QOF, LP
Community Outcome Fund
Business, Real Estate
Business, Real Estate
Affordable Housing, Commercial Real Estate, Community Revitalization, Economic Development, Mixed-use Development, Multifamily Residential, Workforce Housing
Affordable Housing, Infrastructure Investment, Mixed-use Development, Multifamily Residential
Business, Real Estate Commercial, Infrastructure, Mixed-Use, Residential
DPI Opportunity Fund Business DPI Opportunity Fund will invest exclusively in advanced manufacturing equipment and dedicated industrial buildings to accelerate the growth of DPI Packaging
Driftwood Qualified Opportunity Fund I, LLC Real Estate Hotel
Ellavoz Shared Values Opportunity Fund
Florida Lakes RV Resort
GTIS Qualified Opportunity Fund
Lesnick OZ Fund
Maxus Opportunity Fund I
Miami Opportunity Fund
ODG Fund I
Orlando Opportunity Zone Fund
P&R Opportunity Zone Fund 1, LP
PICOZ Fund I
PrimeCore OpZone Fund I, LP
REICO
Sherbert Group QOF, LLC
Sikari Luxe Miami Opportunity Fund
Sikari Luxe Orlando Opportunity Fund
Sikari Luxe Tampa Opportunity Fund
Sikari Luxe Florida Recovery Opportunity Fund
Sikari Luxe St. Augustine Opportunity Fund
Southern US RE QOF, LP
Starpoint Opportunity Zone Fund
Tampa Qualified Opportunity Zone Fund
Veterans Victory Housing & Small Business
Centers
Virtua Opportunity Zone Fund I
West Florida RE QOF
Woodforest CEI-Boulos Opportunity Fund
Real Estate Commercial, Mixed-Use, Residential
Real Estate Hotel
Real Estate
Real Estate
Industrial, Multi-Family Housing, Residential, Single-Family Housing, Student Housing, Warehouse
Affordable Housing, Commercial, Hotel, Multi-Family Housing, Office, Parking, Residential, Senior, Student, and Workforce Housing
Real Estate Commercial, Residential
Real Estate Commercial Real Estate, Multifamily Residential
Real Estate Commercial, Mixed-Use, Multi-Family Housing, Residential
Real Estate
Commercial Real Estate, Multifamily Residential
Business, Real Estate Healthcare, Office, Storage
Real Estate
Mixed-Use, Multi-Family Housing, Residential, Single-Family Housing
Real Estate Multi-Family Housing, Residential
Business, Real Estate Commercial, Multi-Family Housing, Residential, Storage
Real Estate
Affordable housing, Multifamily housing, Student housing, Senior housing, Workforce housing, Hospitality, Office, Industrial, Mixed-use, Retail
Real Estate Commercial, Hotel, Mixed-Use, Residential, Retail
Real Estate Commercial, Hotel, Mixed-Use, Residential, Retail
Real Estate Hotel, Mixed-Use, Retail
Real Estate
Commercial, Hotel, Mixed-Use, Multi-Family Housing, Office, Residential, Retail
Real Estate Commercial, Mixed-Use, Multi-Family Housing, Residential
Business, Real Estate
Mixed-Use, Senior Housing, Commercial Real Estate, Community Revitalization, Economic Development, Mixed-use Development, Multifamily Residential, Small Business Development
Real Estate Industrial, Mixed-Use, Multi-Family Housing
Real Estate Hospitality development
Business, Real Estate Commercial, Energy Development, Multi-Family Housing, Office
Real Estate
Real Estate
Hotel, Industrial, Office, Residential
Affordable housing, Hospitality development, Mixed-use development, Multifamily residential
Real Estate Workforce Housing
URBAN CORE | DISTRICT OVERVIEW
ABOUT THE URBAN CORE COMMUNITY INVESTMENT
The Urban Core sub-district within the City of Tampa is approximately 992 acres and consists of three unique Opportunity Zones. The sub-district is bounded by the Hillsborough River and Garrison Channel on the west and south sides. In addition, the Urban Core encompasses five CRAs: the Central Park CRA, Ybor City 1 CRA, Ybor City 2 CRA, the Downtown Core CRA, and the Downtown Non Core CRA.
The Urban Core generally encompasses Downtown, Central Park, and Ybor—areas that continually build the reputation as a high-caliber urban center featuring quality residential, commercial, and recreational assets. Boasting great views of the Downtown skyline and convenient access to Tampa’s urban job center, the Urban Core is also emerging with new residences, business opportunities, and great recreational amenities. Recent historic building preservation and facade improvement initiatives are helping to ensure that the area’s unique architectural character remains alive and well, and new business ventures are helping to grow the local economy. By blending the incredibly rich cultural history of the neighborhoods within the Urban Core with the best principles of sustainable urban design, rebirth of the distinctive character known to the area is active.
The Urban Core contains 2,985 rental apartment units in 24 buildings that meet the minimum size criteria (market rate and mixed-income properties having at least 10 units). Within the Urban Core, there is also 1.8 million square feet of retail space, 946,600 square feet of industrial space, and over 11.3 million square feet of office space. The Urban Core sub-district comprises the majority of office space and rental units, compared to the other sub-districts within the City of Tampa.
As of year-end 2021, the Investment and Redevelopment Opportunity Index model for the Urban Core revealed that there are approximately 19 properties prime for redevelopment, with a mix of commercial, industrial, and residential property uses; and 22 for-sale commercial properties and vacant lots also located within the subdistrict. The Urban Core ROI Map is illustrated on pages 46-47.
The Urban Core has been the focus of tremendous infrastructure investment by the City of Tampa and its many partners in transportation, water, wastewater, and stormwater. The Downtown Core Complete Streets project provides for general maintenance and complete streets improvements to several streets in the Urban Core, including Tampa Street, Florida Avenue, Whiting Street, Franklin Street, Ashley Drive, and Brorein Street. This project will allow for resurfacing of these roadways to remove deficiencies and provide a newly finished driving surface; as well as multimodal improvements to increase safety in these corridors. This project aligns with the City’s Vision Zero initiative, which is a strategy to eliminate all traffic fatalities and severe injuries, while promoting safe, healthy, equitable mobility for all. Nuccio Parkway is also being transformed into a Complete Street, with roadway improvements to enhance safety and multimodal connectivity, including on-street parking, enhanced crosswalks, and other safety measures.
The City’s Vision Zero initiative has been the driving force behind many programs and projects being undertaken by the City. First implemented in Sweden in the 1990s, Vision Zero has proven successful across Europe. Now, it is gaining momentum in major American cities. The
City’s Vision Zero initiative focuses on vulnerable road users (pedestrians, cyclists, etc.), schools, speeding, and speed management. Implementation of the City’s Vision Zero Action Plan includes safety projects on high priority corridors, citywide speed limit reduction programs, expansion of the City’s network of trails/greenways/ safe crosswalks, and a citywide separated bike lane pilot program. The City of Tampa’s Green Spine Cycle Track is one of the many Vision Zero initiative projects within the Urban Core. The Green Spine Cycle Track, which currently runs through Downtown Tampa, is being expanded to provide for a bi-directional cycle track along Nuccio Parkway from Nebraska Avenue to 7th Avenue into Historic Ybor. It also includes the extension of the Green Spine separated cycle track on Nuccio Parkway and East 12th Avenue from 7th Avenue to 13th Avenue.
The Tampa Historic Streetcar System is a 2.7-mile-long streetcar transportation network that provides a unique connection from downtown Tampa and the Channelside District to the Ybor City historic district. In the past, the system had been used mainly by tourists; however the City of Tampa is exploring a future for the streetcar as a true transportation option that better serves the mobility needs of residents, workers, visitors, and students in

Historic Ybor City, Tampa
Photo Courtesy of Visit Tampa Bay
downtown Tampa, Ybor City, Channel District, and surrounding urban neighborhoods. The City has been conducting a public transportation feasibility study and project development activities to expand and modernize the Tampa Streetcar system in partnership with the Florida Department of Transportation (FDOT) and the Hillsborough Area Regional Transit Authority (HART). The InVision Tampa Streetcar project is supported byfunding from the City of Tampa, HART, and FDOT, with potential for Federal funding through the Federal Transit Administration's (FTA) Small Starts Capital Improvement Grant program. Project activities include intensive public engagement and close coordination with other local and regional transit initiatives.
ANCHOR DEVELOPMENT


AMALIE ARENA – A multi-purpose arena that is used for ice hockey, basketball, arena football, and concerts. It is home to the Tampa Bay Lightning of the National Hockey League.
TAMPA CONVENTION CENTER – A 600,000-square-foot meeting and convention facility with unique architectural design and waterfront view.
TAMPA RIVERWALK – A 2.6-mile-long open space and pedestrian trail development along the Hillsborough River in downtown Tampa.
YBOR CITY HISTORIC DISTRICT – Listed in the National Register of Historic Places, this area is home to specialty shops, the Tampa Baseball Museum, and numerous restaurants.
DOWNTOWN RIVER ARTS NEIGHBORHOOD ASSOCIATION – A thriving cultural arts district along the waterfront, and home to the Tampa Museum of Art, Curtis Hixon Waterfront Park, and the Tampa Theater.


Urban

POPULATION:


AGE DISTRIBUTION: RACIAL


HOUSEHOLD INCOME:


HOUSING CHARACTERISTICS: EMPLOYMENT & BUSINESS: INDUSTRY BY SECTOR:
2,700 Total Businesses 78,040 Total Employees 15.0 Employee/Population 5.4% Household Unemployment


INCOME CHARACTERISTICS:

$50,880 Median Household Income
$41,130 Median Disposable Income
$48,620 Per Capita Income
SPENDING: INFLOW/OUTFLOW:


CHARACTERISTICS
The Urban Core sub-district has over 31.5 million square feet of developed buildings on nearly 1,540 acres of land. The total building supply within the sub-district is made up primarily of commercial property use, closely followed by public and governmental buildings. Combined, these property uses comprise approximately 77% of the total building supply within the sub-district. Comparatively, the majority of the land within the sub-district is made up of public and government land uses, at 75% of the total acres. Industrial space captures the smallest share of building area and land area within the sub-district.
The market value per acre is greatest within the Urban Core sub-district, compared with the other Tampa sub-districts, due to the Urban Core's proximity to the waterfront. This sub-district also encompasses Downtown, CentralPark and Ybor—areas that continually build its reputation as
a high-caliber urban center featuring quality residential, commercial, and recreational assets.
As of year-end 2021, the Urban Core sub-district's residential market is performing at an average market value per acre of approximately 508% greater than that of the City of Tampa's residential market. Additionally, the commercial market within the sub-district is also performing at an average market value per acre significantly greater than that of the City's commercial market, at nearly 576%.
In addition, the average floor area ratio—the relationship between a building's total floor area and the size of the lot that the building is located on—is greatest within the Urban Core's commercial market, closely followed by the sub-district's residential market.


Historic Ybor City, Tampa
Photo Courtesy of Visit Tampa Bay
GAS WORX
URBAN CORE | PRIORITY PROJECTS
7TH AVE GATEWAY
The Gas Worx project will consist of 50 acres of new apartments, office and retail space. The new neighborhood, planned to include as many as 5,000 homes, 500,000 square feet of office space and 150,000 square feet of retail, would connect Ybor City with the Channel District. Another major component of the development includes the concept of transit-oriented development. Plans include a new TECO Line Streetcar station, and there is also the potential of incorporating a Brightline station. Brightline is the high-speed rail company that is currently building a rail line between Orlando and Tampa; although Brightline has not disclosed where the Tampa station would be, the company has expressed interest in Ybor. There is also the possibility of the Tampa Bay Rays building a new stadium there, as the team has previously considered building a stadium in Ybor.


The E. 7th Avenue Lighted Archway system was originally envisioned as a temporary installation in 1991 during the District's Centennial celebration. The decorative overhead lighting has grown to be an important public realm element to the public. The lighting is maintained by TECO, and the age of the system necessitates its replacement. The goal of the project is to remove the existing arches and add permanent archway structures with lights that match the existing aesthetics of the district. This also is an opportunity to switch to more environmentally conscious LED technology. Each of the 24 archways will consist of two black powder-coated poles (one on each side of the street) supporting a 34-foot-long aluminum arch with a decorative ‘Y’ medallion in the center. In an additional effort to be environmentally conscious, the entire archway system will be equipped with a daylight sensor that automatically will turn on the lights at dusk and turn them off at dawn.
CENTENNIAL PARK
A 1.5-acre park, located at 1800 E. 8th Avenue in the District, honors historical figures with statues and plaques. It houses the Ybor Art Studio and the Ybor City Saturday Market. The Park has restrooms, seating, sound system, and is routinely utilized for public events. Facility improvements are needed to eliminate structural damage to monuments, as well as enhance access and landscaping.

Gas Worx Conceptual Development Plan
Gas Worx Conceptual Development Plan
Centennial Park Statue
BRICK STREET RE-ESTABLISHMENT
The Ybor City Development Corporation (YCDC) staff has explored the potential to restore or construct new brick street segments, enhance intersections, and/or add accents to crosswalk locations. Costs for such improvements have not yet been determined, as localized conditions vary substantially. A continued interest in brick re-establishment will probably not subside, as it is authentic to the original District conditions.
STREETCAR EXPANSION
An extension of the streetcar line is planned from the Downtown Tampa Whiting Street end of the line, northward to Palm Avenue into the Tampa Heights neighborhood. This comes as the Urban Core continues to experience growth in development and redevelopment, which requires transportation solutions. Expanding and modernizing the streetcar, at a cost of $234 million, would include sleeker, larger, and faster cars that would roll on a longer streetcar system. The project would include:
1. Replacement of the existing replica streetcar vehicles with modern streetcar vehicles.
2. Construction of a 1.3-mile fixed guideway with overhead power within existing rights-of-way from the western terminus of the existing system through the core of Downtown Tampa to Tampa Heights.
3. Construction of stops along the extension guideway.
4. Modifications to the existing 2.7-mile alignment guideway, power system, and stops to support modern streetcar operations.
5. Modifications to the existing vehicle maintenance and storage facility to accommodate the new vehicles.

ENCORE! TAMPA
This city-within-a-city was designed as a walkable community with mixed uses, including shops, offices, schools, and park space. Since 2009, Encore! Tampa has risen in a gradual crescendo of activity on the northern edge of downtown, and will add three new apartment developments soon.
▪ The Independent at ENCORE!: six-story, 288-unit market-rate apartment complex. Amenities include a fitness center, clubhouse, resort-style pool, and an overlooking lounge area with retail space offered on the ground floor.
▪ Legacy ENCORE!: five-story, 228 marketrate apartment complex. The complex is designed to provide spaces to both unwind, as well as caters to a more active lifestyle featuring a variety of activities. Amenities include a state-of-the-art fitness center with a yoga/spin bike studio, a bike repair shop, a saltwater pool, outdoor living room lounge area, a dog run, pet spa, and more.
▪ The Adderley: building is designed to be eight stories tall and feature 106 market-rate, multi-sized, family-friendly apartments located above 22,000-squarefoot grocery store.


Streetcar in Ybor City
URBAN CORE | TRACT 120570039.00
ABOUT THIS CENSUS TRACT


The Opportunity Zone (Census Tract 120570039.00) is part of the Urban Core sub-district within the City of Tampa. The tract is approximately 410 acres, and is accessible by major thoroughfares, such as I-4, I-275, and S.R. 618. This tract contains three CRAs, which includes the the Central Park CRA, Ybor City 1 CRA, and Ybor City 2 CRA.
This tract is almost fully encompassed by the Historic Ybor District, listed as a U.S. National Historic Landmark District in December 1990, to preserve and maintain the historic architect of the building structures built during its peak industrial years. The district's vibrant character is defined by the community's blend of cultures from European, Asian, and Cuban immigrants who settled there to support the region's once-booming cigar industry brought to Tampa in the late 19th and early 20th centuries.
As of year-end 2021, this census tract within the Urban Core sub-district has over 6.6 million square feet of developed buildings on nearly 355 acres of land. Commercial properties comprise the majority of building space within this census tract, at 34%. Whereas, other public and governmental designated land areas comprise the majority of land acreage within this tract, at 50%.
The Urban Core ROI Model revealed that there are 15 properties prime for redevelopment, and 12 for-sale investment properties as of year-end 2021 within this census tract.
COMMUNITY INVESTMENT
In furtherance of the Ybor CRA Plan, the CRA approved two Façade Grants for historic properties, resulting in $156,700 of private investment leveraged with $82,500 in Tax Increment Finance dollars. In addition, new economic development grant programs were recently established.
Community improvement projects enhance this Opportunity Zone to attract people and businesses alike. CRA improvement projects totaled approximately $425,000, and included the following projects: Ybor sign repairs/replacements; pedestrian and traffic system enhancements; Centennial Park and sidewalk tree replacements; 7th Avenue street amenity and paver repairs; enhanced landscape and irrigation to Palm Avenue medians; and repairs to the Palm Avenue Monument. Additionally, the N. 21st St. / N. 22nd St. oneway pairs have been reconstructed to now include bike lanes, widened sidewalks, on-street parking, accented crosswalks, and street furnishings.
The City of Tampa’s Green Spine Cycle Track is one of the many Vision Zero initiative projects. It currently runs through Downtown, and is being expanded within this Opportunity Zone to provide for a bi-directional cycle track along Nuccio Parkway. Restoration of two primary parking garages within this Opportunity Zone are also underway— Centro Ybor and Palm Avenue.
FDOT will also be enhancing mobility within this Opportunity Zone as part of their I-275/I-4 Improvement project. Construction is expected to begin in 2023, and will include changing the eastbound exit ramps from I-4 into Ybor City/ East Tampa by providing access at 14th/15th Streets, as well as widening the existing eastbound frontage road (13th Ave.) to two lanes.
NOTABLE PROJECTS


1 2 3 4

CASA SOCARRAS – A four-story, 25,300-squarefoot commercial office addition; a newly renovated, mixed-use building in the heart of the Ybor business and entertainment district.
CASA OLIVA – This circa 1800s cigar factory has been restored to its original splendor and converted into a modern apartment building.
HOTEL HAYA – Incorporating the restoration of two historic buildings is this 178-room boutique hotel located on 7th Avenue.
GERMAN AMERICAN CLUB – Metro Inclusive Health worked extensively to restore the historic German American Club building which originally opened in 1909. Now, fully revitalized, the building, is home to Metro Inclusive Health's new facility, as well as dozens of social programs and community events.
PROPERTY CHARACTERISTICS | YEAR-END 2021
POPULATION:
HOUSING CHARACTERISTICS: EMPLOYMENT & BUSINESS:
AGE DISTRIBUTION: RACIAL MAKEUP:
HOUSEHOLD INCOME: INCOME CHARACTERISTICS:


$41,940 Median Household Income
$35,650 Median Disposable Income

CONSUMER SPENDING:
ABOUT THIS CENSUS TRACT
This Opportunity Zone (Census Tract 120570040.00) is part of the Urban Core sub-district within the City of Tampa. The tract is approximately 102 acres, and is accessible by major thoroughfares, such as I-4, I-275, and S.R. 45. This tract also contains the Central Park CRA.
This tract is commonly referred to as Central Park— boasting great views of Downtown and convenient access to Tampa’s urban job center, Ybor City, and the Channel District. Central Park is emerging with new residences, business opportunities and great recreational amenities. In addition, this tract is also home to ENCORE!— Downtown Tampa's Tempo District, a 40-acre, mixed-use redevelopment district with the vision to bring sustainable urban design, housing, commerce, and LEED certified construction throughout the Central Park neighborhood.
As of year-end 2021, this census tract within the Urban Core sub-district has nearly 1.3 million square feet of developed buildings on nearly 355 acres of land. Institutional properties comprise the majority of building space within this census tract, at 62%. Whereas, other public and governmental designated land areas comprise the majority of land acreage within this tract, at 65%.
The Urban Core ROI Model revealed that there are 6 forsale investment properties as of year-end 2021 within this census tract.
Continued market demand for a more diverse urban environment for residents and businesses has been realized within this Opportunity Zone, and the partnership with the Tampa Housing Authority (THA) is actively engaged in meeting that demand. With the encouragement of the City and THA, the development environment in the Central Park Area is promising, particularly for residential and retail commercial uses that serve regional demand.
The City of Tampa’s Green Spine Cycle Track is one of the many Vision Zero initiative projects. It currently runs through Downtown, and is being expanded within this Opportunity Zone to provide for a bi-directional cycle track along Nuccio Parkway from Nebraska Avenue to 7th Avenue into Historic Ybor. It also includes the extension of the Green Spine separated cycle track on Nuccio Parkway and East 12th Avenue from 7th Avenue to 13th Avenue.
FDOT will also be enhancing mobility within this Opportunity Zone as part of their I-275/I-4 Improvement project. Construction is expected to begin in 2023, and will include changing the eastbound exit ramps from I-4 into Ybor City/ East Tampa by providing access at 14th/15th Streets instead of N. 21st/N. 22nd Streets, as well as widening the existing eastbound frontage road (13th Ave) to two lanes..
1

MEACHUM URBAN FAR – The CRA and THA partnered with Meachum Urban Farm LLC to create an urban farm for education and awareness in the district, located at 1108 E. Scott Street.
2

3

TAMPA PARK APARTMENTS – Redeveloped into a much larger, mixed-use community that will encompass multiple CRA districts, including Central Park, Ybor, and Downtown.
THE ENCORE! – The ENCORE! District is home to numerous senior and apartment housing developments: the Perry Harvey Park, Meacham Urban Farm, GTE Job and Business Training Center, and an LEED Certified Solar Park and Chiller Plant, as well as public art that celebrates the neighborhood's heritage. New projects within the Encore! include:
▪ The Adderley at Encore!, a composite structure of retail, grocery, and 106 residential units.
▪ The Independent at Encore!, a new residential building with 288 market rate residential units.
▪ The Legacy at Encore!, a mixed-income apartment with 224 residential units.
POPULATION:
HOUSING CHARACTERISTICS: EMPLOYMENT & BUSINESS:
AGE DISTRIBUTION:


URBAN CORE | TRACT
ABOUT THIS CENSUS TRACT
COMMUNITY
In furtherance of the Downtown CRA Plan, the CRA continued funding its successful programs, such as:
This Opportunity Zone (Census Tract 120570051.01) is part of the Urban Core sub-district within the City of Tampa. The tract is approximately 467 acres, and is bounded by the Hillsborough River and Garrison Channel on the west and south sides. This tract encompasses the Downtown Core and Non Core CRAs.
Within this tract is the Downtown River Arts Neighborhood Association (DRANA), a thriving cultural arts district along the waterfront with the mission to represent, prioritize, and facilitate the needs of Tampa's downtown residents and businesses. Major buildings and attractions located within this tract include the Tampa Convention Center, Hillsborough County Clerk of Courts, Tampa Downtown Partnership, Amalie Arena, Curtis Hixon Waterfront Park, Tampa Theatre, and the Tampa Riverwalk.
As of year-end 2021, this census tract within the Urban Core sub-district has nearly 23.7 million square feet of developed buildings on over 1,029 acres of land. Commercial properties comprise the majority of building space within this census tract, at 50%. Whereas, other public and governmental designated land areas comprise the majority of land acreage within this tract, at 86%.
The Urban Core ROI Model revealed that there are three properties prime for redevelopment, and four for-sale investment properties as of year-end 2021 within this census tract.
▪ Commercial Facade Grant Program.
▪ Improvements to Riverwalk at Cass Street Bridge near the Straz Performing Arts Center.
▪ Land acquisition for affordable mixed-use redevelopment in north end of Downtown.
▪ $986,000 towards Master Infrastructure Agreement with Strategic Planning Partners.
▪ Assisting developers with development and permitting processes.
Community investment is strong within this Opportunity Zone. The CRA collaborated with the Tourist Development Council to fund a $30 million renovation of the Tampa Convention Center, which includes multiple Riverwalk improvements and the redevelopment of The Sail Plaza.
This Opportunity Zone is the location of an autonomous vehicle program launched by HART, utilizing the Marion Transitway as a primary route through Downtown. In addition, the CRA purchased the Army/Navy store on Tampa Street for a future affordable housing/mixed-use redevelopment in the north end of Downtown.
The Complete Streets Project is actively invested within this tract, including general maintenance and complete streets improvements to Tampa Street, Florida Avenue, Whiting
Street, Franklin Street, Ashley Drive, and Brorein Street. This project will allow for resurfacing of these roadways to remove deficiencies and provide a newly finished driving surface; as well as multimodal improvements to make these corridors safer for all users, in accordance with the City’s Vision Zero initiative.
1

JW MARRIOTT HOTEL – The 519-room hotel will dramatically expand Tampa Bay's capacity for conventions and high-end travelers. The 5-star hotel will include Tampa Bay's highest rooftop bar and 126,000 square feet of meeting space that will supplement the adjacent 600,000-square-foot Tampa Convention Center.
2

3

HYATT HOUSE & HYATT PLACE HOTEL – A dual flagged 17-story hotel offers 345 rooms, and is located minutes from Amalie Arena, Tampa Convention Center, and the Tampa Riverwalk.
HERON WATER STREET APARTMENTS – Located at the corner of Channelside Drive and Water Street is a new luxury apartment building featuring 420 rental units with a mix of 1-, 2-, and 3-bedroom apartments.
POPULATION:
HOUSING CHARACTERISTICS: EMPLOYMENT & BUSINESS:
AGE DISTRIBUTION: RACIAL MAKEUP:
HOUSEHOLD INCOME: INCOME CHARACTERISTICS:


$62,390 Median Household Income
$52,040 Median Disposable Income
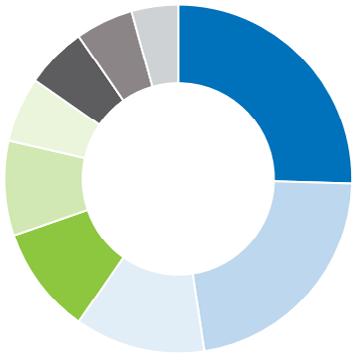
CONSUMER SPENDING:
W S t L o u i s S t
W S t J o h n S t
N A r m e n i a A v e N H o w a r d A v e
s t T a m p a m e n t a r y
URBAN CORE | OPPORTUNITY INDEX
N F r e m o n t A v e
W Col u m b u s D r
As of year-end 2021, the Investment and Redevelopment Opportunity Index model for the Urban Core revealed that there are approximately 19 properties prime for redevelopment, with a mix of commercial, industrial, and residential property uses; and 22 for-sale commercial properties and vacant lots also located within the sub-district.
O L D W E S T
S a l l e S t
R I D G E W O O D
P A R K
N O l a A v e
N B o u l e v a r d
W S t J o s e p h S t W 7th A v e
T A M P A
W W a l n u t S t
W S p r u c e S t
W U n i o n S t
N R o m e A v e
W C h e s t n u t S t
The following opportunity index map depicts the general clusters of specific redevelopment and investment properties within the Urban Core sub-district; these property uses include: Redevelopment Properties
Commercial Industrial/Flex Properties
Residential Investment Properties
W G r e e n S t
S t e w a r t M i d d l e
W E S T R I V E R
W R o s s A v e
W P a l m A v e
B l a k e H i g h
N J e f f e r s o n S t
E 1 1 t h A v
N F r a n k l i n S t
N M a r i o n S t
E K a y S
J U L I A N B
For-Sale Commercial & Vacant Lots
W G r a c e S t
W C y p r e s s S t
R I V E R F R O N T
W L e m o n S t
u d o b o n S t M P A
W C a r m e n S t W S t a t e S t S A
W N o r t h B S t
N A r m e n i a A v e S A r m e n i a A v e S H o w a r d A v e
S M o o d y A v e S M o o d y A v e
W S t a t e S t
N O R T H H Y D E P A R K
W F i g S t W Laurel St
W N o r t h B S t
W N o r t h A S t
N O r e g o n A v e
N W i l l o w A v e
S W e s t l a n d A v e
H O W A R D W E S T
S O U T H
N B o u l e v a r d N R o m e A v e 6 0 6 1 8 275
N N e w p o r t A v e N G i l c h r i s t A v e
L A N E
R I V E R F R O N T
P A R K
D a v i d A S tr a z J r
C e n te r Fo r Th e
P e r fo r m i n g A r ts
W C as s S t


U n i v e r s i ty o f Ta m p a & P l a n t
M u s e u m
H Y D E P A R K
S P A N I S H T O W N
C R E E K
S W i l l o w A v e
W S w a n n A v e
W D e L e o n S t
W B a y S t
B a y s h o r e
B o u l e v a r d
L i n e a r P a r k Tr a i l
W P l a t t S t
C S X C S X E Madison St E Ha r r i s o n S t E L a u r e l S t
REDEVELOPMENT & OPPORTUNITY INDEX MODEL PROPERTIES | YEAR-END 2021
EAST TAMPA | DISTRICT OVERVIEW
ABOUT EAST TAMPA COMMUNITY INVESTMENT
The East Tampa sub-district within the City of Tampa is approximately 2,477 acres and consists of six unique Opportunity Zones. The sub-district is accessible by major thoroughfares, such as I-4, I-275, S.R. 93, S.R. 574, S.R. 585, and S.R. 45. In addition, the East Tampa sub-district encompasses one CRA which includes the East Tampa CRA.
East Tampa is a culturally rich and historically diverse area of Tampa, ideally situated between Downtown, the Port of Tampa, and the University of South Florida. It also offers convenient access to three interstates and Tampa International Airport. Property values within the East Tampa area have increased more than 60% over the past 5 years, and the community continues to attract private investment throughout its 7.5-square-mile area. The East Tampa CRA is currently in the process of updating its Strategic Action Plan, which will be complete by year-end 2021. A central component of this Strategic Action Plan includes the leveraging of commercial and industrial resources available along the major corridors of Hillsborough Avenue and Columbus Drive and their connectivity via 40th Street.
The East Tampa sub-district contains 850 rental apartment units in 3 buildings that meet the minimum size criteria (market rate and mixed-income properties having at least 10 units). Within East Tampa, there are also 426,600 square feet of retail space, over 2.0 million square feet of industrial space, and 215,500 square feet of office space. The East Tampa sub-district has one of the greatest amounts of industrial space, as compared to the other sub-districts within the City of Tampa.
As of year-end 2021, the Investment and Redevelopment Opportunity Index model for the East Tampa sub-district revealed that there are approximately 155 properties prime for redevelopment, with a mix of commercial, industrial, and residential property uses; and 14 for-sale commercial properties and vacant lots also located within the sub-district. The East Tampa ROI Map is illustrated on pages 66-67.
East Tampa has been the focus of tremendous infrastructure investment by the City of Tampa and its many partners in transportation, water, wastewater, and stormwater. The Complete Infrastructure – East Tampa Neighborhood Improvements program provides for street resurfacing, sidewalks, and the design and installation of traffic calming devices, such as chicanes, deviators, bulbouts, medians, and raised intersections. Foundation for Tampa’s Neighborhoods Project – East Tampa Area will improve the City of Tampa’s water distribution system by replacing the existing water mains and increasing the capacity of the system. It will also improve the system’s ability to serve a growing population. Approximately 35,271 linear feet of water mains ranging from 2 to 12 inches in diameter will be replaced and upgraded. This project also provides for the replacement/rehabilitation of the wastewater collection system bounded by I-4, 26th St., MLK Blvd., and 37th St., and includes the replacement of approximately 15,000 ft of gravity sewers and the rehabilitation of 85,000 ft.
East Columbus Drive is a key corridor within East Tampa and is the focus of significant investment by the City and its many partners. The E. Columbus Drive project was identified as the fourth-highest priority walk-bike project, per the City of Tampa Walk-Bike Plan developed by the Hillsborough County Metropolitan Planning Organization
(MPO). The InVision Center City Plan also identified this segment of E. Columbus Drive as a key corridor to provide safe, walkable, and bikeable neighborhood connectivity. The design of this project prioritizes pedestrian safety; enhances the transit stops along the corridor; and provides cyclists with options, while maintaining vehicular capacity and on-street parking.
The 0.4-mile segment of Columbus Drive from Nebraska Avenue to 14th Street is a 2-lane arterial roadway with a posted speed of 30 mph and an average daily traffic volume of 10,210 vehicles per day. Reconfiguration of the roadway to 11-ft vehicle travel lanes with shared lane pavement markings for cyclists allows for improvements, including widening of sidewalks on both sides to approximately 8 feet along the corridor and approximately 15 feet at intersections; reconstruction of the relocated curbs and gutters; parking on both sides of the road; addition of street trees to both sides of the roadway; intersection and mid-block curb extensions with decorative crosswalks; and pedestrian actuated rectangular rapid flashing beacons (RRFB).
The City’s Vision Zero initiative has been the driving force behind many programs and projects being undertaken by the City. First implemented in Sweden in the 1990s, Vision Zero has proven successful across Europe. Now,

East Tampa Strategic Action Plan Rendering
Photo Courtesy of East Tampa CRA
it is gaining momentum in major American cities. The City’s Vision Zero initiative focuses on vulnerable road users (pedestrians, cyclists, etc.), schools, speeding, and speed management. Implementation of the City’s Vision Zero Action Plan includes safety projects on high priority corridors, citywide speed limit reduction programs, expansion of the City’s network of trails, greenways, safe crosswalks, and a citywide separated bike lane pilot program. The City of Tampa’s Green Spine Cycle Track is one of the many Vision Zero initiative projects. It currently runs through Downtown Tampa, as part of Mayor Castor’s Transforming Tampa’s Tomorrow platform. With a focus on Vision Zero, it is also being extended into East Tampa. This project provides for a bi-directional cycle track along 15th St. from Columbus Dr. to 21st Ave. EAST TAMPA SUB-DISTRICT
ANCHOR DEVELOPMENT

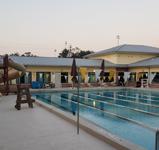


BELMONT HEIGHTS ESTATES – A 74-acre site containing 825 completed affordable rental units, 36 planned for-sale units, 4 community centers, and multiple open space areas distributed throughout the community.
CYRUS GREENE CENTER – A community center offering recreational activities and after school programs for the local neighborhoods.
J.C. NEWMAN CIGAR COMPANY – America's oldest family-owned premium cigar maker since 1895, headquartered in an iconic 111-year-old cigar factory, "El Reloj".
COVE BEHAVIORAL HEALTH – A communitybased provider of behavioral health services, serving Hillsborough, Polk, and surrounding counties.
HCPS INSTRUCTIONAL SERVICE CENTER –School district office for all of Hillsborough County Public Schools.


POPULATION:
HOUSING CHARACTERISTICS: EMPLOYMENT & BUSINESS:
499 Total Businesses
6,061 Total Employees
0.32 Employee/Population
11.5% Household Unemployment
AGE DISTRIBUTION: RACIAL
HOUSEHOLD INCOME:


INCOME CHARACTERISTICS:

$27,300
$24,100 Median Disposable Income
$13,300 Per Capita Income

6,573
The East Tampa sub-district has over 13.5 million square feet of developed buildings on nearly 1,935 acres of land. The total building supply within the sub-district is made up primarily of residential property uses, followed by institutional buildings. Combined, these property uses comprise approximately 69% of the total building supply within the sub-district. Comparatively, the majority of the land within the sub-district is also made up of residential land uses, at 39% of the total acres. Commercial space captures the smallest share of building area; whereas, industrial space captures the smallest share of land area within the sub-district.
The market value per acre is greatest within East Tampa's residential market, capturing 61% of the total market value within the sub-district. Comparatively, the market
value per acre in the commercial market captures only 8% of the total market value within East Tampa.
As of year-end 2021, the East Tampa sub-district's residential market is performing at an average market value per acre of approximately 56% less than that of the City of Tampa's residential market. Additionally, the commercial market within the sub-district is also performing at an average market value per acre significantly smaller than that of the City's commercial market, at nearly 97%.
In addition, the average floor area ratio—the relationship between a building's total floor area and the size of the lot that the building is located on—is greatest within East Tampa's industrial market, closely followed by the subdistrict's residential market.


Belmont Estates Housing Development Photo Courtesy of CBG Building Company
EAST TAMPA | PRIORITY PROJECTS
26TH AVENUE ENVIRONMENTAL PARK
The large approximately 11.5-acre stormwater pond on 26th Ave. between the community connector streets of 22nd and 26th Streets is an opportunity to improve quality of life for existing residences via CRA property enhancement and other homeownership programs. Underutilized properties can be redeveloped. There may be even an opportunity to reconfigure portions of the pond to allow for some development that can put "eyes on the park". Park street “edges” can be treated with multi-use trails directly connecting adjacent Jacksons Heights, College Hill/Belmont, and North Ybor Neighborhoods. Together, this new environmental feature makes sustainability visible and accessible to the entire East Tampa community, and sets a new standard urban ecology for future generations.


East
22ND STREET COMMERCIAL NODE
The East Tampa CRA has purchased the orange and blue "gator building" at Lake Ave. and 22nd Street, and adjacent vacant sites for future redevelopment. This provides an opportunity to develop a prototype for new corridor redevelopment on a smaller, neighborhood scale. This could include subsidized retail or business incubator space, community market, smallevent locations, and shared use mid-block parking lots to serve buildings that anchor key intersections.

COLUMBUS DRIVE
The Columbus Drive corridor presents a tremendous employment and placemaking opportunity within East Tampa. The presence of many underutilized industrial and light tech properties within immediate proximity to adjacent residential, transit, rail, and regional transportation can be capitalized as a distinct economic development area for East Tampa’s residents. Streets and Infrastructure can be improved to better serve the community and increase capacity.

EAST TAMPA | TRACT 120570031.00
This Opportunity Zone (Census Tract 120570031.00) is part of the East Tampa sub-district within the City of Tampa. The tract is approximately 320 acres, and is accessible by major thoroughfares, such as S.R. 93, S.R. 574 (Dr. Martin Luther King Jr. Blvd), and S.R. 585. This tract contains one CRA, which includes the East Tampa CRA.
Within this tract is the Ybor Heights neighborhood and the College Hill–Belmont Heights neighborhood, which contains the Belmont Heights Estates, a 74-acre site containing 825 completed affordable rental units, 36 planned for-sale units, 4 community centers, and multiple open space areas distributed throughout the community. This tract only encompasses Phase II of the Belmont Heights Estates.
As of year-end 2021, this census tract within the East Tampa sub-district has over 2.3 million square feet of developed buildings on nearly 265 acres of land. Residential properties comprise the majority of building space and land area within this census tract, at 45% and 47%, respectively, of the total share.
The East Tampa ROI Model revealed that there are 46 properties prime for redevelopment, and one for-sale investment property as of year-end 2021 within this census tract.
This Opportunity Zone encompasses the Ybor Heights and College Hill-Belmont Heights Neighborhoods, and is contained within the vast 7.5-square-mile East Tampa CRA.
As previously referenced, Phase II of the Belmont Heights Estates is within this tract. This award-winning community reconnected the surrounding East Tampa neighborhood by introducing an extensive network of through streets and sidewalks. This redevelopment was seeded by the award of a $32.5 million 1997 HOPE VI Revitalization Grant to the Tampa Housing Authority from the U.S. Department of Housing and Urban Development, and implemented through a public-private partnership between Tampa Housing Authority and Michaels Development Company.
Community investment is strong within this Opportunity Zone. A quick build project, the 14th Street Complete Street Project, is currently in design, with construction expected in 2022. This project will provide for complete street roadway improvements to enhance safety and multimodal connectivity along the 14th Street corridor from E. Columbus Drive to MLK Blvd.
FDOT will also be enhancing mobility within this Opportunity Zone as part of their I-275/I-4 Improvement project. Construction is expected to begin in 2023, and will include adding an additional merge lane on northbound I-275 between I-4 and the MLK Blvd. exit.
1

EAST TAMPA STRATEGIC PRIORITIES – The East Tampa 2021 Strategic Plan Update for the East Tampa CRA provides a guiding Framework of 10 Community Strategic Priorities and Themes that both describe the characteristics of East Tampa CRA today, while informing the Vision and Strategic Areas of Focus for the next 5 years and beyond. These strategic priorities will also help shape the future projects within the East Tampa CRA. These themes include:
▪ Residential investment and home repair opportunities.
▪ Neighborhood beautification and appearance.
▪ Community health and safety.
▪ Infrastructure and stormwater management.
▪ Livable streets and transportation.
▪ Parks, recreation, and programs.
▪ Community commercial services.
▪ Education, employment, and job creation.
▪ Culture marketing and promotion.
▪ Leadership, partnership, and capacity.
PROPERTY CHARACTERISTICS | YEAR-END 2021
POPULATION: HOUSING CHARACTERISTICS: EMPLOYMENT & BUSINESS:
INCOME:


$31,450

CONSUMER SPENDING:
This Opportunity Zone (Census (Tract 120570032.00) is part of the East Tampa sub-district within the City of Tampa. The tract is approximately 205 acres, and is accessible by major thoroughfares, such as I-4, I-275, and S.R. 45. This tract contains the East Tampa CRA.
This tract is fully encompassed by the V. M. Ybor Neighborhood, named after Spanish immigrant Vicente Martinez Ybor, who founded Ybor City's Cigar Industry in 1885. The neighborhood contributes to the Ybor City National Historic Landmark District, and is one of Tampa’s most historic and diverse neighborhoods. The area is centrally located, with many of the homes, commercial buildings, parks, and cigar factories finding a renewed life. Many of the historic structures have been restored and are now functioning as architectural firms, social media and technology businesses, and consulting corporations.
As of year-end 2021, this census tract within the East Tampa sub-district has over 1.5 million square feet of developed buildings on nearly 146 acres of land. Residential properties comprise the majority of building space and land area within this census tract, at 84% and 71%, respectively, of the total share.
The East Tampa ROI Model revealed that there are 11 properties prime for redevelopment, and two for-sale investment properties as of year-end 2021 within this census tract.
| TRACT 120570032.00
COMMUNITY INVESTMENT
Community investment is strong within this Opportunity Zone; the East Columbus Drive Project focuses on the 0.4-mile segment of Columbus Drive from Nebraska Avenue to 14th Street. The project focuses on the reconfiguration of the roadway to 11-ft vehicle travel lanes with shared lane pavement markings for cyclists. Additional improvements include widening of sidewalks on both sides to approximately 8 feet along the corridor and approximately 15 feet at intersections; reconstruction of the relocated curbs and gutters; parking on both sides of the road; addition of street trees to both sides of the roadway; intersection and mid-block curb extensions with decorative crosswalks; and pedestrian actuated rectangular rapid flashing beacons (RRFB). Additionally, the 14th Street Complete Street Project (E. Columbus Drive to MLK Blvd.) is quick build project providing for complete street roadway improvements to enhance safety and multimodal connectivity.
FDOT will also be enhancing mobility within this Opportunity Zone as part of their I-275/I-4 Improvement project. Construction is expected to begin in 2023, and will include changing the eastbound exit ramps from I-4 into Ybor City/ East Tampa by providing access at 14th/15th streets instead of N. 21st/ N. 22nd Streets, as well as adding an additional merge lane on northbound I-275 between I-4 and the MLK Blvd. exit.
STRATEGIC PRIORITIES
1
EAST TAMPA STRATEGIC PRIORITIES – The East Tampa 2021 Strategic Plan Update for the East Tampa CRA provides a guiding Framework of 10 Community Strategic Priorities and Themes that both describe the characteristics of East Tampa CRA today, while informing the Vision and Strategic Areas of Focus for the next 5 years and beyond. These strategic priorities will also help shape the future projects within the East Tampa CRA. These themes include:
▪ Residential investment and home repair opportunities.
▪ Neighborhood beautification and appearance.
▪ Community health and safety.
▪ Infrastructure and stormwater management.
▪ Livable streets and transportation.
▪ Parks, recreation, and programs.
▪ Community commercial services.
▪ Education, employment, and job creation.
▪ Culture marketing and promotion.
▪ Leadership, partnership, and capacity.
POPULATION: HOUSING CHARACTERISTICS: EMPLOYMENT & BUSINESS:
INCOME:


$25,400

CONSUMER SPENDING:

EAST TAMPA | TRACT
This Opportunity Zone (Census Tract 120570033.00) is part of the East Tampa sub-district within the City of Tampa. The tract is approximately 198 acres, and is accessible by the I-4 major thoroughfare. This tract contains the East Tampa CRA.
This tract features the J.C. Newman Cigar Company, America's oldest family-owned premium cigar maker since 1895. J.C. Newman is headquartered in an iconic 111-year-old cigar factory, "El Reloj", in historic Ybor City. In addition, the Perfecto-Garcia Cigar Factory, a historic industrial building, currently operates as an office building within this tract. Also located within this tract is Phase I of the Belmont Heights Estates, a 74-acre site containing 825 completed affordable rental units, 36 planned forsale units, 4 community centers, and multiple open space areas distributed throughout the community.
As of year-end 2021, this census tract within the East Tampa sub-district has over 1.5 million square feet of developed buildings on about 143 acres of land. Residential properties comprise the majority of building space and land area within this census tract, at 57% and 47%, respectively, of the total share.
The East Tampa ROI Model revealed that there are 6 properties prime for redevelopment as of year-end 2021 within this census tract.
COMMUNITY INVESTMENT
As previously referenced, Phase I of the Belmont Heights Estates is within this tract. This award-winning community reconnected the surrounding East Tampa neighborhood by introducing an extensive network of through streets and sidewalks. This redevelopment was seeded by the award of a $32.5 million 1997 HOPE VI Revitalization Grant to the Tampa Housing Authority from the U.S. Department of Housing and Urban Development, and implemented through a public-private partnership between Tampa Housing Authority and Michaels Development Company.
Community investment is strong within this Opportunity Zone. The City of Tampa’s Green Spine Cycle Track is one of the many Vision Zero initiative projects. It currently runs through Downtown Tampa, as part of Mayor Castor’s Transforming Tampa’s Tomorrow platform. With a focus on Vision Zero, it is also being extended into East Tampa. This project provides for a bi-directional cycle track along 15th St. from Columbus Dr. to 21st Ave.
FDOT will also be enhancing mobility within this Opportunity Zone as part of their I-275/I-4 Improvement project. Construction is expected to begin in 2023, and will include changing the eastbound exit ramps from I-4 into Ybor City/East Tampa by providing access at 14th/15th Streets instead of N. 21st/ N. 22nd Streets.
STRATEGIC PRIORITIES
EAST TAMPA STRATEGIC PRIORITIES – The East Tampa 2021 Strategic Plan Update for the East Tampa CRA provides a guiding Framework of 10 Community Strategic Priorities and Themes that both describe the characteristics of East Tampa CRA today, while informing the Vision and Strategic Areas of Focus for the next 5 years and beyond. These strategic priorities will also help shape the future projects within the East Tampa CRA. These themes include:
▪ Residential investment and home repair opportunities.
▪ Neighborhood beautification and appearance.
▪ Community health and safety.
▪ Infrastructure and stormwater management.
▪ Livable streets and transportation.
▪ Parks, recreation, and programs.
▪ Community commercial services.
▪ Education, employment, and job creation.
▪ Culture marketing and promotion.
▪ Leadership, partnership, and capacity.
PROPERTY CHARACTERISTICS |
POPULATION:
HOUSING CHARACTERISTICS: EMPLOYMENT & BUSINESS:
HOUSEHOLD INCOME: INCOME CHARACTERISTICS:


CONSUMER SPENDING:
COMMUNITY INVESTMENT
As previously referenced, Phase III of the Belmont Heights Estates is within this tract. This award-winning community reconnected the surrounding East Tampa neighborhood by introducing an extensive network of through streets and sidewalks. This redevelopment was seeded by the award of a $32.5 million 1997 HOPE VI Revitalization Grant to the Tampa Housing Authority from the U.S. Department of Housing and Urban Development, and implemented through a public-private partnership between Tampa Housing Authority and Michaels Development Company.
This Opportunity Zone (Census Tract 120570034.00) is part of the East Tampa sub-district within the City of Tampa. The tract is approximately 224 acres, and is accessible by the S.R. 574 major thoroughfare. This tract also contains the East Tampa CRA.
Within this tract is the College Hill–Belmont Heights neighborhood, which contains Phase III of the Belmont Heights Estates, a 74-acre site comprising 825 completed affordable rental units, 36 planned for-sale units, 4 community centers, and multiple open space areas distributed throughout the community.
This tract also contains some of the Jackson Heights neighborhood which features the Jackson Heights NFL YET Center, a safe place for youth, adults, and seniors in the East Tampa Community. This center features a recreation center, gym, playground, ball fields, and play courts.
As of year-end 2021, this census tract within the East Tampa sub-district has nearly 1.9 million square feet of developed buildings on about 234 acres of land. Residential properties comprise the majority of building space and land area within this census tract, at 62% and 51%, respectively, of the total share.
The East Tampa ROI Model revealed that there are 21 properties prime for redevelopment as of year-end 2021 within this census tract.
Community investment is strong within this Opportunity Zone; the Complete Streets and Safety Improvement Project provides for safety and complete streets improvements and on-street bicycle facilities throughout the 34th Street corridor from Columbus Drive to US92. This project represents an investment of over $5 million into the City’s infrastructure and was completed in 2021.
FDOT will also be enhancing mobility within this Opportunity Zone in the form of intersection improvements at the intersection of MLK Blvd. and N. 22nd Street. Construction is expected to begin in 2022, and will include lengthening the northbound left-turn lane from 22nd Street onto westbound MLK Blvd. The traffic signal will also be changed to provide protected/permissive northbound/ westbound left turns.
CHARACTERISTICS
STRATEGIC PRIORITIES
EAST TAMPA STRATEGIC PRIORITIES – The East Tampa 2021 Strategic Plan Update for the East Tampa CRA provides a guiding Framework of 10 Community Strategic Priorities and Themes that both describe the characteristics of East Tampa CRA today, while informing the Vision and Strategic Areas of Focus for the next 5 years and beyond. These strategic priorities will also help shape the future projects within the East Tampa CRA. These themes include:
▪ Residential investment and home repair opportunities.
▪ Neighborhood beautification and appearance.
▪ Community health and safety.
▪ Infrastructure and stormwater management.
▪ Livable streets and transportation.
▪ Parks, recreation, and programs.
▪ Community commercial services.
▪ Education, employment, and job creation.
▪ Culture marketing and promotion.
▪ Leadership, partnership, and capacity.
POPULATION: HOUSING CHARACTERISTICS: EMPLOYMENT & BUSINESS:
INCOME:


CONSUMER SPENDING:
| TRACT
COMMUNITY INVESTMENT
Investing in neighborhood redevelopment is a high priority in each of Tampa's eight CRAs. From Downtown to Drew Park, redevelopment activity is helping to make Tampa's neighborhoods more attractive, safe, convenient, environmentally healthy, and economically strong.
This Opportunity Zone (Census Tract 120570035.00) is part of the East Tampa sub-district within the City of Tampa. The tract is approximately 390 acres, and is accessible by the I-4 major thoroughfare. This tract contains the East Tampa CRA.
This tract features special neighborhood districts, such as the Jackson Heights neighborhood; as well as the North Ybor neighborhood, a community organization of local residents and businesses working together to better the portion of Ybor City which lies north of I-4. A major green space within this tract is the Alfred "Al" Barnes Park, which includes ball fields, tennis/racquetball courts, and a playground. There is also large industrial and warehouse park in the southeast corner of the tract that features nearly 790,000 square feet in 27 individual properties.
As of year-end 2021, this census tract within the East Tampa sub-district has over 2.2 million square feet of developed buildings on nearly 359 acres of land. Residential properties comprise the majority of building space within this census tract, at 56%. Whereas, other public and governmental designated land areas comprise the majority of land acreage within this tract, at 39%.
The East Tampa ROI Model revealed that there are 26 properties prime for redevelopment, and one for-sale investment properties as of year-end 2021 within this census tract.
Community investment is strong within this Opportunity Zone. The Complete Infrastructure—East Tampa Neighborhood Improvements program provides for street resurfacing, sidewalks, and the design and installation of traffic calming devices, such as chicanes, deviators, bulbouts, medians, and raised intersections.
Investment in the water/wastewater infrastructure within this Opportunity Zone is substantial; Foundation for Tampa’s Neighborhoods Project – East Tampa Area will improve the City of Tampa’s water distribution system by replacing the existing water mains and increasing the capacity of the system. This project provides for the replacement/rehabilitation of the wastewater collection system bounded by I-4, 26th St., MLK Blvd., and 37th St.
Additionally, the Holmes Street project, will replace the aging water mains in this area and improve water pressure and water quality, while reducing the number of service interruptions.
STRATEGIC PRIORITIES
EAST TAMPA STRATEGIC PRIORITIES – The East Tampa 2021 Strategic Plan Update for the East Tampa CRA provides a guiding Framework of 10 Community Strategic Priorities and Themes that both describe the characteristics of East Tampa CRA today, while informing the Vision and Strategic Areas of Focus for the next 5 years and beyond. These strategic priorities will also help shape the future projects within the East Tampa CRA. These themes include:
▪ Residential investment and home repair opportunities.
▪ Neighborhood beautification and appearance.
▪ Community health and safety.
▪ Infrastructure and stormwater management.
▪ Livable streets and transportation.
▪ Parks, recreation, and programs.
▪ Community commercial services.
▪ Education, employment, and job creation.
▪ Culture marketing and promotion.
▪ Leadership, partnership, and capacity.
POPULATION: HOUSING CHARACTERISTICS: EMPLOYMENT & BUSINESS:
HOUSEHOLD INCOME:


$31,530
$26,580 Median Disposable Income


CONSUMER SPENDING:
EAST TAMPA | TRACT 120570036.00
COMMUNITY INVESTMENT
This Opportunity Zone (Census Tract 120570036.00) is part of the East Tampa sub-district within the City of Tampa. The tract is approximately 1,011 acres, and is accessible by major thoroughfares, such as I-4 and S.R. 574. This tract is bounded by the CSX Railroad on the west side, and contains the East Tampa CRA.
This tract features special neighborhood districts, such as the Grant Park and Highlands Park neighborhoods. Within these communities is multiple green spaces and attractions, such as the Skatepark of Tampa, Highland Pines Park, and Grant Park. In addition, this tract comprises multiple public and government buildings, such as the Hillsborough County School District, the City of Tampa Public Works Department, and the Community Housing Solutions Center.
As of year-end 2021, this census tract within the East Tampa sub-district has over 4.0 million square feet of developed buildings on about 789 acres of land. Residential properties comprise the majority of building space and land area within this census tract, at 43% and 29%, respectively, of the total share.
The East Tampa ROI Model revealed that there are 45 properties prime for redevelopment and 7 for-sale investment properties as of year-end 2021 within this census tract.
Investing in neighborhood redevelopment is a high priority in each of Tampa's eight CRAs. From Downtown to Drew Park, redevelopment activity is helping to make Tampa's neighborhoods more attractive, safe, convenient, environmentally healthy, and economically strong.
In addition, the City of Tampa’s Foundation for Tampa’s Neighborhoods Design Build project includes water, wastewater, stormwater, and transportation improvements in multiple neighborhoods within the city’s limits as part of the Transforming Tampa’s Tomorrow initiative. The improvements for East Tampa are scheduled to be completed in Fall 2024, and include wastewater improvements by rehabilitating the existing gravity sewers and installation of new gravity sewers; water improvements by replacing water distribution pipelines; and transportation improvements by resurfacing some neighborhood roads, adding traffic calming elements, and constructing additional sidewalks to ensure neighborhood connectivity.
FDOT will also be enhancing mobility within this Opportunity Zone, with multiple projects planned, including: Columbus Drive and 40th Street Intersection Improvements; 40th Street at Melbourne Blvd. Intersection Improvements; MLK Blvd. Operational Improvements from 40th Street to I-4; and I-4 westbound widening from MLK Blvd. to 50th Street.
STRATEGIC PRIORITIES
EAST TAMPA STRATEGIC PRIORITIES – The East Tampa 2021 Strategic Plan Update for the East Tampa CRA provides a guiding Framework of 10 Community Strategic Priorities and Themes that both describe the characteristics of East Tampa CRA today, while informing the Vision and Strategic Areas of Focus for the next 5 years and beyond. These strategic priorities will also help shape the future projects within the East Tampa CRA. These themes include:
▪ Residential investment and home repair opportunities.
▪ Neighborhood beautification and appearance.
▪ Community health and safety.
▪ Infrastructure and stormwater management.
▪ Livable streets and transportation.
▪ Parks, recreation, and programs.
▪ Community commercial services.
▪ Education, employment, and job creation.
▪ Culture marketing and promotion.
▪ Leadership, partnership, and capacity.
PROPERTY CHARACTERISTICS | YEAR-END 2021
POPULATION: HOUSING CHARACTERISTICS: EMPLOYMENT & BUSINESS:
INCOME:


$32,200 Median Household Income
$27,640 Median Disposable Income $13,540 Per Capita Income


EAST TAMPA | OPPORTUNITY INDEX
W H i l l s b o r o u g h A v e
As of year-end 2021, the Investment and Redevelopment Opportunity Index model for East Tampa revealed that there are approximately 155 properties prime for redevelopment, with a mix of commercial, industrial, and residential property uses. In addition, there were 14 for-sale commercial properties and vacant lots also located within the sub-district.
E F r i e r s o n A v e
N 3 0 t h S t N 4 0 t h S t 41 41
E F r i e r s o n A v e
E W i l d e r A v e E W i l d e r A v e
R o m e A v e N R o m e A v e
The following opportunity index map depicts the general clusters of specific redevelopment and investment properties within East Tampa; these property uses include: Redevelopment Properties
Commercial Industrial/Flex Properties
C e n t r a l A v e
W D r M a r t i n L u t h e r K i n g J r B l v d S R9 3
W O h i o A v e
W P e n i n s u l a r S t
E N o r t h B a y S t N 1 3 t h S t
E I d a S t
E D r M a r t i n L u t h e r K i n g J r B l v d
U n i o n S t
Residential Investment Properties For-Sale Commercial & Vacant Lots
W A d a l e e S t
B o u l e v a r d
W Co l u m b u s D r
W F r a n c e s A v e W A m e l i a A v e
W P a r k A v e N O r e g o n A v e
B l a k e T r a i l
W V i r g i n i a A v e N M o r g a n S t
S R
H i g h l a n d A v e
T a m p a S t
E 2 8 t h A v e N A v o n A v e
E 2 4 t h A v e
E 2 1 s t A v e
N u c c i o P a r k w
1 6 t h S t
E 3 1 s t A v e
E 1 7 t h A v e E O s b o r n e A v e N 3 4 t h S t
E 2 8 t h A v e
E l l i c o t t S t N 2 9 t h S t N 2 6 t h S t N 3 1 s t S t E 2 4 t h A v e E 2 4 t h A v e N 1 8 t h S t N 1 8 t h S t
E 1 5 t h A v e
N 2 3 r d S t
N 2 4 t h S t
E C a r a c a s S t E 2 1 s t A v e
E C h e l s e a S t
E L a k e A v e N 1 9 t
N 3 3 r d S t
E 1 0 t h A v e
E S h a d o w l a w n S t N 3 9 t h S t
E 2 6 t h A v e N 4 0 t h S t
E 3 2 n d A v e
N 5 2 n d S t
4 3 r d S t
E 3 r d A v e E 3 r d A v e
E 1 0 t h A v e
Property Address Index Score
Redevelopment Properties
1 3801 N 15th St 95
2 1608 E Lake Ave 95
3 2005 E Dr Martin Luther King Jr Blvd 90
4 1510 E 28th Ave 90
5 1709 E Lake Ave 90
6 1603 E 33rd Ave 85
7 1602 E 31st Ave 85
8 1702 E 29th Ave 85
9 3743 N 15th St 80
10 3425 N 15th St 80
11 2701 N 34th St 80
12 3335 N 22nd St 80 13 4306 E Columbus Dr 80 14 3215 N 43rd St 80 15 3001 N 40th St 80 16 5401 E Dr Martin Luther King Jr Blvd 80
3703 E Dr Martin Luther King Jr Blvd 90 18 3411 Columbus Dr 90 19 2714 N 35th St 90
20 1710 E 29th Ave 85
21 1517 E 27th Ave 85
22 3615 E 21st Ave 80
23 3001 N 36th St 80
24 3722 N 42nd St 80
25 1100 Block E 32nd Ave 100
26 3410 Block N 10th St 100
27 1210 Block E 27th Ave 95
28 910 Block E 23rd Ave 95
29 1010 Block E 23rd Ave 95
30 1020 Block E 17th Ave 95
31 3710 Block N 35th St 95
32 3410 Block E Lake Ave 95
33 3410 Block E 24th Ave 95
34 3500 Block E 27th Ave 95
35 3010 Block N 39th St 95
36 3910 Block E Columbus Dr 95
37 3900 Block E 15th Ave 95
38 910 Block E 14th Ave 95
39 1100 Block E 32nd Ave 90 40 1000 Block E 32nd Ave 90 41 3500 Block Cone Ct 90
42 3410 Block N 10th St 90
43 3400 Block N 10th
146 4707 N Grady
147 4814 N Hale Ave
148 4415 North Lauber Way
149 3917 W South Ave
150 4701 N Hubert Ave Sources:
WEST TAMPA | DISTRICT OVERVIEW
ABOUT WEST TAMPA COMMUNITY INVESTMENT
The West Tampa sub-district within the City of Tampa is approximately 442 acres, and consists of two unique Opportunity Zones. The sub-district is split by the Hillsborough River in between the two census tracts. West Tampa encompasses two CRAs; these include the Tampa Heights Riverfront CRA and the West Tampa CRA.
West Tampa’s combination of the old and the new, residential and commercial, and easy access to I-275 makes it a prime location for investment. A portion of West Tampa is designated as a National Historic District, with many contributing structures, including cigar factories, African-American churches, city parks, and ethnic clubs as well as a stock of historic homes dating from the late 1900s and early 20th century. Specifically, the sub-district features the City's oldest suburb, the Tampa Heights neighborhood.
In addition, the West River Redevelopment Area, a 120acre mixed-use community features project and new developments in North Hyde Park, which illustrate the potential of West Tampa to share in the future economic growth of the Tampa real estate market. West Tampa, by its location between Downtown and West Shore, is a growing competitive factor in the Tampa housing and commercial real estate markets.
The West Tampa sub-district contains 825 rental apartment units in 4 buildings that meet the minimum size criteria (market rate and mixed-income properties having at least 10 units). Within West Tampa, there is also nearly 182,300 square feet of retail space, 146,700 square feet of industrial space, and 482,000 square feet of office space. The West Tampa sub-district contains the smallest share of retail and industrial, as compared to the other sub-districts within the City of Tampa.
As of year-end 2021, the Investment and Redevelopment Opportunity Index model for the West Tampa sub-district revealed that there are approximately 72 properties prime for redevelopment, with a mix of commercial, residential, and one industrial property uses; and zero forsale commercial properties and vacant lots located within the sub-district. The West Tampa ROI Map is illustrated on pages 78-79.
West Tampa has been the focus of tremendous infrastructure investment by the City of Tampa and its many partners in transportation, water, wastewater, and stormwater.
In early 2020, the City of Tampa submitted an application to the U.S. Department of Transportation to complete a package of mobility and safety improvements in the West River area. In Fall 2020, the City of Tampa received notice of a $24M award from the U.S. Department of Transportation under the Better Utilizing Investments to Leverage Development (BUILD) Transportation Discretionary Grant Program.
The West River Multimodal Safety & Network Improvements Project is a 6-mile project that involves completing the remaining gaps in what will be a 12.2mile multi-use pathway and installing enhanced, safe crossing features at major roadways. Several adjacent city streets will be enhanced to provide better sidewalks, bike facilities, and improved community safety. The project will expand connections and provide a variety of safe, accessible mobility options for pedestrians and bicyclists throughout the neighborhoods that make up the West River area.
Thanks to funding from local, state, and federal sources—along with grants and private donations— the majority of the multi-use trail network along the eastern and western sides of the Hillsborough River has been constructed. Only a few gaps remain to be
filled to complete the route. The incomplete multi-use path segments on the River's west side are Tony Jannus Park, H.B. Plant Park, the University of Tampa, Tampa Preparatory School, Howard W. Blake High School, Stewart Middle School, and Dr. Martin Luther King Jr. Recreation Center. Additionally, over-water crossings are needed to provide safe connectivity beneath the Platt Street Bridge, Brorein Street Bridge, and Kennedy Blvd. Bridge. The pedestrian underpasses will be similar to the existing pedestrian underpasses along the original eastside Riverwalk. Additional multi-use path improvements include site work, new/rehabilitated pavement, guard rails, pedestrian railing, lighting, landscaping, and seawall/shoreline repair or restoration.
A primary goal of the project is to provide safe walk/ bike connections to Downtown Tampa from adjacent neighborhoods, including North Franklin Street, Hyde Park, North Hyde Park, West Tampa, Riverside Heights, Bowman Heights, and Ridgewood Park.
In addition to the multimodal path along the river, the City of Tampa will construct Complete Street enhancements on adjacent street routes through the surrounding neighborhoods in order to improve access to multimodal connections and provide safe transportation alternatives. To support a low-stress network, the City plans to include on-street bike facilities, enhanced crosswalks, and pedestrian walkways. Vertical deflection features to limit speeding are also planned, such as raised intersections or crosswalks.

Armature Works
Photo Courtesy of Visit Tampa Bay
The Neighborhood Improvements Program provides for street resurfacing, sidewalks, and the design and installation of traffic calming devices, such as chicanes, deviators, bulb-outs, medians, and raised intersections. The Ridgewood Park neighborhood is bounded by North Blvd. on the east, Columbus Drive on the north, and the Hillsborough River on the south and west. The proposed Ridgewood Park Neighborhood Improvement project includes milling and resurfacing of 30,031 square yards of roadway; traffic-calming installments to improve public safety; community engagement to gain public feedback on traffic calming suggestions; re-profiling roads to improve drainage and mitigate standing water issues; ADA upgrade of non-compliant curb ramps; and full roadway reconstruction of N. Glenwood Dr. between Ross Ave. and W. Columbus Drive.
ANCHOR DEVELOPMENT

THE HEIGHTS – A 50-acre modernized waterfront property, with plans to develop the entire property into an entertainment, work space, shopping, and residential community. Completed/proposed projects include:
▪ Armature Works – a re-purposed warehouse, home to 73,000 square feet of community space, innovative eateries, and the Heights Public Market.
▪ The Pearl – a 314-unit residential community, with 28,873 square feet of ground-floor retail and health clinic.
▪ Heights Union – two proposed 150,000 square feet Class A office buildings.


M. L. KING JR RECREATION COMPLEX – A community complex offering recreational amenities, such as a gymnasium, playground, computer lab, pool, and art studio.
STETSON TAMPA LAW CENTER – A public-private partnership between Florida's Second District Court of Appeal and Stetson Law School, offering a campus for Tampa's law students.

WEST TAMPA SUB-DISTRICT

120570043.00
120570042.00
POPULATION:
HOUSEHOLD INCOME:
189 Total Businesses
2,324 Total Employees
0.48 Employee/Population
14.2% Household Unemployment


HOUSING CHARACTERISTICS: EMPLOYMENT & BUSINESS: INDUSTRY BY SECTOR:
INCOME CHARACTERISTICS:
$14,940 Median Household Income
$14,490 Median Disposable Income
$17,560 Per Capita Income
SPENDING: INFLOW/OUTFLOW:


2,970
1,403
The West Tampa sub-district has nearly 4.4 million square feet of developed buildings on over 326 acres of land. The total building supply within the sub-district is made up primarily of residential property uses, followed by commercial buildings. Combined, these property uses comprise approximately 68% of the total building supply within the sub-district. Comparatively, the majority of the land within the sub-district is made up of public and government land uses, at 34% of the total acres. Industrial space captures the smallest share of building area and land area within the sub-district.
The market value per acre is greatest within West Tampa's commercial market, capturing 22% of the total market value within the sub-district. Comparatively, the market value per acre in the residential market captures nearly 44% of the total market value within West Tampa,
although the market value per acre is performing 37% less than the commercial market.
As of year-end 2021, the West Tampa sub-district's commercial market is performing at an average market value per acre of approximately 152% greater than that of the City of Tampa's commercial market. Additionally, the residential market within the sub-district is performing at an average market value per acre slightly greater than that of the City's residential market, at nearly 31%.
In addition, the average floor area ratio—the relationship between a building's total floor area and the size of the lot that the building is located on—is greatest within West Tampa's commercial market, closely followed by the subdistrict's industrial market.
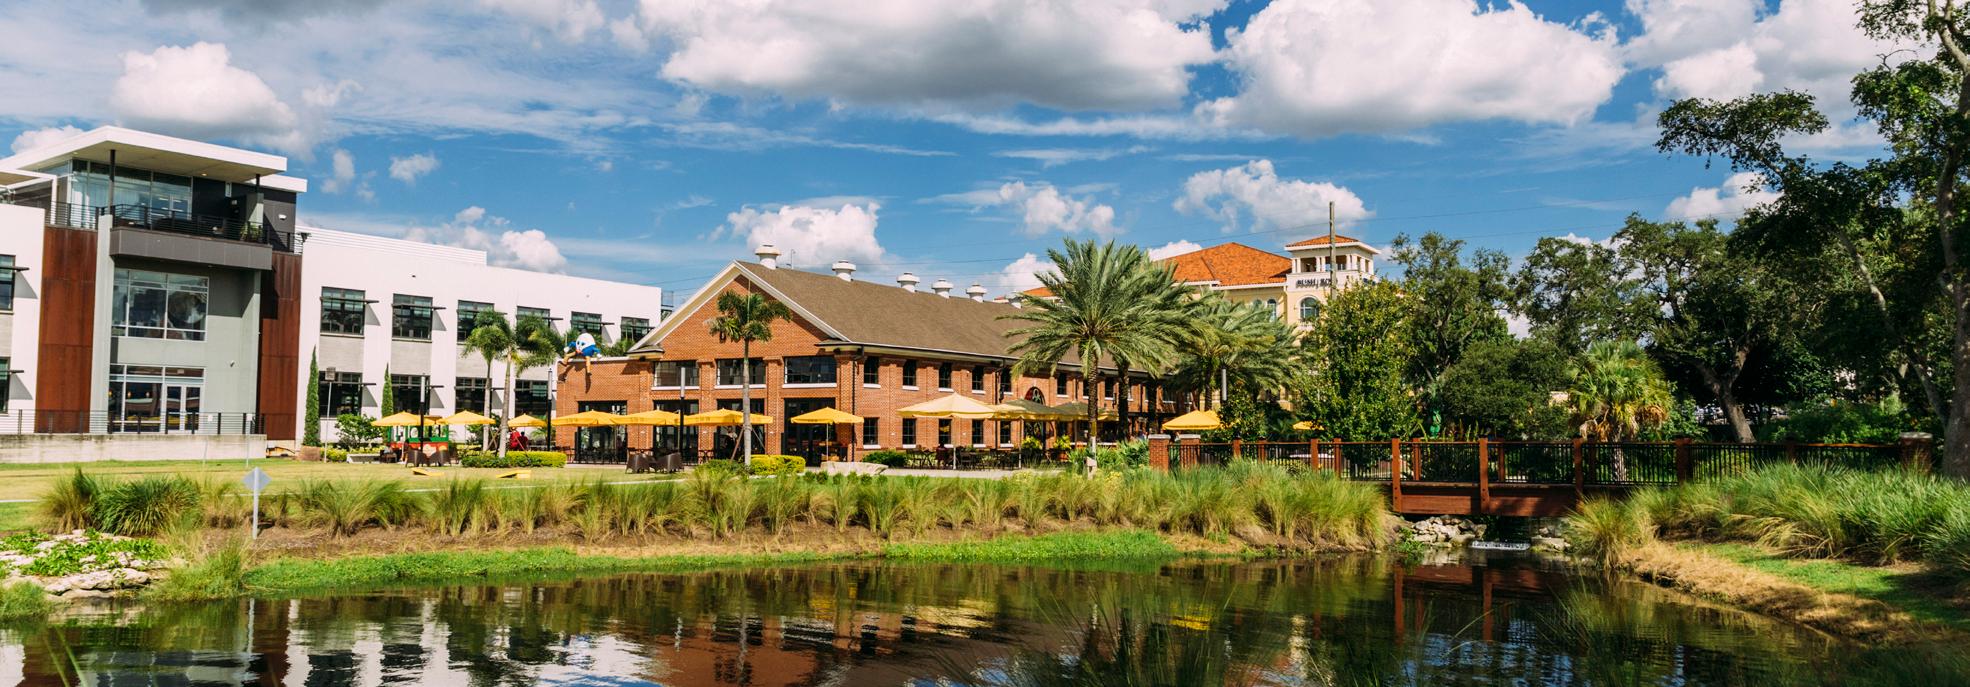

Julian B. Lane Riverfront Park Photo Courtesy of Visit Tampa Bay
WEST TAMPA | PRIORITY PROJECTS
ROME YARD
The Rome Yard project is planned as a pedestrian-friendly neighborhood with multiple modes of public transportation, a Workforce Training Center, a Cultural Center, and an Art Pavilion highlighting West Tampa history. In about a year and a half, the Tampa Riverwalk is expected to cut through the property. The Rome Yard project will feature 900-plus apartments and roughly 50 townhomes, which will be available for purchase.


Rome Yard Development
Rome Yard Development
Rome Yard Development
STREETCAR EXTENSION AND MODERNIZATION
An extension of the streetcar line is planned from the Downtown Tampa Whiting Street end of the line, northward to Palm Avenue into the Tampa Heights neighborhood. This comes as the Urban Core continues to experience growth in development and redevelopment, which requires transportation solutions. Expanding and modernizing the streetcar, at a cost of $234 million, would include sleeker, larger, faster cars that would roll on a longer streetcar system. The project would include:
1. Replacement of the existing replica streetcar vehicles with modern streetcar vehicles.
2. Construction of a 1.3-mile fixed guideway with overhead power within existing rights-of-way from the western terminus of the existing system through the core of Downtown Tampa to Tampa Heights.
3. Construction of stops along the extension guideway.
4. Modifications to the existing 2.7-mile alignment guideway, power system, and stops to support modern streetcar operations.
5. Modifications to the existing vehicle maintenance and storage facility to accommodate the new vehicles.


Tampa Streetcar
Historic Tampa Streetcar
This Opportunity Zone (Census Tract 120570042.00) is part of the West Tampa sub-district within the City of Tampa. The tract is approximately 262 acres and is accessible by major thoroughfares, such as I-275, U.S. 41, and S.R. 685. The tract is located on the northeast side of the Hillsborough River and is contained within the Tampa Heights Riverfront CRA.
Within this tract is the City's oldest suburb, the Tampa Heights neighborhood. This historic, diverse, and vibrant neighborhood contains the Heights, a 50-acre modernized waterfront community and a national destination that features entertainment, work space, shopping, and a residential community. Other green spaces and attractions within this tract include Water Works Park, Highland Park, and Ridgewood Park Butterfly Garden.
As of year-end 2021, this census tract within the West Tampa sub-district has nearly 3.1 million square feet of developed buildings on about 174 acres of land. Residential properties comprise the majority of building space and land area within this census tract, at 42% and 43%, respectively, of the total share.
The West Tampa ROI Model revealed that there are 66 properties prime for redevelopment as of year-end 2021 within this census tract.
Community investment is strong within this Opportunity Zone. The Ridgewood Park Neighborhood project will improve the City of Tampa’s water distribution system by replacing the existing water mains and increasing the capacity of the system. This project will also replace the aging water mains in this area with new and larger diameter water mains, improving water pressure and water quality while reducing the number of service interruptions that might have been caused by main breaks or leakage. Additionally, the project provides for street resurfacing and sidewalks; as well as the design and installation of traffic calming devices, such as chicanes, deviators, bulb-outs, medians, and raised intersections.
Elements of the West River Multimodal Safety & Network Improvements Project are also located within this tract, with improvements including expansion of the West Riverwalk Trail and Complete Streets Improvements for the Ridgewood Park neighborhood.
FDOT will also be enhancing mobility within this Opportunity Zone in the form of a bikeway to be constructed along Ola Avenue from 7th Avenue to N. Florida Avenue. Construction of this project is anticipated to begin in 2023. Additionally, FDOT is currently in the design phase of intersection improvements and new signalization at the intersection of 7th Ave. and Tampa Street.


THE HEIGHTS – a 50-acre modernized waterfront community and national destination. The Heights completed and proposed developments include Armature Works, the Pearl Apartments, and the Heights Union.
HEIGHTS UNION OFFICE BUILDING – Includes two, 6-story, Class A office buildings with an adjacent 1,500-space parking garage, 42,000 square feet of ground floor retail, and a treelined linear park.
MARRIOTT MOXY HOTEL – A 150-room Moxy Hotel will span 7 floors of a 25-story mixeduse tower set to start construction in early 2020, with a scheduled opening in 2022. The 25-story tower will be between West Oak and West Seventh Avenues and North Highlands and North Tampa Streets. Above the Moxy, there will be apartments that have a separate lobby from the hotel. The Moxy itself will have 5,000-square-feet of retail space and the development of the full block will include 30,000 square feet of additional retail by 2022.
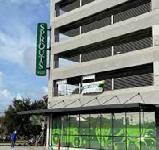
SPROUTS GROCERY STORE – The 24,000-squarefoot store at 101 West 7th Avenue opened in October 2021.
CHARACTERISTICS | YEAR-END 2021
POPULATION:
HOUSING CHARACTERISTICS: EMPLOYMENT & BUSINESS:
HOUSEHOLD INCOME:

INCOME CHARACTERISTICS:


$45,580 Median Disposable Income
$35,750 Per Capita Income

CONSUMER SPENDING:
This Opportunity Zone (Census Tract 120570043.00) is part of the West Tampa sub-district within the City of Tampa. The tract is approximately 186 acres, and is accessible by major thoroughfares, such as I-275. The tract is located on the southwest side of the Hillsborough River and is contained within the West Tampa CRA, the City's newest CRA, created in 2015.
Within this tract is the West River Redevelopment area, a 120-acre community with the vision to pioneer West River’s heritage and transform the neighborhood into modern-day residences, offices, shops, restaurants, and riverfront recreation that will make it a new central gathering place for the entire Tampa community to enjoy. Other green spaces and attractions within this census tract include M.L. King Jr. Recreation Complex and the Blake Bike Trail.
As of year-end 2021, this census tract within the West Tampa sub-district has over 1.3 million square feet of developed buildings on about 152 acres of land. Public and governmental designated land areas comprise the majority of building space and land area within this census tract, at 56% and 60%, respectively, of the total share.
The West Tampa ROI Model revealed that there are 6 properties prime for redevelopment as of year-end 2021 within this census tract.
The West Tampa CRA’s combination of old and new, residential and commercial, and easy access to I-275 make it a prime location for investment. With its central location between Downtown and the Westshore business district, West Tampa is experiencing major redevelopment activity as 1,000+ multi-family residential units are currently being added. Community investment is strong within this Opportunity Zone; the west side of the Riverwalk will be expanded with funding support of a $24 million BUILD grant from the U.S. Department of Transportation. The implementation of the West River Plan will transition the surrounding area into a vibrant, diverse, urban community open to the Hillsborough River. A primary goal of the project is to provide safe walk/ bike connections to Downtown Tampa from adjacent neighborhoods.
Rome Ave. is a key north-south connector for the City of Tampa, and an important component of the West River Multimodal Safety & Network Improvements Project as it provides an important connection under Interstate 275 to surrounding neighborhoods, and provides access to employment centers, schools, hospitals, and other institutions. The West River Multimodal Safety & Network Improvements Project will enhance Rome
Avenue to provide a safe, and low-stress connector for all transportation by providing on-street bike facilities, enhanced crosswalks, and pedestrian walkways.
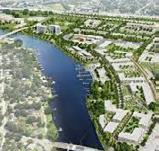
WEST RIVER REDEVELOPMENT PROJECT
– A 120-acre mixed-use community that features modern-day residences, offices, shops, restaurants, and riverfront recreation. New developments recently completed in the West River Redevelopment Area include:
▪ Renaissance Senior Apartments at West River – 6-story, 1,972 square feet retail building with a salon and visiting medical office space.
▪ Mary Bethune West River – residences include impact-resistant windows, new cabinetry, modern energy star appliances, plumbing fixtures, and programmable thermostat/ humidistat.
▪ Boulevard West River Apartments – 1 to 3 bedrooms from 600 to 1,200 square feet, including market-rate, affordable, and units eligible for rental assistance.
POPULATION:
HOUSING CHARACTERISTICS: EMPLOYMENT & BUSINESS:
HOUSEHOLD INCOME: INCOME CHARACTERISTICS:


$11,000 Median Household Income
$10,700 Median Disposable Income
$6,100 Per Capita Income

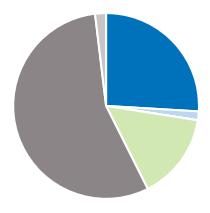
J o s e p h S t
WEST TAMPA | OPPORTUNITY INDEX
N H o w a r d A v e
As of year-end 2021, the Investment and Redevelopment Opportunity Index model for West Tampa revealed that there are approximately 72 properties prime for redevelopment, with a mix of commercial, industrial, and residential property uses. In addition, there were zero for-sale commercial properties and vacant lots within this subdistrict.
W P i n e S t N S a i n t P e t e r A v e L o u i s S t
W A i l e e n S t N F r e m o n t A v e N RiversideDr
B O W M A N
H E I G H T S
W C o l u m b u s D r
W S t J o s e p h S t
R i v e r S i d e
G a r d e n P a r k
W W a r r e n A v e
N E s s e x C t N R o y a l C t
N M u n r o S t N RidgewoodAve
W C o l u m b u s D r
W Euc l i d A v e N RiversideDr
W A m e l i a A v e
W S t J o h n S t
The following opportunity index map depicts the general clusters of specific redevelopment and investment properties within West Tampa; these property uses include:
Redevelopment Properties
Commercial
W S t L o u i s S t
W S t C o n r a d S t
Industrial/Flex Properties
W B e a c h S t
Residential Investment Properties
R e y P a r k
N A r m e n i a A v e N H o w a r d A v e
O L D W E S T
T A M P A
N F r e m o n t A v e
M L K i n g J r
R e c r e a t i o n
C o m p l e x
Y e l l o w J a c k e t s
L i t t l e L e a g u
W C h e r r y S t
W P i n e S t
N R o m e A v e
W S p r u c e S t
W C h e s t n u t S t
W U n i o n S t
W S p r u c e S t
G l e n w o o d D r i v e
W P a r k A v e NRiversideDr
W R o s s A v e W R o s s A v e
W P a l m A v e
C r u i s - A - C a d
W O a k A v e
W 7th A v e
B l a k e T r a i l
W S p r u c e S t
N O l a A v e
For-Sale Commercial & Vacant Lots 120570043.00 120570042.00
N F r e m o n t A v e
W G r e e n S t

D u n b a r
E l e m e n t a r y
W G r e e n S t
275 4 2

W L a u r e l S t 275
W A r c h S t
B u t l e r C t
S t e w a r t M i d d l e B l a k e H i g
W C h e s t n u t S t
D o y l e C a r l t o n

W U n i o n S t N W i l l o w A v e
D r i v e
W M a i n S t
Main St


DREW PARK/AIRPORT | DISTRICT OVERVIEW
ABOUT DREW PARK/AIRPORT
The Drew Park/Airport sub-district within the City of Tampa is approximately 2,189 acres and consists of two unique Opportunity Zones. Drew Park/Airport encompasses one CRA, which includes the Drew Park CRA.
Drew Park/Airport is located in western Tampa, generally situated between Tampa International Airport (TPA) and Raymond James Stadium. The neighborhood can be traced back to 1928, when its namesake Drew Field Municipal Airport was officially opened. The neighborhood surrounding Drew Field, now Drew Park, served many military uses during World War II. Since then, it has been the site of residential, industrial, commercial, educational, and other institutional uses. It is also adjacent to the Tampa International Airport, the largest and most heavily used airport in the region.
With its close proximity to Tampa International Airport, Hillsborough Community College, professional sports and recreational facilities, and major employers, Drew Park/ Airport is ideally positioned for private investment. As one of the few remaining areas in Tampa with affordable industrial land and space, the area continues to attract new residents and businesses.
The Drew Park/Airport sub-district contains 209 rental apartment units in 9 buildings that meet the minimum size criteria (market rate and mixed-income properties having at least 10 units). Within Drew Park/Airport, there is also nearly 3.1 million square feet of retail space, 2.7 million square feet of industrial space, and 1.9 million square feet of office space. Drew Park/Airport contains the largest concentration of retail and industrial, as compared to the other sub-districts within the City of Tampa.
As of year-end 2021, the Investment and Redevelopment Opportunity Index model for the Drew Park/Airport sub-district revealed that there are approximately 82 properties prime for redevelopment, with a mix of commercial, industrial, and residential property uses; and 14 for-sale commercial properties and vacant lots located within the sub-district. The Drew Park/Airport ROI Map is illustrated on pages 90-91.
COMMUNITY INVESTMENT
The Drew Park / Airport area has been the focus of tremendous infrastructure investment by the City of Tampa and its many partners in transportation, water, wastewater, and stormwater. The North Himes Complete Street project provides for complete streets and safety improvements for North Himes Avenue from West Columbus Drive to West Hillsborough Avenue. The $15.9 million Lois Avenue infrastructure and streetscape project has transformed the function and appearance of the major gateway through Drew Park. These improvements, in combination with the upcoming completion of the Drew Park Strategic Action Plan update, are keeping redevelopment momentum moving forward.
In close proximity to Tampa International Airport, some of Tampa International Airport’s largest and most impactful construction projects are approaching completion after more than 2 years of construction on Phase II of the Airport’s Master Plan expansion. Phase II ultimately will enable the Airport to accommodate up to 34 million passengers.
▪ OFFICE BUILDING – TPA’s nine-story SkyCenter One office building, developed by VanTrust, is now complete and occupied by its first tenants. This unique building boasts world-class amenities, and is the only office building with a direct connection to the Main Terminal via the SkyConnect system. Several floors are currently available for lease.
▪ EXPRESS CURBSIDES – The Blue express curbside project will add eight new curbside lanes for passengers without checked luggage. As of fall 2021, Airport team was in the final stages of getting the roadway bridge complete, and the project was about 2 months ahead of schedule. The exterior of the vertical circulation building, which will transport passengers between the express curbs and the Main Terminal, is completed with the roof, windows, and doors all installed, with crews working on interior finishes. The building is expected to open in 2022.

Tampa International Airport Photo Courtesy of Visit Tampa Bay
▪ CENTRAL UTILITY PLANT – Construction on TPA’s new state-of-the-art utility plant is moving fast, and crews are beginning the process of testing and commissioning all the new systems. Commissioning will run through the summer, and the Airport will swap over to the new utility plant in the fall.
▪ ROADWAY EXPANSION – TPA’s roadway expansion is about three months ahead of schedule. The project widens George J. Bean Parkway, the Airport's main entrance and exit road, and adds new and more consistent roadway signage throughout the campus. The project will allow the airport to handle greater passenger numbers, prolonging the life of the Main Terminal.
ANCHOR DEVELOPMENT

RAYMOND JAMES STADIUM – A multi-purpose stadium that is used for football, concerts, and other events. It is home to the Tampa Bay Buccaneers of the National Football League, as well as the NCAA's South Florida Bulls football team.

INTERNATIONAL PLAZA AND BAY STREET –
A dominant shopping mall and dining destination in Tampa, located adjacent to the Tampa International Ariport. The Plaza is an enclosed shopping mall anchored by Dillard's, Neiman Marcus, and Nordstrom.

HILLSBOROUGH COMMUNITY COLLEGE, DALE
MABRY CAMPUS – The largest and oldest HCC campus, consisting of over 500,000 square feet of classroom, laboratory, and office space. This campus hosts over 48% of HCC's enrollment.

TAMPA INTERNATIONAL AIRPORT – Adjacent to the sub-district, TPA is served by 20 major air carriers, 4 regional airlines, and 3 air cargo carriers; and is the hub for Silver Airways.

120570026.00

DREW PARK/ AIRPORT
SUB-DISTRICT
CRA OVERLAY MAP
Drew Park/Airport
Other Tampa
Sub-Districts
Community Redevelopment Areas
120570045.00
POPULATION:
AGE DISTRIBUTION:
HOUSEHOLD INCOME:


HOUSING CHARACTERISTICS: EMPLOYMENT & BUSINESS: INDUSTRY BY SECTOR:
INCOME CHARACTERISTICS:
$35,300 Median Household Income
$29,600 Median Disposable Income
$15,600 Per Capita Income 1,285 Total Businesses
Total Employees
Employee/Population
20,069
2,638


The Drew Park/Airport sub-district has over 27.0 million square feet of developed buildings on nearly 3,463 acres of land. The total building supply within the sub-district is made up primarily of governmental and public buildings, at 71% of the total building supply within the sub-district. Combined, residential and commercial property uses comprise approximately 19% of the total building supply within the sub-district. Comparatively, the majority of the land within the sub-district is made up of public and government land uses, at nearly 79% of the total acres. Institutional space captures the smallest share of building area and land area within the sub-district.
The market value per acre is greatest within the Drew Park/Airport sub-district's residential market, capturing 11% of the total market value within the sub-district. Comparatively, the market value per acre in the
commercial market captures over 8% of the total market value within the Drew Park/Airport sub-district.
As of year-end 2021, the Drew Park/Airport sub-district's commercial market is performing at an average market value per acre of approximately 44% less than that of the City of Tampa's commercial market. Additionally, the residential market within the sub-district is performing at an average market value per acre lower than that of the City's residential market, at nearly 38%.
In addition, the average floor area ratio—the relationship between a building's total floor area and the size of the lot that the building is located on—is greatest within the Drew Park/Airport sub-district's industrial market, closely followed by the sub-district's residential and commercial markets.


George M. Steinbrenner Field
Photo Courtesy of Tampa Bay Business Journal
DREW PARK/AIRPORT | PRIORITY PROJECTS
STREETSCAPE AND BEAUTIFICATION MASTER PLAN CAE USA HEADQUARTERS
The streetscape improvement recommendations are targeted specifically for Lois Avenue, Grady Avenue, Tampa Bay Boulevard, and Dr. Martin Luther King Jr. Boulevard; and generally for business connector streets, local business streets, and local residential streets. The recommendations are a series of strategies to enhance community identity throughout the neighborhood. These include the provisions of gateways, which provide an entry monument and create a sense of place at the entrance to Drew Park. Objectives of the Master Plan include:
▪ Establish a walkable community.
▪ Enable greater bicycle access to and throughout the CRA.
▪ Encourage Low Impact Development (LID) practices.
▪ Introduce public art.
▪ Reflect on the past.


CAE USA plans to build its new U.S headquarters facility along the Air Cargo Road, between W. Osbourne and W. Crest Avenues. CAE USA is a leading training and simulation company in the defense market.
The new 250,000-square-foot facility is anticipated to open in 2022 and will be home to more than 600 Tampa-based CAE USA employees. The new facility project was made possible through strong partnerships between CAE USA, Enterprise Florida, the Tampa Hillsborough Economic Development Corporation, Hillsborough County, City of Tampa, Space Florida, Tampa International Airport, Tampa Electric, CBRE, and the Florida Department of Economic Opportunity.


INFILL DEVELOPMENT STRATEGY
The City has acquired three clusters of vacant parcels within the residential portion of Drew Park, located on Coolidge Avenue, Hubert Avenue, and Manhattan Avenue. These residentially zoned parcels could be considered for permitting the construction of a mixture of market-rate and attainable homes that would advance several planning aspirations of both the City and Drew Park. These housing units will increase the supply of housing within the city, maintain the residential land use framework of this neighborhood, and improve the physical condition in a neighborhood in need of investment.
1� COOLIDGE AVENUE PARCELS
16,652 Total Site Sq. Ft. RM-16 Zoning R-20 FLU
FAR = .37 (Max .5 Allowed)
2� HUBERT AVENUE PARCELS
1.98 Acres
3� MANHATTAN AVENUE PARCELS Conceptual Site
86,137 Total Site Sq. Ft. RM-16 Zoning R-20 FLU FAR = .44 (Max .5 Allowed) Conceptual Site


This Opportunity Zone (Census Tract 120570026.00) is part of the Drew Park/Airport sub-district within the City of Tampa. The tract is approximately 1,722 acres, and is accessible by major thoroughfares, such as S.R. 580 and U.S. 92. This tract is located adjacent to Tampa International Airport (TPA) and encompasses the Drew Park CRA.
Within this tract is the Drew Park neighborhood, a mixeduse community with sports arenas, including the George M. Steinbrenner Field, which hosts the New York Yankees spring training baseball games; as well as the Raymond James Stadium, home to the Tampa Bay Buccaneers of the National Football League and the NCAA's South Florida Bulls football team. Other major attractions within this census tract include Al Lopez Park and the International Plaza and Bay Street Shopping Mall.
As of year-end 2021, this census tract within Drew Park/ Airport has nearly 23.8 million square feet of developed buildings on about 3,141 acres of land. Public and governmental designated land areas comprise the majority of building space and land area within this census tract, at 80% and 85%, respectively, of the total share.
The Drew Park/Airport ROI Model revealed that there are 63 properties prime for redevelopment, and 13 forsale investment properties as of year-end 2021 within this census tract.
Drew Park CRA’s close proximity to Tampa International Airport, Hillsborough Community College, professional sports and recreational facilities, and major employers ideally positions the area for private investment.
The $15.9 million Lois Avenue infrastructure and streetscape project has transformed the function and appearance of the major gateway through Drew Park.
The $1.6 million North Himes Avenue Improvement Project was completed in Fall 2021. This project included complete streets and safety improvements for North Himes Avenue from West Columbus Drive to West Hillsborough Avenue.
FDOT will also be enhancing mobility within this Opportunity Zone in the form of intersection improvements at the intersection of Lois Avenue and Boy Scout Blvd., which is anticipated to begin in 2023, and will include a right-turn lane from eastbound Boy Scout Blvd. onto Lois Avenue. FDOT has also undertaken a study of the Hillsborough Avenue Corridor from Memorial Highway to I-275; this will evaluate the corridor for capacity issues, traffic operations, safety, access management, freight movements, transit, bicycles, and pedestrian movements. Additionally, FDOT recently completed median safety improvements along Hillsborough Avenue from Memorial Highway to Himes Avenue. Among other things, these improvements now
PROPERTY
provide an alternative bike route along the eastbound Hillsborough Avenue from Dale Mabry Highway to Himes Avenue.
Community investment is strong within this Opportunity Zone. A few of TPA’s largest and most impactful construction projects are approaching completion after more than 2 years of construction on Phase II of the Airport’s Master Plan expansion. Phase II ultimately will enable the Airport to accommodate up to 34 million passengers.

1 STADIUM CENTER REDEVELOPMENT PROJECT – Located at 4738 N. Dale Mabry Hwy, this project consists of a new Radisson Country Inn with 147 rooms and an Econo Lodge with 121 rooms. It also features a pet hotel and veterinary clinic; and a total of 28,700 square feet for restaurants and retail.
2

3

TWO SHEPHERDS TAPROOM – A newly constructed craft brewery opened on Grady Avenue. This is Tampa's first and only indoor and outdoor dog park and bar.
ELECTRIC SUPPLY EXPANSION – Electric Supply, Inc. recently completed a 35,000-squarefoot warehouse addition to its Drew Park headquarters.
POPULATION: HOUSING CHARACTERISTICS: EMPLOYMENT & BUSINESS:
RenterOccupied OwnerOccupied
AGE DISTRIBUTION:
RACIAL MAKEUP:

HOUSEHOLD INCOME: INCOME CHARACTERISTICS:

$329,310 Avg. Home Value

$27,900 Median Household Income
$25,200 Median Disposable Income $12,000 Per Capita Income

This Opportunity Zone (Census Tract 120570045.00) is part of the Drew Park/Airport sub-district within the City of Tampa. The tract is approximately 467 acres, and is accessible by major thoroughfares, such as I-275.
Within this tract is the Macfarlane Park neighborhood, home to the Macfarlane Park Trail, a part of the West Tampa Greenway and Trail System. The Macfarlane Park Trail is a 5-foot-wide pedestrian-only trail that meanders 1.2 miles via a loop system around the perimeter of the park. Other park amenities include picnic tables, grills, restrooms, play courts, tennis and racquetball courts, a playground, and a community center, as well as the West Tampa Little League baseball field. In addition, this census tract encompasses the David Barksdale Senior Citizen Center, an active adult center offering classes and memberships to the local community.
As of year-end 2021, this census tract within Drew Park/ Airport has nearly 3.3 million square feet of developed building, on about 322 acres of land. Residential property uses comprise the majority of building space and land area within this census tract, at 67% and 62%, respectively, of the total share.
The Drew Park/Airport ROI Model revealed that there are 19 properties prime for redevelopment, and one forsale investment property as of year-end 2021 within this census tract.
COMMUNITY INVESTMENT
Community investment is strong within this Opportunity Zone. The City’s Vision Zero initiative has been the driving force behind many programs and projects being undertaken by the City. First implemented in Sweden in the 1990s, Vision Zero has proven successful across Europe. Now, it is gaining momentum in major American cities. The City’s Vision Zero initiative focuses on vulnerable road users (pedestrians, cyclists, etc.), schools, speeding, and speed management. Implementation of the City’s Vision Zero Action Plan includes safety projects on high priority corridors, citywide speed limit reduction programs, expansion of the City’s network of trails, greenways, and safe crosswalks, and a citywide separated bike lane pilot program.
The MacDill Ave and Green Street Safety Enhancement project, which was recently completed, included installing a temporary traffic signal as part of Vision Zero to increase safe, healthy, and equitable mobility for all. The intersection was identified within a safety study and met the warrants for a traffic signal solution. This project included wood poles, span wire, signal heads, pedestrian heads and buttons, cabinets, pullboxes, wiring, conduit, and video detection. A similar safety enhancement project was also recently completed at the intersection of Himes Avenue and Beach Street.
NOTABLE PROJECTS

1 MACFARLANE PARK PLANNED IMPROVEMENTS–
The City of Tampa’s Foundation for Tampa’s Neighborhoods Design Build project includes water, wastewater, stormwater, and transportation improvements in multiple neighborhoods within the city’s limits as part of the Transforming Tampa’s Tomorrow initiative. The improvements for Macfarlane Park are scheduled to be completed in Fall 2024, and include:
▪ Stormwater infrastructure improvements, such as the addition of stormwater piping to reduce street flooding.
▪ Water improvements, such as the replacement of water distribution pipelines.
▪ Transportation activities in Macfarlane Park, such as the resurfacing of some neighborhood roads, the addition of traffic calming elements, and the construction of additional sidewalks to ensure neighborhood connectivity.
PROPERTY CHARACTERISTICS | YEAR-END 2021
POPULATION:
HOUSING CHARACTERISTICS: EMPLOYMENT & BUSINESS:
AGE DISTRIBUTION:
HOUSEHOLD INCOME:
RACIAL MAKEUP:


INCOME CHARACTERISTICS:
$39,300 Median Household Income
$34,000 Median Disposable Income
INDUSTRY BY SECTOR:

CONSUMER SPENDING:

DREW PARK/AIRPORT | OPPORTUNITY INDEX
As of year-end 2021, the Investment and Redevelopment Opportunity Index model for Drew Park/Airport revealed that there are approximately 82 properties prime for redevelopment, with a mix of commercial, industrial, and residential property uses. In addition, there were 14 for-sale commercial properties and vacant lot within this subdistrict.
M e m o r i a l H w y

5 8 0
W S o u t h A v e
G e o r g e R d
The following opportunity index map depicts the general clusters of specific redevelopment and investment properties within Drew Park/ Airport; these property uses include:
Redevelopment Properties
Commercial Industrial/Flex Properties
Residential
R o c k y
P o i n t G o l f
C o u r s e
C a r l y l e R d Bessie Col e m a n B l v d
6 0 6 0 6 0 5 8 9
N H e s p e r i d e s S t
W C r e s t A v e N M a n h a t t a n A v e
W O s b o r n e A v e
N H u b e r t A v e
N G r a d y A v e
Investment Properties
For-Sale Commercial & Vacant Lots
G e o r g e R d
M e m o r ia l H w y
F i s h C r e e k
T a m p a I n t ' l A i r p o r t 5 8 0 92 92
N W e s t S h o r e B l v d
W O h i o A v e
J i m W a l t e r B l v d
I n t e r n a t i o n a l
P l a z a a n d B a y S t r e e t
N L o i s A v e N L o i s A v e
W D r M a r ti n L u t h e r K i n g J r B l v d
120570026.00
H i l l s b o r o u g h
C o m m
W T a m p a B a y B l v d
N D a l e
W C o l u m b u s D r
N M a c D i l l A v e
120570045.00
W S t C o n r a d S t
W A i l e e n S t
W C h e r r y S t N T a m p a n i a A v e N H a b a n a A v e N G o m e z A v e
W W a l n u t S t
W M a i n S t
W L a u r e l S t
W L a u r e l S t
UNIVERSITY AREA | DISTRICT OVERVIEW
ABOUT THE UNIVERSITY AREA COMMUNITY INVESTMENT
The University Area sub-district within the City of Tampa is approximately 2,880 acres and consists of five unique Opportunity Zones. The University Area does not contain any CRAs, and is partially bounded along the Hillsborough River on the south side.
The University Area is located on the south side of the University of South Florida Tampa campus in northern Tampa, encompassing Busch Gardens and Adventure Island amusement parks. Located within the larger Uptown District, the University Area contains an mix of retail outlets, residential neighborhoods, and restaurants—with a multitude of medical treatment and research facilities, including H. Lee. Moffitt Cancer Center, AdventHealth, James A. Haley Veterans’ Hospital, and Johnnie B. Byrd, Sr. Alzheimer’s Institute located nearby. Here, diverse industry clusters of technology, healthcare, education, and entertainment coexist.
In addition, the Busch Boulevard, a major east-west corridor for the area, serves many neighborhoods and residents of those neighborhoods within the University Area. Leaders envision making Busch Boulevard an entertainment corridor, and hope to see it transformed with fun and enriching businesses that serve both tourists and locals in the community.
The University Area sub-district contains 2,322 rental apartment units in 25 buildings that meet the minimum size criteria (market rate and mixed-income properties having at least 10 units). Within the University Area, there is also nearly 1.7 million square feet of retail space, 556,300 square feet of industrial space, and 164,900 square feet of office space. The University Area sub-district has one of the greatest amounts of rental units as compared to the other sub-districts within the City of Tampa.
As of year-end 2021, the Investment and Redevelopment Opportunity Index model for the University Area subdistrict revealed that there are approximately 162 properties prime for redevelopment, with a mix of commercial, industrial, and residential property uses; and 17 for-sale commercial properties and vacant lots located within the sub-district. The University Area ROI Map is illustrated on pages 108-109.
The University Area has been the focus of tremendous infrastructure investment by the City of Tampa and its many partners in transportation, water, wastewater, and stormwater. The Safe Routes to School Project for Sulphur Springs K-8 provides for safety improvements, traffic calming, and pedestrian facilities to establish a safe walking route to school. Under the Sulphur Springs Safe Routes to School Project, the City of Tampa is proposing to enhance the safety and quality of the pedestrian routes along N. 12th Street from E. Fairbanks to E. Yukon Streets. Improvements will include new 5-foot-wide concrete sidewalks along the east side of 12th St. from E. Seward to N 13th Streets. Intersection improvements will occur at N. 12th and Fairbanks Streets, N. 12th and E. Seward Streets, N. 12th and E. Yukon Streets, N. 11th and E. Yukon Streets, and N. 13th and E. Seward Streets. University Square is also the focus of investment, with a Street Resurfacing Project that provides for street resurfacing within the University Square Neighborhood.
Complete Streets & Safety Improvement Projects in the area include the 30th Street project (E. Yukon Street to E. Fowler Avenue) which provides for roadway
improvements to accommodate bicycle facilities, pedestrian refuge islands, enhanced crosswalks, sidewalks, and other safety measures; the 46th Street project (from Busch Boulevard to Fowler Avenue), which provides for complete street roadway improvements to enhance safety and multimodal connectivity, including roundabouts, sidewalks, bicycle facilities, enhanced crosswalks, and other safety measures; and the 50th Street/Busch Blvd. Intersection project, which provides for capacity, operational and safety improvements by widening for a northbound right-turn lane.
Flooding Relief Projects in the area include the Copeland Park project, which provides for construction of a new pumping station; the North Tampa Closed Basin ("NTCB") 17th and Annona project, which provides for construction of new inlets and pipes connecting to the existing system; the NTCB 21st and Annie Pond, which provides for constructing a new stormwater pond and new pipes/inlets connecting to the pond; the NTCB 99th Ave. Pond Expansion, which provides for property acquisition and pond expansion; the NTCB Elmer Pond Expansion, which provides for property acquisition and pond expansion; the Okara Road and 26th Street

Busch Garden Aerial Photo Courtesy of Tampa Bay Business Journal
forcemain (FM), which provides for replacement of the existing FM system for the pond located at Okara Road and 26th Street; the Terrace Park Pond Outfall, which provides for installation of control structure for an existing pond with pipes connecting to the existing system.
FDOT completed a Multimodal Feasibility Study in the University Area to evaluate potential corridor improvements along Fowler Avenue between I-275 and I-75. The study developed and evaluated improvement alternatives, such as a transit envelope and circulation enhancements that would better facilitate access to/ from I-275 and I-75; major employment and activity centers; and a future regional intermodal center in the University Area.
ANCHOR DEVELOPMENT

BUSCH GARDENS/ADVENTURE ISLAND – A 335acre African-themed animal theme park and 30-acre water park, owned and operated by SeaWorld Parks & Entertainment, with an annual attendance exceeding over 5.6 million combined at both parks.


COPELAND PARK – A 132-acre park offering a nature trail, freshwater pond, athletics, and a community center.
NEW SPRINGS SCHOOL – A public charter school serving K-8 grade levels, and offering STEM educational programs.
BUSCH PLAZA SHOPPING CENTER – An outdoor shopping mall anchored by Tampa Furniture Outlet and Save-A-Lot.
UNIVERSITY OF SOUTH FLORIDA MAIN CAMPUS –
Adjacent to the sub-district, USF is a global research university offering more than 200 undergraduate, as well as graduate, specialist, and doctoral-level degree programs.


POPULATION:
HOUSING CHARACTERISTICS: EMPLOYMENT & BUSINESS:
AGE DISTRIBUTION: RACIAL
HOUSEHOLD INCOME:
594 Total Businesses 4,248 Total Employees 0.16 Employee/Population 13.3% Household Unemployment
7,285


INCOME CHARACTERISTICS:
$29,400 Median Household
$25,900 Median Disposable Income
$13,600 Per Capita Income


The University Area sub-district has over 16.5 million square feet of developed buildings on about 2,781.0 acres of land. The total building supply within the sub-district is made up primarily of residential buildings, closely followed by commercial property uses. Combined, these property uses comprise approximately 89% of the total building supply within the sub-district. Comparatively, the majority of the land within the sub-district is made up of residential land uses, as well as public and government land uses, at nearly 73% of the total acres. Industrial space captures the smallest share of land area within the subdistrict.
The market value per acre is greatest within the University Area's residential market, capturing 72% of the total market value within the sub-district. Comparatively, the market value per acre in the commercial market captures
only 19% of the total market value within the University Area sub-district.
As of year-end 2021, the University Area sub-district's residential market is performing at an average market value per acre of approximately 58% less than that of the City of Tampa's residential market. Additionally, the commercial market within the sub-district is performing at an average market value per acre lower than that of the City's commercial market, at nearly 70%.
In addition, the average floor area ratio—the relationship between a building's total floor area and the size of the lot that the building is located on—is greatest within the University Area sub-district's industrial market, closely followed by the sub-district's residential and institutional markets.


Moffitt Cancer Center at McKinley Campus
Photo Courtesy of Moffitt Cancer Center
UNIVERSITY AREA | PRIORITY PROJECTS
INNOVATION DISTRICT
The Tampa Innovation Partnership was founded in 2011 as the Innovation Alliance. Its geographical focus is generally Busch Boulevard to the south, Bearss Avenue to the north, interstates 75 and 275 to the east and west, as well as parts of the City of Tampa, Temple Terrace, and unincorporated Hillsborough County. This 19-square-mile area holds $11.3 billion in annual potential economic impact. Here, diverse industry clusters of technology, health care, education, and entertainment coexist. It’s this community where one in six jobs and one in three businesses within the area are high tech.
The area boasts 74,000 jobs and 4,100 companies, serving as one of the region’s technology hubs and start-up incubators. Additionally, it is one of the few nationally designated TechHire communities with a strategic advantage for achieving high-tech job training goals. This designation came after the Partnership was awarded a $3.8 million federal grant to expand tech training for young adults.
The Tampa Innovation Partnership received a $750,000 grant from Florida Blue in 2021 for its work in the city’s University Area community. The gift is part of Blue Cross Blue Shield’s “Growing Resilient Communities” initiative to promote equity in select ZIP codes across Florida. In total, Florida Blue has invested more than $1.7 million into the North Tampa community.
The grant from Florida Blue will be used to add different educational and work opportunities to the community. The partnership is attempting to change the identity of the University Area from “Suitcase City”—so named because of its reputation as a neighborhood for transient residents—to the “Uptown Innovation District.”

UPTOWN TAMPA
The Uptown District of North Tampa has seen an upswing of redevelopment in recent years, thanks to the Tampa Innovation Partnership and other players fostering redevelopment in the neighborhoods and corridors surrounding the University of South Florida.
At the epicenter of growth in the Uptown District of Tampa is RITHM, a 100-acre mixed-use transformation of the former University Mall on Fowler Avenue into a nerve center of innovation. Once complete, RITHM At Uptown will be one of the largest mixed-use innovation communities in the state, with capacity for over 7 million square feet of development, including several thousand residential units. The success of RITHM continues in luring new science and research outfits, joining a cadre of medical and technology-based tenants at the former mall property, such as Florida Blue, AMROC Fab Lab, and Diamond View Studios. It’s the kind of innovative hub that sparked the creation of Silicon Valley in California a century ago.


RITHM Concept Plan, Tampa
RITHM Concept Plan, Tampa
RITHM
HAVEN STUDENT HOUSING
Located at 2701 & 2501 E. Fowler Ave, the Haven Student Housing Project consists of the demolition of the Quality Inn Conference Center to make way for construction of The Metropolitan at Tampa.
This project will bring a 276-unit, 760-bed student housing facility with a 1,780-square-foot retail space and 620 covered parking spaces. Community amenities will include courtyards, a fitness center, study and gaming lounges, a pool, and a spa. Construction is slated to begin in June 2021, with delivery scheduled for August 2024.
YUENGLING ENTERTAINMENT COMPLEX

One of the Uptown District anchors looking to make a new name for itself is Yuengling Brewery, which moved into Tampa 1999 and operates as the southern arm of the Pennsylvania brewing giant that serves as America’s oldest brewery. Construction is ongoing adjacent to the brewery facility to create an outdoor gaming area, digital interactive museum, and 2.2-acre courtyard slated to open in Fall 2022.
The revitalization will feature an array of first-class amenities that will appeal to the Greater Tampa Bay community and tourists from around the country, including:
▪ State-of-the-art microbrewery
▪ Restaurant with private dining and local cuisine
▪ Digital Interactive museum with artifacts and advertising memorabilia from Yuengling’s 191-year history
▪ Expanded gift and coffee shop
▪ Multi-use concert and entertainment pavilion
▪ Outdoor recreation gaming area and beer garden
▪ On-site hotel
▪ Design character that reflects Yuengling’s history as America’s Oldest Brewery


Metropolitan Haven Student Housing
Yuengling Concept Plan, Tampa
Yuengling Concept Plan, Tampa
Yuengling Concept Plan, Tampa
UNIVERSITY AREA | TRACT 120570001.02
This Opportunity Zone (Census Tract 120570001.02) is part of the University Area sub-district within the City of Tampa. The tract is approximately 864 acres, and is accessible by major thoroughfares, such as S.R. 580, S.R. 582, and S.R. 583.
This tract features Busch Gardens Tampa Bay, a 335acre African-themed animal theme park and Adventure Island, a 30-acre water park. Both of these parks are owned and operated by SeaWorld Parks & Entertainment, contributing enormous visitation and tourism to the City of Tampa, with an annual attendance exceeding over 5.6 million combined at both parks. Additional amenities at these parks include food and drinking places, retail shops, parking facilities, and a recycling center. Busch Gardens also offers special events and concerts year-round.
As of year-end 2021, this census tract within the University Area sub-district has nearly 4.4 million square feet of developed buildings on about 710 acres of land. Residential properties comprise the majority of building space within this census tract, at 58%. Whereas, other commercial properties comprise the majority of land acreage within this tract, at 53%.
The University Area ROI Model revealed that there are 19 properties prime for redevelopment, and zero forsale investment property as of year-end 2021 within this census tract.
Community investment is strong within this Opportunity Zone. Complete Streets & Safety Improvement Projects within this Opportunity Zone include the 46th Street Project (from Busch Boulevard to Fowler Avenue), which provides for complete street roadway improvements to enhance safety and multimodal connectivity, including roundabouts, sidewalks, bicycle facilities, enhanced crosswalks and other safety measures; and the 50th Street/Busch Boulevard Intersection project, which provides for capacity, operational, and safety improvements by widening with a northbound rightturn lane.
Additionally, the 46th Street, Terrace Park, and Temple Crest projects will improve the City of Tampa’s water distribution system by replacing the existing water mains and increasing the capacity of the system. These projects will also improve the system’s ability to serve a growing population.
FDOT is also enhancing mobility within this Opportunity Zone in the form of pedestrian safety improvements along Busch Blvd. Construction of this project was completed in 2021. It included the installation of new high-intensity pedestrian-activated signalized crosswalks on Busch Blvd at the intersections of Pawnee Avenue and Overlook Drive.
NOTABLE FOCUS AREAS

UPTOWN AND INNOVATION DISTRICT DEVELOPMENTS – Located adjacent to this census tract is the Uptown and Innovation District of North Tampa. These areas have seen an upswing of redevelopment in recent years in the neighborhoods and corridors surrounding the University of South Florida. Some recently completed projects include:
▪ At the epicenter of growth in the Uptown District of Tampa is "RITHM", a 100-acre mixed-use transformation of the former University Mall on Fowler Avenue into a nerve center of innovation.
▪ Major additions to AdventHealth and James A. Haley Veterans Hospital are nearing completion, and work is underway on a significant expansion of Moffit Cancer Center.
▪ Yuengling has broken ground, and will work throughout 2021 to build a multimillion dollar hotel and entertainment complex, featuring a restaurant, hotel, microbrewery, and entertainment venue. Yuengling Tampa campus is slated to open in early 2022.
PROPERTY CHARACTERISTICS | YEAR-END 2021
POPULATION:
HOUSING CHARACTERISTICS: EMPLOYMENT & BUSINESS:
HOUSEHOLD INCOME: INCOME CHARACTERISTICS:


$26,100 Median Household Income
$22,200 Median Disposable Income
$14,500 Per Capita Income


UNIVERSITY AREA | TRACT
COMMUNITY INVESTMENT
This Opportunity Zone (Census Tract 120570002.01) is part of the University Area sub-district within the City of Tampa. The tract is approximately 250 acres, and is accessible by S.R. 582 and U.S. 41.
This tract features part of the North Tampa neighborhood, a residential community directly adjacent to Copeland Park and Trail. The Copeland Park and Trail is a 132-acre park offering both an asphalt and nature trail, freshwater pond, and a community center. Other park amenities include picnic tables, grills, restrooms, ball fields, play courts, tennis & racquetball courts, a playground, a community center, a swimming pool, and a gymnasium.
There is also a large commercial corridor along S.R. 582 and U.S. 41 within this tract on the west and north sides. These commercial corridors include access to numerous food and drinking places, and retail and service shops.
As of year-end 2021, this census tract within the University Area sub-district has over 1.7 million square feet of developed buildings on nearly 181 acres of land. Residential property uses comprise the majority of building space and land area within this census tract, at 59% and 53%, respectively, of the total share.
The University Area ROI Model revealed that there are 5 properties prime for redevelopment, and 6 for-sale investment property as of year-end 2021 within this census tract.
This Opportunity Zone encompasses some of the North Tampa neighborhoods, which surrounds the University of South Florida (USF) and is part of the Uptown District. As the district continues evolving with new developments, community investment is strong within this Opportunity Zone.
The Uptown District has been witnessing an unprecedented concentration of major private-public investments totaling over $1 billion over just the past few years. One of the most recent changes in the North Tampa area is the topping off of Moffitt Cancer Center’s new 10-story inpatient surgical hospital on Malcolm McKinley Drive, a $400 million expansion of the hospital’s campus that is slated to open in July 2023.
FDOT is also enhancing mobility within this Opportunity Zone in the form of intersection improvements at 15th Street and Fowler Avenue. This intersection upgrade includes modifying curbs, pedestrian islands and medians, installing new pedestrian signals and ramps, and intersection lighting. Construction is estimated to be completed in 2022.
NOTABLE FOCUS AREAS
UPTOWN AND INNOVATION DISTRICT DEVELOPMENTS – Located adjacent to this census tract is the Uptown and Innovation District of North Tampa. These areas have seen an upswing of redevelopment in recent years in the neighborhoods and corridors surrounding the University of South Florida. Some recently completed projects include:
▪ At the epicenter of growth in the Uptown District of Tampa is "RITHM", a 100-acre mixed-use transformation of the former University Mall on Fowler Avenue into a nerve center of innovation.
▪ Major additions to AdventHealth and James A. Haley Veterans Hospital are nearing completion, and work is underway on a significant expansion of Moffit Cancer Center.
▪ Yuengling has broken ground, and will work throughout 2021 to build a multimillion dollar hotel and entertainment complex, featuring a restaurant, hotel, microbrewery, and entertainment venue. Yuengling Tampa campus is slated to open in early 2022.
POPULATION: HOUSING CHARACTERISTICS: EMPLOYMENT & BUSINESS:
83% RenterOccupied OwnerOccupied
HOUSEHOLD INCOME: INCOME CHARACTERISTICS:


$174,200 Avg. Home Value
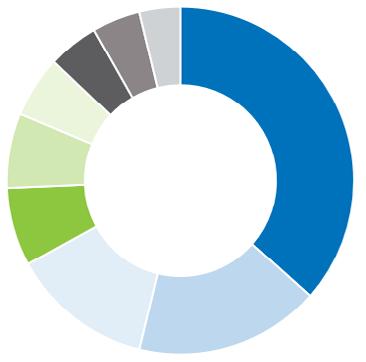

UNIVERSITY AREA | TRACT
COMMUNITY INVESTMENT
This Opportunity Zone (Census Tract 120570002.02) is part of the University Area sub-district within the City of Tampa. The tract is approximately 493 acres, and is accessible by major thoroughfares, such as S.R. 582.
This tract features the University Square neighborhood, a residential community directly adjacent to the University Mall and the University of South Florida (USF). The University Mall is a shopping mall near USF, just north of the City of Tampa limits, and is anchored by Dillards and Burlington Coat Factory. Additionally, USF is a global research university offering more than 200 undergraduate, as well as graduate, specialist, and doctoral-level degree programs. Copeland Park and Trail is also located within this tract, and features a 132-acre park offering both an asphalt and nature trail, freshwater pond, and a community center.
As of year-end 2021, this census tract within the University Area sub-district has over 3.5 million square feet of developed buildings on nearly 388 acres of land. Residential property uses comprise the majority of building space and land area within this census tract, at 67% and 57%, respectively, of the total share.
The University Area ROI Model revealed that there are zero properties prime for redevelopment, and one forsale investment property as of year-end 2021 within this census tract.
Community investment is strong within this Opportunity Zone. The University Square neighborhood is a focus of investment within this Opportunity Zone, with a Street Resurfacing Project that provides for street resurfacing within the University Square Neighborhood. Copeland Park is also an area seeing investment via a project that provides for construction of a new pumping station to aid with flooding relief.
This tract, located adjacent to the University Square Mall in the Uptown District, has been witnessing an unprecedented concentration of major private-public investments totaling more than $1 billion over just the past few years. In addition, one of the most recent changes in the district is the topping off of Moffitt Cancer Center’s new 10-story inpatient surgical hospital on Malcolm McKinley Drive, a $400 million expansion of the hospital’s campus that is slated to open in July 2023.
FDOT is also making improvements within this Opportunity Zone in the form of intersection improvements along Fowler Avenue at 15th Street, 22nd Street, and 30th Street/Bruce B. Downs Blvd. These intersection upgrades include modifying curbs, pedestrian islands and medians, installing new pedestrian signals and ramps, and intersection lighting. Construction is estimated to be completed in 2022.
NOTABLE FOCUS AREAS
UPTOWN AND INNOVATION DISTRICT DEVELOPMENTS – Located adjacent to this census tract is the Uptown and Innovation District of North Tampa. These areas have seen an upswing of redevelopment in recent years in the neighborhoods and corridors surrounding the University of South Florida. Some recently completed projects include:
▪ At the epicenter of growth in the Uptown District of Tampa is "RITHM", a 100-acre mixed-use transformation of the former University Mall on Fowler Avenue into a nerve center of innovation.
▪ Major additions to AdventHealth and James A. Haley Veterans Hospital are nearing completion, and work is underway on a significant expansion of Moffit Cancer Center.
▪ Yuengling has broken ground, and will work throughout 2021 to build a multimillion dollar hotel and entertainment complex, featuring a restaurant, hotel, microbrewery, and entertainment venue. Yuengling Tampa campus is slated to open in early 2022.
POPULATION:
HOUSING CHARACTERISTICS: EMPLOYMENT & BUSINESS:
HOUSEHOLD INCOME: INCOME


CHARACTERISTICS:

UNIVERSITY AREA | TRACT
COMMUNITY INVESTMENT
This Opportunity Zone (Census Tract 120570003.00) is part of the University Area sub-district within the City of Tampa, and is approximately 742 acres.
Within this tract are the Tampa Overlook and North Tampa neighborhoods, residential communities located directly adjacent to Busch Gardens Tampa Bay and Adventure Island. Both of these parks are owned and operated by SeaWorld Parks & Entertainment, contributing enormous visitation and tourism to the City of Tampa, with an annual attendance exceeding over 5.6 million combined.
This tract also features large commercial corridors along the S.R. 580 and U.S. 41 thoroughfares bordering the tract on the west and south sides. These corridors include access to numerous food and drinking places, retail and service shops, as well as hotel and lodging accommodations.
As of year-end 2021, this census tract within the University Area sub-district has nearly 3.8 million square feet of developed buildings on over 521 acres of land. Residential property uses comprise the majority of building space and land area within this census tract, at 79% and 75%, respectively, of the total share.
The University Area ROI Model revealed that there are 79 properties prime for redevelopment, and two for-sale investment properties as of year-end 2021 within this census tract.
Community investment is strong within this Opportunity Zone. Complete Streets & Safety Improvement Projects within this Opportunity Zone include the 9th Street Sidewalk project (Bougainvillea to Linebaugh Avenues), which provides for new sidewalks; and the University Square project, which provides for street resurfacing within the University Square Neighborhood.
Flood Relief projects within this Opportunity Zone include the Lantana-Poinsettia Pump Station project, which provides for property acquisition and construction of a new collection system and new pump station to replace the temporary pump and FM connecting the existing drainage system on N. 11th Street; the NTCB 17th and Annona project, which includes construction of new inlets and pipes connecting to the existing system; and the NTCB Elmer Pond Expansion project, which provides for property acquisition and pond expansion.
FDOT is also enhancing mobility within this Opportunity Zone in the form of pedestrian safety improvements along Busch Blvd. Construction of this project was completed in 2021. It included the installation of new high-intensity pedestrian-activated signalized crosswalks on Busch Boulevard at the intersections of Brooks and 12th Streets.
NOTABLE FOCUS AREAS
UPTOWN AND INNOVATION DISTRICT DEVELOPMENTS – Located adjacent to this census tract is the Uptown and Innovation District of North Tampa. These areas have seen an upswing of redevelopment in recent years in the neighborhoods and corridors surrounding the University of South Florida. Some recently completed projects include:
▪ At the epicenter of growth in the Uptown District of Tampa is "RITHM", a 100-acre mixed-use transformation of the former University Mall on Fowler Avenue into a nerve center of innovation.
▪ Major additions to AdventHealth and James A. Haley Veterans Hospital are nearing completion, and work is underway on a significant expansion of Moffit Cancer Center.
▪ Yuengling has broken ground, and will work throughout 2021 to build a multimillion dollar hotel and entertainment complex, featuring a restaurant, hotel, microbrewery, and entertainment venue. Yuengling Tampa campus is slated to open in early 2022. 1
POPULATION:
HOUSING CHARACTERISTICS: EMPLOYMENT & BUSINESS:
HOUSEHOLD INCOME:
$133,770 Avg. Home Value


$35,230


UNIVERSITY AREA | TRACT
COMMUNITY INVESTMENT
This Opportunity Zone (Census Tract 120570007.00) is part of the University Area sub-district within the City of Tampa, and is approximately 531 acres.
Within this tract are the Sulphur Springs and Fern Cliff neighborhoods. These residential communities feature access to numerous green spaces, including Mann-Wagon Memorial Park and River Cove Park along the Hillsborough River. In addition, the tract is home to the Springhill Park Community Center and the Sulphur Springs K-8 Community School.
This tract also features large commercial corridors along the S.R. 580 and U.S. 41 thoroughfares bordering the tract on the north and west sides. These corridors include access to numerous food and drinking places, as well as retail and service shops.
As of year-end 2021, this census tract within the University Area sub-district has nearly 3.1 million square feet of developed buildings on over 981 acres of land. Residential properties comprise the majority of building space within this census tract, at 82%. Whereas, other public and governmental designated land areas comprise the majority of land acreage within this tract, at 64%.
The University Area ROI Model revealed that there are 59 properties prime for redevelopment, and 5 for-sale investment properties as of year-end 2021 within this census tract.
Community investment is strong within this Opportunity Zone. The Safe Routes to School Project for Sulphur Springs K-8 provides for safety improvements, traffic calming, and pedestrian facilities to establish a safe walking route to school. Under the Sulphur Springs Safe Routes to School Project, the City of Tampa is proposing to enhance the safety and quality of the pedestrian routes along N. 12th Street from E. Fairbanks to E. Yukon Streets. Improvements will include new 5-foot-wide concrete sidewalks, and intersection improvements.
Another significant project within this tract is the Sulphur Springs Pumping Station Design Build project, which represents an investment of over $19 million. This project is currently in the planning phase, with construction expected to begin in 2022. The project provides for the rehabilitation of the wastewater pumping station at 7902 N. 13th St.
FDOT will also be enhancing mobility in this Opportunity Zone in the form of pedestrian upgrades along Nebraska Avenue. Construction of the project is anticipated to begin in 2023, and will include various pedestrian features along Nebraska Avenue between Kennedy Blvd. and E. Arctic Street. These features will include mid-block crossings, rectangular rapid flashing beacons, pedestrian signals, pedestrian refuge islands, pedestrian lighting, and pedestrian hybrid beacon signals.
NOTABLE FOCUS AREAS
UPTOWN AND INNOVATION DISTRICT DEVELOPMENTS – Located adjacent to this census tract is the Uptown and Innovation District of North Tampa. These areas have seen an upswing of redevelopment in recent years in the neighborhoods and corridors surrounding the University of South Florida. Some recently completed projects include:
▪ At the epicenter of growth in the Uptown District of Tampa is "RITHM", a 100-acre mixed-use transformation of the former University Mall on Fowler Avenue into a nerve center of innovation.
▪ Major additions to AdventHealth and James A. Haley Veterans Hospital are nearing completion, and work is underway on a significant expansion of Moffit Cancer Center.
▪ Yuengling has broken ground, and will work throughout 2021 to build a multimillion dollar hotel and entertainment complex, featuring a restaurant, hotel, microbrewery, and entertainment venue. Yuengling Tampa campus is slated to open in early 2022.
POPULATION:
HOUSING CHARACTERISTICS: EMPLOYMENT & BUSINESS:
HOUSEHOLD INCOME:


INCOME CHARACTERISTICS:
$29,130 Median Household Income
$25,960 Median Disposable Income $13,580 Per Capita Income
INDUSTRY BY SECTOR:


UNIVERSITY AREA | OPPORTUNITY INDEX
L a k e
E c k e l s
As of year-end 2021, the Investment and Redevelopment Opportunity Index model for the University Area revealed that there are approximately 162 properties prime for redevelopment, with a mix of commercial, industrial, and residential property uses. In addition, there were 17 for-sale commercial properties and vacant lots within this subdistrict.
B a b e
Z a h a r i a s G o l f
The following opportunity index map depicts the general clusters of specific redevelopment and investment properties within the University Area; these property uses include:
Redevelopment Properties
Commercial
Industrial/Flex Properties
N O a k l e a f A v e N 1 1 t h S t
Residential Investment Properties
N O r e gon Ave N 1 4 t h S t N E d i s o n A v e N 1 5 t h S t N M a r j o r y A v e
E A n n i e S t N O l a A v e N A r m e n i a A v e N 1 5 t h S t B o u l e v a r d N N B o u l e v a r d A 5 8 0 5 8 2 5 8 2
U n i v e r s i t y S q u a r e M a l l C o p e l a n d P a r
N V a l l e D r N W i l l o w A v e W 1 0 9 t h A v e weN p o r t Cir N 1 6 t h S t
N J o n e s A v e
E 1 1 3 t h A v e USF Alu m n i D r
E 1 0 9 t h A v e
275
For-Sale Commercial & Vacant Lots 120570002.02 120570002.01 120570001.02
N O r l e a n s A v e
N E l m e r S t
E B u s c h B l v d 5 8 0
N R o m e A v e N A s h l e y S t
N R o m e W W a t e r s A v e
C o u r s e N O l a A v e N D e x t e r A v e N N e w p o r t A v e
W K i r b y S t
N 1 2 t h S t N T a m p a S t E Y u k o n S t N L y n n A v e
S U L P H U R
S P R I N G S
E J u n e a u S t
E B i r d S t
O r l e a n s A v e W S i t k a S t N 1 5 t h S t N 1 0 t h S t E S i t k a S t
E B i r d S t
R i v e r S h o r e
D r i v e
E N o r f o l k S t
N M a r k s S t
E 9 3 r d A v e Merid e l St
N 2 1 s t S t N 1 9 t h S t
N 2 2 n d S t
N 2 7 t h S t
E 9 9 t h A v e
E 9 7 t h A v e
E A n n i e S t
N 3 0 t h S t 5 8 2 T a m p a
I n d u s t r i a l P a r k
E W h i t e w a
A d v e n t u r e I s l a n d B u s c h G a r d e n s T a m p a B a y
N 4 6 t h S t
N 4 2 n d S t N O j u s D r
E S e r e n a
E L i n e b a u g h A v e
E 9 8 t h A v e
E T e m p l e H e i g h t s
Property Address Index Score Redevelopment Properties
1 5109 E Serena Dr 95
2 10009 N Ojus Dr 95
3 10021 N Myrtle St 85
4 10318 N Myrtle St 85 5 10211 N 46th St 85 6 11123 N Nebraska Ave 80 7 10313 N Nebraska Ave 80
8 10309 N Nebraska Ave 80 9 10921 N Nebraska Ave
4934 E Busch Blvd
9900 Block N 14th St 95
8510 Block N Mulberry St 95
1300 Block E Yukon St 95
8510 Block N Brooks St 95
8410 Block N Brooks St 95 24 8400 Block N 15th St
8110 Block N 17th St 95
1420 Block E Mulberry Dr 95
1500 Block E Mulberry Dr 95
1630 Block E Mulberry Dr 95
2100 Block E Bird St 95
10200 Block Takomah Trl 90
1910 Block E 97th Ave 90 38 1700 Block S Club Ct 90 39 8500 Block N 16th St 90 40 9300 Block N 46th St 90 41 5110 Block E 97th Ave 90 42 10210 Block N 26th St 90
10110 Block Hyacinth Ave 90 44 1010 Block E 109th Ave 90 45 10100 Block N Jasmine Ave 90 46 1700 Block E Linebaugh Ave 90
47 1600 Block E Poinsettia Ave 90
48 1500 Block E 98th Ave 90
49 1500 Block E 98th Ave 90
50 9810 Block N 16th St 90
51 1700 Block E Linebaugh Ave 90
52 9900 Block N 15th St 90
53 1400 Block E 99th Ave 90
Property Address Index Score
54 8400 Block N Elmer St 90
55 8500 Block N 13th St 90
56 8400 Block N Mulberry St 90
57 9320 Block N 26th St 90
58 9300 Block N 27th St 90
59 9210 Block N 27th St 90
60 9800 Block N 26th St 90
61 9700 Block N 26th St 90
62 5110 Block E 97th Ave 90
63 9610 Block N 50th St 90
64 8210 Block N 9th St 90
65 8100 Block N 17th St 90
66 1630 Block E Mulberry Dr 90
67 7800 Block N Marks St 90
68 1610 Block E Marks Dr 90
69 1710 Block E Mulberry Dr 90
70 10000 Block N 20th St 85
71 2100 Block E Poinsettia Ave 85
72 2110 Block E Poinsettia Ave 85
73 910 Block E 109th Ave 85
74 9400 Block N 17th St 85
75 1700 Block S Club Ct 85
76 9500 Block N 10th St 85
77 8410 Block N Alaska St 85
78 9610 Block N 27th St 85
79 9500 Block N 46th St 85
80 9510 Block N Hyaleah Rd 85
81 9610 Block N Hartts Dr 85
82 9610 Block N Oklawaha Ave 85
83 4110 Block E Richmere St 85
84 5270 Block Tennis Court Cir 85
85 7910 Block N Mulberry St 85
86 1700 Block E Waters Ave 85
87 1410 Block E Mulberry Dr 85
88 1610 Block E River Cove St 85
89 10210 Block N 46th St 85
90 10200 Block Takomah Trl 85
91 10200 Block Takomah Trl 85
92 1000 Block E 109th Ave 85
93 910 Block E Poinsettia Ave 85
94 10000 Block N 20th St 85 95 1500 Block E Annona Ave 85 96 1600 Block E Poinsettia Ave 85 97 1000 Block Lotus Ave 85 98 9410 Block N 16th St 85 99 1700 Block E 97th Ave 85
100 1420 Block E 99th Ave 85
101 1510 Block E 99th Ave 85
102 1420 Block E Linebaugh Ave 85
8700 Block N 13th St 85
8400 Block N 17th St 85
8400 Block N 15th St 85
8510 Block N Elmer St 85
8410 Block N 18th St 85
108 8600 Block N 13th
1100 Block E Skagway Ave 85
8500 Block N 10th St
141 8519 N Nebraska Ave
142 10020 N 15th St
143 9300 N 16th St
144 915 E Skagway Ave
145 5112-5134 Temple Hgts. Rd
146 1402 E Chilkoot Ave
147 1404 E Chilkoot Ave
148 1410 E Chilkoot Ave
149 8437 N Nebraska Ave
150 8531 N Nebraska Ave
151 1413 E Seneca Ave
152 1409 E Chilkoot Ave
153 10230 N 30th St
154 4832 Temple Terrace
155 915 E Grant Ave
156 8511 N Nebraska Ave
157 1405 E Seneca Ave
CITY OF TAMPA MARKET REPORT & OPPORTUNITY ZONE PROSPECTUS
TERMS & LIMITING CONDITIONS
▪ The Publication is intended for the Client’s use for purposes of information, marketing, and other activities. The Publication may be used in its entirety for those purposes. Partial excerpts of, or partial references to the Publication in any form must acknowledge that these passages are out of context and the entire Publication must be considered or viewed.
▪ GAI has no present or prospective interest in any property located within the City. The content of the Publication should not be construed as legal, financial, regulatory, or investment advice.
▪ Possession of the Publication or copy thereof by anyone other than the Client, does not carry with it the right of publication or reproduction. Neither the Publication nor its contents, nor any reference to our firm may be included or quoted in any real estate offering or registration statement, or other agreement or document, without our prior permission. Permission will be granted upon meeting certain conditions.
▪ Certain data used in compiling the Publication was furnished from sources which we consider reliable; however, we do not guarantee the correctness of such data, although so far as possible, we have made reasonable, diligent efforts to check and/or verify the same and believe it to be accurate. There could be small errors of fact based on data and methods of reporting or accounting for that data. No liability is assumed for omissions or inaccuracies that subsequently may be disclosed for any data used in the Publication.
▪ GAI has no obligation to update the Publication for information or knowledge of events or conditions that become available after the date of publication.
▪ In no event shall either party be liable for any loss of profits, loss of business, or for any indirect, special, incidental or consequential damages of any kind.
▪ Authorization and acceptance of, and/or use of, the Publication constitutes acceptance of the above terms and limiting conditions.
▪ The precise nature of the smaller planning areas, as well as the release schedule of data from certain sources both public and proprietary, presents certain challenges to capturing each indicator uniformly and consistently, necessitating estimation or interpolation in some cases. In other cases, data sets are reported only for specific ZIP Code boundaries which have been aggregated.

Prepared By:
