

CITY OF JACKSONVILLE BEACH MARKET ANALYSIS
DUVAL COUNTY, FL | JULY 2022
GAI’s Community Solutions Group (CSG) is a cross-functional team of professionals that helps create sustainable, livable places. We plan and design public spaces, sculpt landscapes and parks, reimagine streets and roads, and provide the regulatory and economic insight necessary to bring projects to life.
ACKNOWLEDGMENTS
Heather Ireland, AICP | Director of Planning and Development
Jacksonville Beach Community Redevelopment Agency 11 North Third Street
Jacksonville Beach, Florida 32250 (904) 247.6231
GAI CONTACTS
Owen Beitsch, PhD, FAICP, CRE | Senior Advisor
Laura Smith | Project Manager
Natalie Frazier | Senior Analyst
GAI Consultants’ Community Solutions Group 618 East South Street, Suite 700 Orlando, FL 32801 (321) 319.3088

© GAI Consultants, Inc. 2022
This document has been prepared by GAI Consultants, Inc. on behalf of the City of Jacksonville Beach, FL.

1/ONE: PROJECT INTRODUCTION
GAI Consultants, Inc. (“GAI”) was retained by the City of Jacksonville Beach (“Client”) to conduct a detailed market analysis to identify the market potential for a mixed-use project (“Project”) with structured parking on a parcel (“Site”) which is owned by the Client and generally located adjacent to Latham Plaza.
The Client intends to utilize this analysis when engaging real estate developers with mixeduse experience interested in entering into a relationship with the Client—possibly a publicprivate partnership—to redevelop the Site. While the specific details of the anticipated Project would likely be defined by the aforementioned developer and solicitation process, the focus of the anticipated Project would be guided, at least in part, by this analysis.
The focus of the analysis detailed within this report centers on the Site and range of activities suited to its intended orientation, as well as evaluation of its general suitability and scale of the anticipated Project; profile of market area demographics and economic characteristics, including market size and growth trends; and estimates of possible market demand for the primary targeted uses within the Project that might reasonably be anticipated over the near- and midterm time horizons. For the purposes of this analysis, the near-term is defined as years 1-5 and, the mid-term is defined as years 6-10.
Please note, the information presented in this section is extracted from substantially more detailed sections that follow within this report. It is important for the reader to review all sections of this report in their entirety in order to gain a better understanding of the approach, methodology, and assumptions used within this analysis.
More specifically, the tasks completed as part of this analysis included, but were not limited to: (1) Conducted kickoff meeting with the Client to confirm assignment goals and review the full dimensions of the Project; (2) Defined specific market areas to further guide this analysis; (3) Analyzed select market attributes, such as demographic and economic statistics, area employment, and historical market inventory in terms of Office, Retail, Hospitality, Industrial, and Multi-Family; (4) Developed a competitive market assessment from a market demand perspective, and determined the two primary uses most suitable for the Site; (5) Identified comparable markets, projected population, and employment over the next 10 years; and performed a retail leakage analysis to use as reference points for the demand analysis; and (6) Conducted a demand analysis and estimated the potential demand and supply over the next 10 years, along with the potential market performance these primary uses could reasonably achieve.

Photo Courtesy of City of Jacksonville Beach
KEY FINDINGS
▪ The Site is designated as Commercial within the Future Land Use (“FLU”) Element of the 2030 Jacksonville Beach Comprehensive Plan, and the Zoning of the Site is identified as CBD.
▪ Given the intensity limitations set forth by the City of Jacksonville Beach, with an FAR between 0.50 and 3.00, the Project may be between 37,500 SF and 225,000 SF, based on the size of the Site.
▪ The Jacksonville Beach Charter limits the height of any new building to 35 feet, which would prohibit development above three stories and subsequently limit the achievable intensity of any development of the Site.
▪ For the purposes of this analysis, the Primary Market was defined as the portion of Duval County commonly referred to as “The Beaches”. The Secondary Market was defined as the municipal limits of the City of Jacksonville Beach, and the Core Market was defined as the Downtown CRA.
▪ Population has been growing across all areas analyzed, with the Primary Market, Secondary Market, and the Core Market, growing at a rate of 0.93%, 1.20%, and 1.11%, respectively, from 2010 to 2021.
Time Series

▪ The market conditions of commercial uses have been stable and continue to experience growth across all geographies analyzed since 2010. The three market areas have seen the greatest increases in the Industrial and Hotel/Motel market segments over this time.
Market Inventory Growth

▪ Several factors, including demographic and socio-economic drivers, market performance, development pipeline (projects under construction/planned/ proposed) within the market, and compatibility with the built environment, determined the targeted primary uses for the Project to be Office and Retail.
▪ Five comparable benchmark locations were analyzed as part of a Comparative Location Analysis, to provide a frame of reference related to the general commercial market and demand capture the proposed Project could potentially achieve within the Primary Market Area.
▪ The Comparative Location Analysis revealed that the average SF per employee for combined commercial space was approximately 282 SF, with office space requiring significantly less SF per employee than retail space.
▪ Based on projected population and employment growth, as well as estimated increases in commercial space inventory within the Primary Market Area—the space utilization ratio per employee SF, as noted above, is likely to be achieved by the Project.
▪ The overall market area used within this analysis is expected to experience strong growth in population and employment through 2032 (“projection period”), capturing a significant portion of growth within the County.
Population
▪ Throughout the projection period, the Primary Market is estimated to increase in population between 2,550 and 9,880 persons, resulting in a total population between 62,290 and 69,620 persons by 2032.
Primary Market Historic and Projected Population Growth

▪ Employment within the Primary Market is estimated to increase between 560 and 6,470 employees throughout the projection period, resulting in a total
employment between approximately 22,670 and 28,580 employees by 2032.
Primary Market Historic and Projected Employment Growth

▪ A Retail Leakage Analysis also revealed that the Primary Market is experiencing a retail leakage of nearly $168.3 million per year. Although Food Services and Drinking Places have a positive surplus (sales) of $58.7 million annually, Retail Trade is experiencing a shortage of $227.0 million annually.

Photo Courtesy of Lance Asper, UnSplash Photo
▪ To combat the retail leakage, as well as prepare for the influx of additional population and employment, the Primary Market would need an increase of between 259,400 SF and 1,805,200 SF of additional commercial space through 2032 to support new demand—roughly an annual rate between 25,900 SF and 180,500 SF per year.
New Commercial Demand – Primary Market
▪ The Secondary Market and Core Market could capture approximately 68% and 8%, respectively, of this new commercial space annually, based on capture of historic employment and existing commercial space relative to the Primary Market.
▪ Utilizing this approach, the Secondary Market would need an increase of between 94,300 SF and 1,176,400 SF and the Core Market would need an increase of between 28,600 SF and 138,100 SF of additional commercial space.
1,814,300 4,086,500 5,900,800
Existing (2022) 1,711,700 3,956,800 5,688,500 5-Year
SF (2027)
1,964,600 4,425,000 6,389,600
2,153,600 4,763,795 6,878,800 10-Year
SF (2032)
1,822,600 4,105,200 5,927,800
2,060,200 4,640,400 6,700,600
2,297,900 5,175,800 7,473,700
10-Year Change
1,032,200
1,805,200
▪ Relative to this demand for additional commercial space, along with the insufficient amount of existing supply to meet new demand within the markets most proximate to the Project, the Site is well positioned for commercial development, and is expected to experience increasing occupancy rates and average market rents throughout 2032.

SITE DUE DILIGENCE & MARKET AREA OVERVIEW
This section describes the considerations necessary to fully understand the parameters of the Site and potential development, as well as defines the market areas analyzed within this report.
SITE INFORMATION
The Site is located at 55 2nd St. N., Jacksonville Beach, FL 32250, and comprises approximately 1.7 acres. The Site currently contains a public parking lot with approximately 200 paved parking spaces, as illustrated in the following map (see Figure 1). All existing paved parking spaces contained within the Site will be incorporated into the Project in addition to the parking required to support future Project uses. The Site has dual frontages on 1st St. N. to the east and 2nd St. N. to the west; the Site also borders Latham Plaza to the north.

The Site is located within the City’s Downtown Redevelopment District (“Downtown CRA”) which is bound by 13th Ave. S., 3rd St. (SR A1A), 9th Ave. N., and the Atlantic Ocean. Notable activity within the Downtown CRA includes
the redevelopment of 12 acres of City-owned land lying in the area bound by Beach Blvd., 3rd St., 1st Ave. N., and the Boardwalk; this area now houses a new City Hall, Latham Plaza, SeaWalk Pavilion, 200-car parking facility, two restaurants, a pharmacy/drugstore, and a 72-suite hotel.
Permitted Uses
The Site is designated as Commercial within the Future Land Use Element of the 2030 Jacksonville Beach Comprehensive Plan, and the Zoning of the Site is identified as Central Business District (“CBD”). According to the Jacksonville Beach Land Development Regulations, the CBD zoning district is intended to serve as a central core for the City with a diversity of uses— promoting flexibility in design and quality in development, while preserving public access to the beach recreational area.
Within the CBD zoning district, a wide variety of uses are permitted. While the following list is not intended to be an exhaustive list of each discrete use identified as permitted within the City’s Land Development Regulations, it provides an overview of the types of uses that are generally permitted within the CBD zoning district:
▪ Retail (including light manufacturing of products sold on-site)
▪ Restaurant
▪ Office
▪ Multi-Family Residential & Townhomes
▪ Hotel/Motel
▪ Childcare
▪ Food Trucks
▪ Parks, Playgrounds, and Recreational Facilities
▪ Short-Term Vacation Rentals
▪ Parking Lots
Figure 1. Site Aerial Map

Area Conditions
Within the half-mile radius immediately surrounding the Site, three new developments are currently under construction, and one new development is planned. These developments include:
1. SpringHill Suites, currently under construction at 410 1st St., this hotel will contain 156 rooms and is anticipated to be complete in 2023.
2. New Beach Bowl, currently under construction at 818 Beach Blvd.; this freestanding retail development will be 25,877 square feet (“SF”) and is anticipated to be complete in 2022.
3. Multi-tenant retail building, currently under construction at 131 1st Ave. N.: this retail development will be 23,242 SF and is anticipated to be complete in 2023.
4. Boutique hotel in final planning stage at 221 1st St. N., this hotel will contain 18 upscale rooms and is anticipated to be under construction in December 2022, with completion expected in 2024.
The street network in the area surrounding the Site provides good circulation and connectivity to Hwy A1A (3rd St. N/S.) and Beach Blvd. With frontages on both 1st St. N. and 2nd St. N., the Site has good traffic access and street visibility. While traffic counts are not available for segments of 1st St. N. and 2nd St. N. in the area surrounding the Site, traffic counts are available for other nearby street segments that either intersect with 1st St. N. and 2nd St. N. or are within the general vicinity of the Site. Table 1 below provides a summary of traffic count estimates for those street segments where data is available.
Sources: CoStar MPSI Estimates; GAI Consultants.
As part of the evaluation of area conditions, average parking ratios of properties within a half-mile radius of the Site were examined. The parking ratios of built properties within a half-mile radius of the Site were benchmarked against the parking requirements stipulated in the Jacksonville Beach Land Development Regulations (“LDR”). Table 2 on the following page provides a summary of this comparative exercise. It is important to note that distinguishing retail uses from restaurant uses among the properties located within a half-mile radius of the Site was not possible for this comparative exercise. Therefore, a combined average was used for the area properties of these uses, and the LDR requirement was noted for retail and restaurant uses, respectively.
While average parking ratios for Hotel/Motel uses, Retail/Restaurant uses, and Office uses meet or exceed the LDR minimum parking ratios requirements, the average parking ratios for multi-family uses fail to meet the LDR minimum parking ratio requirement. However, the average year built for all multi-family uses within a half-mile radius of the Site is 1961,
Table 1. 2022 Traffic Count Estimates
Photo Courtesy of iStock Photo
which indicates that many of the multi-family uses would have been constructed prior to the adoption of the current LDR minimum parking ratio requirement.
Table 2. Benchmarked LDR Requirements Sources:
Property Use
Site Suitability: Future Land Use and Zoning Constraints
As stated previously, the Site is designated as Commercial within the Future Land Use (“FLU”) Element of the 2030 Jacksonville Beach Comprehensive Plan, and the Zoning of the Site is identified as CBD. The FLU and Zoning of the Site define the parameters under which development may occur on properties, based on their FLU and Zoning designation. While the uses permitted within the CBD Zoning district were generally outlined previously, the constraints of the Site, based upon the LDR for the CBD Zoning district, are important to for determining the Site’s suitability for various development scenarios as well as achievable scale of any development on the Site. The FLU generally dictates the intensity at which development may occur, and the Zoning establishes the specific regulations that must
MARKET AREA
For the purposes of this analysis, the Primary Market has been defined as the portion of Duval County commonly referred to as “The Beaches”. The Beaches encompass approximately 36 square miles, and is bound by the St. Johns River to the north, the Intracoastal Waterway to the west, the Atlantic Ocean to the east, and the Duval County/St. Johns County boundary to the south. The Secondary Market for this analysis
be followed to build within the respective Zoning district.
The FLU designation of Commercial stipulates a maximum intensity, measured by Floor Area Ratio (“FAR”), shall be 3.00 FAR for projects developed in cooperation with the City and CRA pursuant to Florida Statutes Ch. 163, Part III. For projects developed independent of the provisions of Florida Statutes Ch. 163, Part III, the FAR shall be 0.50. Given these intensity limitations, the 3.00 FAR would result in a gross floor area of approximately 225,000 SF, based on the size of the Site. The 0.50 FAR would result in a gross floor area of approximately 37,500 SF, based on the size of the Site.
CBD Zoning stipulates that the gross floor area of any single-use building, multi-use building, or development within the district may not exceed 50,000 SF. However, the CBD Zoning designation further stipulates that single-use buildings, multi-use buildings, or developments of greater than 50,000 SF containing uses permitted within the district may be approved if the property Zoning is changed to either Redevelopment District (RD) or Planned Unit Development (PUD). A change to the Zoning of the Site would require public hearing(s), and ultimately approval by the City Council. More importantly, the Jacksonville Beach Charter limits the height of any new building to 35 feet, which would prohibit development above three stories and subsequently limit the achievable intensity of any development of the Site.
has been defined as the municipal limits of the City of Jacksonville Beach, and the Core Market has been defined as the Downtown CRA. These defined market areas will be the focus of the demand analysis found in Section 5 of this report. In addition to the defined market areas, characteristics of the Jacksonville Metropolitan Statistical Area (“MSA”) and Duval County (“County”) will be evaluated as part of Section 3 of this report.

Legend The Beaches (Primary Market)
City of Jacksonville Beach (Secondary Market)
(Core Market)


3/THREE: MARKET OPPORTUNITY SCAN
This section describes the overall market supporting demand within the defined market areas; details the broader economic forces that are influencing this demand; and describes the primary uses most suitable for the Project.
FLORIDA ECONOMIC OUTLOOK
Consistent with the balance of the U.S., the Florida economy lost significant momentum in economic growth beginning in February 2020, and fell into recession in March 2020. However, the Florida economy gained momentum at the end of 2020, with the addition of 16,800 jobs in December 2020; this countered the downward trend for the U.S. as a whole, which saw a net loss of 227,000 jobs for the same month.
Following the second quarter of 2020, Florida experienced 12 consecutive months of job growth, gaining over 73,500 non-farm jobs in the month of July 2021. From July 2020 to July 2021, Florida gained a total of 362,100 nonfarm private sector jobs. In the 1st quarter of 2022, Florida’s unemployment rate fell to 3.2% in March 2022, slightly lower than the national average of 3.6% for the same period. Florida lost 1,269,200 jobs from February to April 2020, and has since regained nearly all jobs lost (+1,077,000 jobs). The March 2022 labor force statistics and the total nonagricultural employment are rapidly approaching prepandemic levels of February 2020.
In the 1st quarter of 2022, Florida welcomed 36 million total visitors between January and March 2022, a 14% increase from the prior quarter and a third consecutive quarter that overall visitation has surpassed pre-pandemic levels. Approximately 34.1 million domestic visitors traveled to Florida in the 1st quarter of 2022, representing 12 solid months of domestic visitation growth from 2019, with no signs of
slowing. In addition, Florida welcomed 1.3 million overseas and international travelers in the 1st quarter of 2022, an increase of nearly 169% from the prior year (1st quarter 2021). Florida’s tourism industry has shown continued growth in the beginning of 2022, with no signs of slowing its recovery from the Great Lockdown, and indicating a sustained positive growth for the rest of the year.
The housing market in Florida experienced a slight decline in the 1st quarter of 2022, with Single Family sales down 6.2% year-overyear (“March 2021”); however, median sales prices were up 21.3% year-over-year. Similarly, condominium market sales are down 11.4% year-over-year, and median sale prices are up 27.3% year-over-year. These are all indicators of a slight decrease in demand with tight market conditions.
DEMOGRAPHIC AND SOCIO-ECONOMIC CHARACTERISTICS
Demographic and socio-economic conditions impact overall competitiveness within the broader marketplace. As detailed within the following pages, these demographic and socio-economic statistics reflect the unique marketplace within which the Site is located. To fully understand the context within which the Primary Market functions, demographic and socio-economic conditions have been analyzed for Jacksonville MSA, Duval County, The Beaches (Primary Market), City of Jacksonville Beach (Secondary Market), and the Downtown CRA (Core Market).
The Population has been growing across all areas analyzed, with the Jacksonville MSA experiencing the largest average annual growth rate of 1.65% from 2010–2021, followed by Duval County, the Secondary Market, the Core Market, and the Primary Market, at 1.20%, 1.11%, 0.93%, and 0.81%, respectively.
Figure 3 below reflects total population growth over this same time period across each the five geographies analyzed.

While the Jacksonville MSA has experienced the largest total percent change in population over the 11-year period from 2010-2021 at 19.7%, it is important to understand where that growth is occurring within the Jacksonville MSA. From 2010-2021, the total population of the Jacksonville MSA grew by over 265,500, with approximately over 121,200 (45.6%) of that population growth occurring within Duval County. As depicted in Figure 4, within Duval County, the Primary Market, at 4.2%, has captured the largest percentage of total population growth of the 3 market areas analyzed from 2010-2021, followed by the Secondary Market and Core Market at 2.3% and 0.2%, respectively.

Sources: U.S. Census Bureau; ESRI Business Analyst; GAI Consultants.
Income is another key factor to consider, because it indicates a broad measurement of individual and household spending potential and their general ability to purchase a variety of goods and services. As depicted in the
table below, among the five geographies analyzed, the highest Median Household Income was observed in the Secondary Market, followed by the Primary Market, Jacksonville MSA, Core Market, and Duval County, respectively (see Table 3).
Table 3. Income Comparisons (2021)
Sources: U.S. Census Bureau; ESRI Business Analyst; GAI Consultants.
Although estimates and projections become less reliable in increasingly smaller areas, they are useful for context purposes. Across the five geographies analyzed, population and median household incomes are both projected to continue experiencing growth through 2026. As indicated in Figure 5 below, projected population growth over the 5-year period from 2021-2026 is highest in the Jacksonville MSA at 8.6%. This is followed by Duval County at 6.4%, the Secondary Market at 6.2%, the Primary Market at 6.1%, and the Core Market at 5.4%. However, in terms of median household incomes, the Secondary Market is projected to experience the highest growth over the 5-year period from 2021-2026 at 15.0%, followed by Jacksonville MSA at 13.9%, the Primary Market at 13.2%, Duval County at 11.6%, and the Core Market at 11.2%.
Figure 5. Population and Median Household Income Comparison

Sources: U.S. Census Bureau; ESRI Business Analyst; GAI Consultants.
Figure 3. Population Time Series
Figure 4. Capture of County Growth
Sources: U.S. Census Bureau; ESRI Business Analyst; GAI Consultants.
Focusing specifically on the three market areas, Primary, Secondary, and Core, the following table provides an overview of general demographic and socio-economic make-up (see Table 4).
Table 4. Demographic and Socio-Economic Characteristics (2021)
Age Distribution:
Sources: U.S. Census Bureau; ESRI Business Analyst; GAI Consultants.
MARKET INVENTORY OVERVIEW
The market conditions of commercial uses, including multi-family rental apartments and hotel/motel, have been stable and continue to experience growth across all five geographies analyzed since 2010. As shown in Figure 6, the Jacksonville MSA and Duval County have seen the greatest increases in
inventory in the Multi-Family Rental Apartment (“MF-Rental”) market segment over the 12year time period from 2010-2022 year-to-date (“YTD”). Dissimilarly, the three market areas (Primary, Secondary, and Core) have seen the greatest increases in the Industrial and Hotel/Motel market segments over the same time period. The remainder of this analysis will focus specifically on the Primary, Secondary, and Core Markets as these market areas are the most influential to the market position and any potential development of the Site.

Retail Market
The Retail market segment across all three market areas analyzed has been relatively stable and continues to experience increasing rental rates over the 12-year period from 2010-2022YTD. While the Secondary Market has experienced fluctuations in vacancy rates between a low of 2.6% in 2019 and a high of 15.2% in 2014, the Primary Market and Core Market have both maintained vacancy rates below 10% over the 12-year period analyzed. As shown in Figure 7, the Primary Market contains the greatest overall inventory of Retail space, and the Core Market currently (2022YTD) exhibits the lowest vacancy rates.

Figure 6. Market Inventory Growth
Sources: CoStar; GAI Consultants.
Figure 7. Retail Inventory and Vacancy Rates
Sources: CoStar; GAI Consultants.
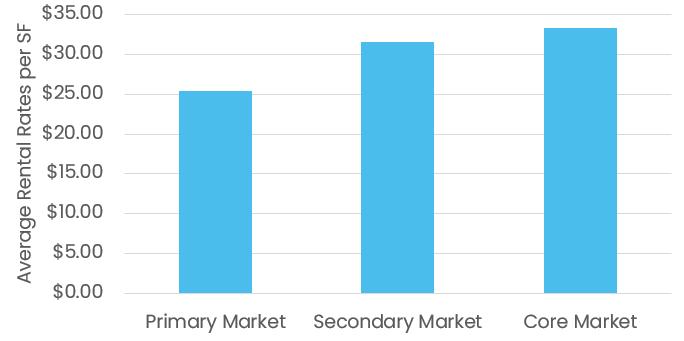
While the Secondary Market has historically experienced greater fluctuation in vacancy rates, the Secondary Market and Core Market command higher average rental rates for Retail space than the Primary Market, as shown in Figure 8. Historically, over the 12-year period from 2010-2022YTD, the Core Market has experienced the greatest overall increase in rental rates at 100.1%, followed by the Secondary Market at 80.4%, and the Primary Market at 55.8%.
Office Market
The Office market segment across all three market areas analyzed has been stable and consistently continues to experience increasing rental rates over the 12-year period from 2010-2022YTD. While the Primary and Secondary Markets are currently (2022YTD) experiencing vacancy rates slightly higher than those of the Core Market, vacancy rates have been steadily declining across all three market areas since 2010; then, the Primary and Secondary Markets were experiencing vacancy rates slightly over 10.0%. As shown in Figure 9, the Primary Market contains the greatest overall inventory of Office space, and the Core Market currently (2022YTD) exhibits the lowest vacancy rates.

While the Primary and Secondary Markets experience slightly higher vacancy rates than the Core Market, vacancy rates below 5% are considered very strong in the Office market segment, generally. The Primary and Secondary Markets command marginally higher average rental rates for Office space than the Core Market, as shown in Figure 10. Historically, over the 12-year period from 2010-2022YTD, the Secondary Market has experienced the greatest overall increase in rental rates at 48.2%, followed by the Primary Market at 46.0%, and the Core Market at 19.3%.
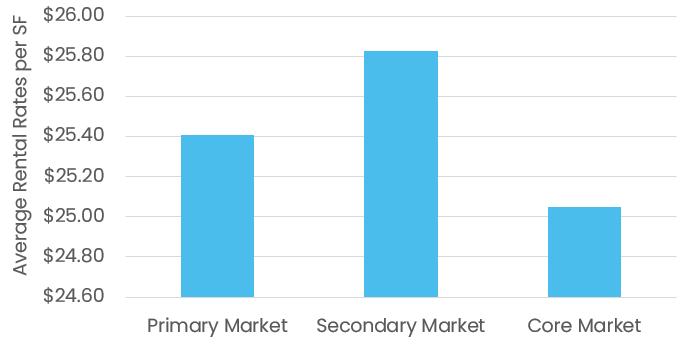

Figure 9. Office Inventory and Vacancy Rates
Figure 8. Retail Average Rental Rates per SF
Sources: CoStar; GAI Consultants.
Sources: CoStar; GAI Consultants.
Sources: CoStar; GAI Consultants.
Figure 10. Office Average Rental Rates per SF
Photo Courtesy of Hotels.com
Industrial Market
The Industrial market does not represent a large amount of space in the Primary or Secondary Market, and there is no true Industrial space located in the Core Market. The minimal Industrial space that does exist is the Primary and Secondary Markets is largely single-tenant/owner-occupied. In the context of the single-tenant/owner-occupied condition of these spaces, the metrics by which performance is analyzed are functionally immeasurable. As shown in Figure 11 on the following page, the Secondary Market captures approximately 91% of the total Industrial space within the broader Primary Market and exhibits the lowest vacancy rate at 0.0%.

With the limited Industrial space inventory across the Primary and Secondary Markets, and the largely single-tenant/owneroccupied condition of the Industrial market segment within these market areas, rental rates are generally expected to be more stable due to lower incidence of tenant turnover and the subsequent less leasing activity. While rental rates are higher in the Secondary Market than the Primary Market, as shown in Figure 12, this is largely driven by the age of Industrial space in the Primary Market by comparison to the Secondary Market. The 26,000 SF of Industrial space within the Secondary Market was all constructed in 2019, and is therefore of higher quality. While this space is also part of the statistical measure of performance in the broader Primary Market, the Primary Market contains an additional 2,700 SF of Industrial space that was built in 1978 and therefore of lower quality, resulting in an overall lower average rental rate in the Primary Market when compared to the Secondary Market.

MF–Rental (Apartment) Market
The MF-Rental market segment across all three market areas analyzed has been stable and consistently continues to experience increasing rental rates per unit over the 12year period from 2010-2022YTD. While the Primary and Secondary Markets are currently (2022YTD) experiencing vacancy rates slightly higher than those of the Core Market, vacancy rates have been steadily declining across all three market areas since 2010; then, the Primary and Secondary Markets were experiencing vacancy rates of 11.3% and 7.7%, respectively. As shown in Figure 13, the Primary Market contains the greatest overall inventory of MF-Rental units, and the Core Market currently (2022YTD) exhibits the lowest vacancy rates.

While the Primary and Secondary Markets experience slightly higher vacancy rates than the Core Market, vacancy rates have declined by 66.4% and 53.2% in 12-year period from 2010-2022YTD in the Primary and Secondary Markets, respectively. The Primary and Secondary Markets command marginally higher average rental rates per unit for MFRental units than the Core Market, as shown in Figure 14. Historically, over the 12-year period
Figure 11. Industrial Inventory and Vacancy Rates
Figure 12. Industrial Average Rental Rates per SF
Sources: CoStar; GAI Consultants.
Sources: CoStar; GAI Consultants.
Figure 13. MF–Rental Inventory and Vacancy Rates
Sources: CoStar; GAI Consultants.
from 2010-2022YTD, the Primary Market has experienced the greatest overall increase in rental rates per unit at 74.9%, followed by the Secondary Market at 61.2%, and the Core Market at 35.1%.

Hotel/Motel (Hospitality) Market
The Hotel/Motel market segment across all three market areas analyzed has been stable and consistently continues to experience increasing average daily rental rates (ADR) over the 12-year period from 2010-2022YTD. While the Secondary and Core Markets are currently (2022YTD) experiencing higher occupancy rates than those of the Primary Market, occupancy rates have been consistently increasing across all three market areas since 2010 (excluding 2020 when stay-at-home mandates were in place due to the COVID-19 Pandemic); then, the Primary Market was experiencing average occupancy rates of 55.0%. As shown in Figure 15, the Primary Market contains the greatest overall inventory of hotel/motel rooms, and the Secondary Market currently (2022YTD) exhibits the highest occupancy rate.

While the Primary Market experiences lower occupancy rates than the Secondary and Core Markets, occupancy rates have increased approximately 22.9% in the 12year period from 2010-2022YTD in the Primary Market. The Primary and Core Markets command marginally higher ADRs than the Secondary Market, as shown in Figure 16. Historically, over the 12-year period from 2010-2022YTD, the Core Market has experienced the greatest overall increase in ADRs, at approximately 127.7%, followed by the Secondary Market at 89.9%, and the Primary Market at 88.5%.


Figure 14. MF–Rental Average Rental Rates per SF
Figure 15. Hotel/Motel Inventory and Occupancy Rates
Figure 16. Hotel/Motel Average Rental Rates per SF
Sources: CoStar; GAI Consultants.
Sources: CoStar; GAI Consultants.
Sources: CoStar; GAI Consultants.
Photo
COMPETITIVE ASSESSMENT
Within the Primary Market, there are other properties that may compete with the Site with regard to attracting developer interest. Understanding the competitive market within which the Site exists is important for context when engaging with potential developers in the form of a public-private partnership, as detailed in Section 2 of this report. The Site encompasses approximately 1.7 acres; therefore, the parameters for identifying potentially competitive properties were limited to vacant properties of 1.5-2.0 acres in size that are similarly positioned for commercial development and located
within the Primary Market. This exercise resulted in the identification of nine potentially competitive properties. The list shown in the table below is not intended to be an exhaustive list of all properties that may be available for development within the Primary Market. The locations of the nine potentially competitive properties identified are shown in Figure 17, and each of the nine potentially competitive properties are detailed in Table 5 below. To note, there may be other properties available for redevelopment within the Primary Market that have not been identified in the table below.


Table 5. Competitive Properties
Photo Courtesy of iStock Photo
Photo Courtesy of iStock Photo
Legend The Beaches (Primary Market)
City of Jacksonville Beach (Secondary Market)
Downtown CRA (Core Market)
Competitive Properties

PRIMARY USES
Identifying which uses to target for a mixeduse development on the Site requires consideration of several factors, including demographic and socio-economic drivers, market performance, development pipeline (projects under construction/ planned/proposed) within the market, and compatibility with the built environment.
Based upon all of these factors, it has been determined based that Industrial, Hospitality, and MF-Rental Apartment uses are not the primary targeted uses for a mixeduse development on the Site. The targeted primary uses, which are the focus of the demand analysis contained in Section 5 of this report, are Office and Retail uses.
Figure 17. Locations of the Competitive Properties
COMPARATIVE LOCATION ANALYSIS
This section illustrates five comparable benchmarks that provide a frame of reference related to the general commercial market and demand capture the proposed Project could potentially achieve within the Primary Market Area.
GENERAL CONTEXT
This approach draws largely, but not exclusively, on the analysis and comparison of markets with similar growth and population attributes Again, there are some limitations; however, the data provides reasonably consistent points of reference.
Creating a destination attraction is not limited to local populations, but will be greatly influenced by demand from local, distant local, domestic, and international visitors. However, sizing the most immediate market is generally the best approach to identifying comparable markets.
In Florida, there is a total of 412 incorporated municipalities distributed across 67 counties. The Primary Market has a land area of 35.9 square miles (“sq. mi.”), in addition to a total population of nearly 60,000 persons and a density of 1,662 persons per sq. mi. Table 6, below, lists a select few incorporated municipalities along the waterfront with a land area, population, and density within +/-20% of the Primary Market includes the following group of comparable benchmarks:
Specifically, this analysis focuses on the general commercial market within each of these comparable markets in terms of total inventory, average rental rates, occupancy levels, and job-related activity. In each of these locations, there is a mix of office and retail/restaurant uses, as illustrated in the table below (see Table 7).
Geography
Total Commercial Inventory (SF) Office Retail/Restaurant
Primary Market 1,711,693 3,956,766
Bonita Springs City 2,528,954 3,897,877
Ormond Beach City 1,755,327 4,233,884
Fort Pierce City 2,599,936 6,019,837
Titusville City 1,792,592 4,051,589
Port Orange City 970,639 3,589,885
Sources: CoStar; GAI Consultants.
Fort Pierce City has a slightly greater amount of both office and retail space, whereas Port Orange City has the least amount of office and retail space. Compared with the other benchmark locations, the Primary Market falls near the lower end of the commercial inventory scale.
In addition, these various office and retail/ restaurant properties within each of the comparable markets have achieved relatively similar performance levels as of year-end 2021, as illustrated in the figures on the following page (see Figures 18 and 19). These related characteristics are beneficial indicators to the potential market opportunities that are most likely achievable as a result of the Project, as well as an identification of the long-term market potential.
Table 6. Comparable Benchmark Locations
Table 7. Benchmark Markets - Commercial Inventory

In all the comparable markets, the occupancy level for the office markets falls between 93.8% and 98.2%, whereas occupancy within the retail markets is slightly higher at 94.4% to 98.5%. The Primary Market falls within the midrange, with an office and retail occupancy of 96.2% and 95.7%, respectively, as of year-end 2021.
In addition, the office market average rental rates per SF for all the comparable markets is between $15.17 and $24.47. Whereas, the average rental rates per SF within the retail markets is slightly lower at $11.99 to $23.66. The Primary Market has the highest average rental rates per SF for its office market at $24.47, and the second highest average rental rates per SF for its retail market at $22.87, as compared to the other benchmark locations.
SPACE UTILIZATION
Space utilization per job, particular to specific building types or industries, represents the typical SF per employee and is a commonly used metric for measuring employment intensity and capacity. Although other factors,

such as remote work, co-working space, and versatile meeting spaces, can impact how much SF is actually needed per employee, space utilization per job generally is a good indicator of how much space an employee needs to work comfortably and productively in a physical setting.
In all the comparable markets, the average SF per employee for combined commercial space was approximately 282 SF, with office space requiring significantly less SF per employee than retail space. This is not surprising as retail space depends largely on “foot traffic” and requires more accommodation space for customers.
Currently, the space utilization per job within the Primary Market is about 256 employees per combined commercial SF. As the Primary Market continues to grow in terms of population, employment, and inventory of commercial space, it appears the average space utilization per job is reasonable to be achieved by the Project within the existing market area.
Table 8. Benchmark Markets - Space Utilization
Figure 18. Benchmark Markets - Occupancy Rates
Figure 19. Benchmark Markets - Avg. Rental Rates per SF
Sources: CoStar; GAI Consultants.
Sources: CoStar; GAI Consultants.
MARKET DEMAND ANALYSIS AND ESTIMATES
This section draws upon Section 4 and illustrates the population and employment projections for the Primary Market; examines the consumer spending and retail leakage within all market areas; and estimates potential demand and supply of commercial inventory, along with expected market performance within the Primary Market over the next 10 years.
POPULATION PROJECTIONS
Approach and Methodology
The Bureau of Economic and Business Research (“BEBR”) has been instrumental in projection populations for Florida and its counties since the 1970s. BEBR provides a high, moderate, and low (“H-M-L”) growth projection extending to 2050 for all Florida counties. Although the moderate scenario appears to be the most accurate forecast of future population change, the high and low scenarios illustrate a range of possible outcomes. It is important to note the population projections provided through BEBR solely reflect Florida residents, and exclude any population change as a result of tourism and seasonal residents.
At the County level, BEBR utilizes five different techniques to estimate population growth in five-year increments. These techniques include: (1) Linear - the population will change by the same number of persons in each future year as the average annual change during the base period; (2) Exponentialthe population will change at the same percentage rate in each future year as the average annual rate during the base period; (3) Share-of-Growth - each county’s share of state population growth in the future will
be the same as its share during the base period; (4) Shift-Share - each county’s share of the state population will change by the same annual amount in the future as the average annual change during the base period; and (5) Constant-Share - Each county’s share of the state population will remain constant at its 2021 level. Based on the results of these techniques, BEBR calculates a weighted average for each individual county and applies that against the base year to estimate future growth. The projections are then compared to the historical population trends and level of population growth projected for the state as a whole.
In 2021, total population was estimated to be nearly 986,200 persons within the County, and 59,742 persons within the Primary Market. Over the last 10 years, 2011 to 2021, the Primary Market has captured an average 6.25% of the total population within the County annually. Whereas, the Primary Market has captured an average of only 4.1% of the net population growth within the County during this same time frame. Applying this capture of net population change to the County’s population projections, according to BEBR, we are able to estimate H-M-L future growth scenarios for the population market within the Primary Market over the near-term (1-5 years) and the mid-term (6-10 years).
2022–2032 Population Estimates
Throughout the projection period, the Primary Market is estimated to increase in population between 2,550 and 9,880 persons, resulting in a total population between 62,290 and 69,620 persons by 2032. During this projection period, total population is estimated to grow

at a compound annual growth rate (“CAGR”) between 0.4% and 1.4% in each of the H-M-L growth scenarios. This range of growth rates is similar to what the Primary Market has previously achieved over the last 10 years, at 0.8%. The figure below illustrates the historic and projected population growth for the Primary Market through 2032 (see Figure 20).

EMPLOYMENT PROJECTIONS
Approach and Methodology
Over the last 10 years, from 2011 to 2021, the average ratio of establishment employment to total population in the County was 55.5 jobs per 100 people. Applying this ratio of jobs per 100 people to the population projections according to BEBR, we are able to project H-M-L growth scenarios for total employment within the County through 2032.
In 2021, total employment was estimated to be approximately 510,745 employees within the County, and 22,105 employees within the Primary Market. Over the last 10 years, from
2011 to 2021, the Primary Market has captured an average 4.0% of the total employment within the County annually. Applying this capture to the estimated County’s employment projections, we are able to estimate H-M-L future growth scenarios for the employment market within the Primary Market over the near-term and the mid-term.
2022–2032 Employment Estimates
Throughout the projection period, the Primary Market is estimated to increase employment between 560 and 6,470 employees, resulting in a total employment between approximately 22,670 and 28,580 employees by 2032. During this projection period, total employment is estimated to grow at a CAGR between 0.3% and 2.6% in each of the H-M-L growth scenarios. This range of growth rates is similar to what the Primary Market has previously achieved over the last 10 years, at 1.3%. The figure below illustrates the historic and projected employment growth for the Primary Market through 2032 (see Figure 21).

Figure 20. Primary Market Historic and Projected Population Growth
Figure 21. Primary Market Historic and Projected Employment Growth
Photo Courtesy of City of Jacksonville Beach
RETAIL LEAKAGE ANALYSIS
What individuals and households spend for retail, restaurants, or other food service provides additional perspective on this analysis. For example, if a member of the population residing in either market area leaves the neighborhood to purchase certain types of goods that are not readily or abundantly available locally, this is commonly referred to as Retail Leakage. The 2021 average consumer spending behavior for the Primary, Secondary, and Core Markets is illustrated in the table below (see Table 9). The largest consumer spending categories within each of the market areas are housing, retail goods, transportation, and health care, as illustrated below. Comparatively, the Primary Market is capturing approximately 9.4% of the total consumer spending within the county as of 2021. This leakage offers an obvious market opportunity.
Table 9. 2021 Average Consumer Spending (dollars in thousands)
Market Areas
Sources: U.S. Census Bureau; GAI Consultants. Note: Totals may not add due to
This analysis compares and contrasts Retail Leakage occurring within the Primary Market, as well as the Secondary and Core Markets, at each 3-digit NAICS industry code between 44-45 (Retail Trade) and 772 (Food Services and Drinking Places). The Surplus/ Leakage Factor, as detailed in the table on the following page (see Table 10), presents a snapshot of retail opportunity and is a measure of the relationship between supply and demand. Values closer to 100 reflect total surplus, whereas values closer to -100 reflect total leakage. The Retail Gap, also illustrated in the following table, represents the actual dollar value difference between retail potential (demand) and retail sales (supply). A positive Retail Gap value indicates there is greater supply than current demand.
Overall, the Primary Market is experiencing a retail leakage of nearly $168.3 million per year, as illustrated in Table 10. Although Food Services and Drinking Places have a positive surplus (sales) of $58.7 million annually, Retail Trade is experiencing a shortage of $227.0 million annually. This retail shortage is primarily driven by a lack of supply within the Motor Vehicle and Parts Dealer, General Merchandise Stores, and Gasoline Stations to meet existing demand within the market area.
Comparatively, the Secondary and Core Markets are both experiencing a slight positive surplus of approximately $39.7 million and $645,678, respectively, in excess of what the resident population would otherwise be expected to support. This suggests that additional sales and receipts are effectively from populations outside these market areas. This is a significant concentration of economic activity, especially given these market areas’ size and relative nearby retailers in adjacent jurisdictions.
In addition, the retail categories experiencing the greatest amount of surplus within the Primary Market, compatible with, or supported by, the smaller market areas include Food Services and Drinking Places; Sports, Hobby, Book, and Music Stores; Furniture and Home Furnishing Stores; Health and Personal Care Stores; and Miscellaneous Store Retailers.
Table 10. 2021 Retail Surplus/Leakage for All Market Areas
Sources: U.S. Census Bureau; GAI Consultants. Note: Totals may not add due to rounding.
Based upon analysis of spending patterns, existing inventory, and retail surplus/ leakage within the Primary Market, as well as the Secondary and Core Markets, there appears to be slight need for additional retail capacity within the market areas. As a result of population and employment growth over the last 10 years, developers will respond to the opportunities presented. However, there are important distinctions between need and demand.
Need is a relatively static concept, driven primarily by deficiency and insufficient supply. Viewed through such a lens, need is largely a planning and welfare matter often measured exclusively by gains or losses in population. Responses to need typically focus on community priorities without reference to the capacity of the market to provide alternatives through profit driven transactions. Needs are real and definable, but they cannot always be adequately addressed.
Demand, on the other hand, is a dynamic concept. It is very price and product driven— functionally, the result of choices, age, lifestyle,
preferences, and continued movement of the population. Even when need is limited, demand can be strong in a marketplace that has proven itself a reliable and systematic source for products and services.
In the present case, there are elements of both need and demand within each of the market areas. To that point in particular, residents drawn to the Primary Market must go elsewhere to meet shopping needs related to Motor Vehicle and Parts Dealers, General Merchandise Stores, and Gasoline Stations. Although these demands could be met by additional industry-specific retail capacity, these market areas are clearly not conducive, in terms of character, space and scale, for these types of retail stores.
Altogether, this retail leakage analysis helps identify opportunities for industry-specific retail uses that could be supported by the current demand within the Primary Market, as well as capturing some, if not all, of the necessary demand within Secondary and Core Markets.
COMMERCIAL SPACE DEMAND ANALYSIS
New Commercial Demand
Demand for commercial space is a function of the type and nature of the employment industry it supports. While a strong regional tourist industry exists in the Primary Market and is concentrated along the coast, the MSA is expected to remain the major draw for regional employment. The consequence is that most employment growth and, therefore, demand for commercial space in all of the market areas would be driven by supporting population needs in services and community and neighborhood retail.
Based on the H-M-L projections of population and employment through 2032, along with the space utilization per job ratios, the Primary Market would need an increase of between 259,400 SF and 1,805,200 SF of additional commercial space to support new demand— roughly an annual rate between 25,900 SF and 180,500 SF per year, as shown in Table 11. Table 11 also illustrates the H-M-L estimated total SF for office, retail, and combined commercial space at the end of the near-term (5 years) and mid-term (10 years) that is reasonably achievable based on demand projections.
result of a recovering economy following the latest recession. In the mid-term, the addition of new commercial space is predicted to grow at a slightly lower, steady rate between 0.1% and 1.7% CAGR, as supply of vacant commercial land lessens and redevelopment of existing space comprises the majority of additional growth in commercial SF. These rates of growth are similar to what the Primary Market has previously achieved over the last 20 years. Applying these growth rates, Figure 22 below illustrates the H-M-L demand estimates for total commercial space throughout the projection period.

Potential Capture of Other Markets
As previously defined, the Secondary and Core Markets are located within the Primary Market. As a result, these market areas will capture a portion of the new commercial space throughout the projection period.
Based on historic employment and capture of existing commercial space relative to the Primary Market, the following results are anticipated:
Sources: CoStar; GAI Consultants. Note: Totals may not add due to rounding.
This analysis predicts that in the near-term, the rates of growth will be slightly higher, at a CAGR between 0.8% and 3.9%, as the Primary Market adjusts to the influx of new population and employment growth, as well as increases in visitation and the tourism industry as a
▪ The Secondary Market will capture an average of 68% annually of the new commercial space within the Primary Market; and
▪ The Core Market will capture an average of 8% annually of the new commercial space within the Primary Market.
Table 11. New Commercial Demand – Primary Market
Figure 22. New Commercial Demand – Primary Market
Sources: CoStar; GAI Consultants.
▪ These capture rates are comparable to what the commercial markets within the Secondary and Core Markets have previously captured relative to the Primary Market at 71% and 10%, respectively, over the last 10 years.
Utilizing this approach, the Secondary Market would need an increase of between 94,300 SF and 1,176,400 SF of additional commercial space to support new demand—roughly an annual rate between 9,400 SF and 117,600 SF per year. As a result, the total commercial space within the Secondary Market would equate to between 4,149,500 SF and 5,231,600 SF by 2032.
In addition, the Core Market would need an increase of between 28,600 SF and 138,100 SF of additional commercial space to support new demand—roughly an annual rate between 2,900 SF and 13,800 SF per year. This equates to total commercial space within the Core Market between 649,100 SF and 758,600 SF by 2032. Although this analysis suggests that a portion of the new commercial demand within the Primary Market could be captured within the Secondary and Core Markets, that capture is subject to land availability, zoning and regulations, and the population within those other markets to support new commercial structures.
Proximate New Commercial Capacity (Supply)
Currently, there are only about 21 acres of commercial vacant land with a proposed use of office and/or retail within the Secondary Market, approximately 32% of the total acres are located within the Core Market most proximate to the Project. At the FAR of 0.50, previously discussed in Section 1 of this report, this equates to a total of less than 500,000 SF. As a result, this competing capacity is well below the high and moderate projections for potential demand within the Secondary Market throughout the projection period. Therefore, the Project is well positioned relative to the proximate market, since existing supply does not exceed potential new demand.
ESTIMATED MARKET PERFORMANCE Approach and Methodology
This analysis relies upon current and historic commercial real estate data within the Primary Market compared with the larger region to provide estimates of potential market performance in the form of rents, occupancy rates, and absorption. Based on the potential size and primary uses for the Project previously described within this report, this analysis was narrowed to focus on market trends occurring in properties of similar size (less than 225,000 SF) and use (office and retail) within the Primary Market. The following sub-sections highlight the estimated market performance for combined office and retail uses the Project is likely the achieve throughout the projection period.
Occupancy Rates
Over the last 10 years, commercial properties within the Primary Market of less than 50,000 SF have experienced a CAGR in occupancy rates of 0.27%, increasing over 2.5% from 93.8% in 2013 to 96.3% in 2022YTD. Applying a range of comparable growth rates forward, it is possible to estimate potential H-M-L occupancy rates the Primary Market may reasonably achieve throughout the projection period (see Figure 23).
As illustrated in the figure below, occupancy rates may slightly decline in the near-term in the moderate and low scenarios. Over the mid-term, occupancy rates may experience a positive upward trend in all scenarios, rising above the historic 2018 peak by 2031 in all three scenarios.

Figure 23. Occupancy Rate Estimates Sources: CoStar; GAI Consultants.
Market Rent per SF
Over the last 10 years, commercial properties within the Primary Market of less than 50,000 SF have experienced a CAGR in average market rents per SF of 3.7%, increasing over $7.98 from $18.06 in 2013 to $26.04 in 2022YTD. Applying a range of comparable growth rates forward, it is possible to estimate potential H-M-L market rents per SF that the Primary Market may reasonably achieve throughout the projection period (see Figure 24).
As illustrated in the figure below, average market rents per SF will continue a positive upward trend throughout the projection period in all scenarios. By 2032, average market rents per SF are estimated to reach between $27.40 in the low scenario and $38.73 in the high scenario.

Net Absorption
Over the last 10 years, commercial properties of less than 50,000 SF within the Primary Market have experienced a CAGR in net absorption of 0.6%, with a 10-year annual average of 22,800 SF absorbed each year. Applying a range of comparable growth rates forward, it is possible to estimate potential H-M-L net absorption the Primary Market may reasonably achieve throughout the projection period (see Figure 25).
Net absorption will continue to fluctuate over the next 10 years, as illustrated in the figure below. During this same time frame, net absorption is expected to experience an annual average between approximately 12,700 SF and 27,000 SF absorbed in the Primary Market each year.

CONCLUDING STATEMENTS
Throughout the next 10 years, from 2022 to 2032, the Primary Market is expected to see population and employment growth, with a CAGR of 0.9% and 1.4%, respectively, in each of the moderate scenarios. In addition, the Primary Market is also experiencing a retail leakage of nearly $168.3 million per year, largely driven by a shortage in Retail Trade sales. To combat this leakage, as well as prepare for the influx of additional population and employment, the Primary Market would need an increase of between 259,400 SF and
1,805,200 SF of additional commercial space through 2032—with the Secondary and Core Markets capturing 68% and 8%, respectively, of this new commercial space annually. Relative to this demand for additional commercial space, along with the insufficient amount of existing supply to meet new demand within the markets most proximate to the Project, the Site is well positioned for commercial development, and is expected to experience increasing occupancy rates and average market rents.
Figure 24. Market Rents per SF Estimates
Figure 25. Net Absorption Estimates
Sources: CoStar; GAI Consultants.
Sources: CoStar; GAI Consultants.

Photo Courtesy of Sean Pavone, iStock Photo Jacksonville Beach Market Analysis | Duval County, FL

T
gaiconsultants.com/communitysolutions