CHIFFRES CLES BAT
5/12/08
11:22
Page 29
6.7% and drugs increased by 8.9%). Fortunately, though the sickness branch showed a net debt, the global budget for all social security branches showed a credit balance. After analysis of the national health budget, the Health Ministry announced that health spending in France in 2001 would increase to 148 billion euros or an average of 2,437 euros per inhabitant. Health and medical products costs, the total sum spent by French to care for themselves (reimbursed or not), was 128 billion euros, an increase of 5.8% in value and 5.2% in volume compared to 2000. This represents 8.7% of the gross domestic product (GDP). A study conducted by the DREES (Direction de la Recherche, des Études, de l’Évaluation et des Statistiques or Research, Study, Evaluation and Statistics Bureau) of the Ministry for Social Affairs published in June 2002, showed that increases in health spending have tended to slow over the last decades in most developed countries but still remain greater than the GDP. According to the OECD (Organization
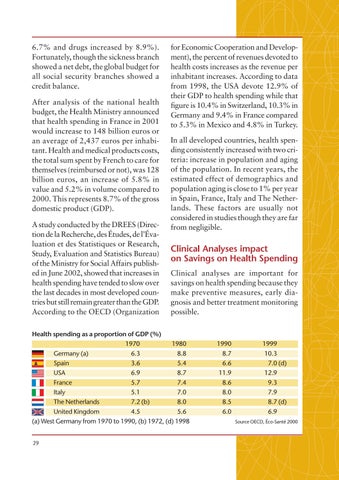
for Economic Cooperation and Development), the percent of revenues devoted to health costs increases as the revenue per inhabitant increases. According to data from 1998, the USA devote 12.9% of their GDP to health spending while that figure is 10.4% in Switzerland, 10.3% in Germany and 9.4% in France compared to 5.3% in Mexico and 4.8% in Turkey. In all developed countries, health spending consistently increased with two criteria: increase in population and aging of the population. In recent years, the estimated effect of demographics and population aging is close to 1% per year in Spain, France, Italy and The Netherlands. These factors are usually not considered in studies though they are far from negligible.
Clinical Analyses impact on Savings on Health Spending Clinical analyses are important for savings on health spending because they make preventive measures, early diagnosis and better treatment monitoring possible.
Health spending as a proportion of GDP (%) 1970 1980 Germany (a) 6.3 8.8 Spain 3.6 5.4 USA 6.9 8.7 France 5.7 7.4 Italy 5.1 7.0 The Netherlands 7.2 (b) 8.0 United Kingdom 4.5 5.6 (a) West Germany from 1970 to 1990, (b) 1972, (d) 1998
29
1990 8.7 6.6 11.9 8.6 8.0 8.5 6.0
1999 10.3 7.0 (d) 12.9 9.3 7.9 8.7 (d) 6.9 Source OECD, Éco-Santé 2000
