

In 2022, Ukraine's utilised agricultural area covered 41.3 million hectares, including 32.7 million hectares of arable land (State Statistics Service of Ukraine (SSSU)). This agricultural area makes Ukraine the largest agricultural country on the European continent. 45% of the country's surface area is made up of particularly fertile humus-rich soils, known as "rich" chernozioms. These are found mainly in the country's central plain.
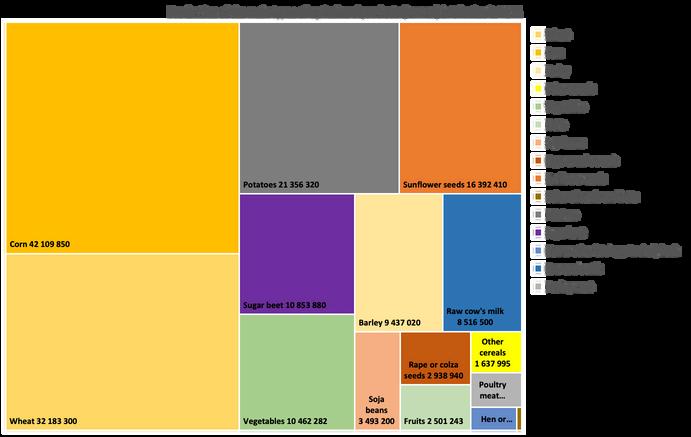
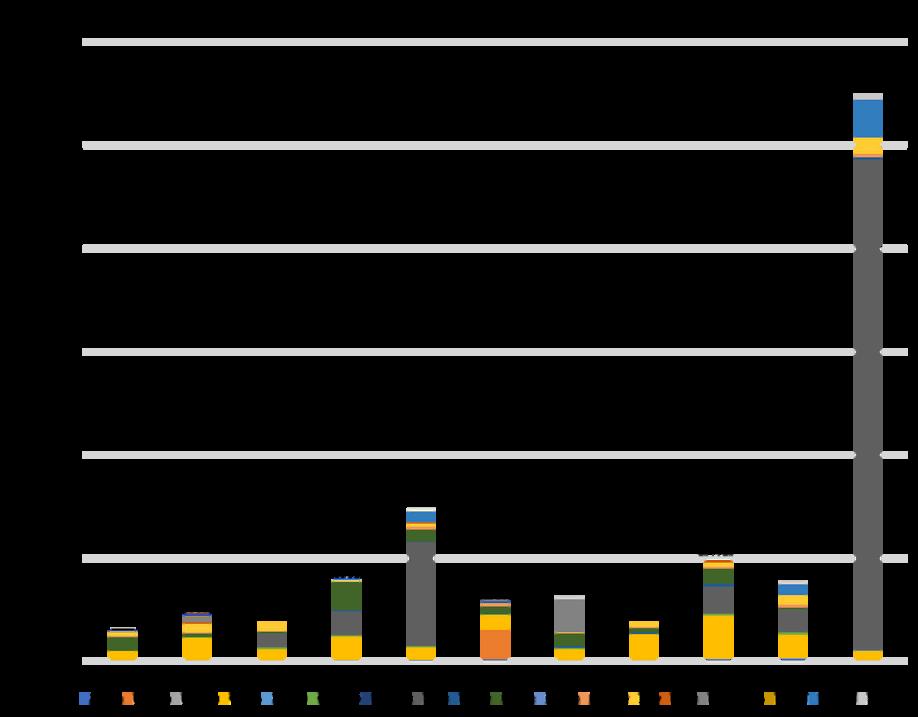
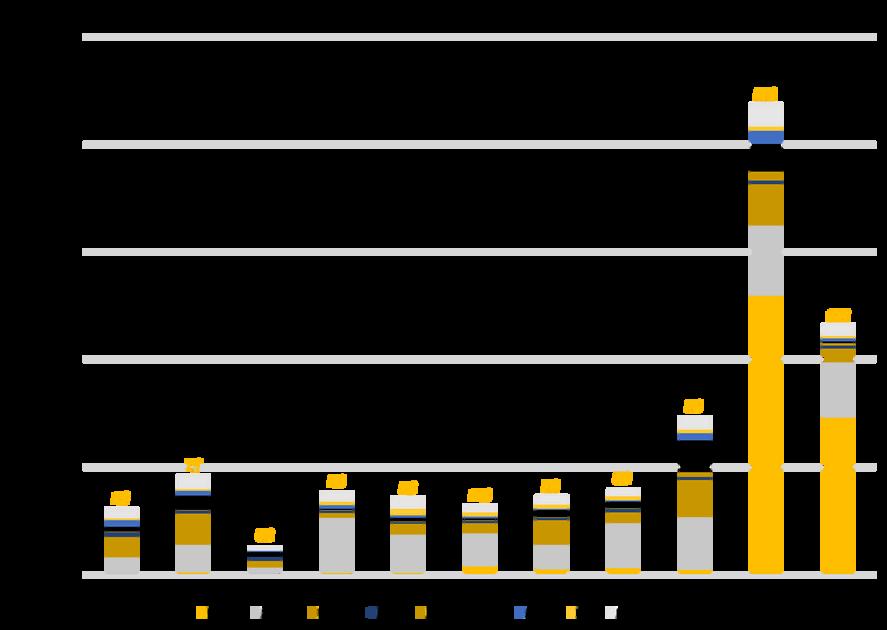
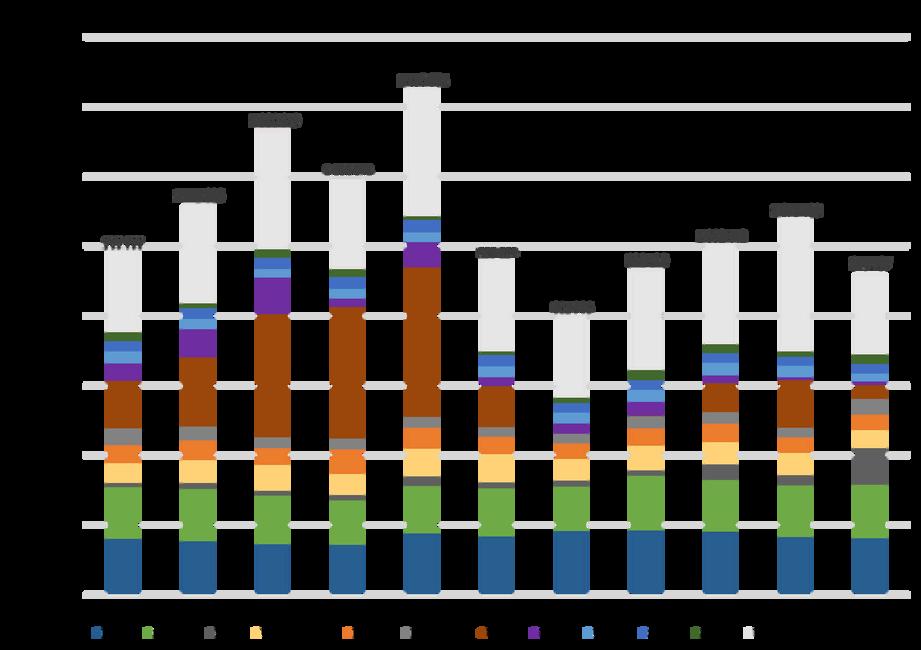
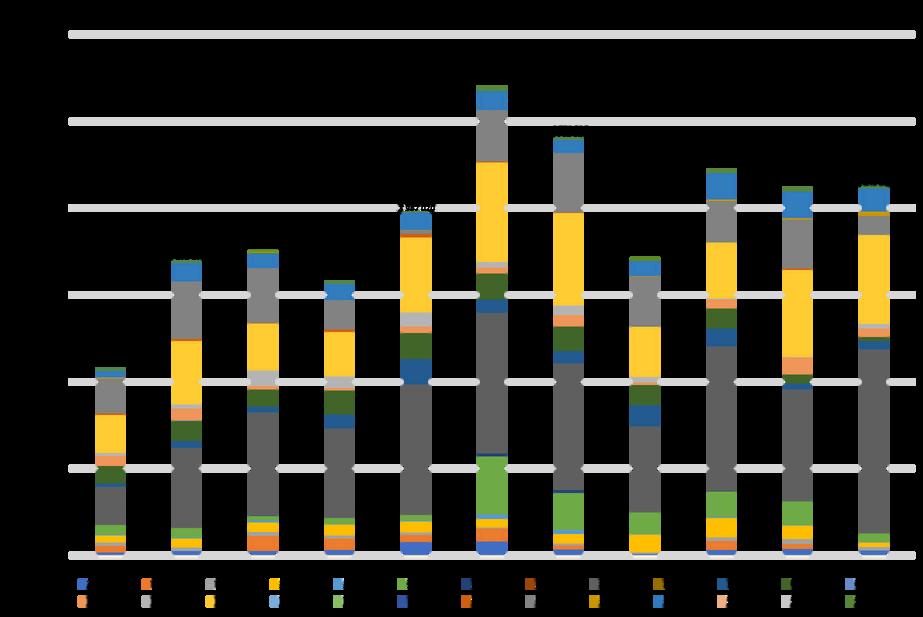
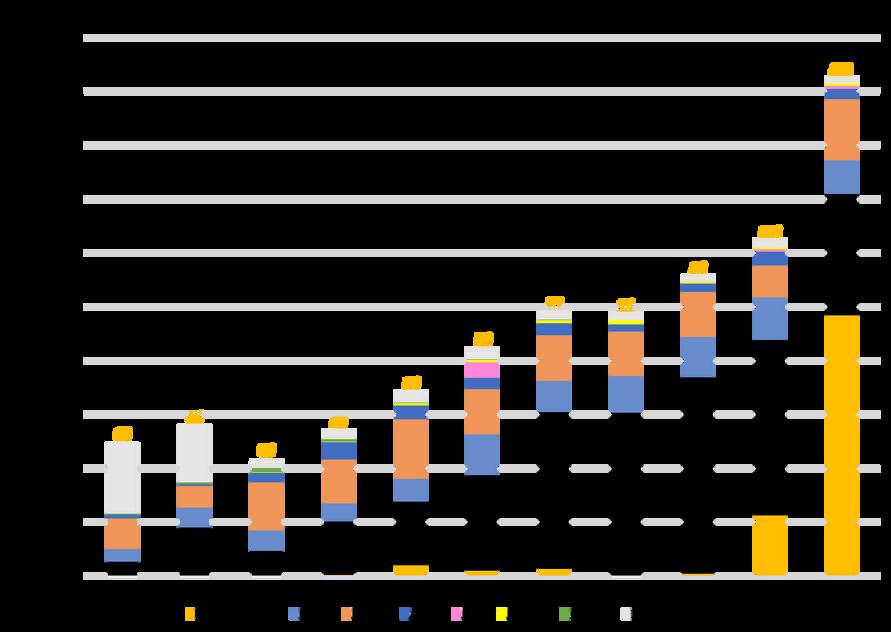
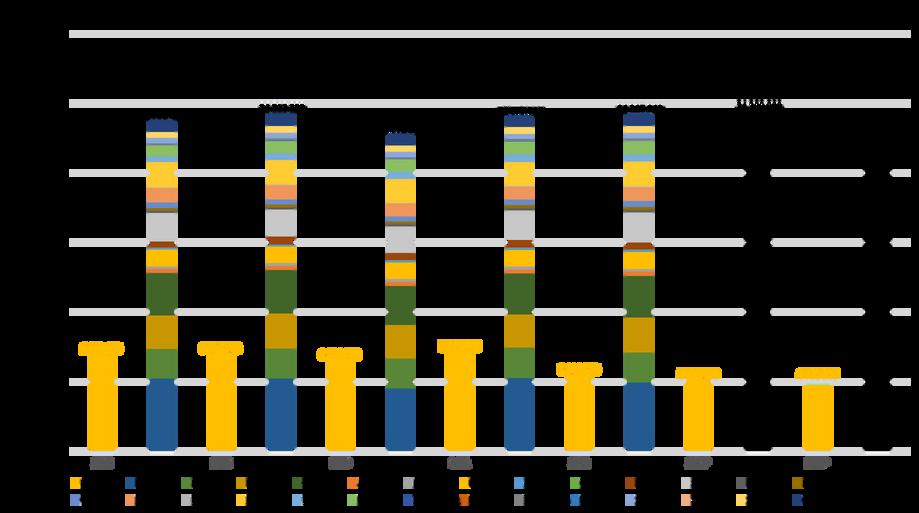
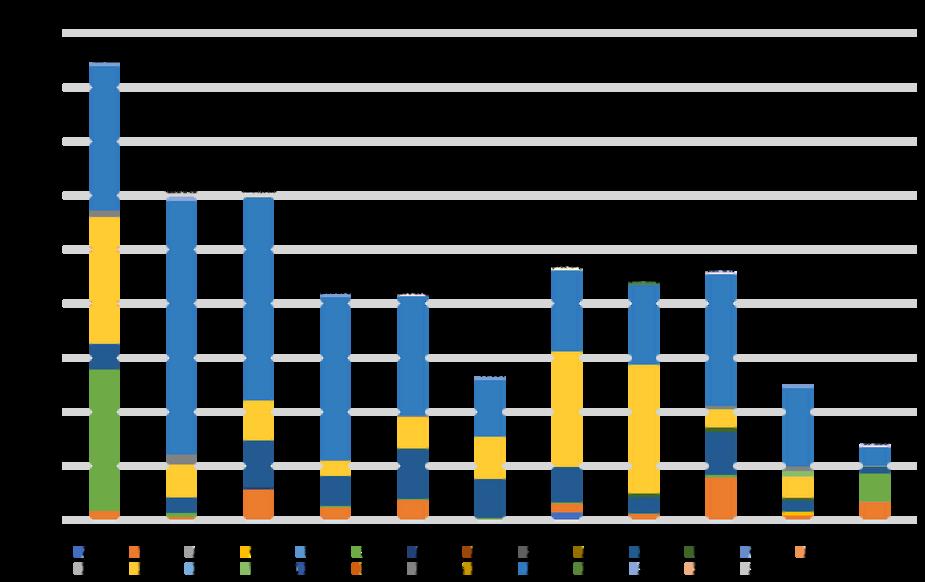
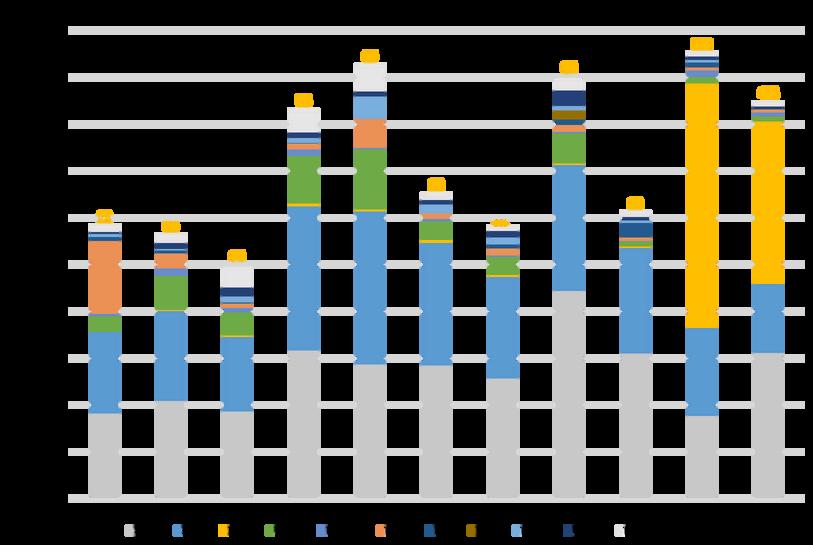
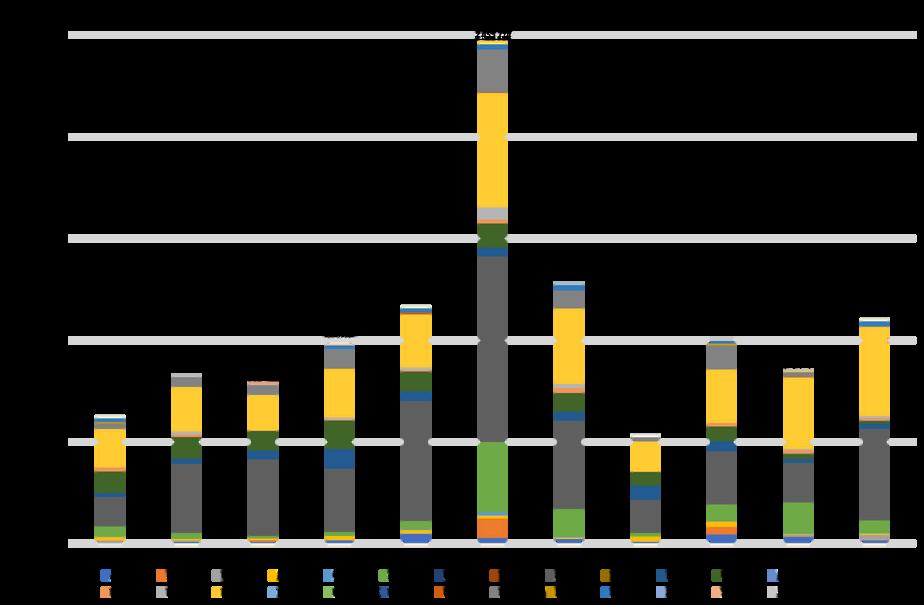
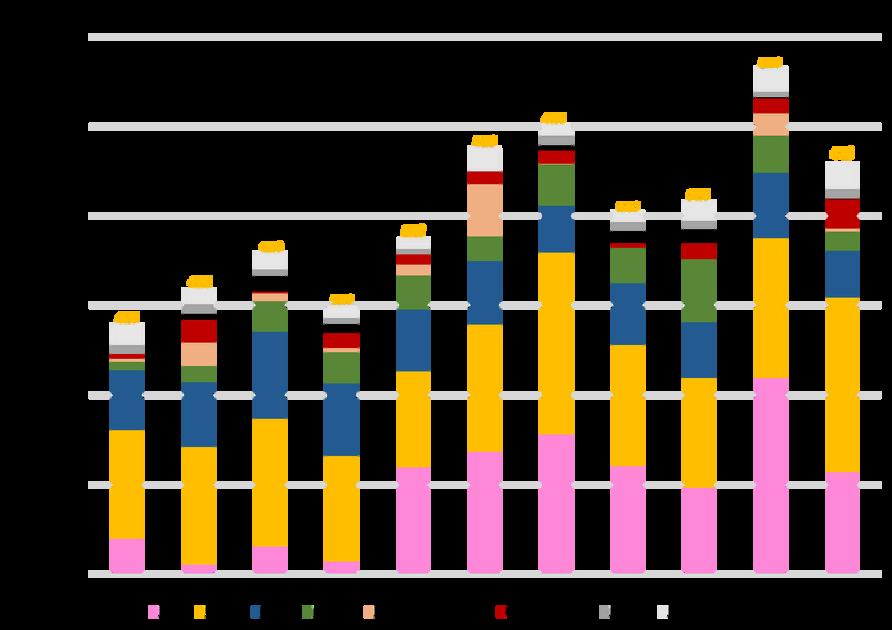
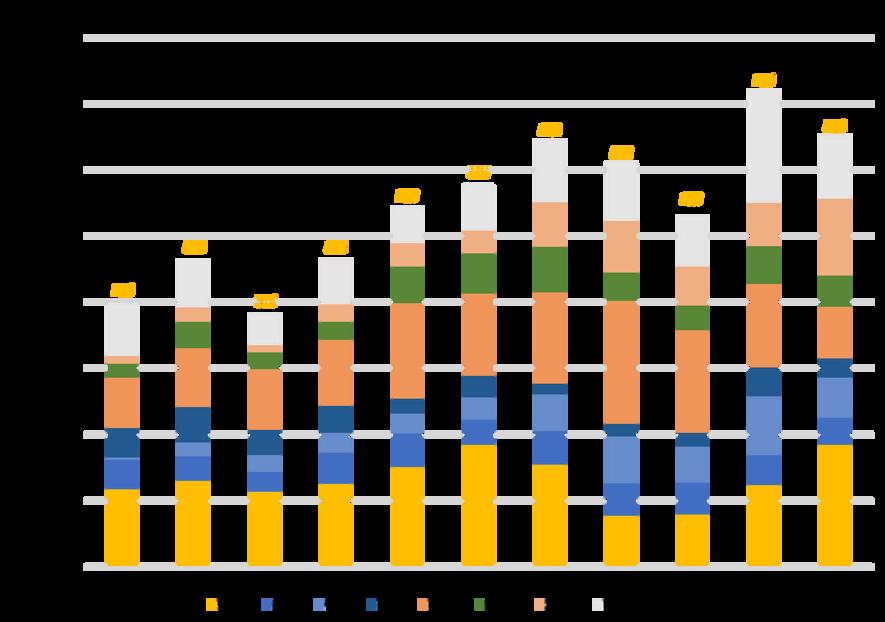
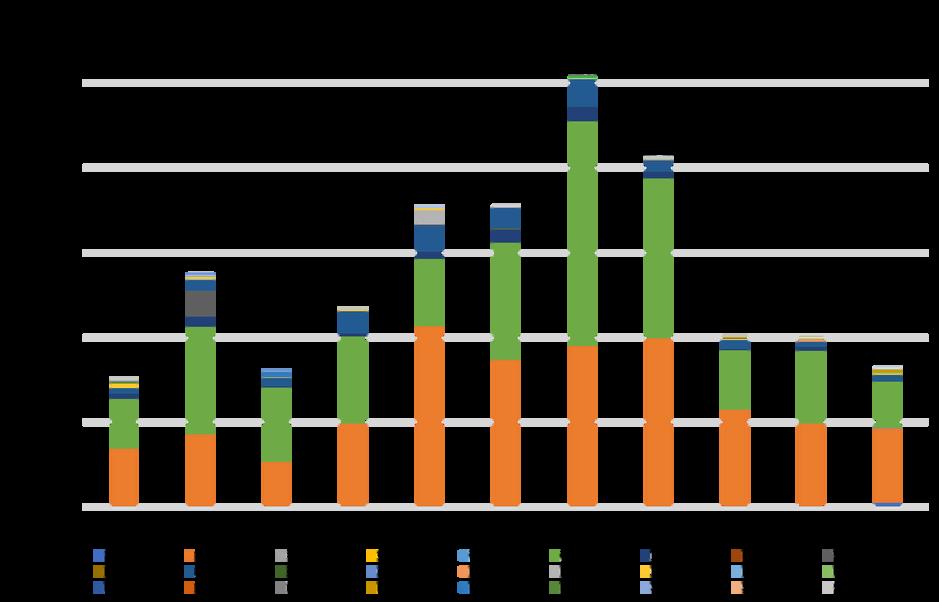
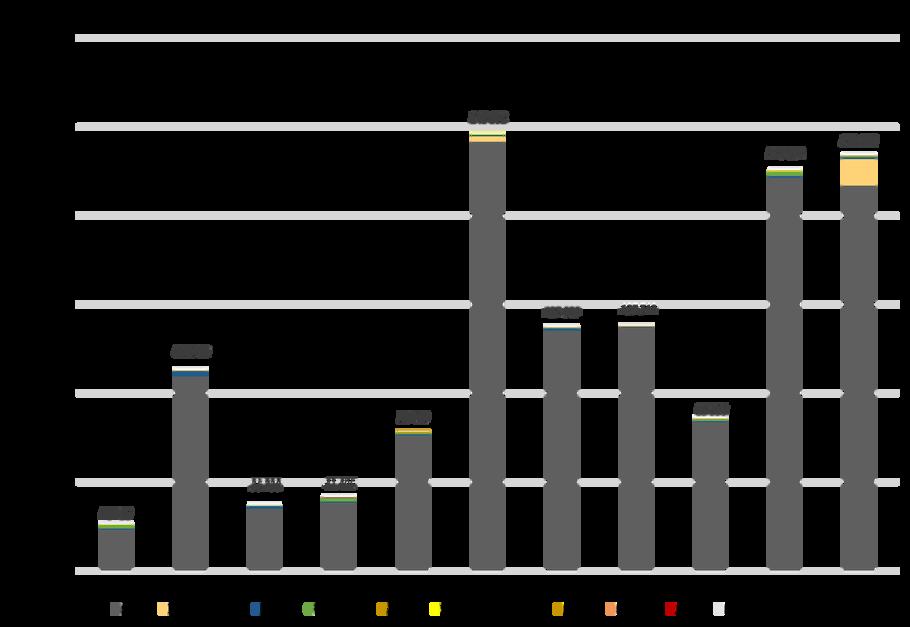
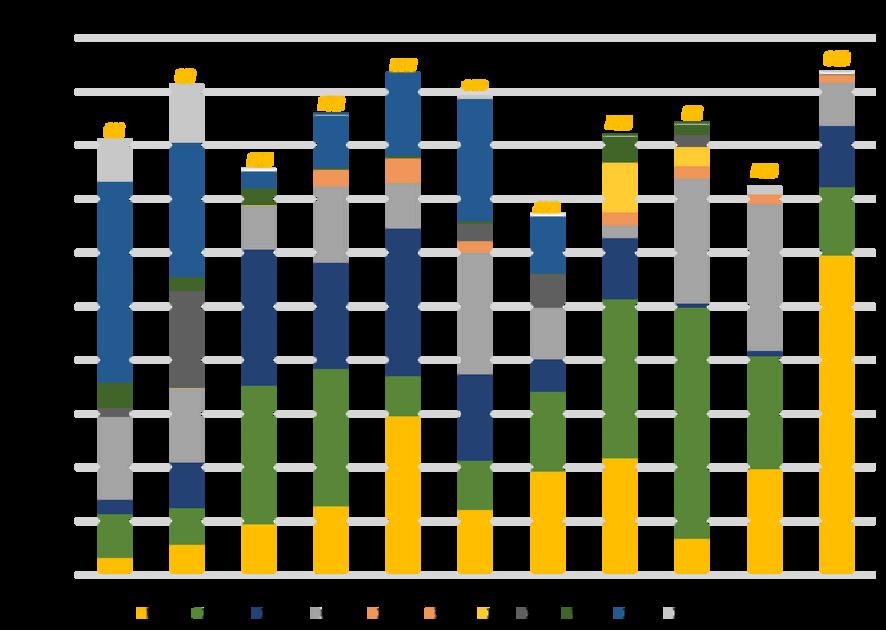
Figure 1 - Production of the main types of agricultural products in volume (tons) in Ukraine in 2021 Source: FAOStat
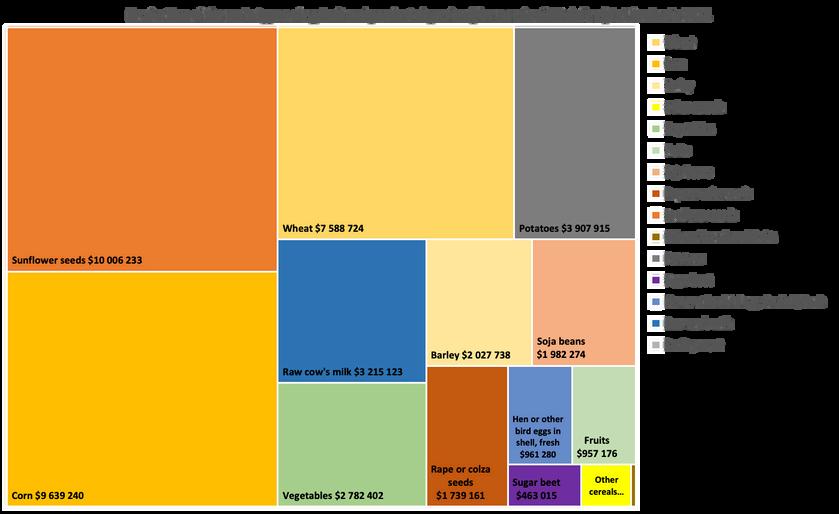
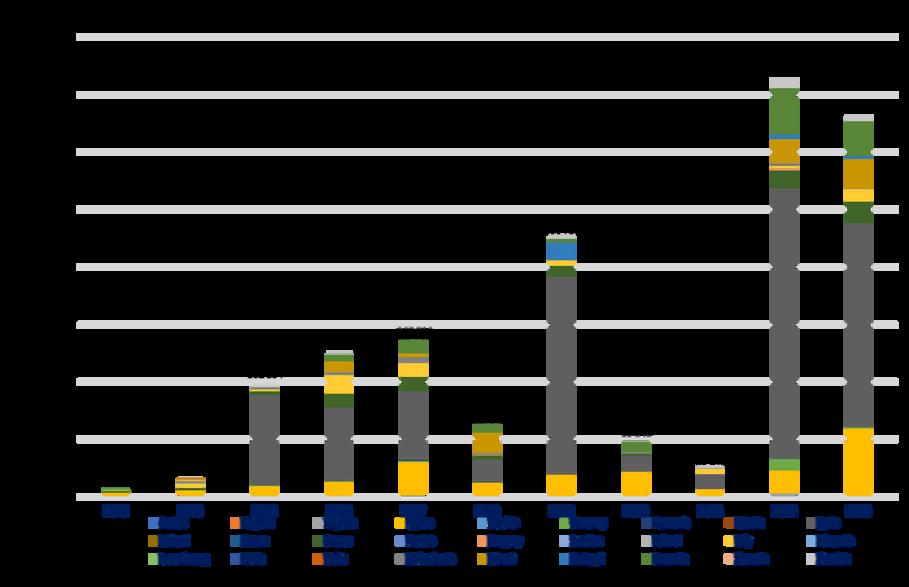
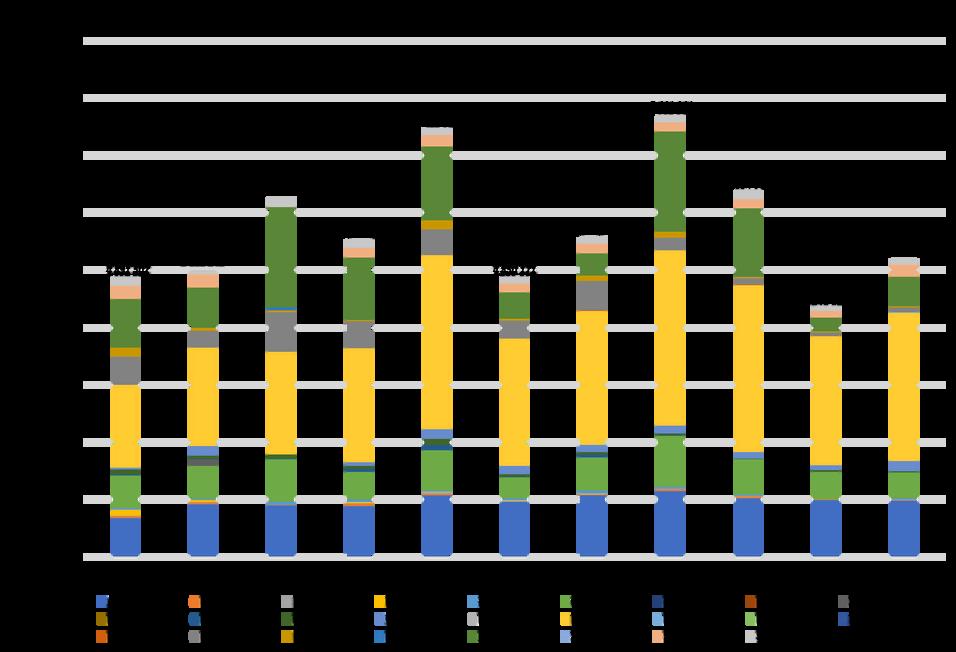
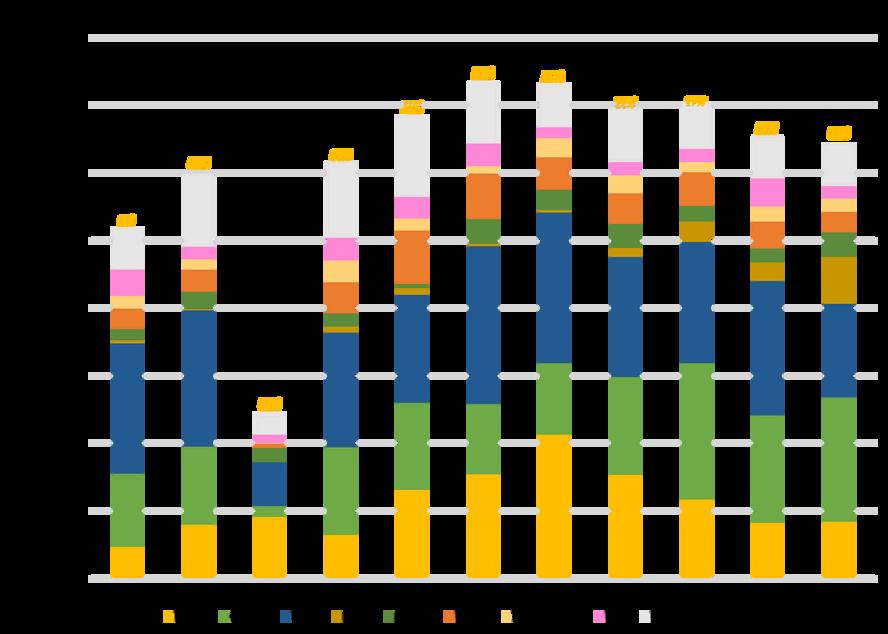
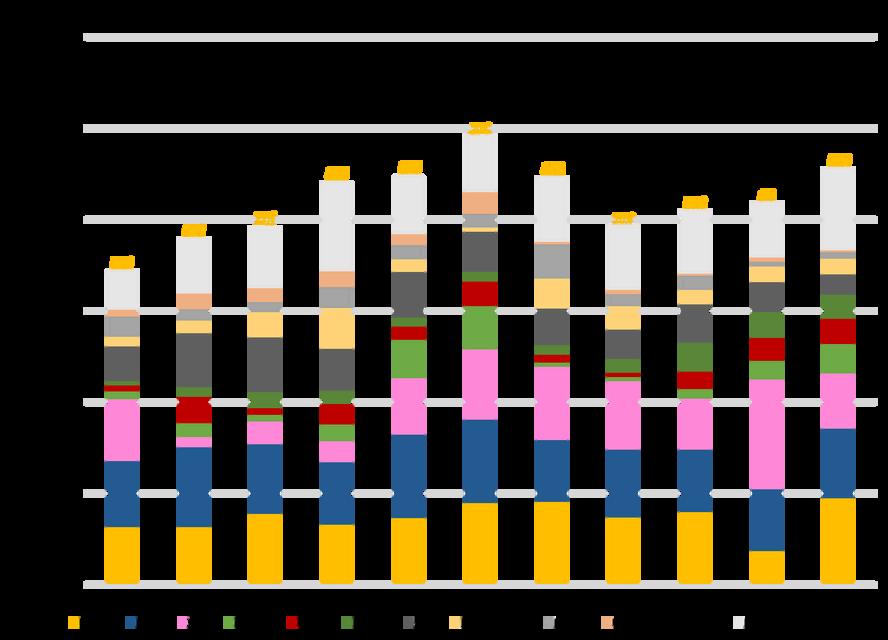
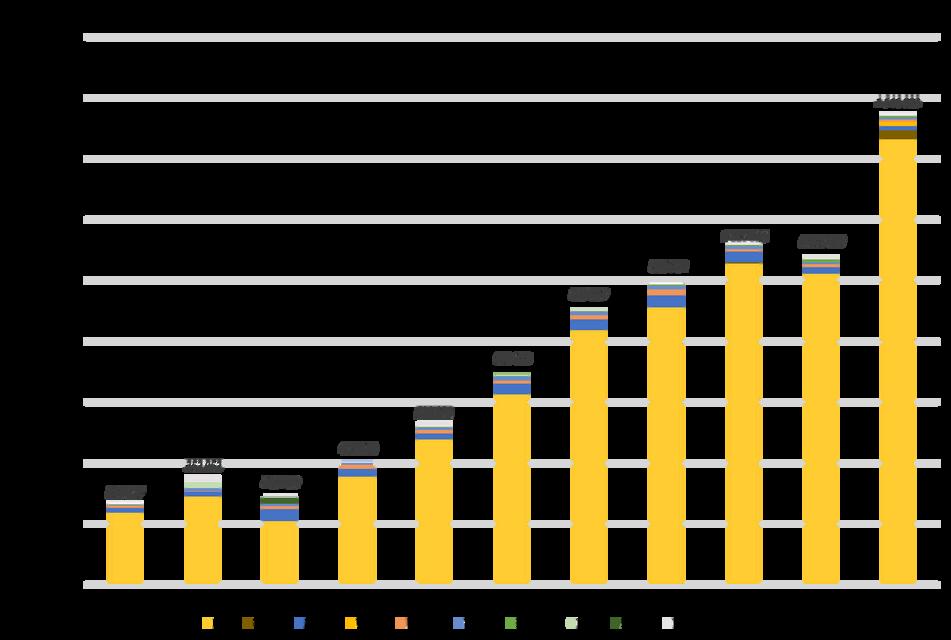
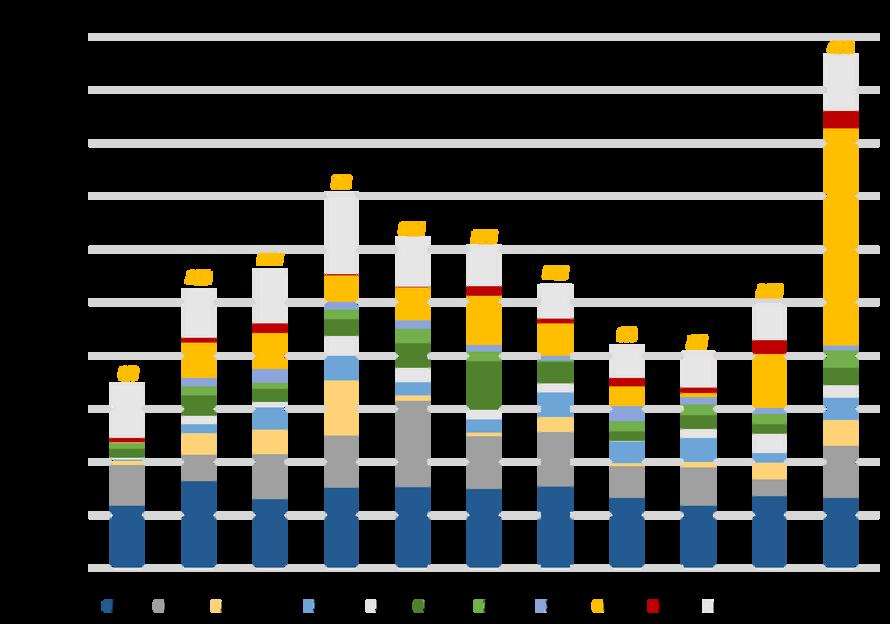
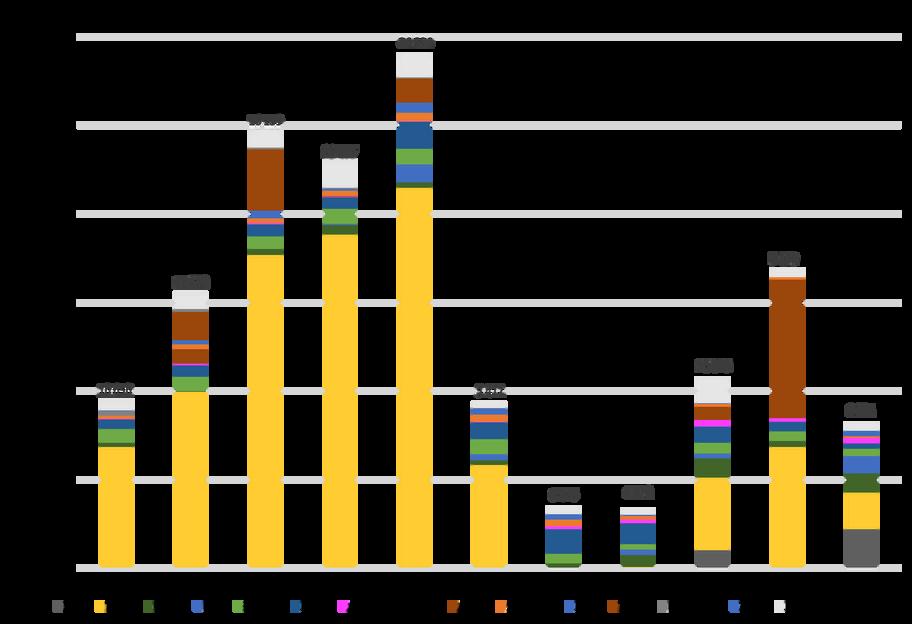
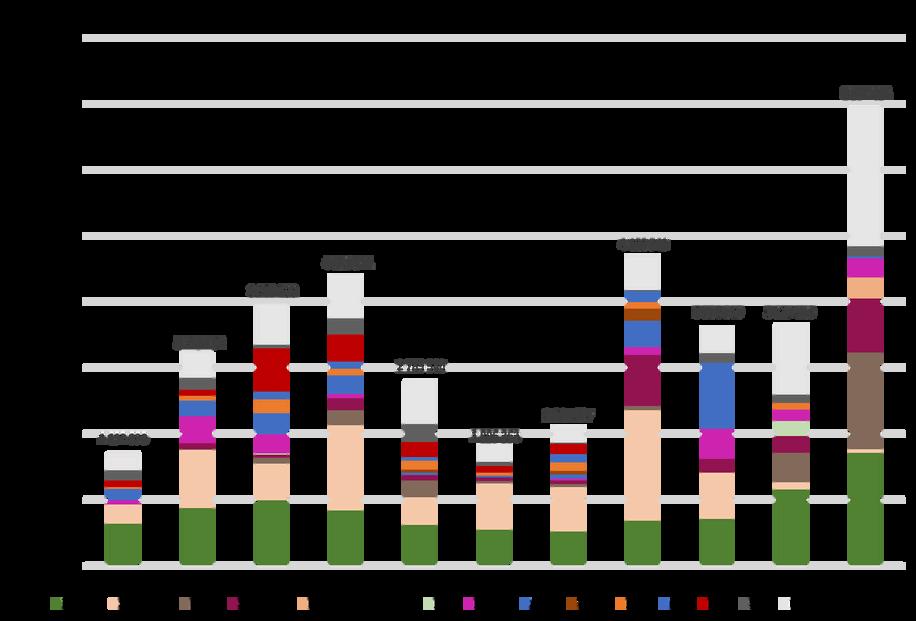
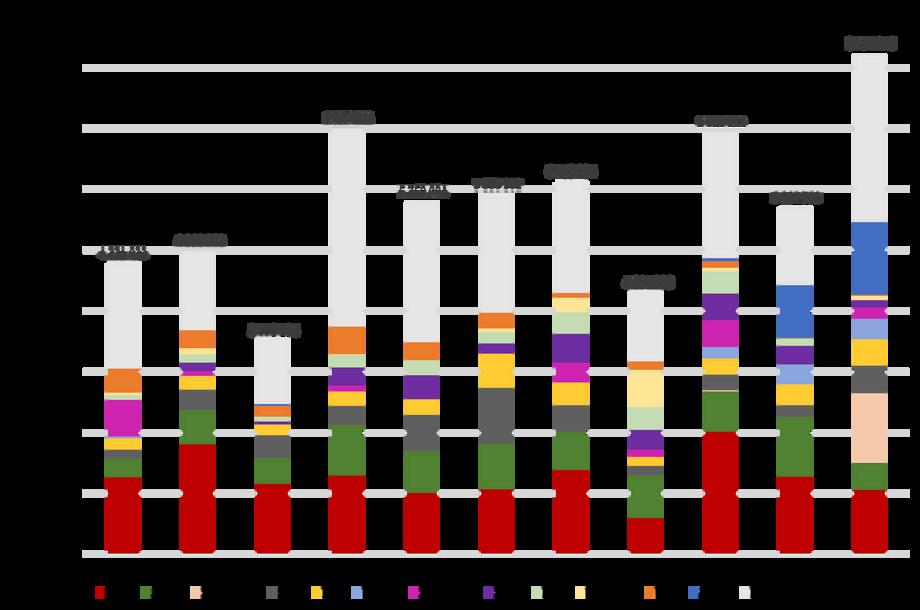
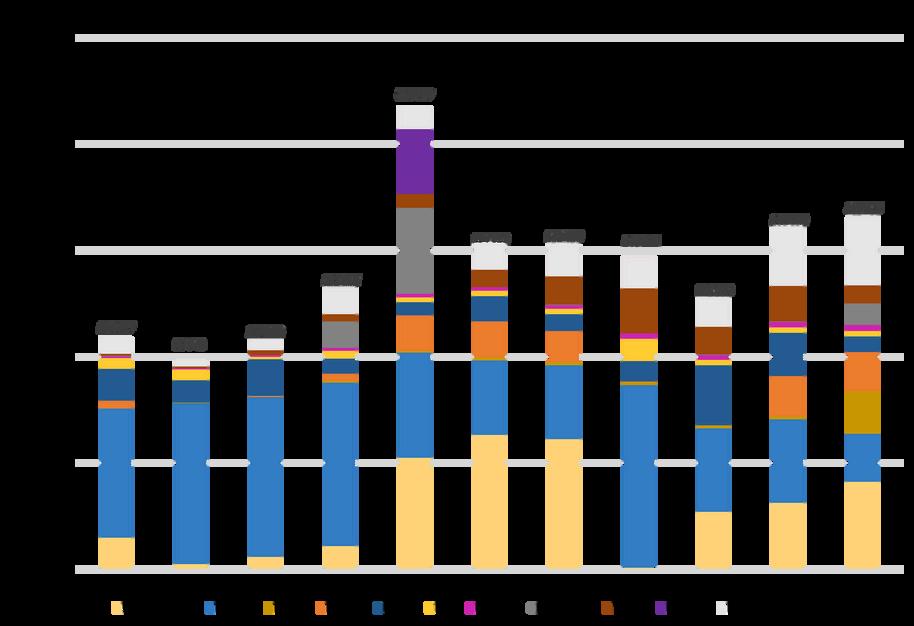
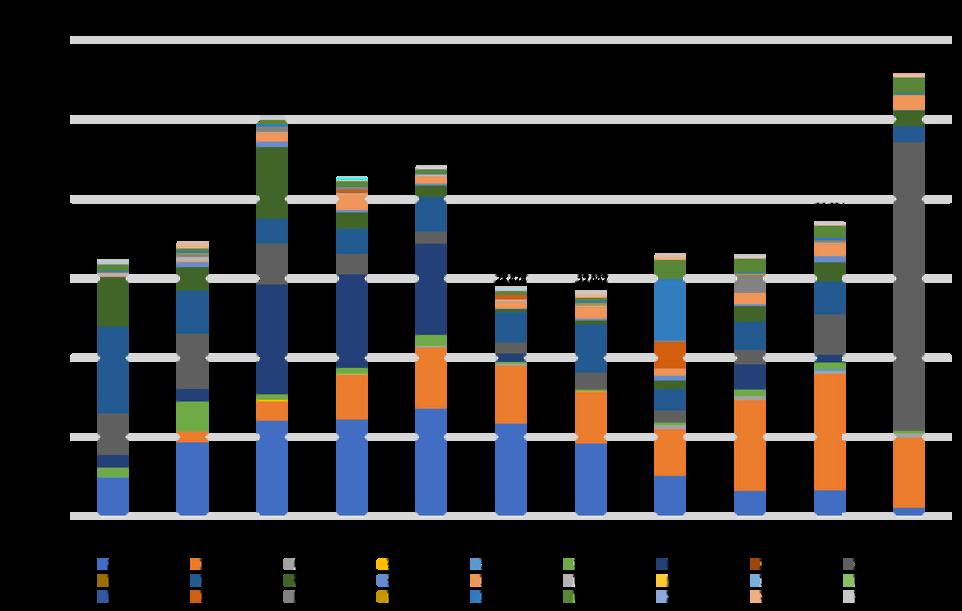
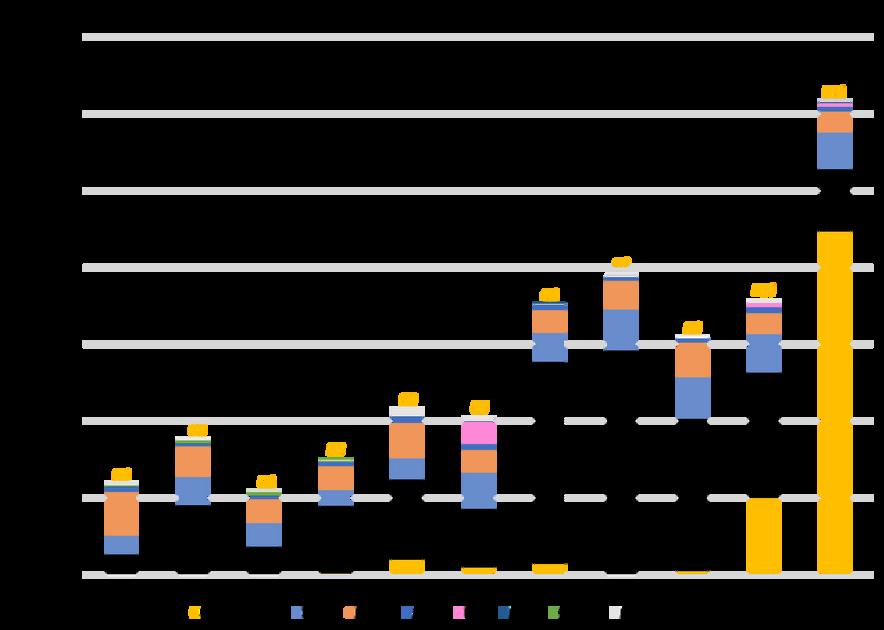
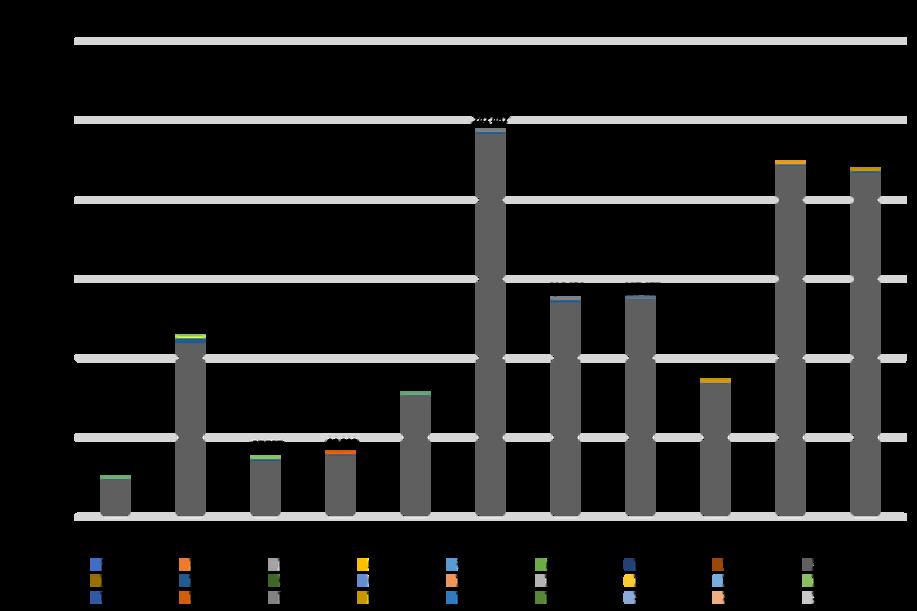
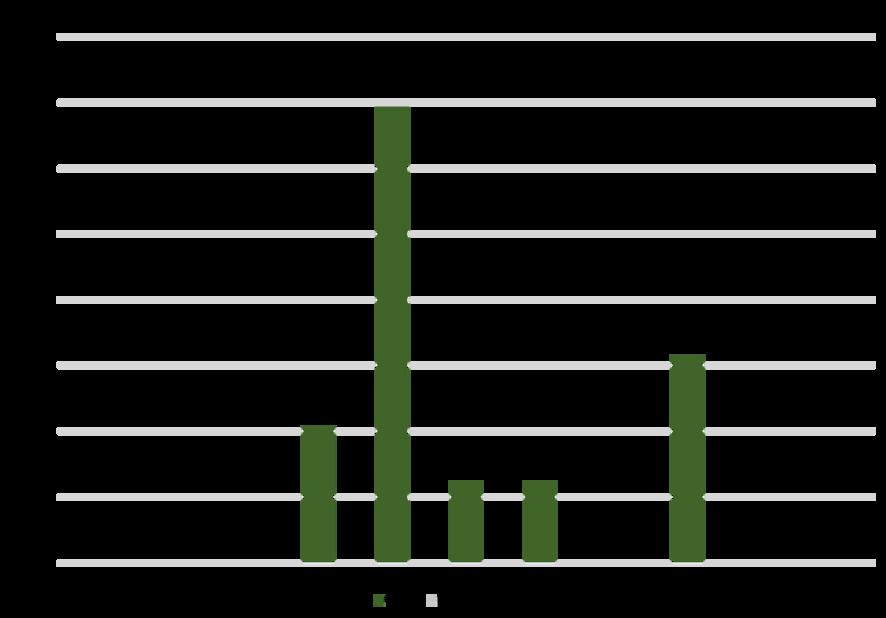
Figure 2 - Figure 2 - Production of the main types of Production of the main types of agricultural products, excluding meat, agricultural products, excluding meat, by by value (thousands of US dollars) value (thousands of US dollars) iin n Ukraine in 2021 Ukraine in 2021 Source Source: FAOStat : FAOStat
Note Note :: data data not available for meat. not available for meat.
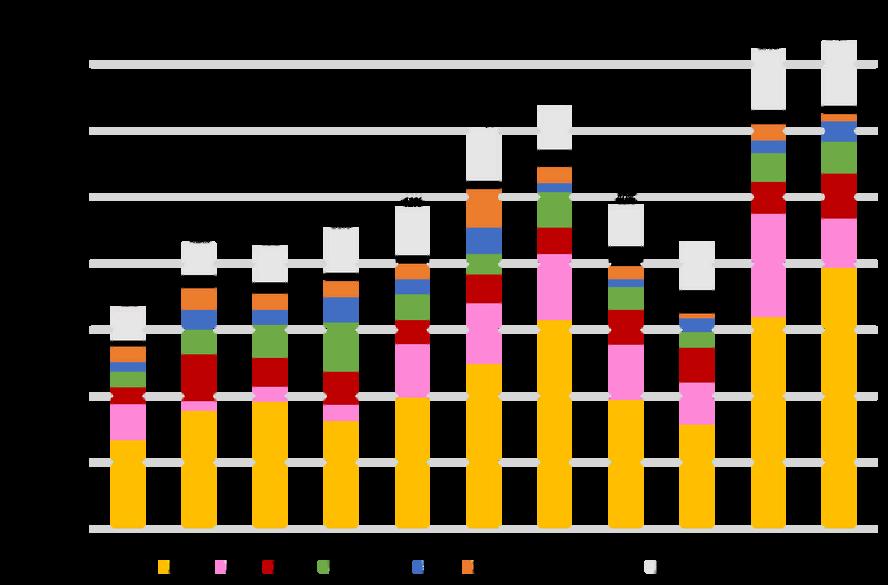
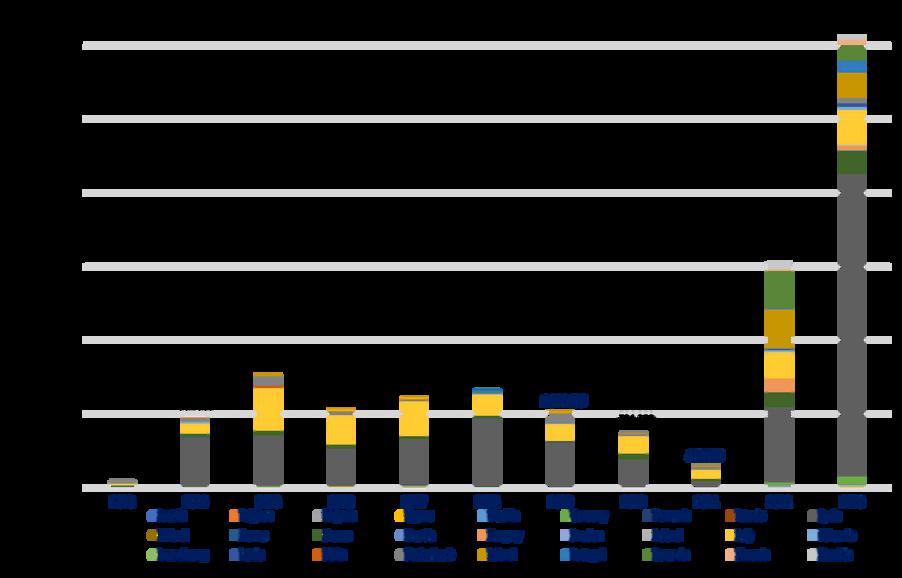
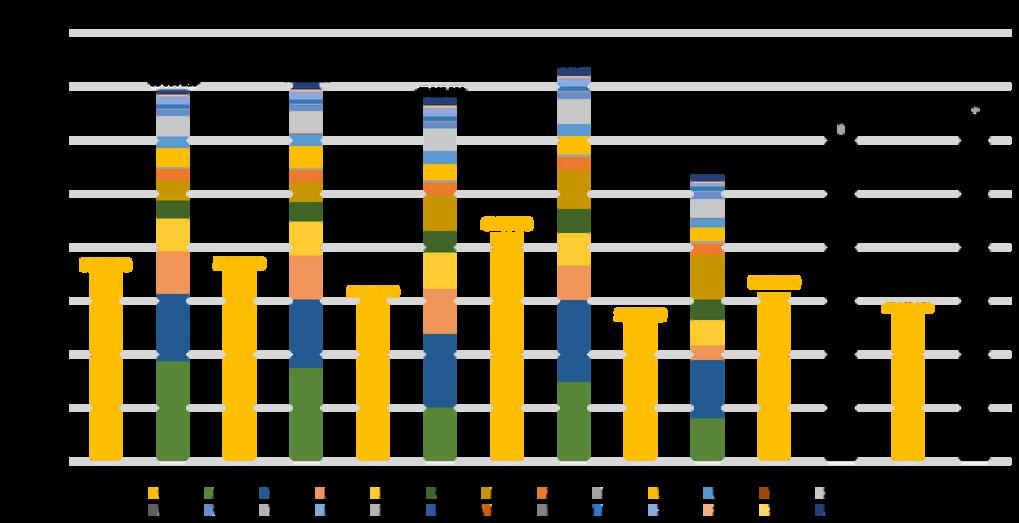
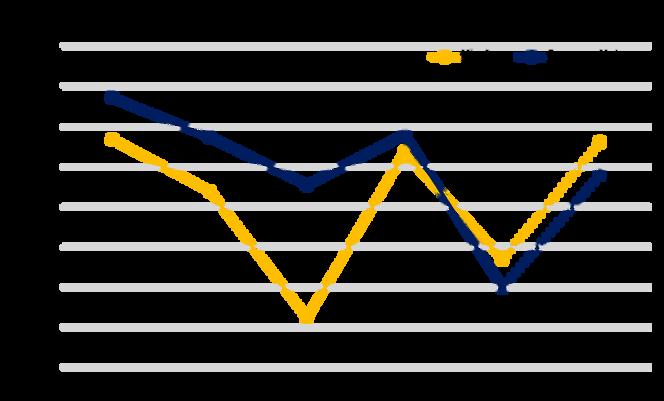
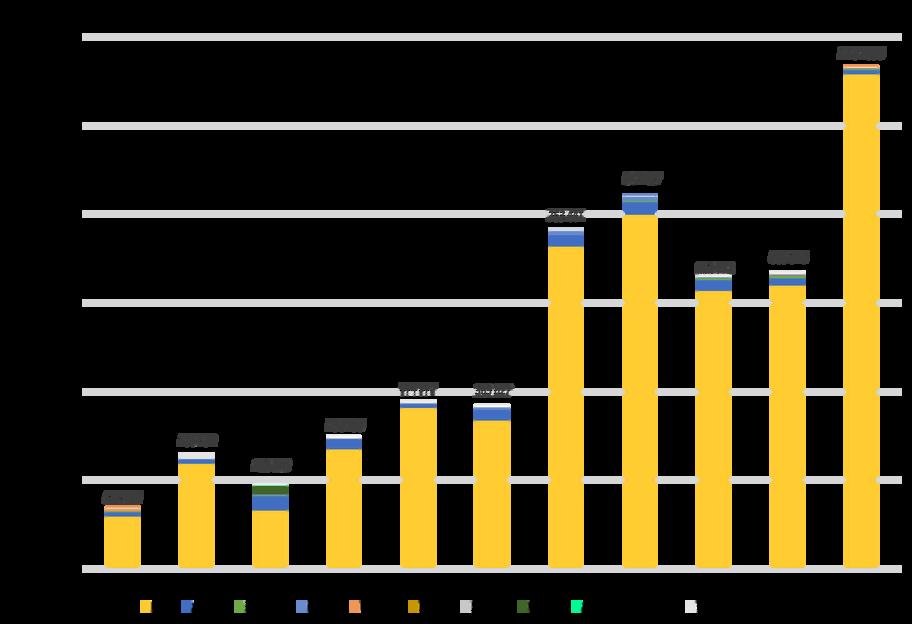
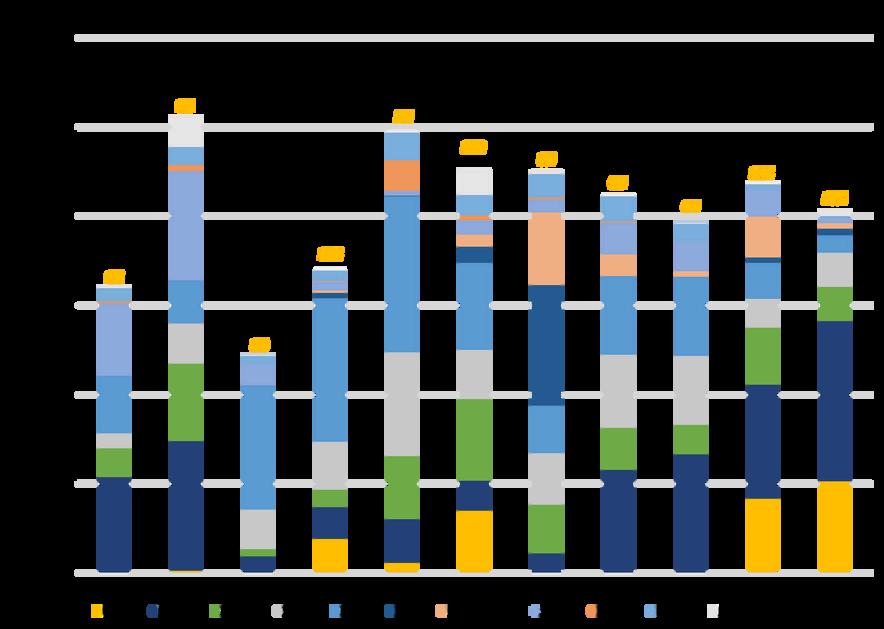
The country mainly produces cereals (corn, wheat, barley), potatoes, sunflower seeds and sugar beet.
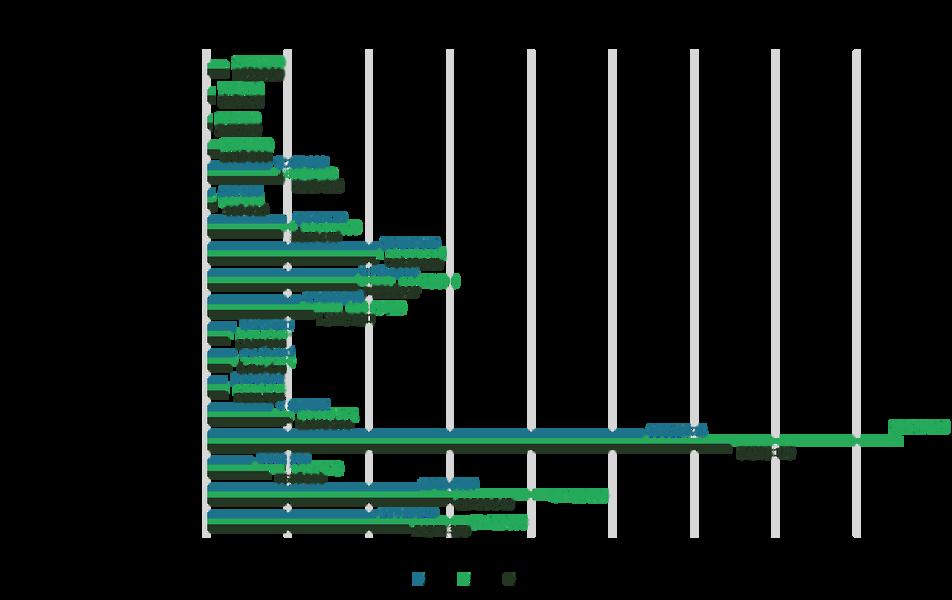
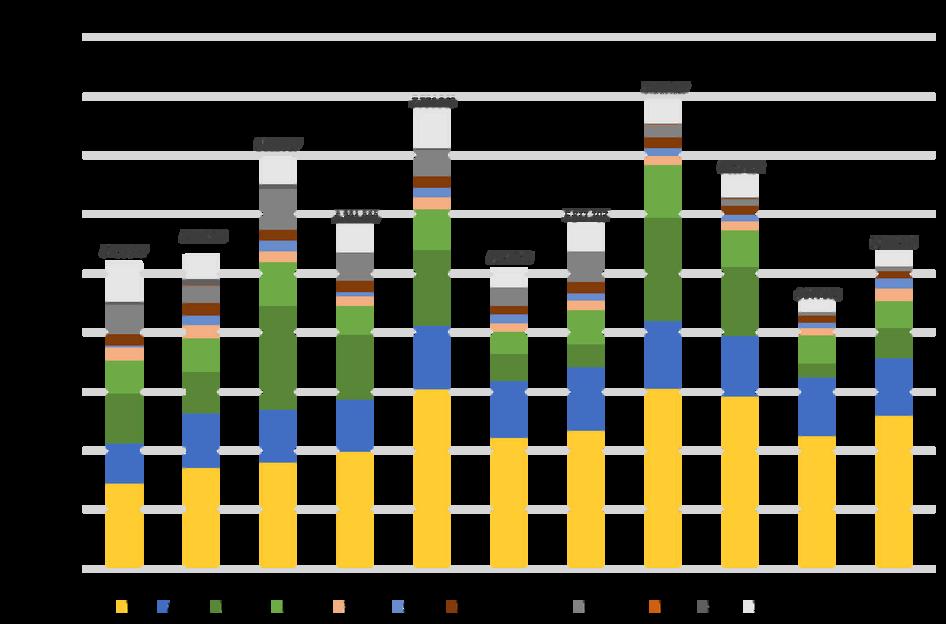
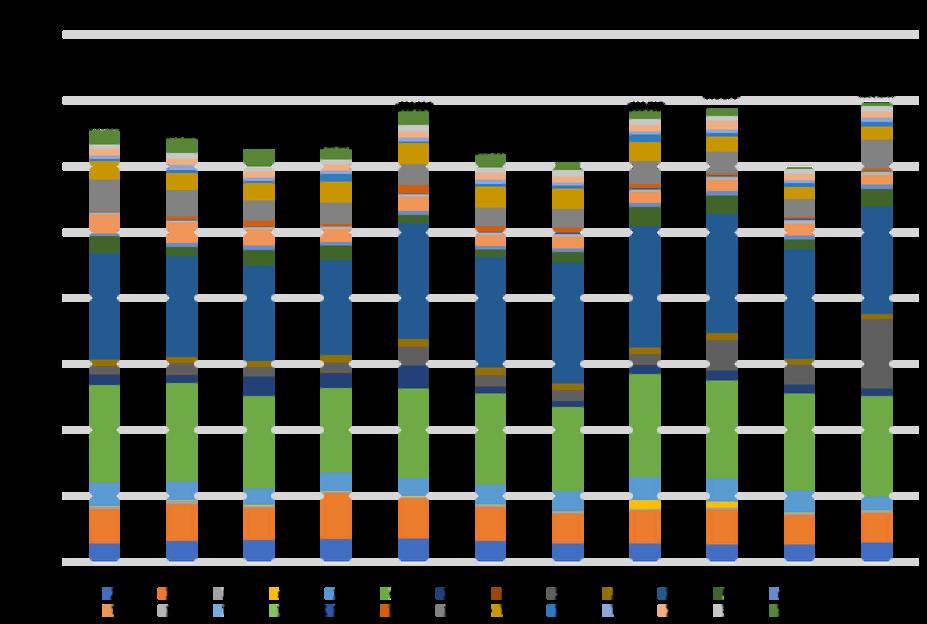
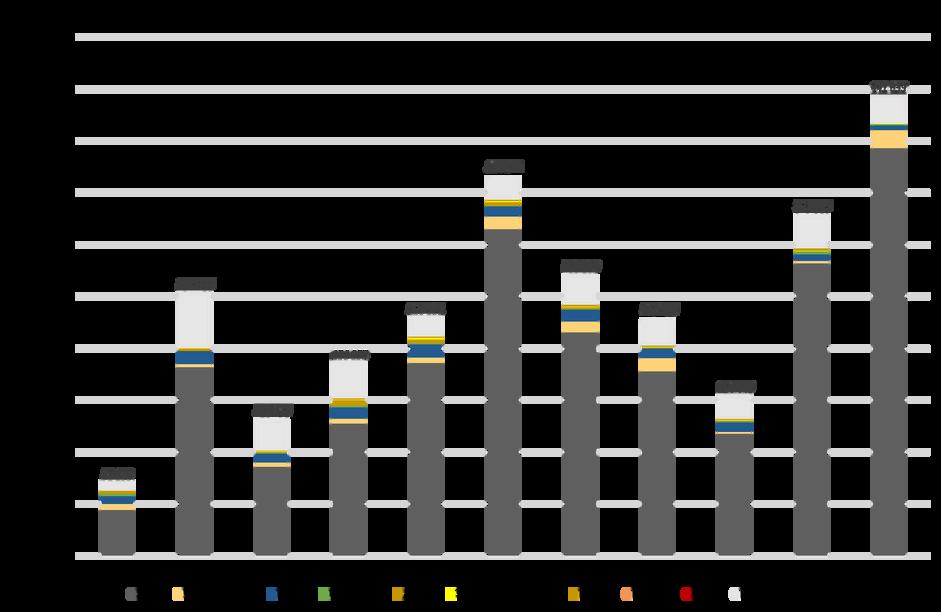
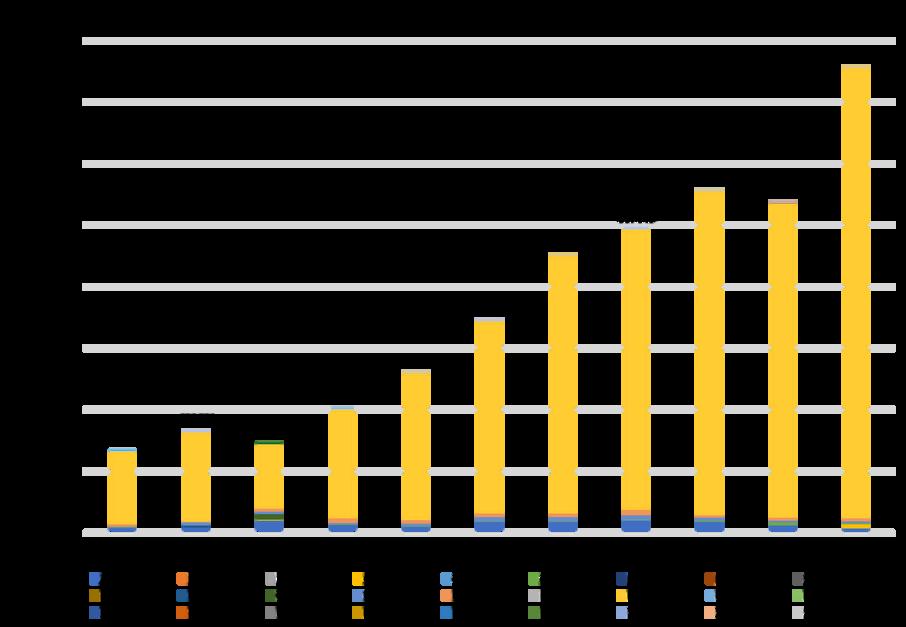
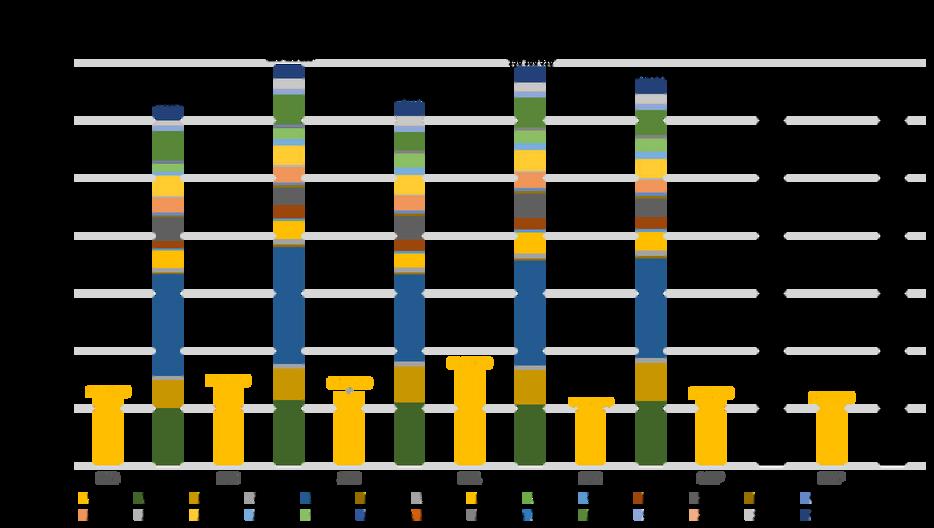
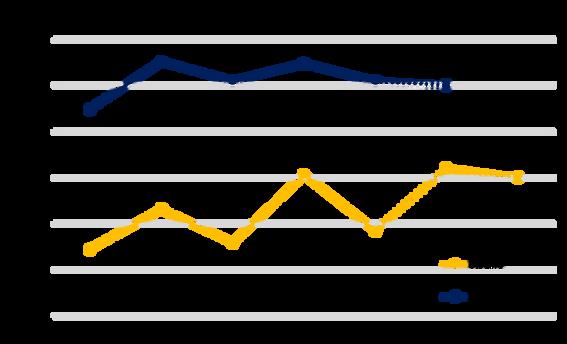
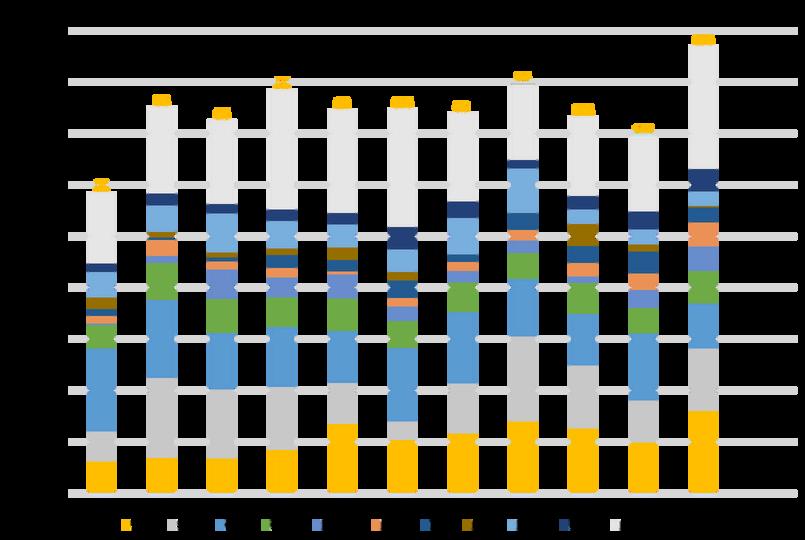
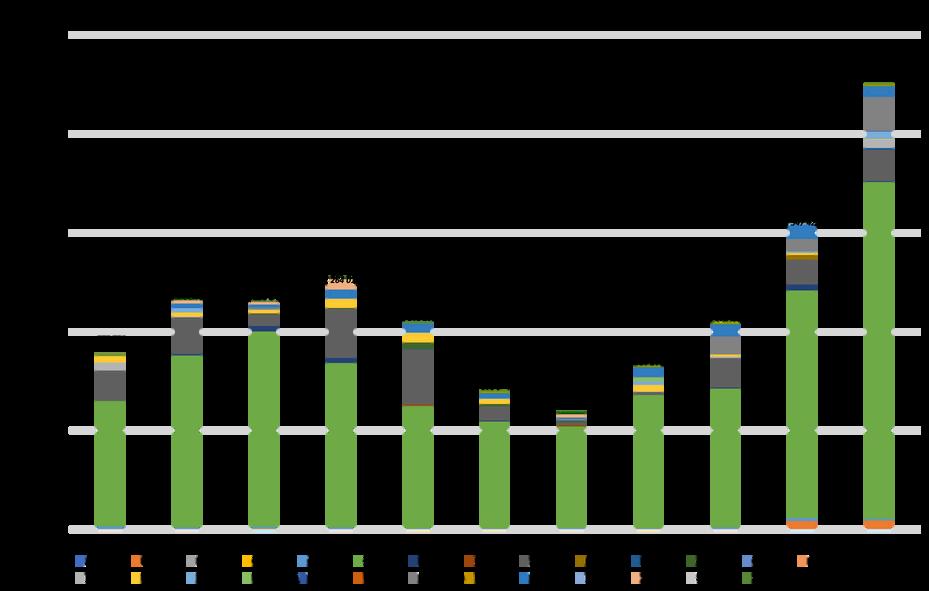
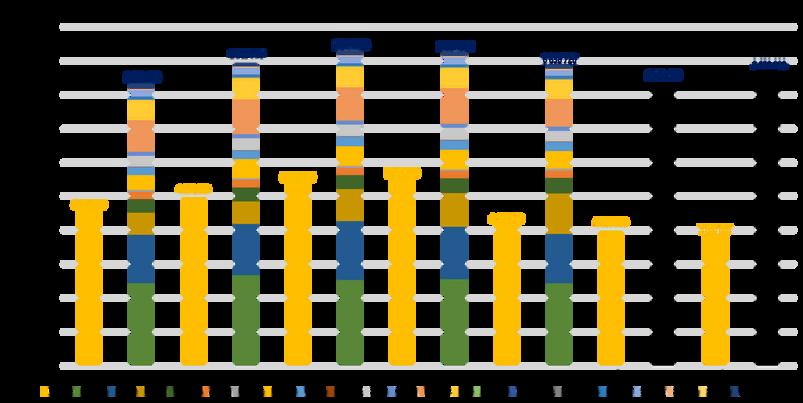
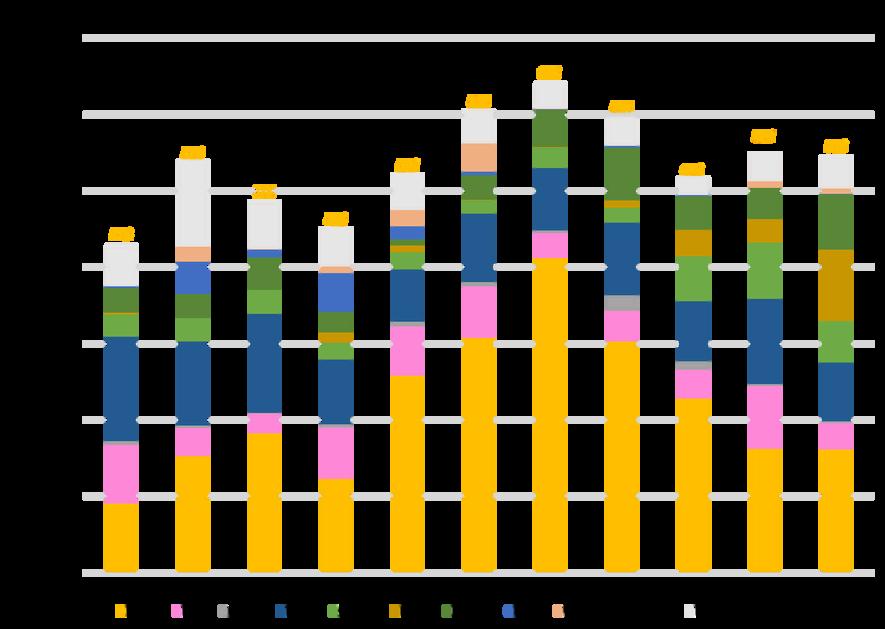
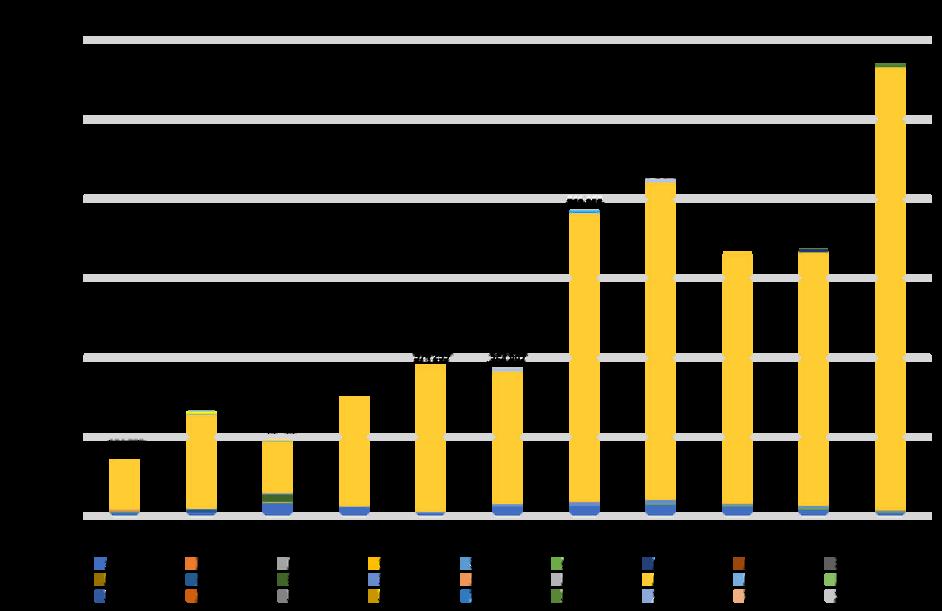
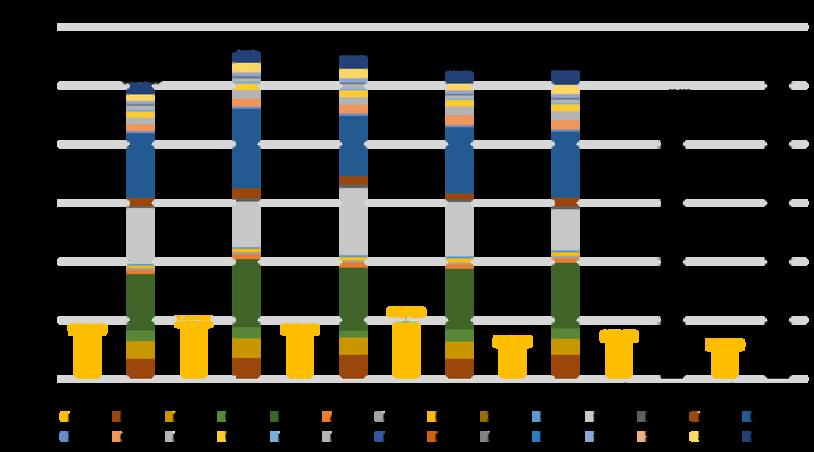
Figure 3 - Evolution of production of the main types of agricultural products (in tons) in Ukraine Source: FAOStat
Note: 2022 data not available for meat.
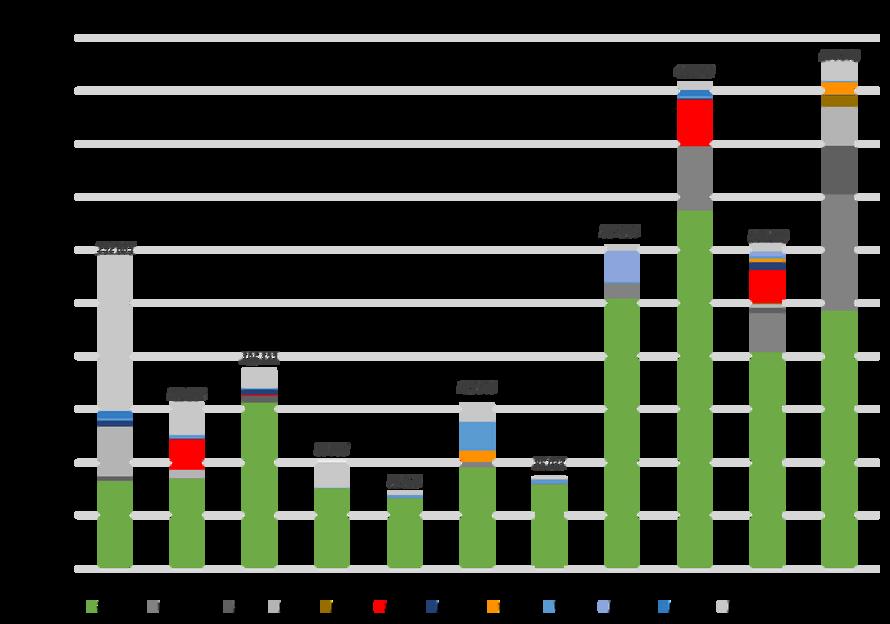
Marked by its communist past, the Ukrainian agricultural sector is characterised by 110 huge vertically integrated agricultural companies, known as agro-holdings*, which control all or part of the production chain (cultivation-breeding, processing, trade). Their aim is to achieve a return on capital invested, and to achieve this they invest in state-of-the-art, large-scale equipment and in the use of inputs. 20 of these companies account for 14% of Ukraine's Utilised Agricultural Area (UAA).
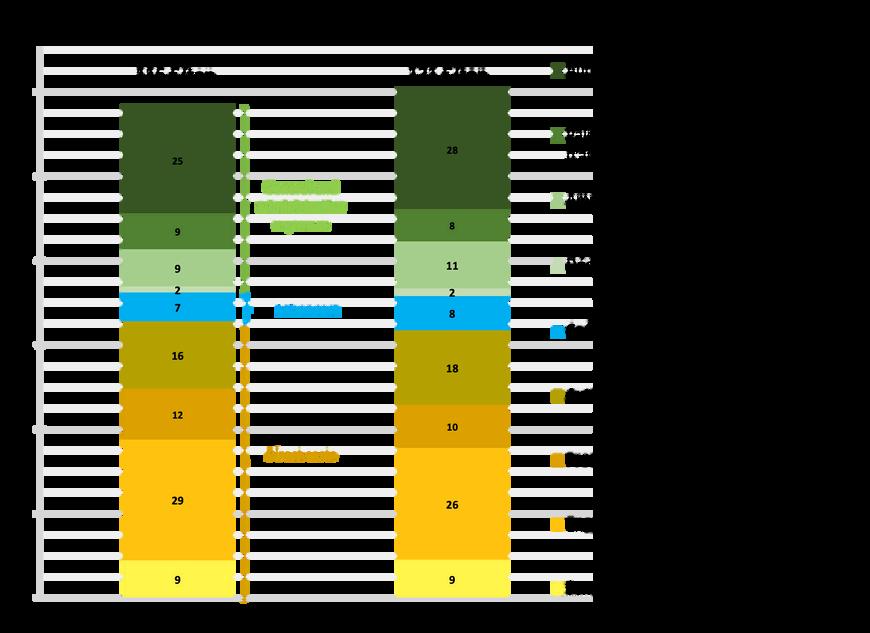
57% of the UAA is farmed by companies of more than 1,000 ha.
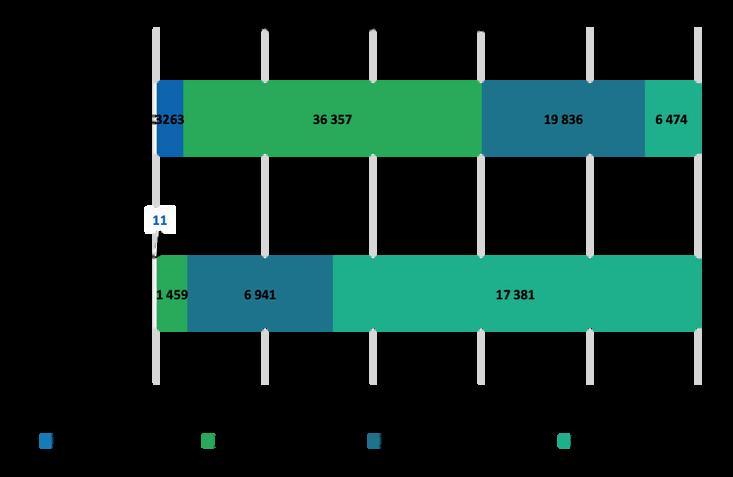
Figure 4 - Figure 4 - Farm structure Farm structure in Ukraine in 2021. in Ukraine in 2021
Source : Source : based on data from based on data from the State Statistics Service of the State Statistics Service of Ukraine (SSSU) Ukraine (SSSU).
Agriculture plays a major economic role in Ukraine, accounting for 10.9% of GDP in 2021 and nearly 14.7% of employment (World Bank). In comparison, the european sector accounts for 1.4% of European GDP and 4.2% of employment (Eurostat). In 2021, agricultural products accounted for 41% of Ukrainian exports, worth 27 billion dollars
The sector, which has been severely affected by the current conflict, is estimated to have suffered the equivalent of $80 billion in damage and losses (World Bank), and its reconstruction is estimated to cost at least $56 billion (World Bank, 2023), not including mine clearance ($32 billion).
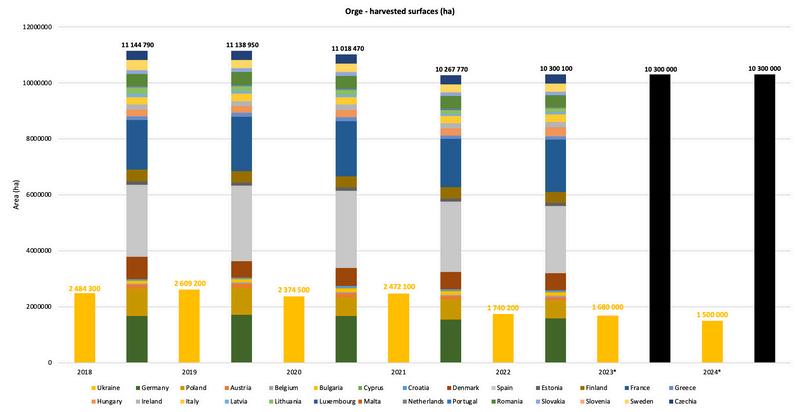
For the 2023-24 season, Ukraine harvested 11.1 million hectares of cereals (USDA), or 18% of the area harvested in the European Union. This is 29% down on the pre-war period (2021).

5 - Figure 5 - Area of cereals Area of cereals harvested by Ukraine (left) harvested by Ukraine (left) and the European Union and the European Union ((right) right) Source Source: based on : based on FAOStat data. FAOStat data
Ukraine produces three main cereals: corn (49% of production in 2022), wheat (39%) and barley (10%). If Ukraine were to join the European Union, the country would account for 20% of European cereals production, with 49% of maize production and 15% of wheat production.
6 - Figure 6 - Grain production in Ukraine and the European Union Grain production in Ukraine and the European Union Source : Source : based on FAOStat data based on FAOStat data * *Note : Note : Data for 2023 and 2024 refer to USDA data for July 2023/June 2024 and July 2024/June 2025. These data are underestimated, as they do
Data for 2023 and 2024 refer to USDA data for July 2023/June 2024 and July 2024/June 2025. These data are underestimated, as they do not take into account the volumes of the following cereals: oats, mixed cereals, cereals n.e.c, buckwheat, rye and triticale. not take into account the volumes of the following cereals: oats, mixed cereals, cereals n.e.c, buckwheat, rye and triticale.
Overall, Ukrainian yields are close to European yields. In 2021, corn and wheat yields were 77 and 45 quintals per hectare (qt/ha) respectively, compared with 79 and 57 qt/ha for the European Union. In the case of triticale, Ukrainian yields even increased 10-fold between 2018 and 2022.
Figure 7 - Figure 7 - Average cereal yields over 4 years for Average cereal yields over 4 years for Ukraine and the European Union Ukraine and the European Union Source : Source : based on based on FAOStat data FAOStat data.
*Note: *Note: Average over 2 years (2021-2022) corresponding to current Average over 2 years (2021-2022) corresponding to current yield trends. yield trends.
Ukrainian legislation on the use of GMOs is unclear and has reportedly hindered the development of their use in the country. However, according to the USDA's UP2022-00 report "Biotechnology and Other New Production Technologies Annual" (2020), unofficial GMO cultivation in Ukraine currently involves around 50 to 65% of soya, 10 to 12% of rapeseed and less than 1% of corn. GM seeds are therefore used, but not registered as such.
In addition, on 23 August 2023 the country adopted a law on the regulation by the State of genetic engineering activities and the control by the State of the circulation of genetically modified organisms and genetically modified products (Law no. 3339-IX). This will come into force on 16 September 2026, and is designed to prohibit in particular "the research and testing of genetically modified corn in an open system, its registration by the State, its placing on the market and its import into the customs territory of Ukraine, with the exception of import for the purposes of scientific research in a closed system in the presence of an appropriate permit".
The use of NGTs is not mentioned in Ukrainian legislation, and does not yet appear to be on the legislative agenda. The only articles mentioning NGT provide an overview of European discussions, without ever drawing any parallels with Ukraine.
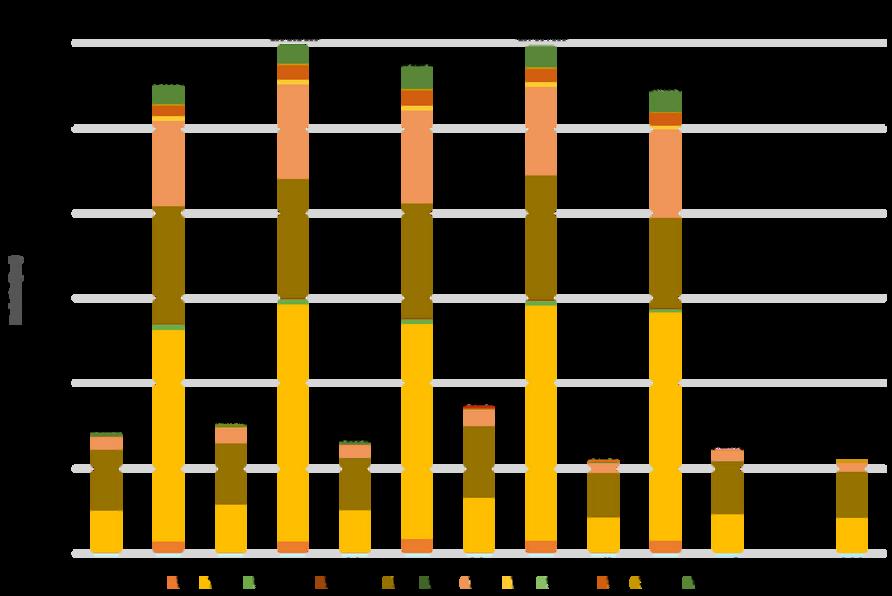
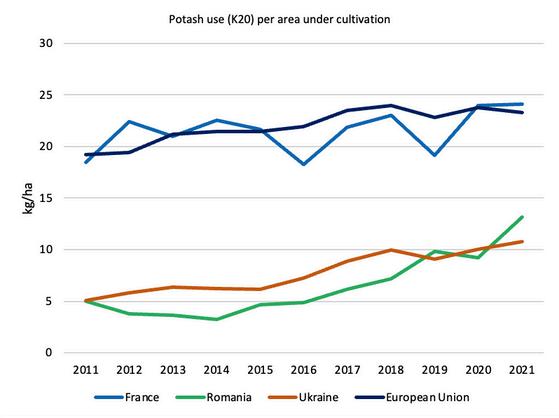
The high fertility of Ukrainian soils means that crops require less nutrient input than the European average. Nutrient inputs (nitrogen, potash and phosphate fertilizers) are on average 1.5 times lower in Ukraine than in the European Union.
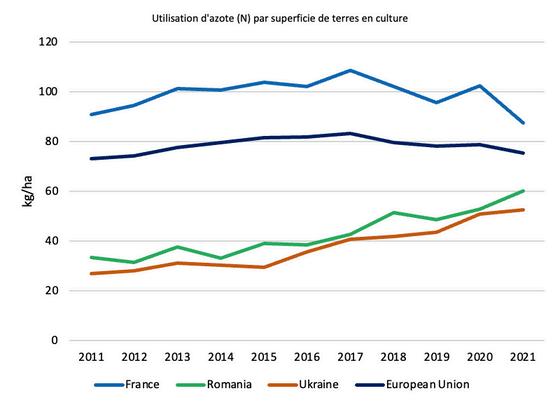
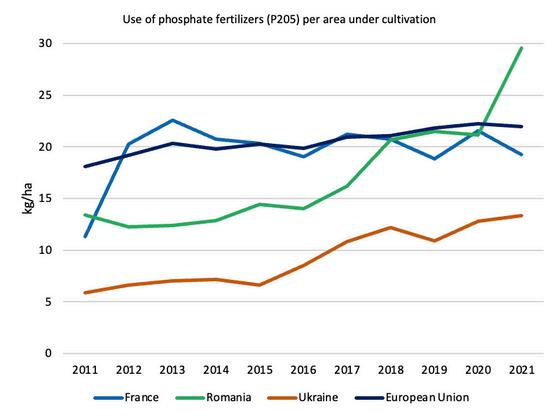
Figure 8 - Figure 8 - Use of NPK nutrients per area Use of NPK nutrients per area of cultivated land. of cultivated land Source : Source : based on based on FAOStat data FAOStat data
On average, Ukrainian arable production performs better than European production.
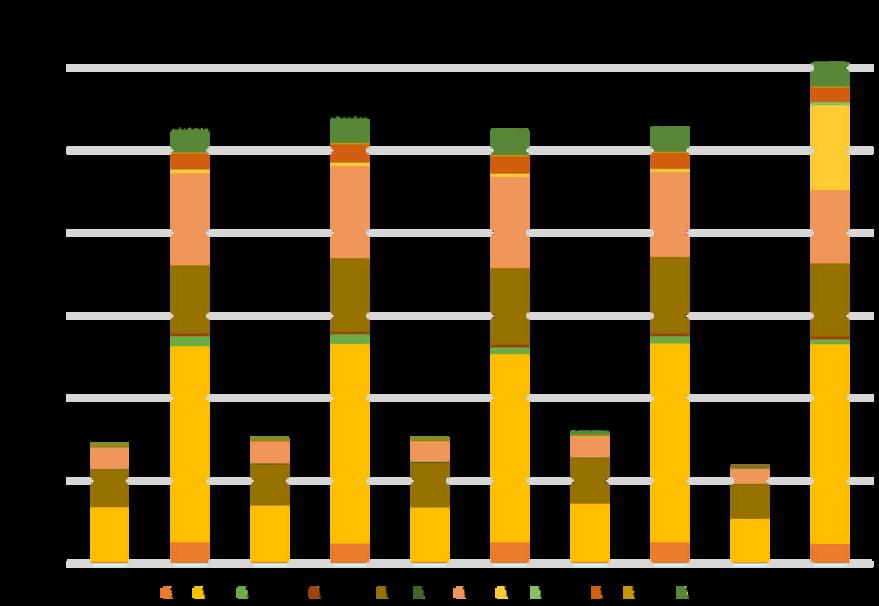
In addition, nutrient consumption in Ukraine is higher in agro-holdings than in other agricultural enterprises. The latter are less inclined to use this costly parameter to increase their yields.
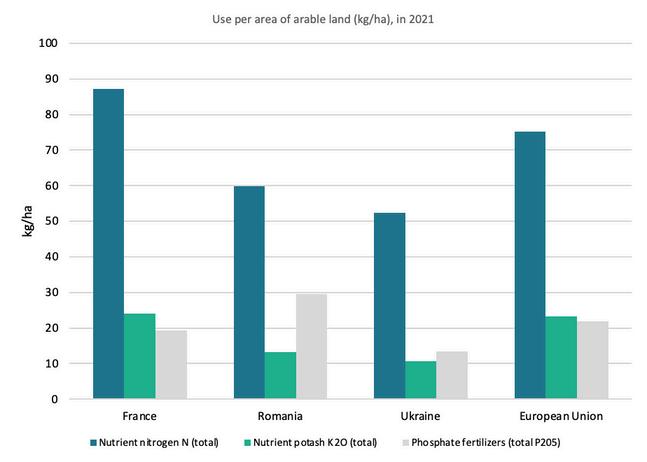
Figure 9 - Figure 9 - Nutrient use per area Nutrient use per area of cultivated land in 2021 of cultivated land in 2021
Source : Source : based on FAOStat data. based on FAOStat data
1.5 times less fertiliser used in Ukraine than in the European Union.
Ukrainian legislation on pesticides is more flexible than European legislation. Several active substances banned in the European Union are authorised in Ukraine. These include Smetholachlor, a powerful herbicide used on corn and sugar beet crops (banned in the EU since April 2024), and benomyl, a fungicide used on cereal crops in particular. It should be noted, however, that some European countries have exemptions for the use of active substances banned in the European Union, such as France and Germany in the case of S-metholachlor.
Details are available in Appendix 2.
As part of Ukraine's accession to the European Union, the country will have to comply with European legislation. With this in mind, Ukraine has already undertaken a number of legislative reforms, including a draft law on plant protection products and fertilisers (no. 11062; 4 March 2024), which should bring Ukrainian legislation into line with EU regulations on market access for plant protection products, their active ingredients and fertilisers.

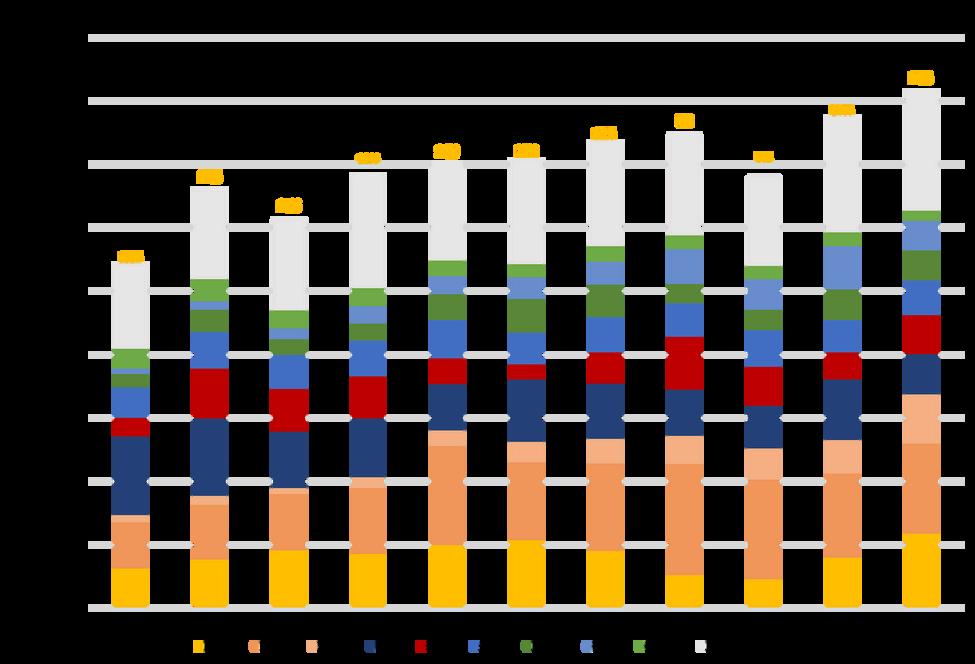
Ukraine exported 49 million tonnes of cereals and pulses in 2023/24 (Ministry of Agrarian Policy and Food of Ukraine), mainly corn (26 million tonnes) and wheat (16 million tonnes).
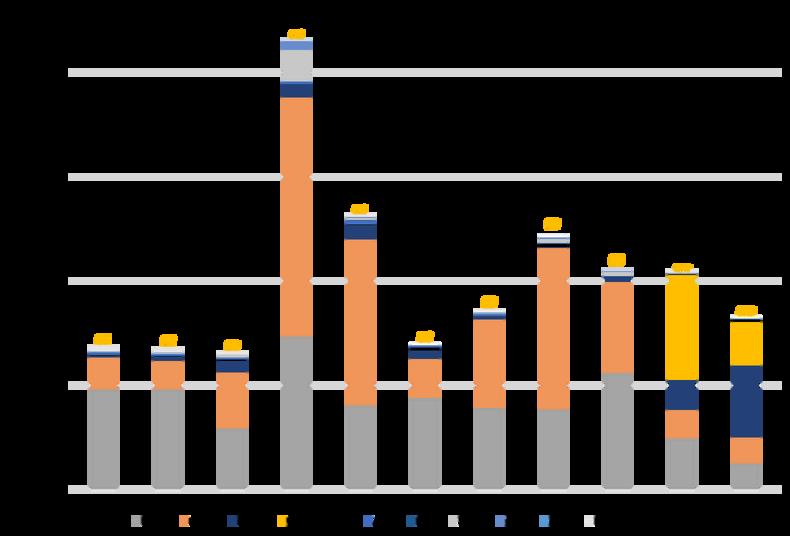
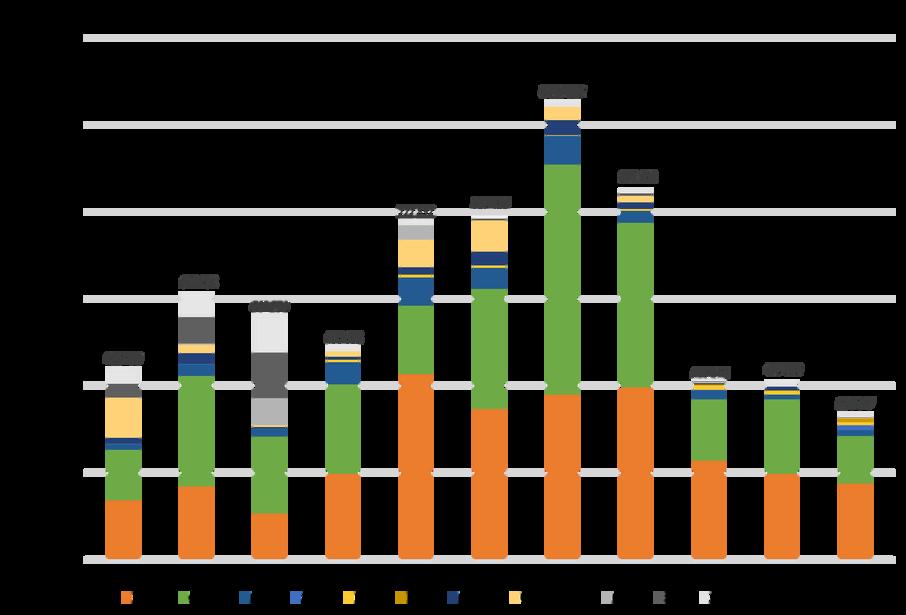
Figure 10 - Trends in Ukrainian cereal exports
Between 2019/21 and 2023, cereals imports from Ukraine have increased twofold.
Source : based on WITS (World Integrated Trade Solution) and World Bank data Figure 11 - Figure 11
In 2023, Ukraine will account for 54% of cereal imports into the European Union (19.7 thousand tonnes). The increase in Ukrainian cereal imports also corresponds to net imports (+11 thousand tonnes between 2021 and 2023), since traditional imports from Brazil, Canada, the United Kingdom and Russia have not decreased.
Spain, Italy and the Netherlands are the main gateways for Ukrainian cereal exports, accounting for 63% of European imports from Ukraine.
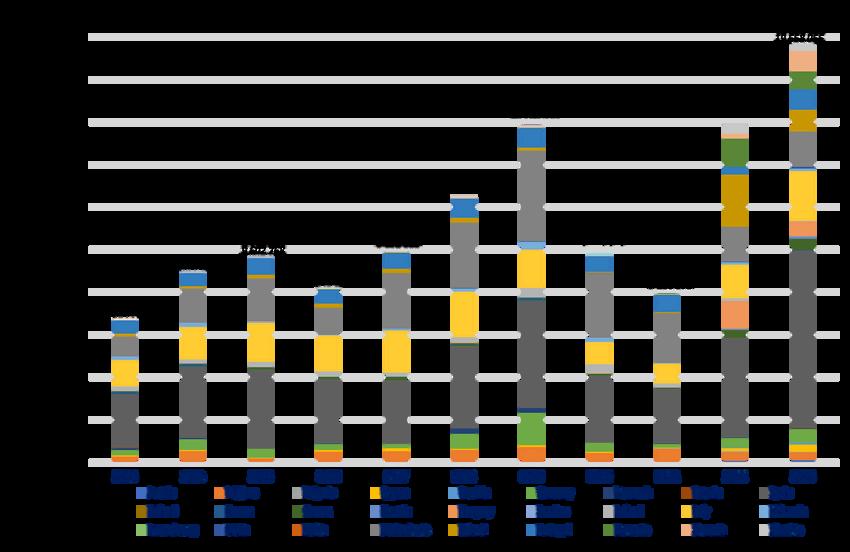

Figure 12 - Figure 12 - Trend in volumes of Ukrainian cereals imported by the EU-27, in tonnes Trend in volumes of Ukrainian cereals imported by the EU-27, in tonnes. Source : Source : based on based on Eurostat data Eurostat data
Between 2019/21 and 2023, Spain doubled its imports of Ukrainian cereals (+4.7 thousand tonnes), and accounted for 42% of European imports of Ukrainian cereals in 2023. These volumes correspond to net imports, and can be explained by two factors: the national drought which hit the country hard in 2023, and a desire for the country to benefit from tariff cuts on cereals from Ukraine.
As Italy and the Netherlands are traditional grain importers for Ukraine, import volumes have remained stable overall.
The proportion of large agricultural businesses involved in production varies according to the type of production. Unlike the sugar industry, households* account for a significant proportion of cereal production (21%).
structures of less than 1,000 ha (personal peasant household + agricultural enterprises)
enterprises of more than 3,000 ha
Figure 13 - Figure 13 - Share of the Share of the production of the various production of the various agricultural structures in agricultural structures in the total production of the total production of cereals, sugar beet and cereals, sugar beet and sunflower seeds sunflower seeds Source Source :: based on data from the based on data from the State Statistics Service of State Statistics Service of Ukraine (SSSU). Ukraine (SSSU)
While all farms* produce 79% of Ukraine's cereals and pulses, farms of less than 1,000 hectares account for 51% of the country's cereal production. This represents a total of 22,227 agricultural enterprises (not including personal farming households), or 91% of Ukrainian agricultural enterprises.
Cereal production is therefore not entirely controlled by the large Ukrainian farming structures (of which the 110 agro-holdings are a part), although the 369 cereal enterprises with more than 3,000 ha still account for 22% of total production.
It should be noted, however, that these large structures do not own the land they farm, as Ukrainian nationality is required to be a landowner in Ukraine. In addition, the maximum surface area authorised per individual and legal entity is 10,000 ha since the new agrarian reform of 1 January 2024 (law 552-X on the amendment of certain legislative acts of Ukraine concerning the conditions for the circulation of agricultural land). As a result, agro-holdings lease agricultural land to hundreds of landowners, some of whom own only a few hectares of land.
*Ukrainian farms fall into two main categories: agricultural enterprises and personal farming households Personal farming
*Ukrainian farms fall into two main categories: agricultural enterprises and personal farming Personal farming households are responsible for the majority of fruit, vegetable and potato production, which is mainly destined for self- households are responsible for the majority of fruit, vegetable and potato production, which is mainly destined for selfconsumption and short distribution channels consumption and short distribution channels
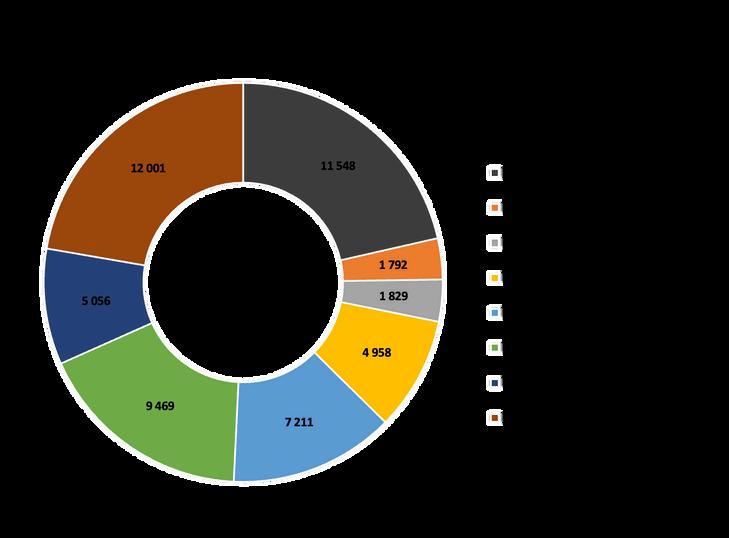
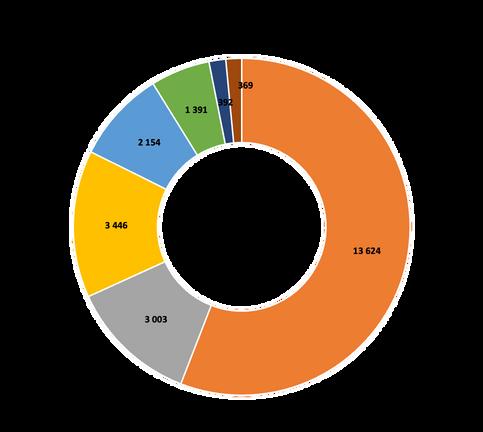
Figure 14 - Figure 14 - Farm businesses and households, 2022: (a) production of cereals and pulses in thousands of Farm businesses and households, 2022: (a) production of cereals and pulses in thousands of tonnes ; (b) number of structures producing cereals and pulses tonnes ; (b) number of structures producing cereals and pulses Source : Source : based on data from the State based on data from the State Statistics Service of Ukraine (SSSU). Statistics Service of Ukraine (SSSU)


10 exporters, including 3 agro-holdings, shown in table 2, are responsible for 73% of the country's cereal exports.
Kernel is number 1, accounting for 15% of cereal exports in 2022. The agro-holding, which specialises in growing corn, wheat, sunflower and soya, owns an export terminal with an annual transhipment capacity of 10 million tonnes of grain, the first private network of domestic grain silos in Ukraine (storage capacity of 2.3 million tonnes), and a private fleet of grain wagons.
Kernel also supplies grain to 5,000 agricultural producers.
Table 2 - Table 2 - Top 10 wheat exporters in Ukraine Top 10 wheat exporters in Ukraine Source : Source : Latifundist and official websites of the different Latifundist and official websites of the different companies companies
(crops + purchases from
agricultural producers)
Agri Ukraine exporter (subsidiary of the Chinese group COFCO)
Ukraine
and exporter (subsidiary of Bunge Limited)
Viterra Ukraine exporter (subsidiary of Vitrera, present in 37 countries worldwide)
ADM (Archer Daniels Midland) Trading Ukraine processor and exporter (subsidiary of the US group ADM)

For the 2023-24 season, the Ukrainian wheat crop is estimated at 5 million hectares (USDA), or 21% of the area harvested in the European Union. However, this is 25% less than the five-year average (USDA). In 2021, the harvested wheat area will correspond to 29% of the European area, i.e. the wheat area of France and Romania.
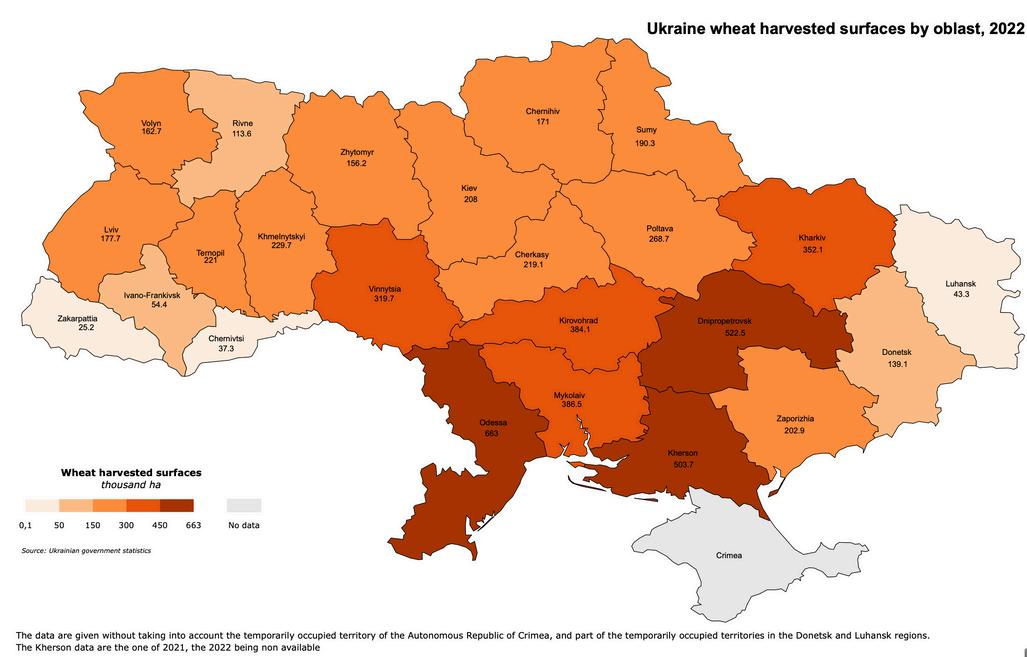
Figure 15 - Figure 15 - Area of wheat harvested per Ukrainian oblast in 2022 Area of wheat harvested per Ukrainian oblast in 2022. Source: Source: based on data from the State based on data from the State Statistics Service of Ukraine (SSSU) Statistics Service of Ukraine (SSSU)
Note Note: : Data for the Kherson region is for 2021, as 2022 data is not available due to the war. Data for the Kherson region is for 2021, as 2022 data is not available due to the war.
Wheat tends to be grown in the south of the country. Due to the presence of the front line in the south, production was initially higher in the Kharkiv and Zaporizhia regions, but this has now shifted northwards.
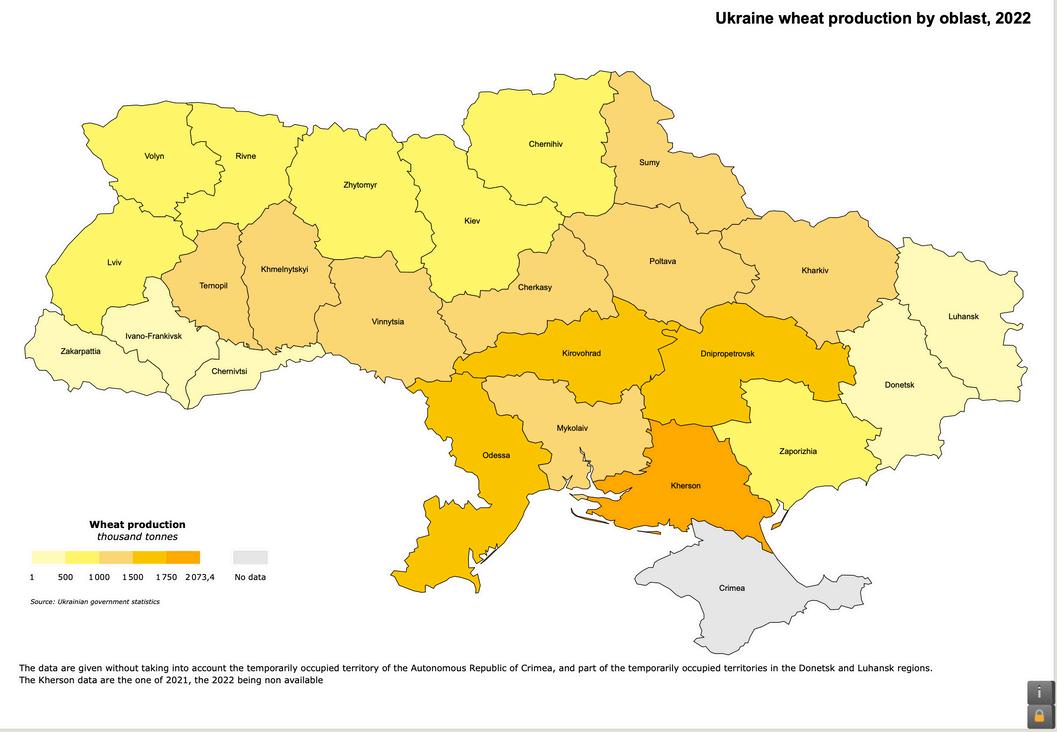
Figure 16 - Figure - Ukrainian wheat production basins, 2022 Ukrainian wheat production basins, 2022. Source: Source: based on data from the State Statistics based on data from the State Statistics Service of Ukraine (SSSU) Service of Ukraine (SSSU)
Data for the Kherson region is for 2021, as 2022 data is not available due to the war.
Note: Note: Data for the Kherson region is for 2021, as 2022 data is not available due to the war.
In 2021, Ukraine will account for 23% of European production volume, with a production of 32 million tonnes. If Ukraine were to join the European Union, it would become EU's 2nd largest wheat producer, behind France and ahead of Germany.
Winter wheat accounts for 96% of wheat production (SSSU, 2022). Most wheat is sown in the autumn, between early September and mid-November, with harvesting generally taking place between late July and mid-August. Only 1% of total wheat production is irrigated (SSSU), years 2019-2021).
The average Ukrainian wheat yield was 39 qt/ha in 2022, but varies greatly from region to region. Before the war, the average yield over five years (2018-2021) was 40.5 qt/ha, compared with 55 qt/ha in the European Union (FAOStat).
The four top wheat-producing regions have yields of around 28 quintals per hectare. The regions with the best yields are located in the west of the country, where production is lower.
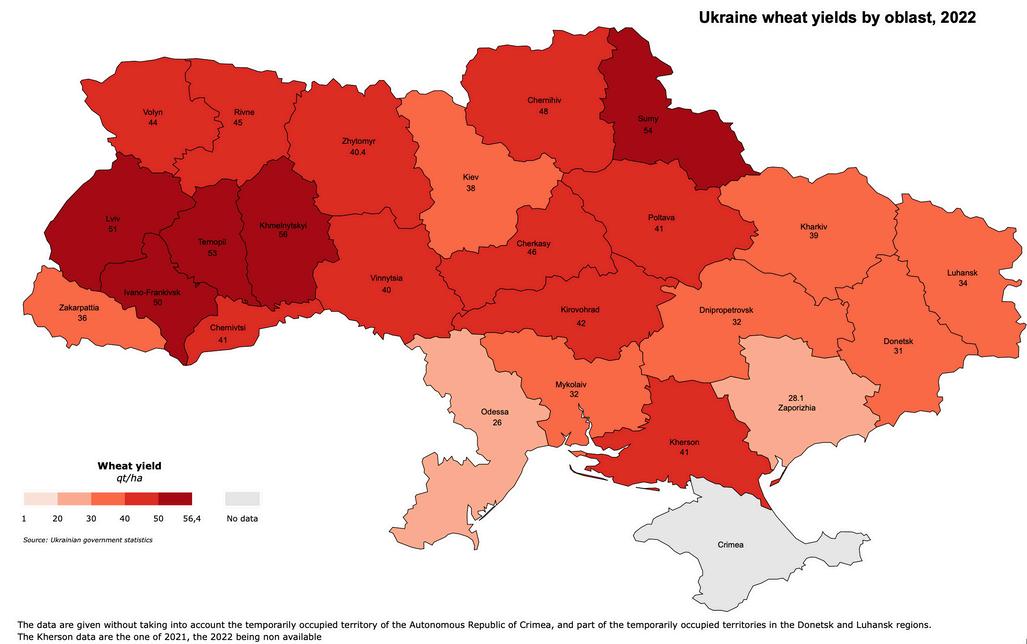
Figure 17 - Figure 17 - Ukrainian wheat yields by oblast, 2022 Ukrainian wheat yields by oblast, 2022. Source: Source: based on data from the State Statistics Service of based on data from the State Statistics Service of Ukraine (SSSU) Ukraine (SSSU)
Note Note: Data for the Kherson region is for 2021, as 2022 data is not available due to the war. : Data for the Kherson region is for 2021, as 2022 data is not available due to the war.
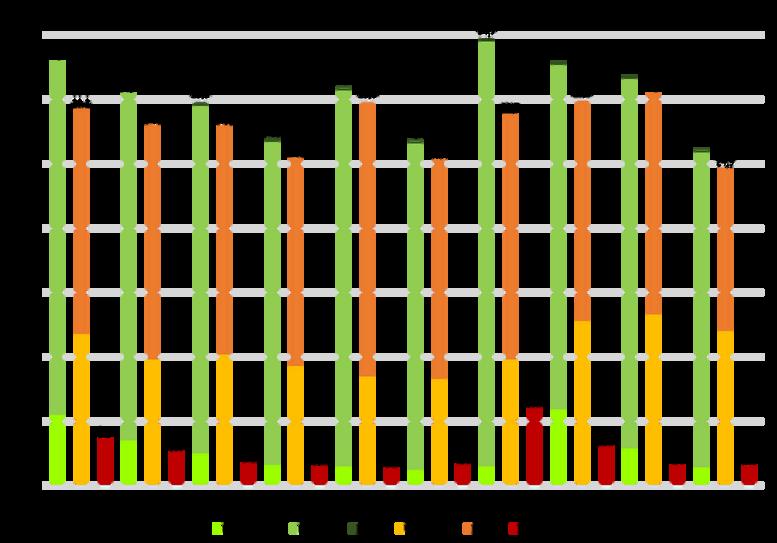
Figure 18 - Figure 18 - Wheat supply and demand, Ukraine Wheat supply and demand, Ukraine. Source: Source: International Grains Council (IGC) International Grains Council (IGC)
Note: Note: data to 14 April 2024, covering the July-June period of each year. data to 14 April 2024, covering the of each year.
Ukrainian consumption represents 32% of the volume of wheat available (average 2015-2021).
Ukraine imports little or no wheat. On the other hand, Ukraine exported 54% of the volume of wheat available in 2021/22, i.e. 18.9 million tonnes. Despite a projected 24% fall in exports between 2019/20 and 2023/24, the International Grains Council (IGC) estimates that exports will still account for 54% of the volume available.
Before the war, Ukraine exported mainly to Egypt, Indonesia and Bangladesh. However, a 19% drop in wheat exports has been observed between 2019 and 2023.
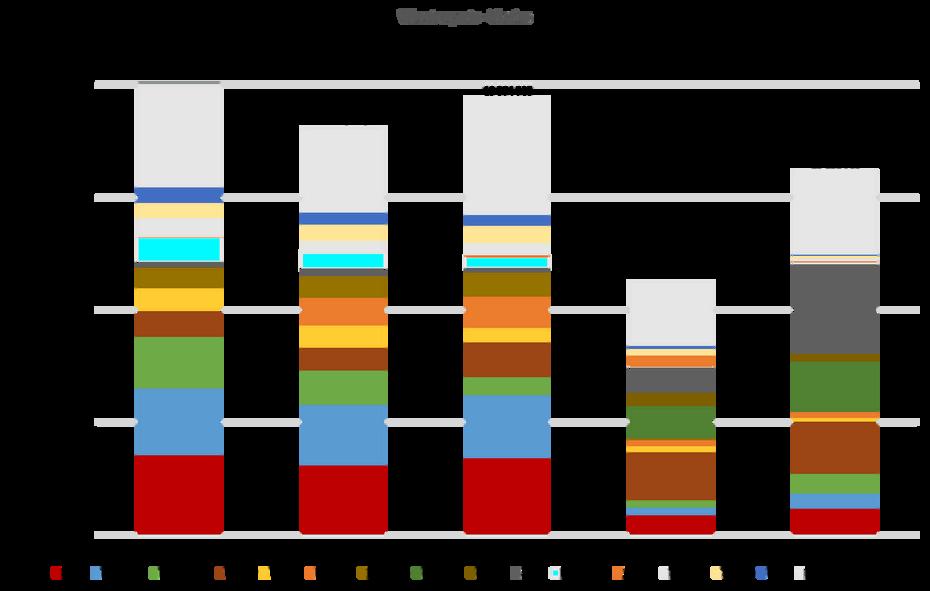
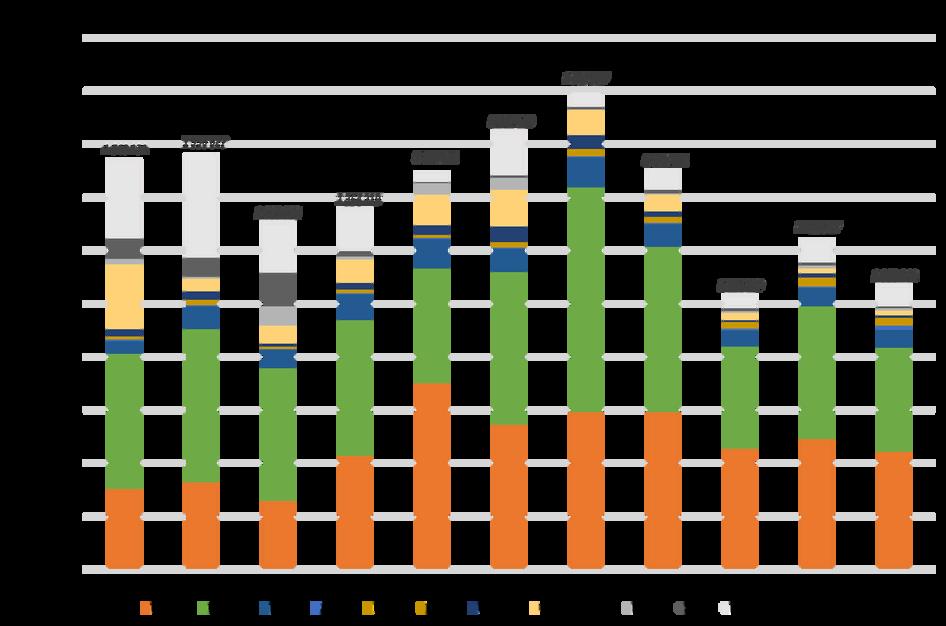
Figure 19 - Main destinations for Ukrainian wheat Source: based on WITS (World Integrated Trade Solution) and World Bank data

Volumes exported to Egypt, for example, have fallen by 65% between 2019 and 2021; by 76% for Indonesia; and by 42% for Bangladesh. It is mainly Spain (x 13; + 800,000 tonnes), Romania (+ 1,458,000 tonnes) and Turkey (+ 87%; 1,078,000 tonnes) that have benefited from the drop in Ukrainian exports to 'traditional' trading partners.
In 2023, of the 16 million tonnes of wheat exported by Ukraine, almost 8.2 million tonnes were exported to the European Union (WITS, World Bank). The European Union thus accounted for 51% of Ukrainian wheat exports, compared with 3% in 2021.
Between 2019/21 and 2023, wheat imports from Ukraine increased 9-fold. In 2023, Ukraine accounted for 51% of wheat imports into the European Union (6.1 thousand tonnes). The increase in Ukrainian wheat imports also corresponds to net imports (+ 5.1 thousand tonnes between 2022 and 2023), since traditional imports from Canada, the United Kingdom and Russia have not decreased.
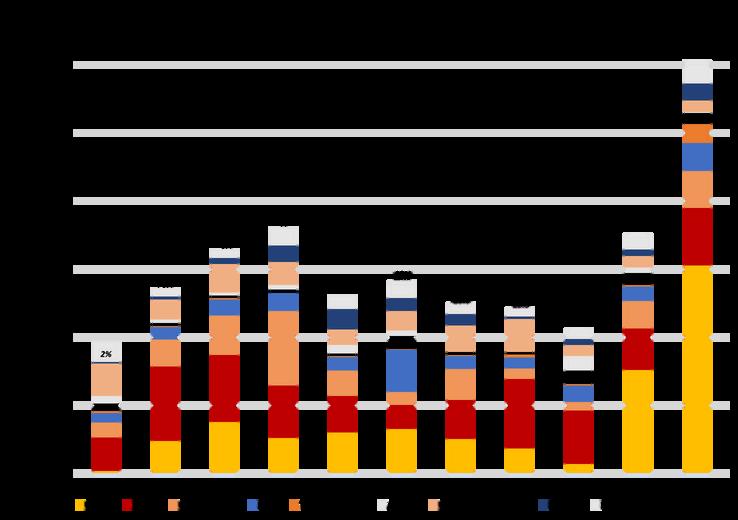

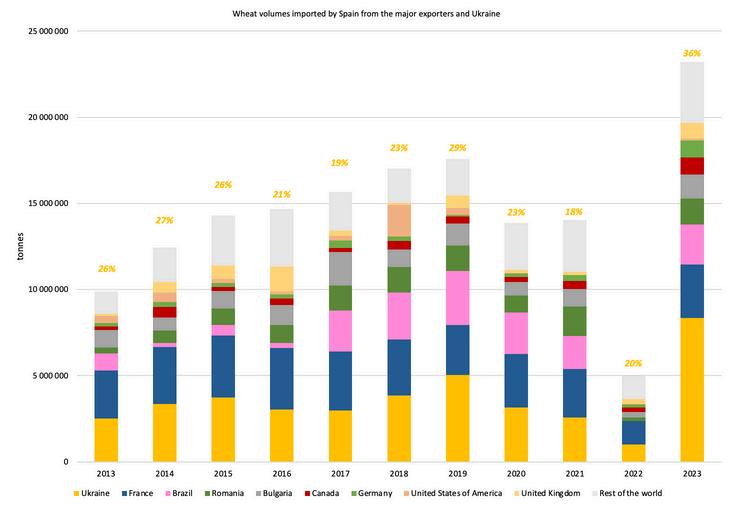
Figure 20 - Figure 20 - Wheat imported by the EU-27 from its main suppliers (outside the EU) and Ukraine, and Ukraine's Wheat imported by the EU-27 from its main suppliers (outside the EU) and Ukraine, and Ukraine's share of European imports share of European imports Source: Source: based on Eurostat data based on Eurostat data
Spain,Italy,PolandandRomania are the main gateways for Ukrainian wheat exports.
Imports and exports from these countries are available in the Appendix.
SPAIN, EUROPE'S LARGEST IMPORTER OF UKRAINIAN WHEAT
Figure 21 - Figure 21Ukrainian wheat Ukrainian wheat imported by the imported by the EU-27. EU-27
Source: Source: based on based on Eurostat data Eurostat data
Between 2022 and 2023, Spain increased its imports of Ukrainian wheat by a factor of 4 (+ 3 million tonnes), and accounted for 67% of European imports of Ukrainian wheat in 2023. These import volumes correspond to net imports, which Spain seems to have absorbed, since this has not resulted in an increase in exports (inter- or extra-EU).
Inward processing procedure allow European companies to import goods duty-free, which are then processed in Europe and re-exported. The aim is twofold: financial, by exempting these companies from customs duties and taxes; and economic, by encouraging European processing and strengthening the competitiveness of companies when re-exporting. The rules of origin for sugar imported under the IPR do not apply.
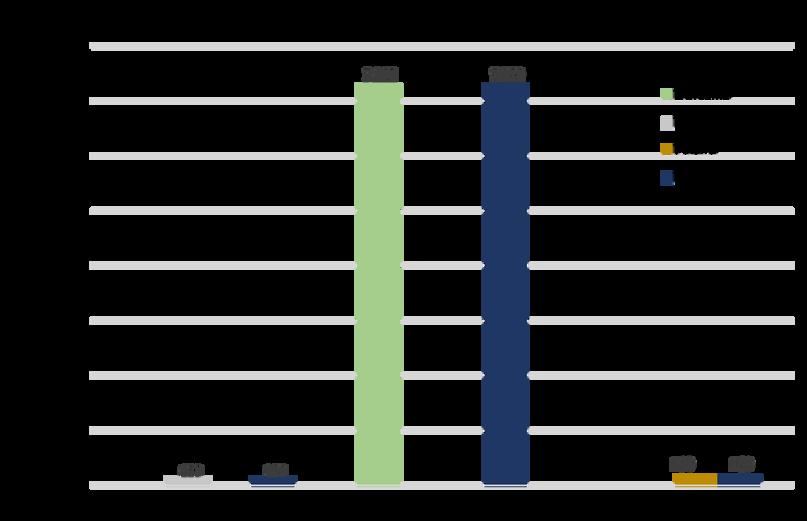
Figure 22 - Wheat imported by the EU-27 from Ukraine under IPR. Source : based on Eurostat data.
In the past, Ukrainian wheat under RPA has been imported by the European Union (2014, 2015 and 2022). However, these volumes remained marginal and exceptional.
Ukraine is a competitive agricultural power. According to government figures, wheat production in Ukraine costs €121 per tonne in 2020, compared with €199 per tonne in the European Union (FADN). Ukrainian wheat is therefore 39% cheaper than European wheat.
Other general and administrative expenses
Payments for third-party services
Depreciation of fixed assets
Deductions for social purposes
Labor cost
Other direct costs
Oil products
Inorganic fertilizers
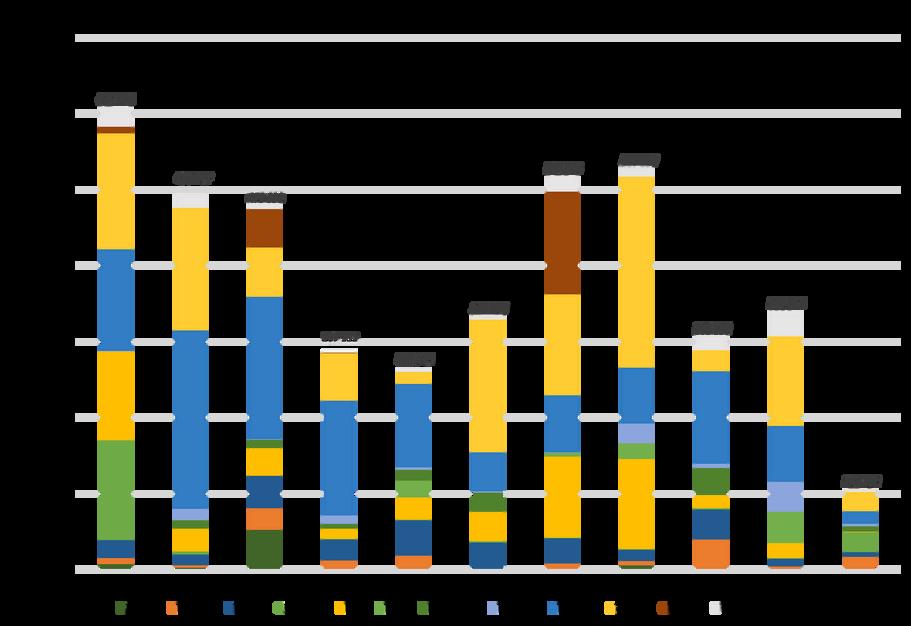
Seeds and planting material
Figure 23 - Figure 23 - Ukrainian production costs for wheat in 2019 and 2020, in €/tonne. Ukrainian production costs for wheat in 2019 and 2020, in €/tonne Source: Source: based on data based on data from the State Statistics Service of Ukraine (SSSU) from the State Statistics Service of Ukraine (SSSU).
Note: only agricultural businesses with an area of agricultural land equal to or greater than 200 hectares and/or an area of covered land equal to or greater than 5 hectares are counted.
Depreciation of fixed assets
Other direct costs
Payments for third-party services
Deductions for social purposes
Fuels and lubricants
Fetilizers
Seeds and planting material
Methodology identical to the Ukrainian methodology
Rent paid
Interest paid
Wages paid
Energy (electricity, heating fuels)
Machinery and building maintenance
Other specific costs
Water
Crop protection
Additional criteria specific to the FADN
Figure 24 - Figure 24 - European production costs for wheat in 2019 and 2020
European production costs for wheat in 2019 and 2020
Source : Source : based on the FADN data based on the FADN data
Note
imputed unpaid family factors (cost of unpaid family labour + cost of own capital) are not taken into account here.
Note: : imputed unpaid family factors (cost of unpaid family labour + cost of own capital) are not taken into account here.
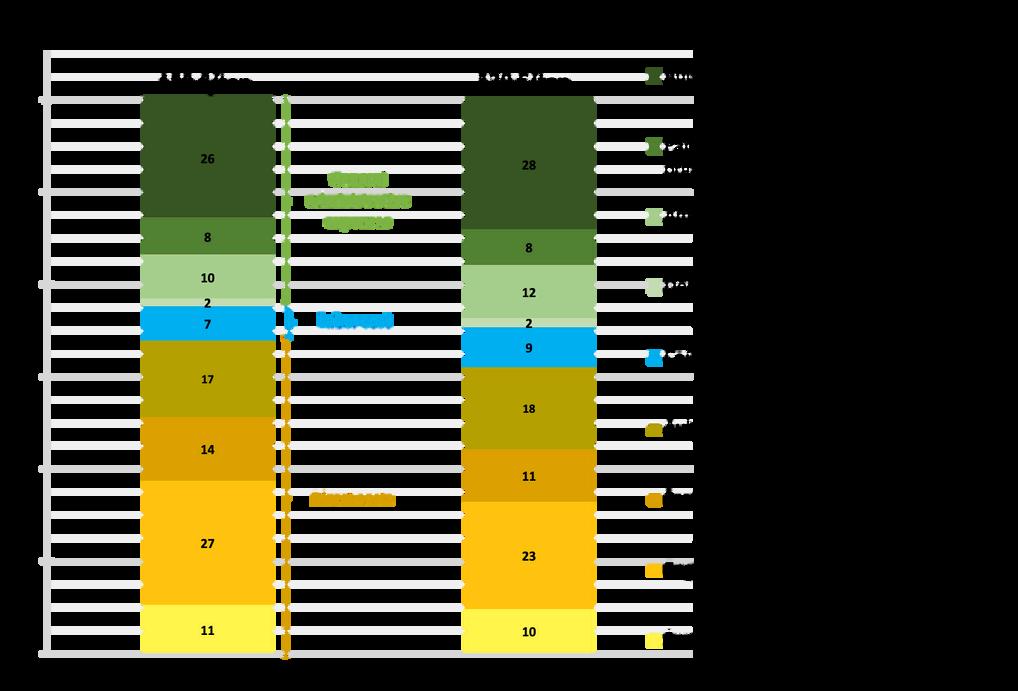
As the methodology used by the FADN and the Ukrainian National Statistics Service is different, it is complex to make an exact comparison of production costs for wheat. However, a few identical categories can be compared (represented by the same colour codes in figures 23 and 24).
For example, the cost of fertilisers (+18%) and seeds (+53%) is higher in the European Union than in Ukraine. In addition, depreciation is twice as high in the EU (€28/tonne) than in Ukraine (€12/tonne).
The financial difficulties experienced by Ukrainian farmers during the war led to a reduction in the use of fertilisers in 2023. However, the share of fertiliser costs in overall production costs per hectare remains stable (between 17% and 28% of operating costs in 2023), as the fall in consumption has not offset the rise in fertiliser prices on the world market (Ukrainian Ministry of Agriculture).
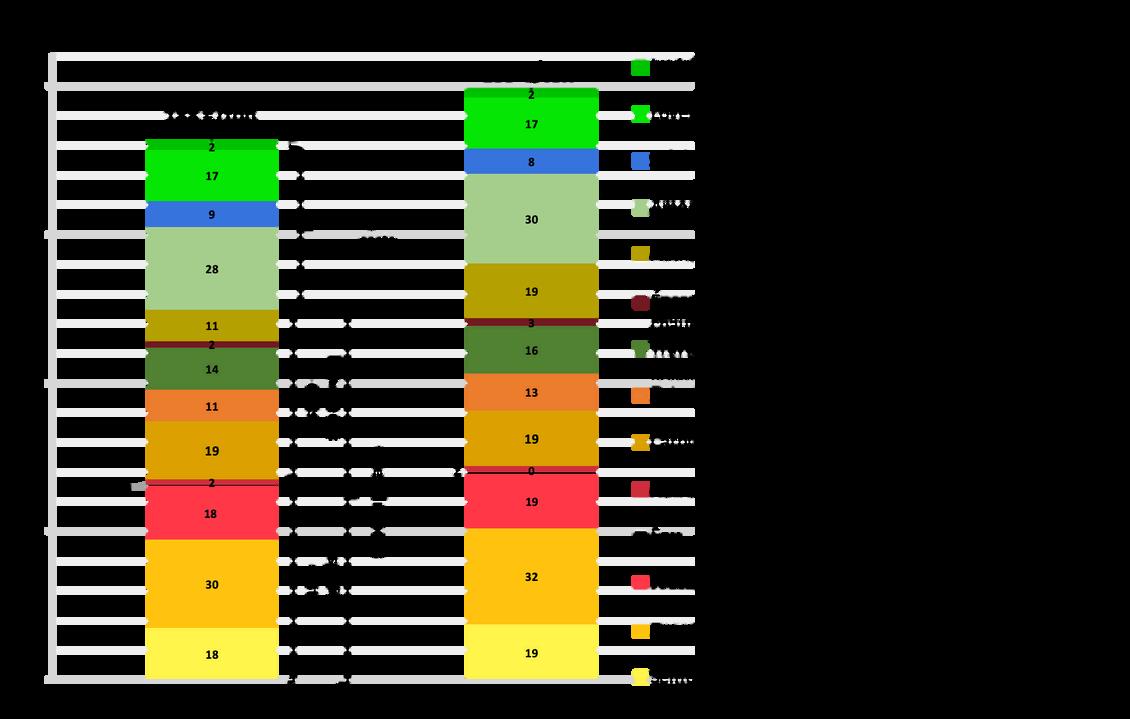
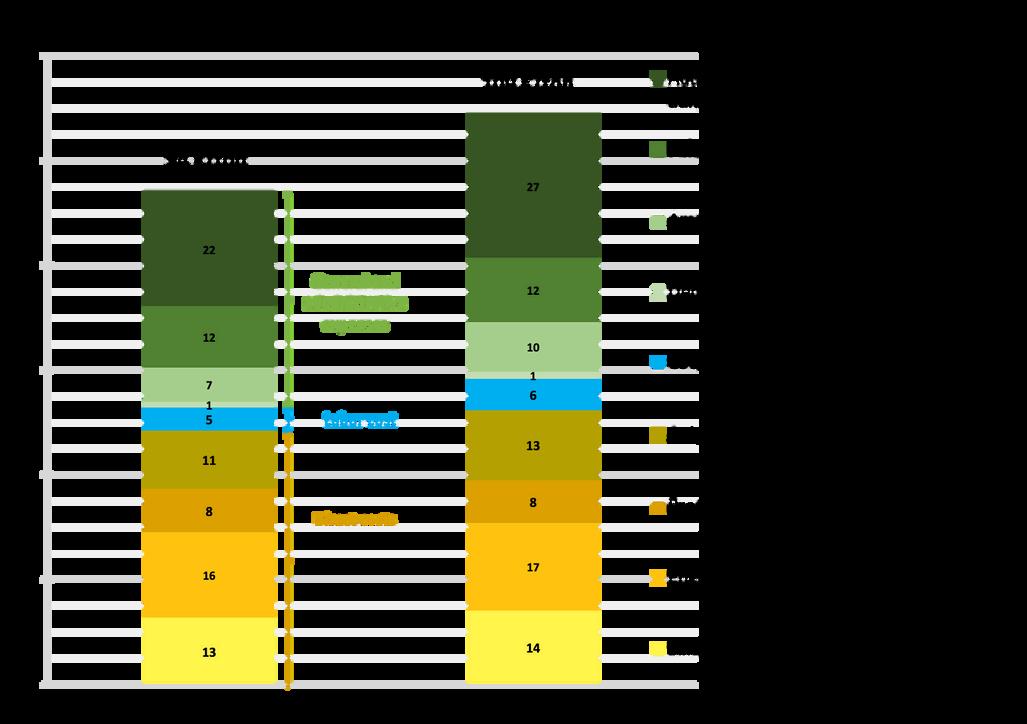
64 €/t 120 €/t
€/t

Figure 25 - Figure 25 - Comparison of wheat production costs in Ukraine (left) and the European Union (right), in euros Comparison of wheat production costs in Ukraine (left) and the European Union (right), in euros per tonne. per tonne Source Source: based on data from the State Statistics Service of Ukraine (SSSU) and from FADN. : based on data from the State Statistics Service of Ukraine (SSSU) and from FADN
Note Note: : Labour costs include the wages of any employees, as well as contract labour. Labour costs include the wages of any employees, as well as contract labour. Ukraine: Ukraine: only agricultural enterprises with an area of agricultural land equal to or greater than 200 hectares and/or an area of covered land only agricultural enterprises with an area of agricultural land equal to or greater than 200 hectares and/or an area of covered land equal to or greater than 5 hectares are included. equal to or greater than 5 hectares are included. European Union: European Union: imputed unpaid family factors (cost of unpaid family labour + cost of own capital) are not taken into account here. imputed unpaid family factors (cost of unpaid family labour + cost of own capital) are not taken into account here.
Labour costs, which include employee wages and contract costs (payments and services to other organisations), represent around 13% of the cost of producing wheat for the two agricultural powers. On the other hand, it is around 24% cheaper in Ukraine than in the European Union when calculating the overall cost of producing wheat.
For the 2023-24 season, the Ukrainian harvest is estimated at 4 million hectares of corn (USDA), corresponding to 48% of the area harvested in the European Union. In 2021, the harvested corn area will correspond to 59% of the European area, i.e. the corn area of France, Poland and Romania.
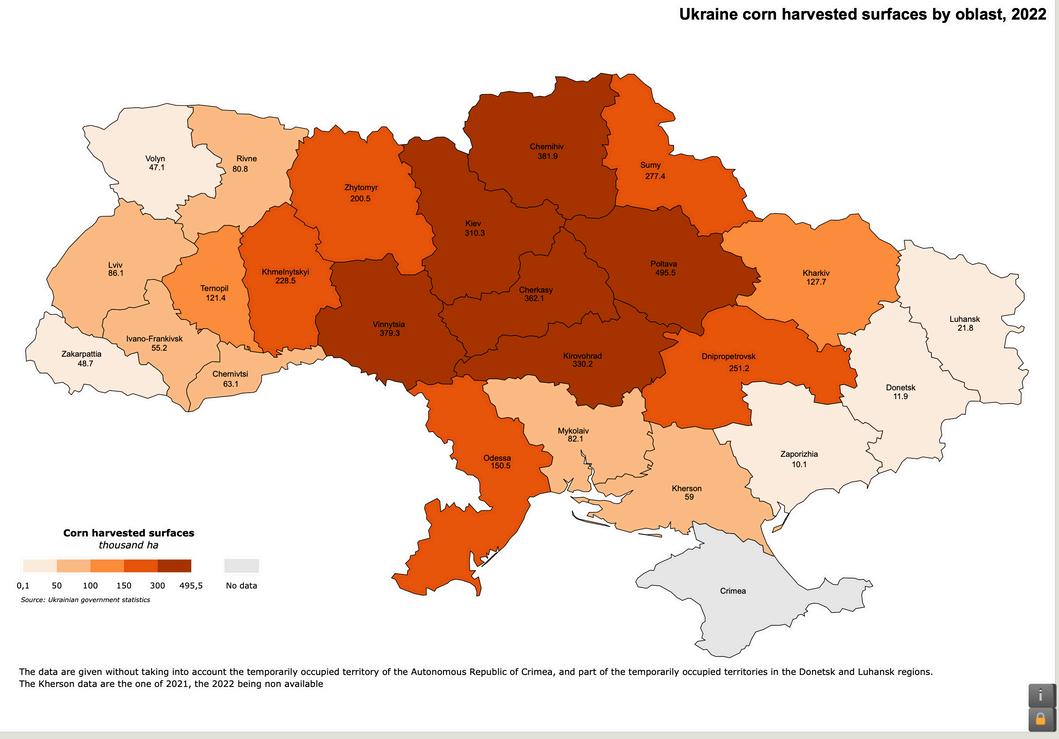
Figure 26 - Figure 26 - Area of maize harvested per Ukrainian oblast in 2022 Area of maize harvested per Ukrainian oblast in 2022 Source: Source: based on data from the State Statistics based on data from the State Statistics Service of Ukraine (SSSU) Service of Ukraine (SSSU)
Note Note: Data for the Kherson region is for 2021, as 2022 data is not available due to the war : Data for the Kherson region is for 2021, as 2022 data is not available due to the war
Corn tends to be grown in the north-east and centre of the country, and is mainly sown between April and May, with harvesting generally taking place between September and November. Only 2% of total maize production is irrigated (Derzhstat, years 2019-2021).
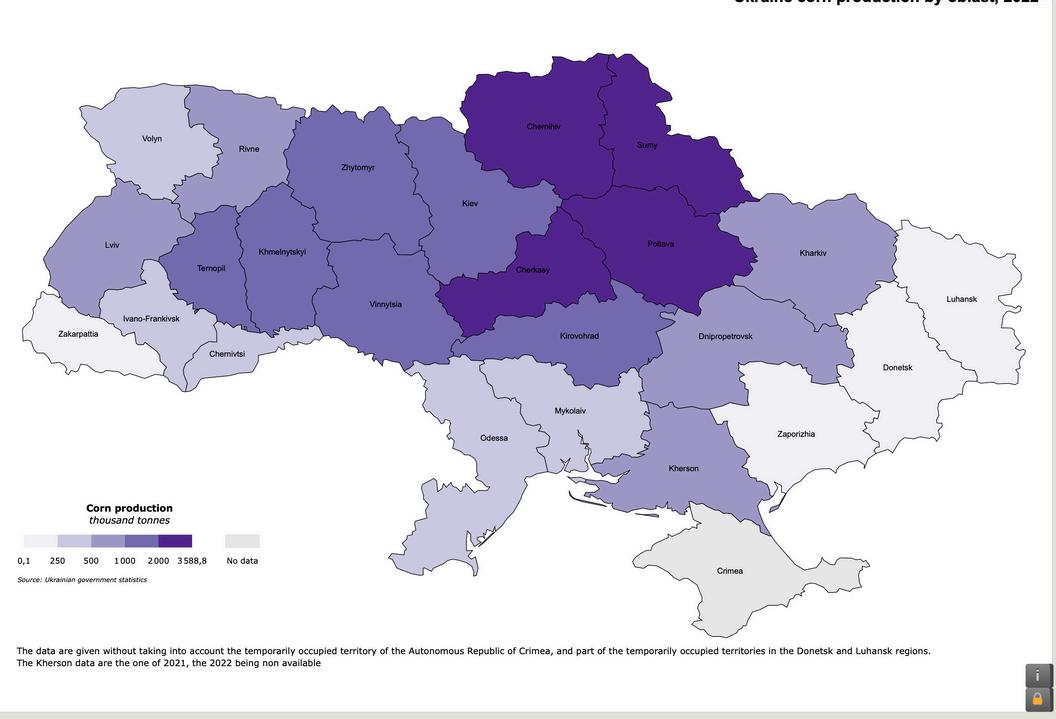
Figure 27 - Figure 27 - Ukrainian corn production areas, 2022 Ukrainian corn production areas, 2022 Source: Source: based on data from the State Statistics Service of based on data from the State Statistics Service of Ukraine (SSSU) Ukraine (SSSU)
Note Note: Data for the Kherson region is for 2021, as 2022 data is not available due to the war. : Data for the Kherson region is for 2021, as 2022 data is not available due to the war.
In 2021, Ukraine accounted for 58% of European production volume, with output of 42 million tonnes. If Ukraine were to join the European Union, it would become Europe's leading corn producer, ahead of France, Romania and Poland.
Ukraine's average corn yield is 63.5 qt/ha in 2022, but there are wide regional disparities. Before the war, the five-year average yield (2018-2021) was 70.8 qt/ha, compared with 78.5 qt/ha in the European Union (FAOStat).
The four top corn-producing regions have 2022 yields of around 73.5 quintals per hectare. Moreover, as these regions are not located in combat zones, production has only been impacted to a lesser extent.
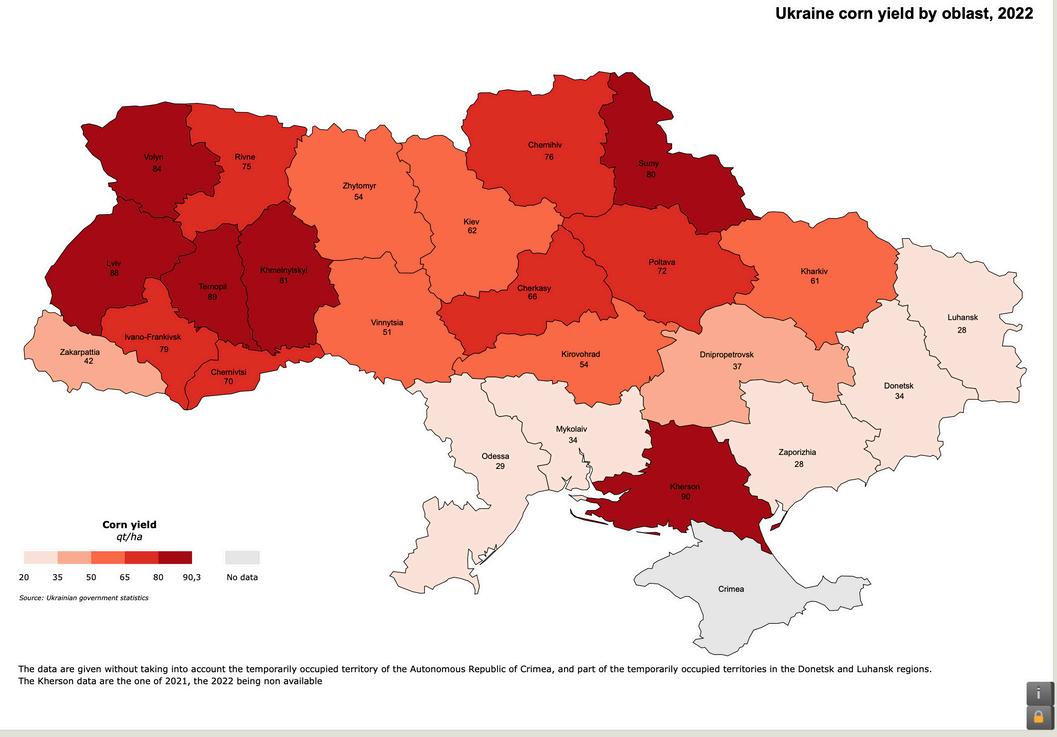
Averageyield
63,5qt/ha
Figure 28 - Figure 28 - Ukrainian corn yields by oblast, 2022 Ukrainian corn yields by oblast, 2022 Source: Source: based on data from the State Statistics Service of based on data from the State Statistics Service of Ukraine (SSSU) Ukraine (SSSU).
Note: Note: Data for the Kherson region is for 2021, as 2022 data is not available due to the war. Data for the region is for 2021, as 2022 data is not available due the war.
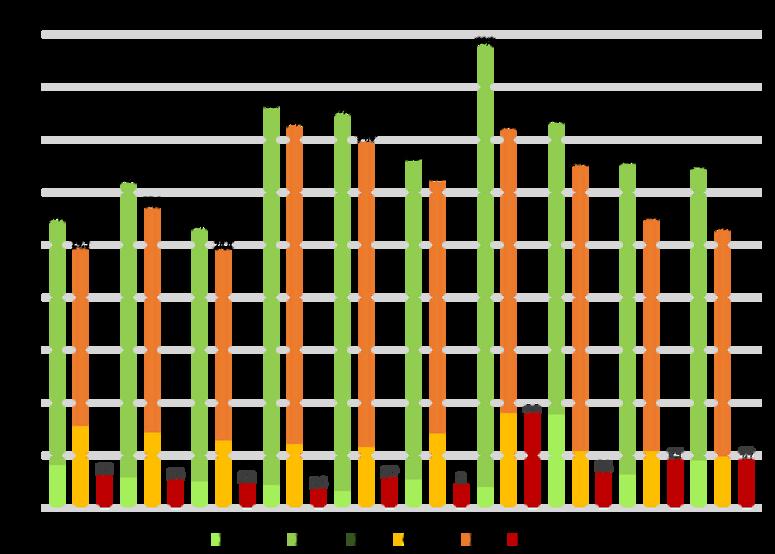
Figure 29 - Figure 29 - Corn supply and demand, Ukraine. Corn supply and demand, Ukraine Source: Source: IInternational nternational Grains Council (IGC) Grains Council (IGC)
Note Note: data to 14 April 2024, covering the Oct-Sept period of each year. ‘Consumption’ data : data to 14 April 2024, covering the Oct-Sept period of each year. ‘Consumption’ data are Statista data. *Excluding consumption, 2022/23 data are IGC estimates, and 2023/24 are Statista data. *Excluding consumption, 2022/23 data are IGC estimates, and 2023/24 and 2024/25 IGC forecasts. and 2024/25 IGC forecasts.
Ukrainian consumption represents 21% of available corn volume (average 2015-2021).
Ukraine imports little or no corn. In contrast, Ukraine exported 61% of the volume of corn available in 2021/22, i.e. 27 million tonnes. Despite a projected 25% reduction in exports between 2019/20 and 2023/24, the International Grains Council (IGC) estimates that exports will account for 67% of available volume.
Before the war, Ukraine exported mainly to China, Egypt, the Netherlands and Spain. An 18% drop in corn exports has been observed between 2019 and 2023.
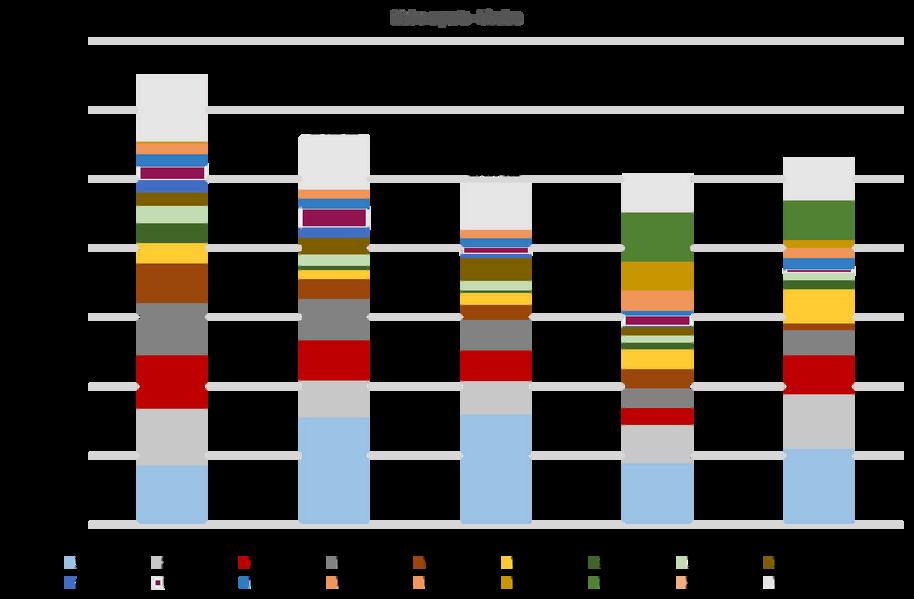
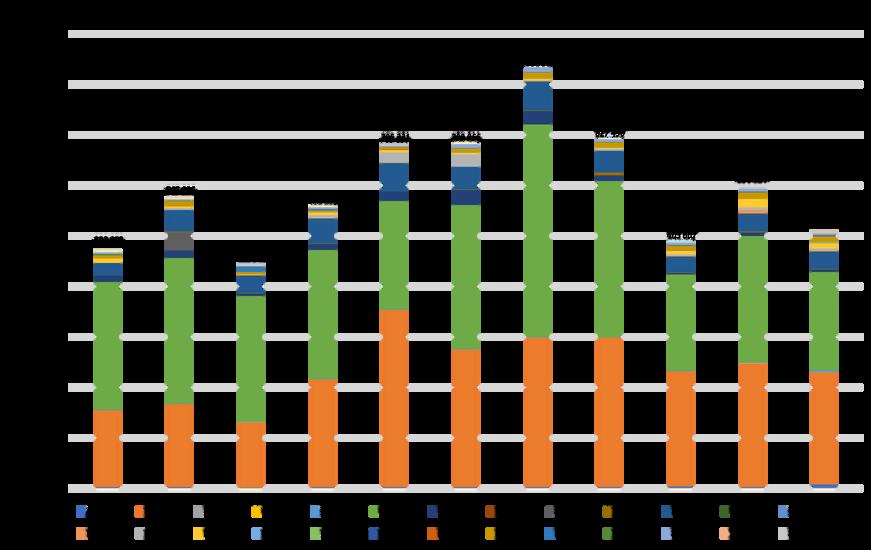
Figure 30 - Main destinations for Ukrainian corn. Source: based on WITS (World Integrated Trade Solution) and World Bank data
For example, export volumes to Turkey have fallen by 73% between 2019 and 2021; and Ukraine no longer exports to Algeria and Iran. Poland (x 13; +2 million tonnes) and Romania (x 6739; +2.8 million tonnes) have mainly replaced the decline in Ukrainian exports to "traditional" trading partners.
In 2023, of the 26 million tonnes of corn exported by Ukraine, almost 15 million were exported to the European Union (WITS, World Bank). The European Union thus accounted for 57% of Ukrainian corn exports, compared with 30% in 2021.
Between 2019/21 and 2023, corn imports from Ukraine increased by a factor of 1.2 (+2.7 million tonnes). By 2023, Ukraine accounted for 64% of corn imports into the European Union (12.8 million tonnes). The increase in Ukrainian corn imports was partly at the expense of countries such as Serbia and the United States, but mainly corresponds to a net import of corn. Imports from Russia increased between 2019/21 and 2023 (+220,000 tonnes).
UKRAINE, LEADING SUPPLIER OF CORN FOR THE EU
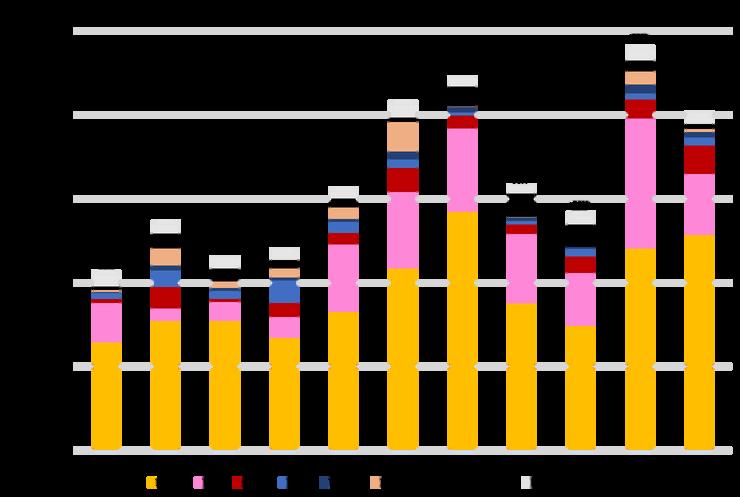
Figure 31 - Figure 31 - Corn imported by Corn imported by the EU-27 from its main the EU-27 from its main suppliers (outside the EU) suppliers (outside the EU) and Ukraine, and Ukraine's and Ukraine, and Ukraine's share of European imports. share of European imports
Source : Source : based on Eurostat based on Eurostat data data
In 2023, 5 countries accounted for 70% of European imports of Ukrainian corn: Spain (30%), Italy (14%), the Netherlands (13%), Slovenia (7%) and Portugal (6%). Imports and exports for these countries are available in the Appendix.
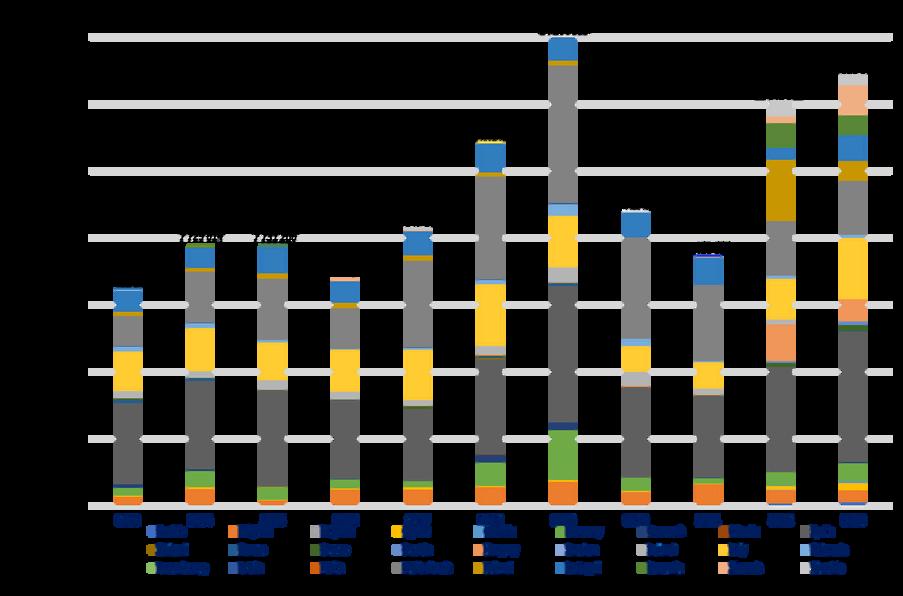
Figure 32 - Ukrainian corn imported by the EU-27. Source: based on Eurostat data
Between 2020 and 2023, Spain increased its imports of Ukrainian corn by 43% (+ 1.2 million tonnes), and accounted for 30% of European imports of Ukrainian corn in 2023. These import volumes correspond to net imports, which Spain seems to have absorbed, since this did not result in an increase in exports (inter or extra-EU).
Inward processing procedure allow European companies to import goods duty-free, which are then processed in Europe and re-exported. The aim is twofold: financial, by exempting these companies from customs duties and taxes; and economic, by encouraging European processing and strengthening the competitiveness of companies when re-exporting. The rules of origin for sugar imported under the IPR do not apply.
In 2022, Ukrainian corn under RPA was imported by Poland, but the volumes were marginal (3,500 tonnes) and execeptional. These are the only import volumes of Ukrainian corn under RPA recorded to date between 2013 and 2024 (data as of May 13, 2024).
Ukraine is a competitive agricultural power. According to government data, corn production in the Ukraine costs €109/tonne in 2020, compared with €145/tonne in the European Union (FADN). Ukrainian corn is therefore 25% cheaper than European corn.
Other general and administrative expenses
Payments for third-party services
Depreciation of fixed assets
Deductions for social purposes
Labor cost
Other direct costs
Oil products
Seeds and planting material
Figure 33 - Figure 33 - Ukrainian production costs for corn in 2019 and 2020, in €/ton Ukrainian production costs for corn in 2019 and 2020, in €/ton. Source: Source: based on data based on data from the State Statistics Service of Ukraine (SSSU) from the State Statistics Service of Ukraine (SSSU)
Note: only agricultural businesses with an area of agricultural land equal to or greater than 200 hectares and/or an area of covered land equal to or greater than 5 hectares are counted.
Depreciation of fixed assets
Other direct costs
Payments for third-party services
Deductions for social purposes
Fuels and lubricants
Fetilizers
Seeds and planting material
Methodology identical to the Ukrainian methodology
Figure 34 - Figure 34 - European production costs for corn in 2019 and 2020 European production costs for corn in 2019 and 2020
Rent paid
Interest paid
Wages paid
Energy (electricity, heating fuels)
Machinery and building maintenance
Other specific costs
Water
Crop protection
Additional criteria specific to the FADN
Source : Source : based on FADN data based on FADN data
Note
limputed unpaid family factors (cost of unpaid family labor + cost of own capital) are not taken into account here.
Note: : limputed unpaid family factors (cost of unpaid family labor + cost of own capital) are not taken into account here.
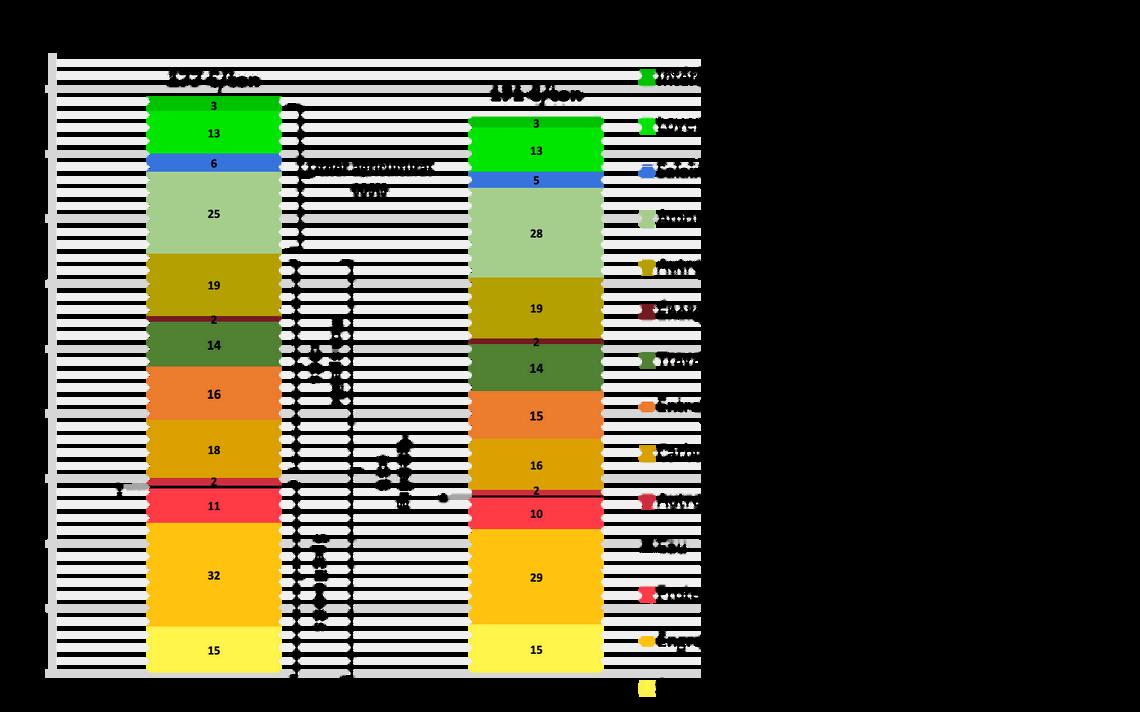
As the methodology used by the FADN and the Ukrainian National Statistics Service is different, it is complex to make an exact comparison of corn production costs. However, a few identical categories can be compared (represented by the same color codes in figures 32 and 33).
For example, the cost of fertilizers (+23%) and seeds (+18%) is higher in the European Union than in Ukraine. In addition, depreciation is twice as high in the EU (€20/tonne) than in Ukraine (€10/tonne).
Operating costs Labor cost
Other costs
Source: Source: based on data from the State Statistics Service of Ukraine (SSSU) and from the FADN based on data from the State Statistics Service of Ukraine (SSSU) and from the FADN
Note Note: Labour costs include the wages of any employees, as well as contract labour. : Labour costs include the wages of any employees, as well as contract labour. Ukraine Ukraine: only agricultural enterprises with an area of agricultural land equal to or greater than 200 hectares and/or an area of covered land : only agricultural enterprises with an area of agricultural land equal to or greater than 200 hectares and/or an area of covered land equal to or greater than 5 hectares are included. equal to or greater than 5 hectares are included.
European Union European Union: imputed unpaid family factors (cost of unpaid family labour + cost of own capital) are not taken into account here. : imputed unpaid family factors (cost of unpaid family labour + cost of own capital) are not taken into account here.
Labor costs, which include employee wages and contract costs (payments and services to other organizations), represent around 17% of the cost of corn production in Ukraine, compared with 13% in the European Union. Moreover, when calculating the overall cost of corn production, labor costs are around 5% lower in Ukraine than in the European Union.
For the 2023-24 campaign, the Ukrainian barley harvest is estimated at 1.6 million hectares (USDA), corresponding to 16% of the area harvested in the European Union. In 2021, the harvested barley area corresponds to 24% of the European area, i.e. the wheat area of Germany and Poland.
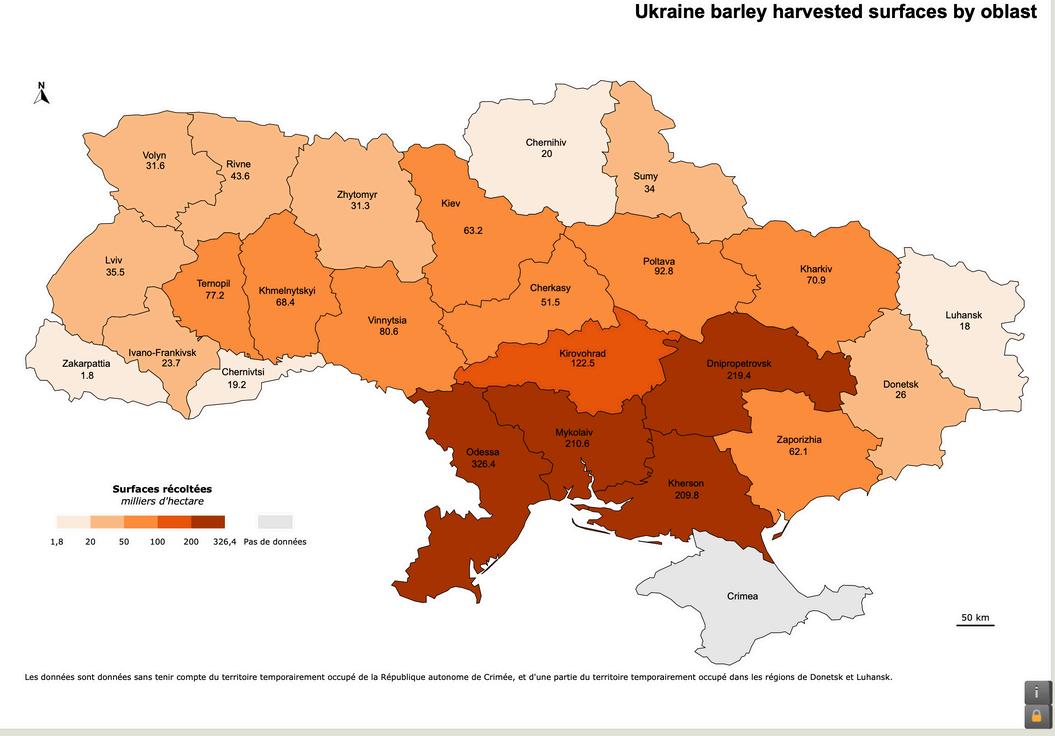
Figure 36 - Figure 36 - Barley area harvested by Ukrainian oblast in 2022 Barley area harvested by Ukrainian oblast in 2022 Source: Source: based on data from the State Statistics based on data from the State Statistics Service of Ukraine (SSSU) Service of Ukraine (SSSU)
Note: Data for the Kherson region is for 2021, as 2022 data is not available due to the war.
Note: Note: Note: Data for the Kherson region is for 2021, as 2022 data is not available due to the war.
Barley is mainly grown in the south and center of the country In 2022, 47% of production was winter barley and 54% spring barley (SSSU). Only 2% of total barley production is irrigated (SSSU, years 2019-2021).
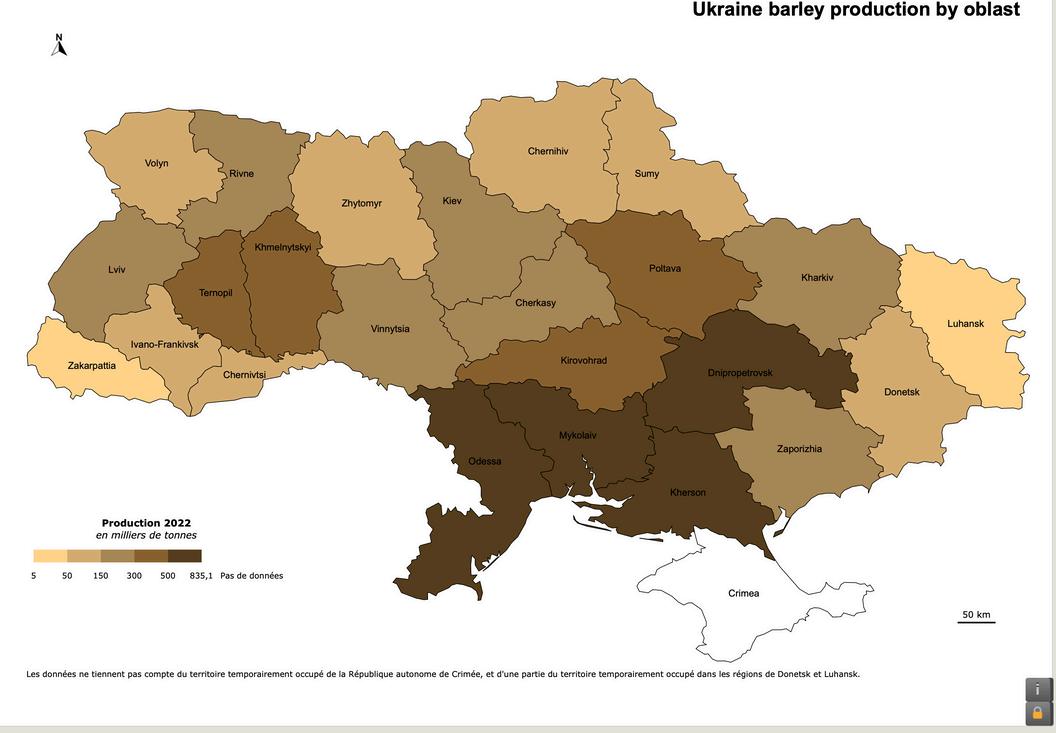
Figure 37 - Figure 37 - Ukrainian barley production basins, 2022 Ukrainian barley production basins, 2022. Source: Source: based on data from the State Statistics Service of based on data from the State Statistics Service of Ukraine (SSSU) Ukraine (SSSU)
Note: Note: Data for the Kherson region is for 2021, as 2022 data is not available due to the war. Data for the Kherson region is for 2021, as 2022 data is not available due to the war.
In 2021, Ukraine accounted for 18% of European production volume, with output of 9.4 million tonnes. If Ukraine were to join the European Union, it would become Europe's 3rd or 4th largest barley producer, behind France, Germany and even Spain.
The average Ukrainian wheat yield is expected to be 32 qt/ha in 2022, but with wide regional disparities. Before the war, the five-year average yield (2018-2021) was 34 qt/ha, compared with 49 qt/ha in the European Union (FAOStat).
The most barley-producing regions have 2022 yields of around 27 quintals per hectare, placing them more in the lower range of Ukrainian yields. Moreover, as these regions are located along the front line, a yield drop of almost 8 qt/ha has been observed between 2021 and 2022 in the regions bordering the Sea of Azov.
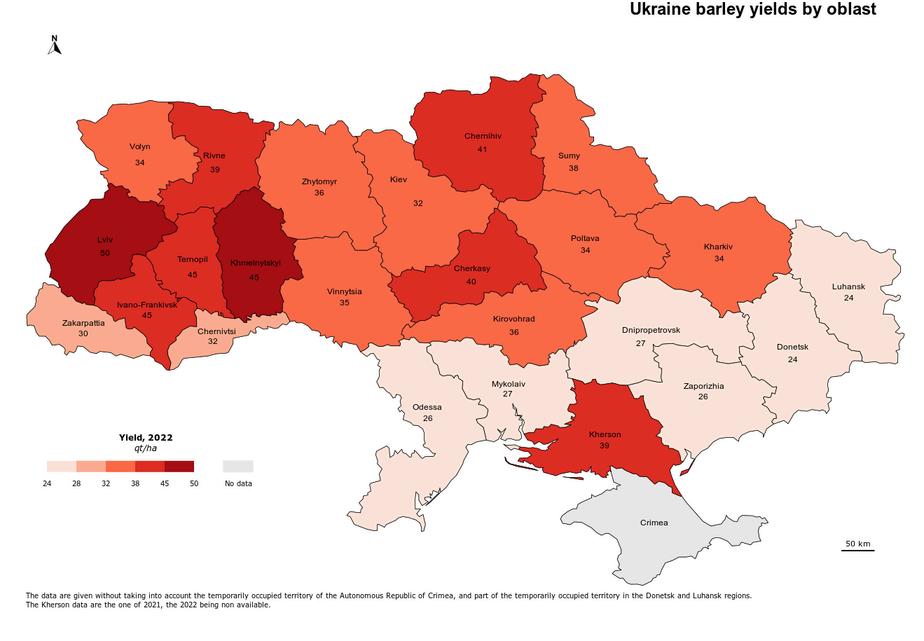
Averageyield 32qt/ha
Figure 38 - Figure 38 - Ukrainian barley yields by oblast, 2022. Ukrainian barley yields by oblast, 2022 Source: Source: based on data from the State Statistics Service of based on data from the State Statistics Service of Ukraine (SSSU) Ukraine (SSSU)
Note: Note: Data for the Kherson region is for 2021, as 2022 data is not available due to the war. Data for the Kherson region is for 2021, as 2022 data is not available due to the war.
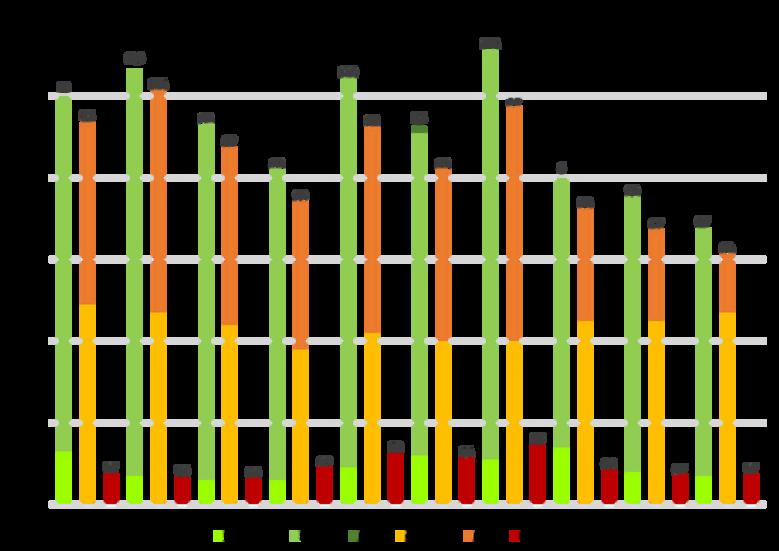
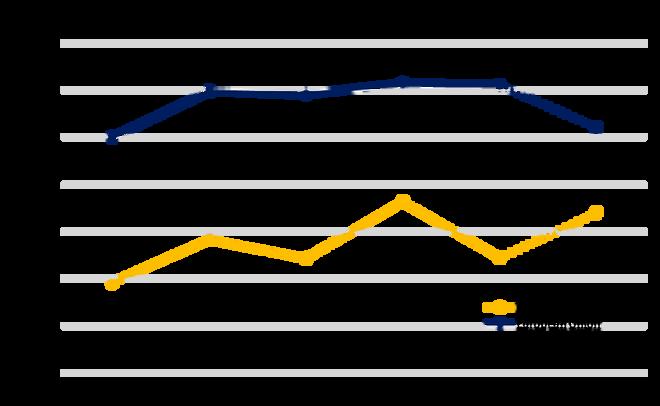
Figure 39 - Figure 39 - Barley supply and demand, Ukraine. Barley supply and demand, Ukraine Source: Source: International Grains Council (IGC) International Grains Council (IGC)
Note Note: : data to April 14, 2024, covering the July-June period of each year. ‘Consumption’ data to April 14, 2024, covering the July-June period of each year. ‘Consumption’ data are Statista data. *Apart from consumption, 2022/23 data are IGC estimates, and data are Statista data. *Apart from consumption, 2022/23 data are IGC estimates, and 2023/24 and 2024/25 IGC forecasts. 2023/24 and 2024/25 IGC forecasts.
Ukrainian consumption represents 44% of available barley volume (average 2015-2021).
Ukraine imports little or no barley. On the other hand, Ukraine has exported 51% of the volume of corn available in 2021/22, i.e. 5.7 million tonnes. However, the International Grains Council (IGC) estimates that exports will fall by 56% between 2019/20 and 2023/24, and will represent 30% of available volume in 2023/24. These figures are linked to a drop in production.
Before the war, Ukraine exported mainly to China, Saudi Arabia and Tunisia. However, a 48% drop in barley exports has been observed between 2019 and 2023.
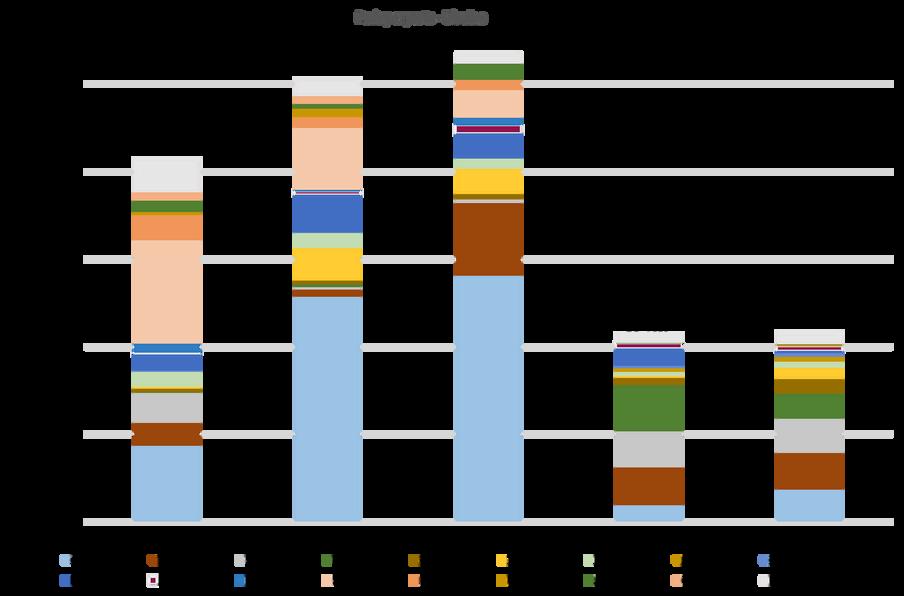
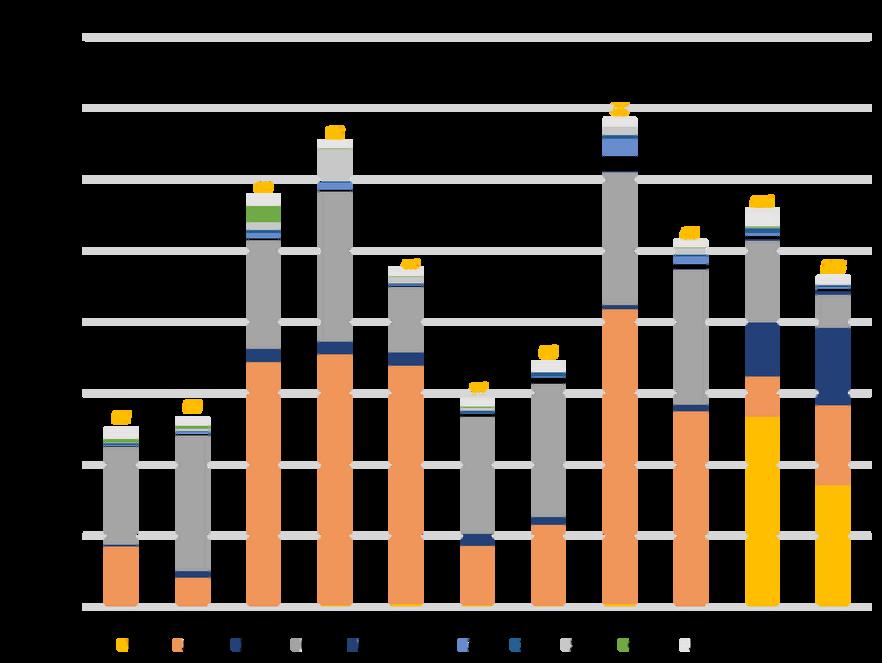
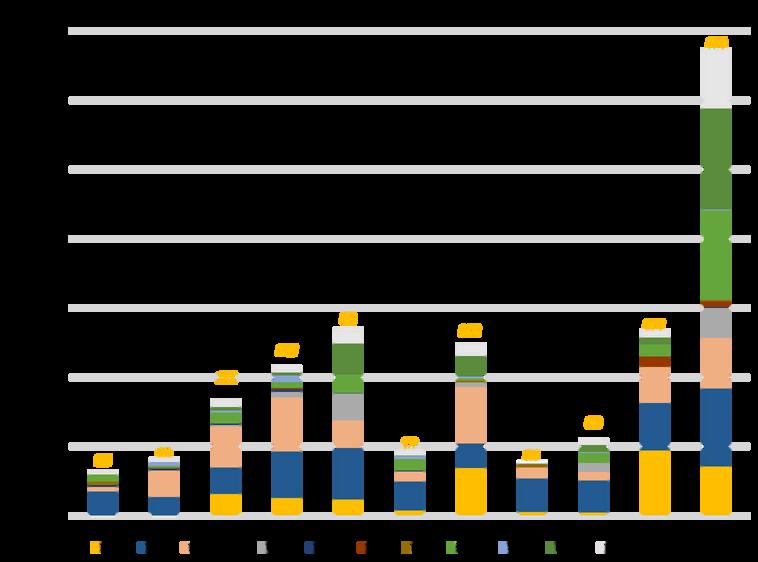
Figure 40 - Main destinations for Ukrainian barley Source : based on data from WITS (World Integrated Trade Solution) and the World Bank
For example, export volumes to China fell by 82% between 2019 and 2022; and Ukraine no longer exports to Saudi Arabia, Iran and Qatar. It is mainly Spain (x2.8; + 250,000 tonnes between 2019/21 and 2023) and Romania (x 16; + 271,000 tonnes between 2019/21 and 2023) that have benefited from the drop in Ukrainian exports to "traditional" trading partners.
In 2023, of the 2 million tonnes of corn exported by Ukraine, around 1 million were exported to the European Union (WITS, World Bank). The European Union thus accounted for 46% of Ukrainian barley exports, compared with 2% in 2021.
Between 2019/21 and 2023, barley imports from Ukraine increased 3.3-fold. In 2023, Ukraine thus accounted for 37% of barley imports into the European Union (660,000 tonnes). The increase in Ukrainian barley imports corresponds mainly to a net import. Imports from Brazil and Canada remained stable overall over the period. On the other hand, imports from Russia increased 42-fold between 2019/21 and 2023 (+53,000 tonnes).
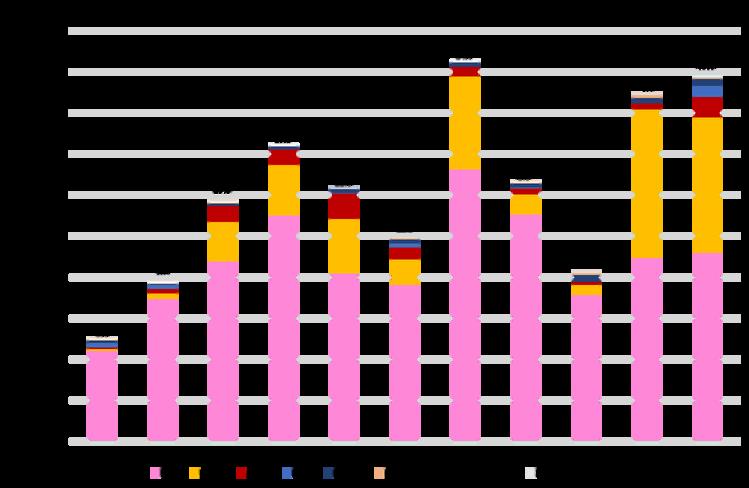
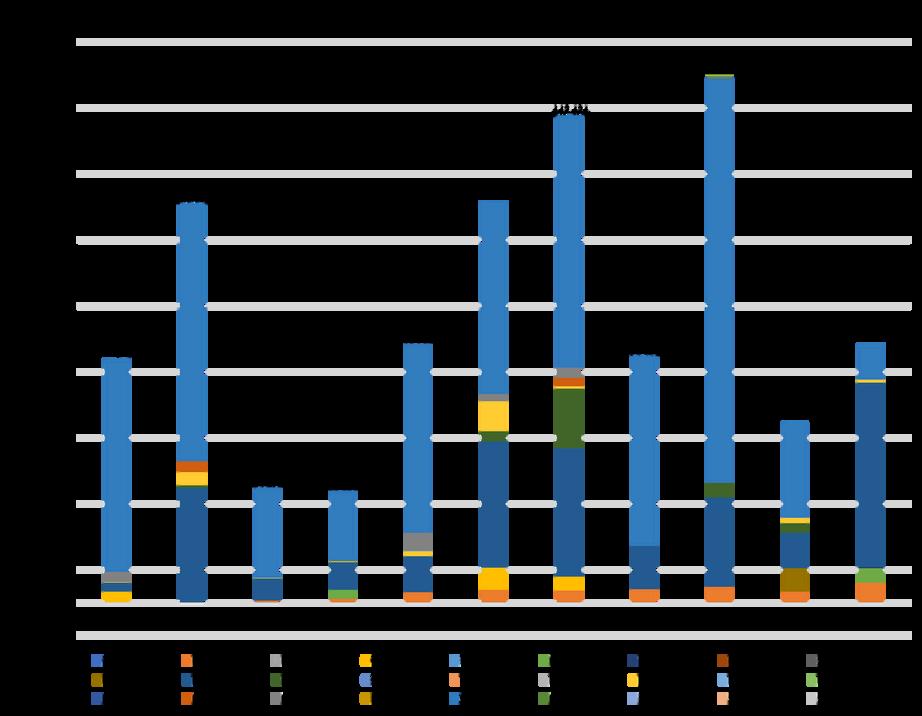
Figure 41 - Figure 41 - Barley imported by the EU-27 from its main suppliers (outside the EU) and Ukraine, and Ukraine's Barley imported by the EU-27 from its main suppliers (outside the EU) and Ukraine, and Ukraine's share of European imports share of European imports. Source: Source: based on data from Eurostat based on data from Eurostat.
Between 2020 and 2023, barley imports from Ukraine will have increased almost 7-fold, with Spain, Cyprus, Poland and Romania the main gateways for this cereal into the European Union.
Imports and exports from these countries are available in the Appendix.
Between 2020 and 2023, Spain increased its imports of Ukrainian barley by a factor of 13 (+ 320,000 tonnes), and accounted for 54% of European imports of Ukrainian barley in 2023 These import volumes correspond to net imports, which Spain seems to have largely absorbed, since this has not translated into a significant increase in exports (inter or extra-EU).
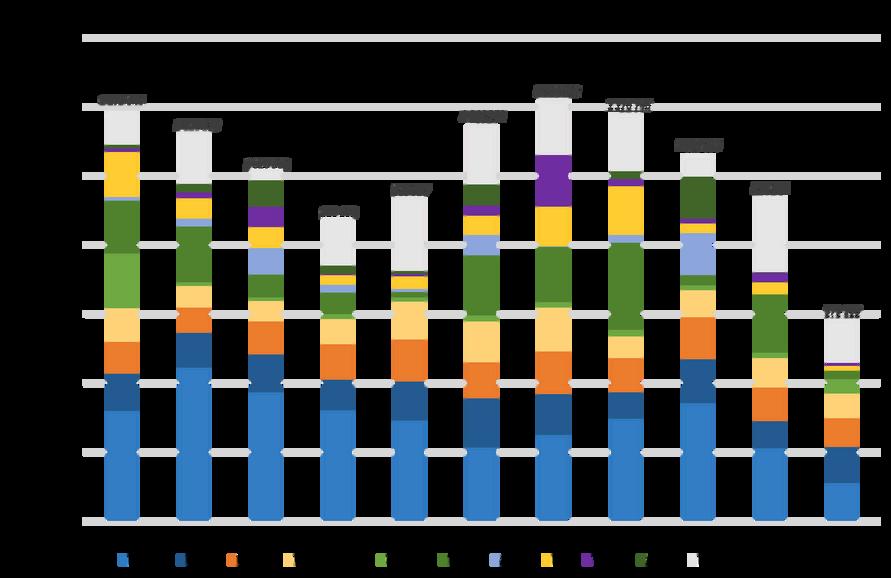
Cyprus increased its imports of Ukrainian barley by a factor of 2 between 2020 and 2023, to the detriment of traditional importers such as Romania and Bulgaria. Ukrainian imports accounted for 64% of Cypriot barley imports in 2023 (118,000 tonnes).
No European imports of Ukrainian barley under IPR have been recorded over the period 20132024 (data to May 13, 2024).
Ukraine is a competitive agricultural power. According to government data, barley production in the Ukraine costs €120/tonne in 2020, compared with €171/tonne in the European Union (FADN). Ukrainian barley is therefore 30% cheaper than European barley.
Other general and administrative expenses
Payments for third-party services
Depreciation of fixed assets
Deductions for social purposes
Labor cost
Other direct costs
Oil products
Inorganic fertilizers
Seeds and planting material
Figure 43 - Figure 43 - Ukrainian production costs for barley in 2019 and 2020, in €/ton Ukrainian production for barley in 2019 and 2020, in €/ton. Source Source: based on data from : based on data from the State Statistics Service of Ukraine (SSSU) the State Statistics Service of Ukraine (SSSU)
Note: only agricultural businesses with an area of agricultural land equal to or greater than 200 hectares and/or an area of covered land equal to or greater than 5 hectares are counted.
Depreciation of fixed assets
Other direct costs
Payments for third-party services
Deductions for social purposes
Fuels and lubricants
Fetilizers
Seeds and planting material
Methodology identical to the Ukrainian methodology
Rent paid
Interest paid
Wages paid
Energy (electricity, heating fuels)
Machinery and building maintenance
Other specific costs
Water
Crop protection
Additional criteria specific to the FADN
Figure 44 - Figure 44 - European production costs for barley in 2019 and 2020 European production costs for barley in 2019 and 2020. Source Source: based on FADN data : based on FADN data.
Note Note: imputed unpaid family factors (cost of unpaid family labor + cost of own capital) are not taken into account : imputed unpaid family factors (cost of unpaid family labor + cost of own capital) are not taken into account here. here
As the methodology employed by the FADN and the Ukrainian National Statistical Service is different, it is complex to make an exact comparison of barley production costs. However, a few identical categories can be compared (represented by the same color codes in figures 42 and 43).
Thus, the cost of fertilizers (+21%) and seeds (+50%) is higher in the European Union than in Ukraine. In addition, depreciation is twice as high in the EU (€28/tonne) than in Ukraine (€12/tonne).
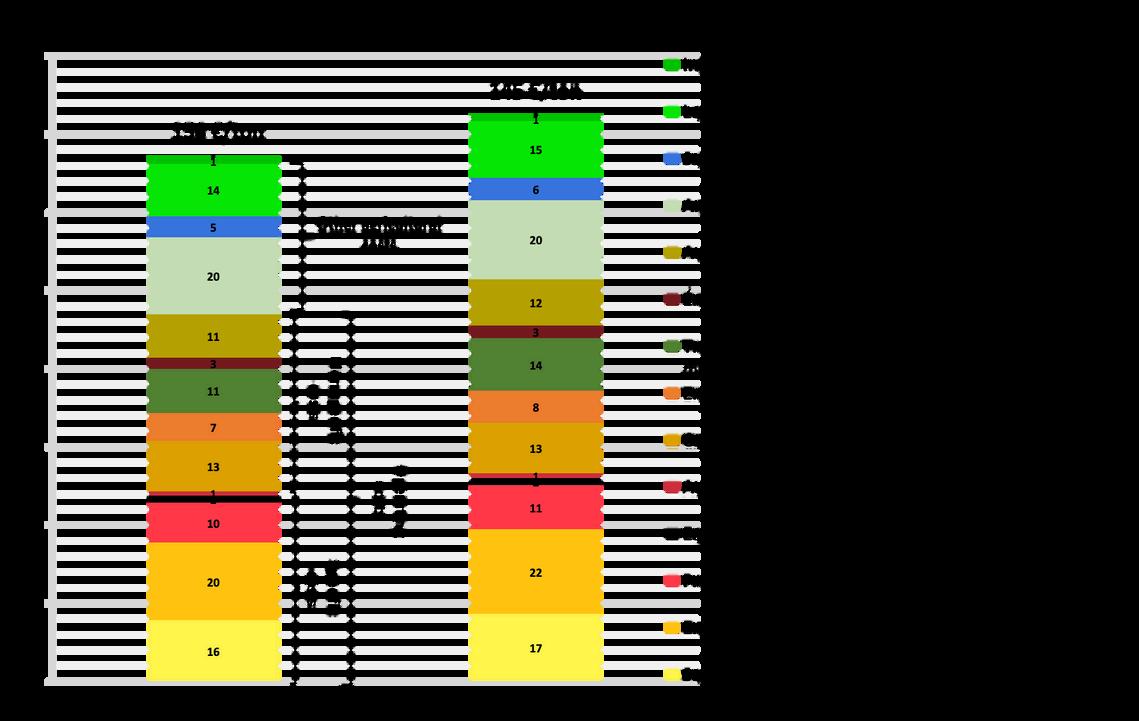
Figure 45 - Figure 45 - Comparison of barley production costs in Ukraine (left) and European Union (right), in euros per
Comparison of barley production costs in Ukraine (left) and European Union (right), in euros per tonne of barley tonne of barley. Source Source: based on data from the State Statistics Service of Ukraine (SSSU), and the FADN : based on data from the State Statistics Service of Ukraine (SSSU), and the FADN.
Note Note: Labour costs include the wages of any employees, as well as contract labour. : Labour costs include the wages of any employees, as well as contract labour Ukraine Ukraine: only agricultural enterprises with an area of agricultural land equal to or greater than 200 hectares and/or : agricultural enterprises with an area of agricultural land equal to or greater than 200 hectares and/or an area of covered land equal to or greater than 5 hectares are included an area of covered land equal to or greater than 5 hectares are included European Union European Union: imputed unpaid family factors (cost of unpaid family labour + cost of own capital) are not taken : imputed unpaid family factors (cost of unpaid family labour + cost of own capital) are not taken into account here into account here
Labor costs, which include employee wages and contractual costs (payments and services to other organizations), are also 16% lower in Ukraine than in the European Union.
Unlike the sugar industry, cereal production is not entirely controlled by the large agricultural structures that include Ukraine's 110 agro-holdings. Thus, 51% of cereal production is carried out by structures of less than 1,000 ha. It should be noted, however, that the concentration of production by very large structures remains high: the 369 cereal companies of over 3,000 ha, including the agro-holdings, account for 22% of total cereal production.
Ukrainian cereal production will reach 61 million tonnes in 2023, with the three main crops being corn, wheat and barley. In a scenario where Ukraine joins the European Union, and maintaining current production patterns, the country would account for 20% of European cereal production, with 49% of corn production and 15% of wheat production.
Ukrainian grain production costs are on average 30% lower than European production costs. Thus, 2020 production costs for the 3 main cereals are respectively 121 €/t for wheat, 145 €/t for corn and 120 €/t for barley. This price differential is mainly due to lower labor costs, as well as lower input use due to the presence of fertile soils. Ukraine uses up to 1.5 times less fertilizer than the European Union!
The opening up of the European market to Ukraine has resulted in an influx of cereals, with cereal imports from Ukraine increasing 2-fold between 2019/21 and 2023 In 2023, Ukraine will account for 54% of cereal imports into the European Union. Spain, Italy and the Netherlands are the main gateways for Ukrainian cereals. The European Union has become a pillar of support for the Ukrainian economy, accounting for 51% of Ukrainian wheat exports (8.2 million tonnes) in 2023, compared with 30% in 2021.
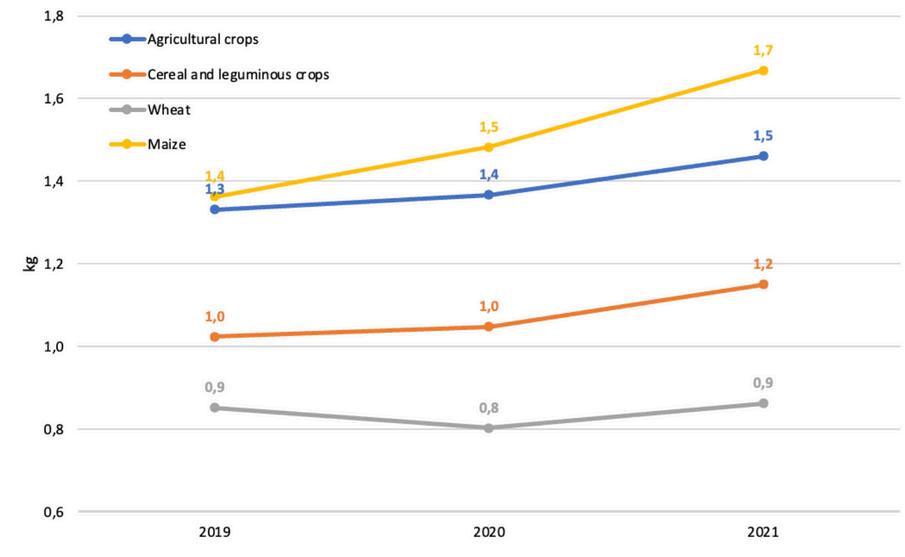
Appendix1:PesticideuseinUkraineforthemaincerealcrops(kg/ha).Source:based ondatafromtheStateStatisticsServiceofUkraine(SSSU).
Appendix 2: Active substances authorized in Ukraine and banned in the European Union(non-exhaustivelist).Source:basedondatafromtheUkrainianMinistryofthe EnvironmentandtheEuropeanCommission.
acetochlor herbicide sunflower, corn, soybean, cucurbits
ammonium glufosinate herbicide sunflower, soybean, corn, wheat, rapeseed
atrazine herbicide corn, sorghum
bacillus firmus I-1582 nematicide (biocide) corn, sugar beet
benomyl fungicide
cereal crops (winter wheat), sugar beet, ornamental flowers (roses)
beta-cyfluthrin insecticide wheat, sunflower
beta-cypermethrin insecticide wheat, barley, oats, potatoes
bifenthrin insecticide & acaricide
bispyribac-sodium herbicide
wheat, spring barley, sugar beet, rapeseed, corn, sunflower, soybean, apple, vine, cucumber, rose
BE, DE, DK, EL, IT, PT, SE
boric acid antiseptic, insecticide tournesol, maïs, céréales (blé, orge), fleur, plante ornementale
brodifacoum rodenticide (biocide) (winter) cereals, winter rape, fruit plantations, storage areas (mice, rodents)
bromadiolone rodenticide (biocide) storage areas (mice, rodents)
carbendazim fungicide
wheat, barley, sugar beet, sunflower, rye, peas, rice, soybeans
*This information is updated once a year on the European Commission website, and may not reflect the actual situation in member states.
chlorothalonil fungicide winter wheat
clofentezine acaricide
clothianidine insecticide
soy, apple, grape, strawberry, hop BE, EL, HR, IT, LU, PT, SI, SK
spring wheat, spring barley, corn, sunflower
diflovidazine (flufenzine) insecticide & acaricide soybean
diflubenzuron insecticide
dimethoate insecticide & acaricide
dimethomorph fungicide
corn, apple, cabbage, sunflower, soybean
cereals (wheat, barley); apple and pear trees; vineyards; sugar beets; peas (grain); hops; soybeans; rapeseed; oats; potatoes; corn, sunflower, soybeans, tomatoes, onions
potato, tomato, soybean, sunflower, onion, cucumber, grapevine
diquat herbicide
epoxiconazole fungicide
famoxadone fungicide
fipronil insecticide
flumetsulam herbicide
flutriafol fungicide
imazapyr fungicide
hops, rice, potatoes, onions, soybeans, sunflowers, peas, cabbage, alfalfa, sorghum, carrots, beets (sugar, table, fodder), red clover, turnips, flax, rapeseed, fodder beans, radishes, orchards, vines
AT, BE, BG, CY, CZ, DE, DK, EE, EL, FR, HR, HU, IE, IT, LT, LU, LV, MT, NL, NO, PL, PT, RO, SE, SI, SK
wheat, barley, sugar beet, soybean, sunflower, corn HU, PT
potato, tomato, vine, sunflower, soybean, onion, cucumber HR, PT
potato, sunflower, corn, tomato, sugar beet, hops, soybean, wheat, barley
cereals (wheat, barley, oats, rye), soybeans
cereals (wheat, barley, rye), peas, sugar beet, apples, rapeseed, sunflower, rice, corn, vines, soybeans HR, PT
wheat, barley, sugar beet, sunflower, rye, peas, rice, soybeans
imidacloprid insecticide (neonicotinoid)
ipconazole
isoproturon
lufenuron
mancozeb
(growth regulator)
methyl thiophanate fungicide
metolachlor
novaluron
pencycuron
picoxystrobin
phosphoric acid
used as a precursor in the manufacture of organophosphate pesticides (insecticide, acaricide)
wheat, corn, rapeseed, potato, sugar beet, sunflower, grapevine, tomato, apple, plum, eggplant, tomato, onion, rye, sorghum
canola, orge
pear, vine
potato, tomato, apple, pear, vine, sugar beet, wheat, rapeseed
cereals (wheat), rapeseed, soya, sunflower HR, IT
tomato, corn, soybean, potato, sunflower, sorghum, sugar beet, apple, raisin, pea, rapeseed, seedling tomato, watermelon, hops, tobacco, cabbage, watermelon
potato, tomato, onion, apple, corn, soybean, rapeseed
potato, fruit, ornamental and forestry seedlings; tomato, bell pepper, eggplant and cabbage seedlings
wheat, barley, oats, rapeseed, sugar beet, sunflower, corn, soybeans, chickpeas, peas, lupin, rice
wheat, barley, soya, maize, sunflower, sugar beet, rapeseed, apricot, cherry, peach, apple, pear, non-productive perennial planting (mother plant, nursery); vine, potato, tomato, cucumber, onion, turnip; hops; pine plant; oak (plant)
wheat, barley, soybean, sunflower
carrot, potato, garden pea, field pea, coriander, sunflower, soybean
Culture(s)
propargite acaricide apple, vine, soy -
propiconazole fungicide
propineb fungicide
propizochlor (propisochlore) herbicide
winter wheat, spring barley, sunflower, soybean, sugar beet, rye, apples, rice, peach, tomato, rapeseed, peas
potato, tomato, onion, turnip, apple, vineyard, grape -
maize, sunflower, rapeseed, soybeans, sugar beet, peas, chickpeas -
quinoxyfen fungicide apple, vine -
S-metholachlor herbicide
Seed tomatoes, corn, soybeans, potatoes, sunflowers, sorghum, sugar beet, peas, rapeseed, cabbage
AT, BE, DE, EL, FR, HR, IT, NL, PT, SK
spirodiclofen insecticide & acaricide apple, pear HR
spiromesifen insecticide & acaricide corn, apple, sunflower BE, EL, IT, PT
spirotetramat insecticide
apple, pear, grapevine, soybean, cabbage, onion, tomato, cucumber, cherry
AT, BE, BG, CY, CZ, DE, DK, EE, EL, ES, FI, FR, HR, HU, IT, LT, LU, LV, MT, NO, PL, PT, SE, SI, SK
teflubenzuron insecticide & acaricide potatoes, raisins, cabbage, apples PT
thiacloprid insecticide (neonicotinoid)
thiamethoxam insecticide (neonicotinoid)
thiram fungicide
corn, wheat, rapeseed, sunflower, mustard, potato, tomato, cherry, apple, barley, sugar beet, strawberry
corn, sunflower, potato, rapeseed, sorghum, sugar beet, wheat, tomato, cabbage, sunflower, rice, barley, rye, soybeans, hops, grapevine, flax, peas, onions, pine, apple, pear, eggplant, bell pepper, strawberry, poppy
wheat, barley, sunflower, rapeseed, soybeans, rye, corn, flax, chickpeas PT
Substance
total amino acids
triadimefon fungicide
cereals, pulses, maize, sunflower, rapeseed, sugar beet, fruit crops, vegetable crops, raisins, potatoes, apple trees, tomatoes, fruit, berries, grapes, flower crops
wheat, barley, sugar beet, vine, apple tree
triadimenol fungicide barley, vine, apple, wheat, sugar beet
triasulfuron
tribenuron-methyl
barley
wheat, sunflower, rye, oats
flax, tomatoes, cabbage, coriander, tomato, tobacco, garlic, onion, eggplant, bell pepper, cucumber, lupin, alfalfa, anise, geranium, basil, caraway seeds, spearmint, annual flowers, astragalus, sand immortelle, valerian, common fennel, buttercup, mountain cassia, medicinal marigold, nightshade, milk thistle, three-part succession, lavender, sainfoin, watermelon.
zeta-cypermethrin insecticide
wheat, barley, potatoes, peas, soybeans, sugar beets, rapeseed, flax, cabbage, watermelons, melons, alfalfa, grass, vineyards, apples
*This information is updated once a year on the European Commission website, and may not reflect the actual situation in member states
Appendix 3: All 110 Ukrainian agro-holdings listed in 2021, classified by cultivated area.Source:Latifundistandofficialcompanywebsites.
MHP (Myronivsky Hliboprodukt)
UkrLandFarming
Agroprosperis (New century Holding) wheat, corn, soybeans, rapeseed, sunflower
soya, sugar beet, winter wheat (including winter wheat seed), sunflower, winter rape, maize
Continental Farmers Group maize, wheat, rapeseed, sunflower, barley, soybeans, potatoes
Epicentr Agro winter wheat, rapeseed, sunflower, corn, soybean
-laying hens, dairy and beef cattle -sunflower oil
Sumy Kiev
Vinnytsia
Ternopil
Khmelnytsky
Lviv
Ivano-Frankivsk
Dnipropetrovsk
Lviv
Ivano-Frankivsk
Ternopil
Rivne
Zhytomyr Khmelnytskyi
Dnipropetrovsk
Sumy
Poltava
Zhaporizhia
Mykolaiv
Cherkassy
Kiev
Donetsk
Volyn Lviv
Ternopil Rivne
Chernivtsi Khmelnytsky Zhytomyr Vinnytsia Kyiv Cherkasy Mykolaiv Chernihiv Sumy
Poltava Kharkiv
Poltava Vinnytsya Zhytomyr Ternopil Khmelnytsky
-laying hens, broilers, dairy and beef cattle -sunflower oil
laying hens, dairy and beef cattle
Chernihiv Kharkiv -sugar refinery -dairy cattle -soy processing
Ternopil Lviv
Khmelnytsky Chernivtsi
Ivano-Frankivsk -starch production -seed production (420 tons/day)
Ternopil
Vinnytsia Khmelnytsky Zhytomyr Cherkasy
Kiev
-fertilizer production -wheat flour production -dairy cattle, beef cattle, pigs
winter wheat, winter barley, spring barley, maize, soybeans, winter rapeseed, sunflower, chickpeas, phacelia, peas
Privat-AgroHolding corn, soybean, sunflower, wheat, sorghum
Vitagro
winter wheat, winter barley, winter rye, spring barley, maize, soya, winter rapeseed, sunflower
AgroVista (former UkrAgroCom and Hermes-Trading)
wheat, barley, corn, sunflower, canola, peas, sugar beet
Luhansk -laying hens, dairy cattle -bakery
Sumy Kiev Vinnytsia Ternopil Khmelnytsky Lviv
Ivano-Frankivsk
Dnipropetrovsk
Zhytomyr Kharkiv Chernihiv Odessa Cherkasy
-laying hens, broilers, dairy and beef cattle -sunflower oil
-dairy cattle, beef cattle, pigs -sugar refinery -wheat flour production -bakery
-seed manufacturing. Line 1 = corn, wheat, barley, peas, soybeans, sunflower; production capacity 150200 tons/day; 130 employees. Line 2 = flax, coriander, spelt; capacity 75 tons/day; 60 employees. -Irrigation system
Poltova dairy cattle, beef cattle
Khmelnytsky Ternopil Rivne
Kirovohrad Dnipropetrovsk
-horticulture (fruit and vegetables) -dairy cattle -seed production (wheat, soya, rapeseed, mustard, peas, barley) -sunflower and rapeseed oil
-dairy and beef cattle -sugar refinery
Svitanok wheat, barley, corn, peas, soybeans, sugar beets, potatoes, tropical crops (lemon, feijoa)
Agrotrade wheat, corn, sunflower, winter wheat, spring barley, buckwheat
Zakhidnyy Bug cereals, industrial and forage crops
Dnipro Agro Group
Dnipropetrovsk Kirovohrad -beef cattle, pigs -meat processing -bakery -pasta production
Kharkiv Poltava Sumy Chernihiv seed production (sunflower, corn, barley, buckwheat, soya, winter wheat)
Lviv Ternopil -seed production -breeding
Chernihiv Kyiv Poltava Sumy Zakarpattia dairy cattle
Agroprodservis wheat, barley, sunflower, soybean, spring barley, rapeseed, peas, sugar beet
Zhytomyr Kiev Cherkasy Poltova Kivorhad -beef cattle, dairy cattle, pigs -production of seeds, fertilizers and plant protection products
Vinnytsia Zhytomyr Khmelnytskyi dairy cattle, pigs
dairy cattle, beef cattle, pigs
Ternopil Ivano – Frankivsk Lviv Kherson -pigs, broilers -seed production -meat processing (preserves, sausages)
-meat processing
Agrospetsservis (I&U Group) wheat, sunflower, corn, buckwheat, sugar beet
Kirovohrad rafineries (sugar)
Zhytomyr Kharkiv Khmelnytski Kiev Tcherkassy Kirovohrad dairy cattle
Southern Agricultural and Export Company (PAEK) sunflower, winter wheat, winter barley, winter rape, maize, peas, oats, millet
Svarog West Group
sunflower, sugar beet, corn, wheat, soybean. Also flax, naked pumpkin, beans, malting barley, medicinal chamomile.
Khmelnytskyi Zhytomyr Chernivts
-sugar refinery -bakery
-livestock: sheep, pigs, beef cattle -Production of briquettes (alternative fuel) from straw and other crops.
-production of sunflower pellets (an alternative to fuel) -freshwater fishing -farm machinery rental
-beef and dairy cattle -arboriculture: apples, pears, apricots, cherries -seed production
-forage production -soybean oil production -sugar refineries -biogas plants -livestock: turkey, cattle, pigs -meat processing Holding Agro Region
Khmelnytsky Zhytomyr
Zemlya i volya
-animal feed production -poultry farming, broiler poultry -chicken meat processing
-pig farming -flour production
Beta Agro Invest (B.I.G. Harvest Group)
Main crops: winter wheat, sunflower, corn. Also barley, rapeseed, alfalfa, mustard and chickpeas.
AgroGeneration winter wheat, rapeseed, malting barley, maize, soybean, sunflower, peas
Ekoprod buckwheat, thistle, millet, rye, fig, corn, oats, barley, wheat
TPK Agroalyans cereals, pulses, oilseeds
Kirovohrad Mykolaiv Chernihiv Odesa
-tomato seed production -processing (tomato paste and powder)
-livestock: pigs, genetic center -soybean processing: oil and meal (up to 250,000 tonnes per year)
Donetsk Chernihiv
-livestock: dairy cattle -services: road transport of agricultural and other products on Ukrainian territory
Kharkiv -
-livestock: dairy cattle, poultry, pigs, fish -production of dairy products
KharkivAgricom Group wheat, oats (+ glutenfree), sunflower, corn
Zhytomyr (7000) Chernihiv (9000) Luhansk (11500 ha, pas d’avoine. 450 non irriguées)
-cereal flakes factory, Chernihiv (capacity of 12,000 tonnes of flakes/year) --> export
Zelenaya dolina (Terra Food) wheat, barley, sunflower, sugar beet, rye, corn, soybeans, canola
Agro-industrial Corporation "USPIKH" wheat, barley, corn, soybean, sunflower, rapeseed
Buchachagrohlibpro m wheat, barley, sunflower, corn
Selhozprodukt corn, wheat, sugar beet
Agropromyshlennay a Kompaniya Roskoshnaya
beef cattle, dairy cattle
-seed production -breeding: dairy cattle, beef cattle (including bulls) -production of wheat flour and other cereals -honey
-flour production -fodder production -sugar refinery -pasta production -biogas plants (2)
livestock: pigs, sheep, goats, dairy cattle
Kusto Agro wheat, corn, sunflower, soybean, rapeseed
Zhytomyr Vinnytsia Khmelnytskyi
-forage production -livestock: pigs -slaughterhouse and meat processing -B2B and B2C sales
Lviv Ternopil Khmelnytskyi Kiev Chernihiv Dnipropetrovsk Sumy Poltava -dairy cattle -10 processing plants: 4 dairy (Lviv, Chernihiv, Sumy, Dnipropetrovsk ); 6 cheese (Khmelnystkyi, Chernihiv, Poltava, Sumy (2))
-dairy cattle, 1 dairy farm Other: Roads, rails and construction; Maritime and offshore; Logistics solutions Volyn-ZernoProduct wheat, soybeans, rapeseed, sugar beet, barley, maize, peas, permanent grasses
processing of agricultural products (sunflower, animal feed, hen eggs), storage and transport services
Hmelnitsk Mlyn
Winter and spring wheat, winter rapeseed, barley, soybean, sunflower, maize, sugar beet, peas, sorghum, poppies
flour production (2 mills, Khmelnytskyï)
Cherkasy Poltava -seed production -agricultural product processing
KSG Agro
winter wheat, barley, rapeseed, spring sunflower, maize, sorghum, winter and spring peas
Prodexim cereals, sunflower
Dnipropetrovsk -pig farming -forage production -5 pellet boilers; some converted to biofuel (wood pellets) -plans to complete construction of a pellet plant (60,000 t/year)
-sunflower oil production (including organic) -arboriculture: apples, pears, grapes, peaches, cherries, raspberries, blackberries VV Agro corn, sunflower, cereal crops
Volyn Zhytomyr Vinnytsia Ternopil Ivano-Frankivsk Odesa beef cattle and pig farming
Agroteh garantiya
Avis UkrAgro corn, soybeans
Arnika organic soy, corn, sunflower, mustard, lentils, flax, millet, hemp
Agrofirma Pyatihatskaya wheat, barley, maize, rapeseed, sunflower 17,000
Sumy -dairy cattle, laying hens -farm services (harvesting)
Cherkasy Poltava -production of organic sunflower oil -forage production (soy processing)
Kirovohrad
Chongar winter cereals, sunflower 17,000
Zgoda cereals, oilseeds, vegetables 17,000
Pytidni cereals, oilseeds, industrial crops 16,500
Agro Oven wheat (10,000 t), feed wheat (20,000 t), maize (50,000 t), sunflower (15,000 t), potato (7,000 t), millet
Dnipropetrovsk
-livestock: pigs (500 head), cattle (1,000 head), poultry (2,000 head) and sheep (500 head) -Mill, oil mill, bakery and pastry shop
sheep farming
-broiler and layer hens, pigs, beef cattle -artificial insemination stations, breeding plants -compound feed plant -meat processing plant -bioenergy plant -restaurants, stores
-animal feed production -livestock: pigs, horses, aquaculture Kishchentsy winter wheat, barley, malting barley, sugar beet, corn, rapeseed, soybeans, vegetables, perennial grasses
livestock: dairy cattle (350 head), pigs (400 sows)
-harvesting services -processing and storage of agricultural products -reproductive seed processing -import-export operations -commercial, industrial, intermediation, marketing and trading activities
Vinnytsia Khmelnytskyi Ternopil storage
-grain storage -grain shipping (up to 100,000 tons per year for each of the 2 companies)
-production of dairy products: 5 production plants (15,252 tonnes of cheese; 3,295 tonnes of dairy butter; 51,982 tonnes of milk; 104,250 tonnes of fermented dairy products; 11,243 tonnes of baby food; 288,533 tonnes of milk supplies)
-Breeding: broiler hens (incubation capacity of 94 million eggs per year, and daily planting of 60 to 62 million young broiler chickens per year). -meat product processing (19,200 head/day) -animal feed production (18,000 t/month --> over 225,000 t/year) Rosukprod cereals and oilseeds
trade in cereals and oilseeds, oil production: sunflower, soybean, calabash
Kherson breeding, seed production
Zaporozhie Agro sunflower, winter wheat, peas, perennial grasses, alfalfa, corn for silage 14,400
maize, winter and spring wheat, sunflower 13,000
Donetsk -livestock: pork (14,500 tons live weight per year), poultry -meat processing -compound feed production
Livestock: pork, dairy cattle (plant, processing capacity - 300 t/day)
Poltava Kharkiv -seed production -fruit and berry production. -animal husbandry.
-seed selection -livestock: dairy cattle, pigs, ostriches Biolend cereals, oilseeds 10,000
Zhytomyr -pig farming -animal feed production (2t/h capacity) Pan Kurchak maize, wheat, barley, rapeseed, soya, sunflower 10,000
Volyn -feed mills (farm animals, birds and fish) -broiler and layer hens
Stepnaya maize, winter wheat, winter and spring barley, sunflower 10,000
Cygnet Agrocompany maize, sugar beet, winter wheat, soybean, sunflower
Olimp corn, wheat, soybeans, sunflower
Dnipropetrovsk
-seed trade (corn hybrids, winter wheat, sunflower hybrid barley, etc.) -livestock: pigs (6,000 head by 2021)
Zhytomyr Vinnytsia
breeding meat processing and trade
cereals, industrial crops - - - -
Preobrazhenskoe wheat, barley, maize, millet, sunflower, rapeseed, oats, peas, soybeans
VPK Agro vegetables
- irrigation systems
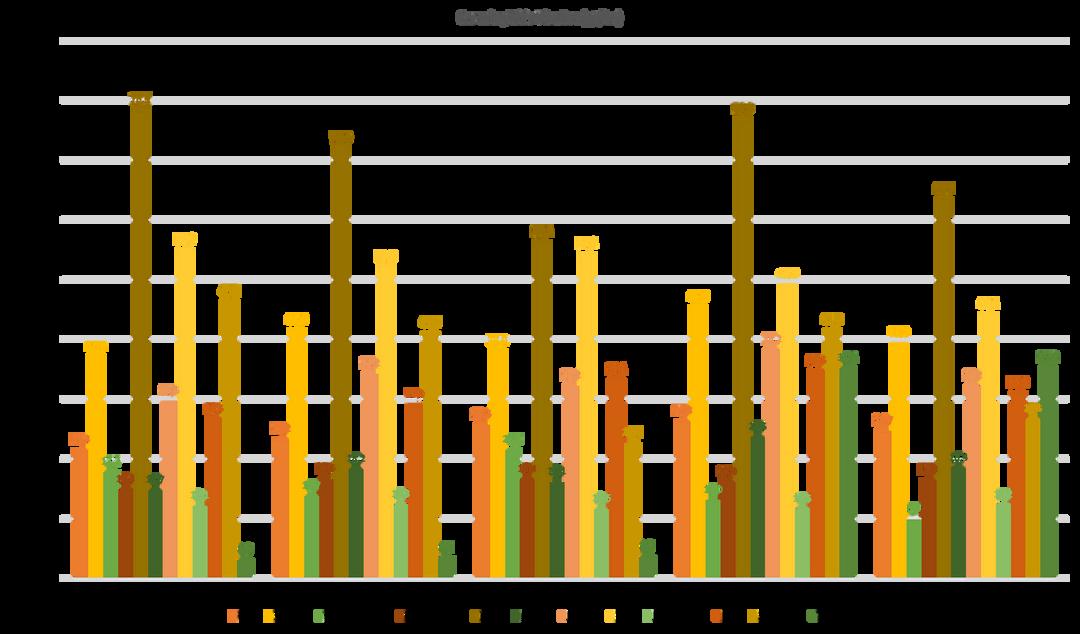
Appendix4:CerealyieldsUkraine.Source:basedonFAOStatdata.
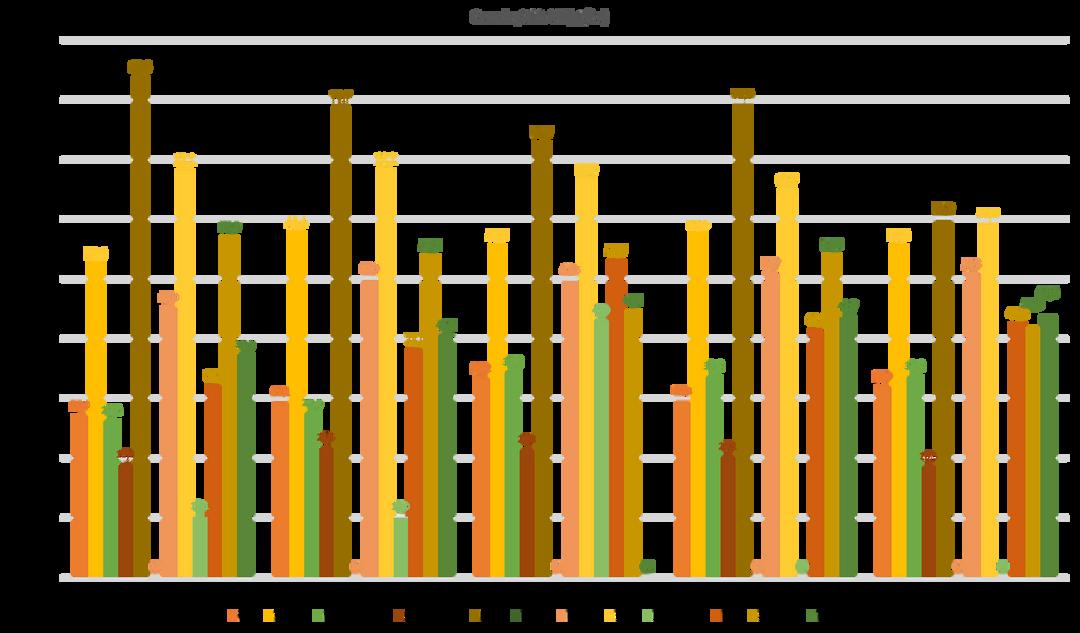
Appendix5:EuropeanUnioncerealyields.Source:basedonFAOStatdata.
Appendix6:Spain-Grainimportsandexports.Source:basedonEurostatdata.
(a)cerealimportsfromallovertheworld

Between 2019/21 and 2023, Spain increased its Ukrainian cereal imports by a factor of 2 (+4.7 thousand tonnes), and accounted for 42% of European Ukrainian cereal imports in 2023.
These import volumes correspond to net imports, since Spanish cereal exports fell over the same period.
The increase in imports can be explained by two factors: the national drought which hit the country hard in 2023, and the country's desire to benefit from tariff cuts on cereals from Ukraine. imports in 2023
0.6
23 millionsoftons millionsoftons
spain - cereals exports in 2023
36 %
ukraine's share of imports
(b)cerealexportsworldwide
(c)cerealexportstotheEU-27.
Appendix7:Hungary-Grainimportsandexports.Source:basedonEurostatdata.

Between 2019/21 and 2023, Hungary increased its Ukrainian cereal imports by a factor of 29 (+700,000 tonnes), and accounted for 4% of European Ukrainian cereal imports in 2023.
These import volumes correspond to net imports, since Hungarian cereal exports did not increase over the same period.
5.3
1.2 millionsoftons millionsoftons
(a)cerealimportsfromallovertheworld exports in 2023 imports in 2023 ukraine's share of imports
63 %
(b)cerealexportsworldwide
(c)cerealexportstotheEU-27.
Appendix8:Italy-Cerealimportsandexports.Source:basedonEurostatdata.
Between 2019/21 and 2023, Italy increased its Ukrainian cereal imports by a factor of 1.9 (+1 million tonnes), and accounted for 12% of European Ukrainian cereal imports in 2023.
These import volumes correspond to net imports, since over the same period Hungarian cereal exports did not increase.
- cereals
0.9
16.2 millionsoftons millionsoftons
(a)cerealimportsfromallovertheworld exports in 2023 imports in 2023 ukraine's share of imports
14 %
(b)cerealexportsworldwide
(c)cerealexportstotheEU-27.
Appendix 9: Netherlands - Grain imports and exports. Source: based on Eurostat data.
Between 2019/21 and 2023, the Netherlands halved its Ukrainian grain imports (- 1.5 million tonnes). The Netherlands accounted for 9% of European imports of Ukrainian cereals in 2023.
These import volumes correspond to net imports, since Hungarian cereal exports did not increase over the same period.
1.1
12.8 millionsoftons millionsoftons
(a)cerealimportsfromallovertheworld exports in 2023 imports in 2023 ukraine's share of imports
13 %
(b)cerealexportsworldwide
(c)cerealexportstotheEU-27.

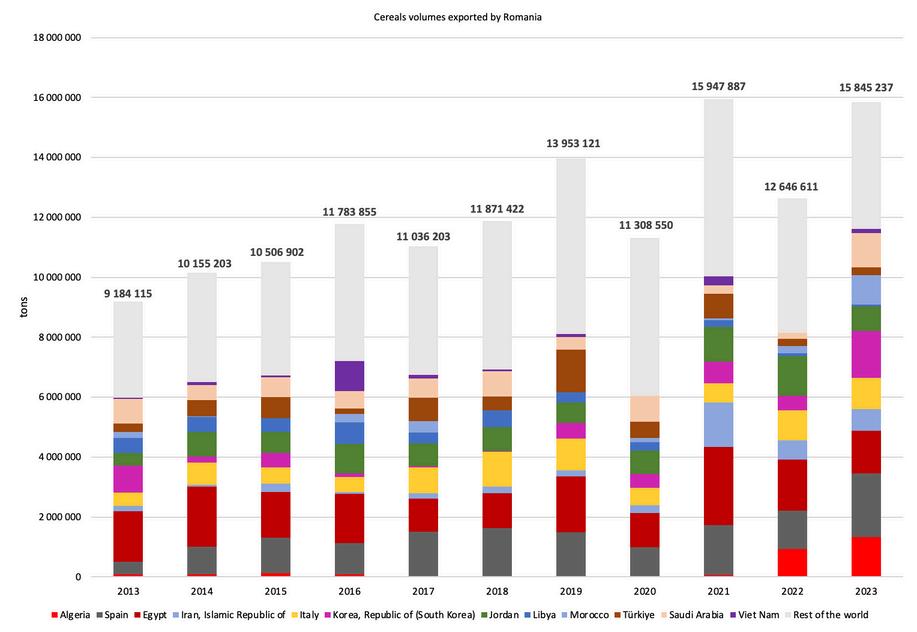
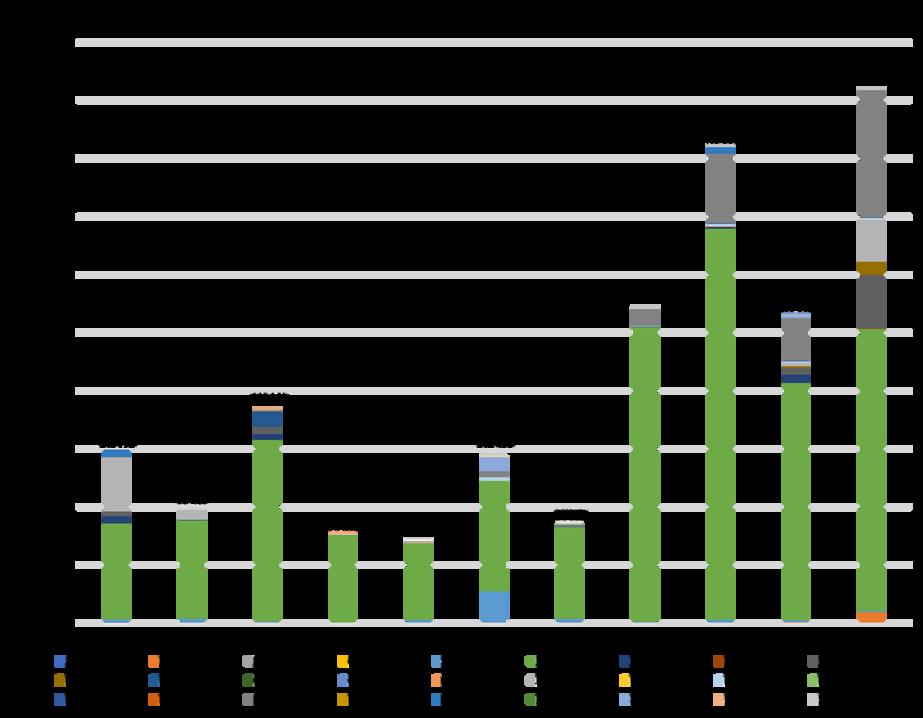
Appendix10:Romania-Cerealimportsandexports.Source:basedonEurostatdata.

EBetween 2019/21 and 2023, Romania increased its Ukrainian cereal imports by a factor of 93 (+ 844,000 tonnes), mainly at the expense of Hungarian cereal imports. Romania accounted for 4% of European Ukrainian cereal imports in 2023.
Over the same period, Romanian cereal exports increased by 15% (+2 million tonnes). It would therefore appear that all cereals imported from Ukraine have been re-exported.
(a)cerealimportsfromallovertheworld exports in 2023 imports in 2023
15.8
2.3 millionsoftons millionsoftons
37 %
ukraine's share of imports
(b)cerealexportsworldwide
(c)cerealexportstotheEU-27.

Appendix11:Portugal-Cerealimportsandexports.Source:basedonEurostatdata.
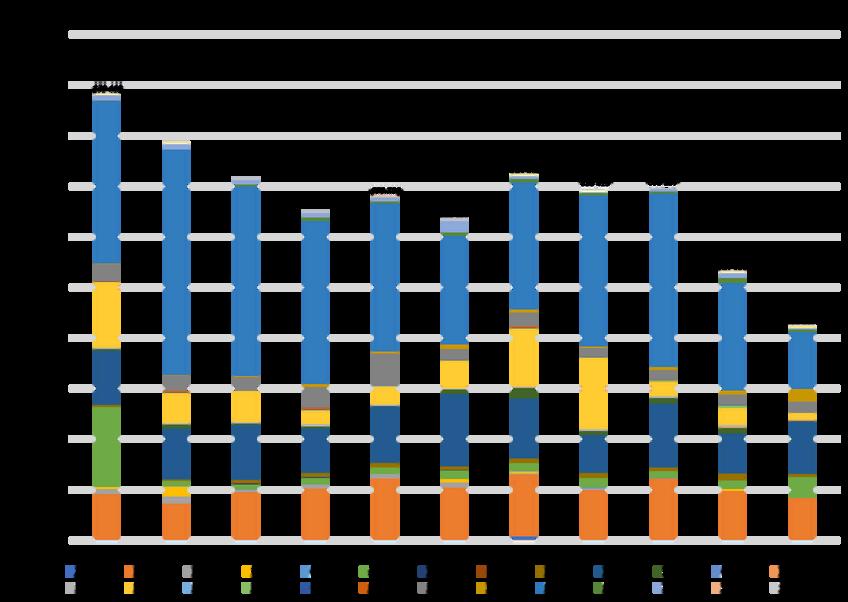
Between 2019/21 and 2023, Portugal increased its Ukrainian cereal imports by a factor of 1.16 (+ 130,800 tonnes). Portugal accounted for 5% of European Ukrainian cereal imports in 2023.
Over the same period, Portuguese cereal exports increased by a factor of 2 (+ 200,000 tonnes), mainly to Spain. It would therefore appear that all cereals imported from Ukraine have been re-exported.
441,633 4.5 millionsoftons tons
21 %
exports in 2023 imports in 2023 ukraine's share of imports
(b)cerealexportsworldwide
(c)cerealexportstotheEU-27.
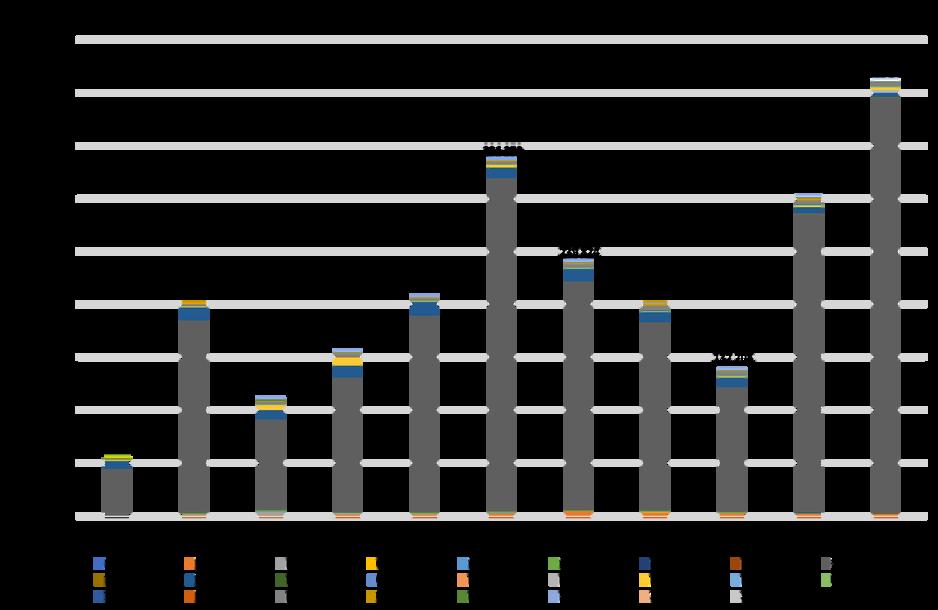
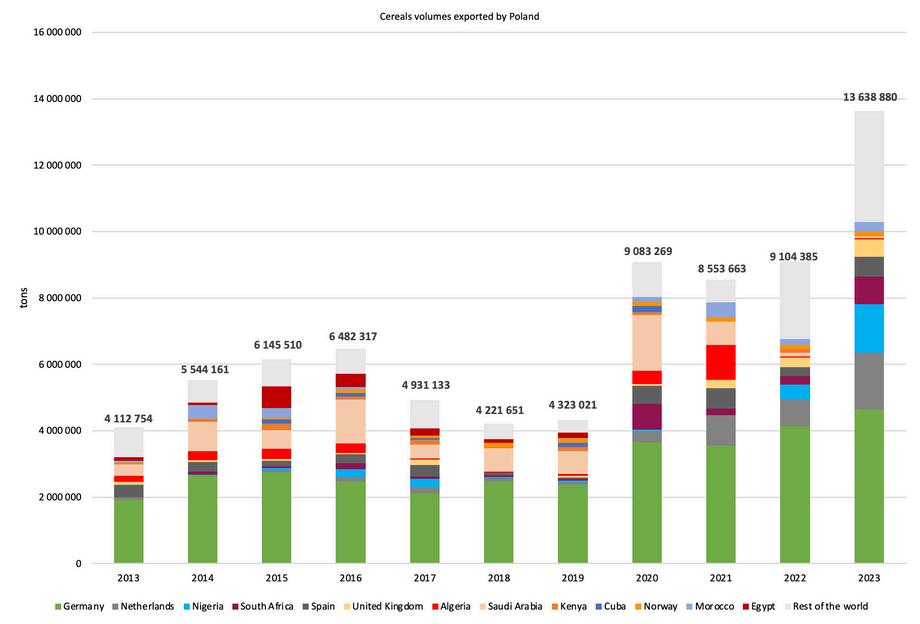
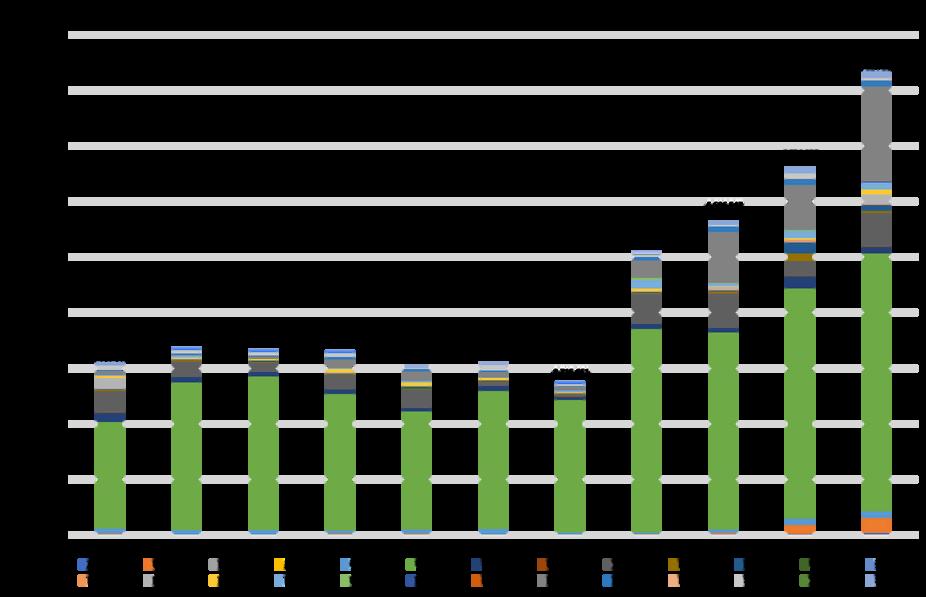
Appendix12:Poland-Grainimportsandexports.Source:basedonEurostatdata.
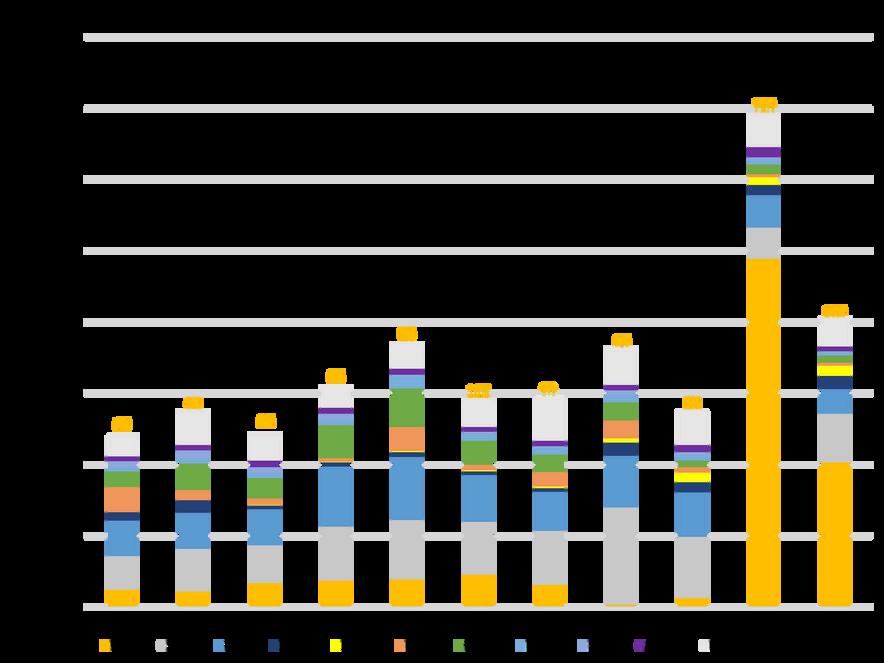
Between 2019/21 and 2023, Poland increased its Ukrainian grain imports by a factor of 13 (+ 935,000 tonnes). Poland accounted for 5% of European Ukrainian cereal imports in 2023.
Over the same period, Polish cereal exports multiplied by 1.8% (+6.3 million tonnes). It would therefore appear that all grain imported from Ukraine has been re-exported.
13.6
2.0 millionsoftons millionsoftons
50 %
exports in 2023 imports in 2023 ukraine's share of imports
(b)cerealexportsworldwide
(c)cerealexportstotheEU-27.
Appendix13:Slovenia-Cerealimportsandexports.Source:basedonEurostatdata.

Between 2019/21 and 2023, Slovenia increased its Ukrainian grain imports by a factor of 76 (+955,000 tonnes). Slovenia accounted for 5% of European Ukrainian cereal imports in 2023.
Over the same period, Slovenian cereal exports increased by a factor of 1.5% (+ 541,000 tonnes). It would therefore appear that some of the cereals imported from Ukraine were consumed or stored on Slovenian territory.
1.8 millionsoftons
(a)cerealimportsfromallovertheworld exports in 2023 imports in 2023
1.5
millionsoftons
53 %
ukraine's share of imports
(b)cerealexportsworldwide
(c)cerealexportstotheEU-27.
Appendix14:WheatproductioninUkraineandtheEuropeanUnion.Source:basedon FAOStat(revisedDecember2023)andUSDAdata.
*2023 and 2024 refer to USDA data for July 2023/June 2024 and July 2024/June 2025 (forecast).
Appendix15:HarvestedwheatareainUkraineandEuropeanUnion.Source:basedon FAOStat(revisedDecember2023)andUSDAdata.
*2023 and 2024 refer to USDA data for July 2023/June 2024 and July 2024/June 2025 (forecast).
Appendix16:EvolutionofUkrainianandEuropeanwheatyields.Source:basedon FAOStat(December2023revision)andUSDA(2023and2024)data.

Appendix18:Italy-Wheatimportsandexports.Source:basedonEurostatdata.
(a)wheatimportsfromallovertheworld
(c)wheatexportstotheEU-27
(c)wheatexportstotheEU-27
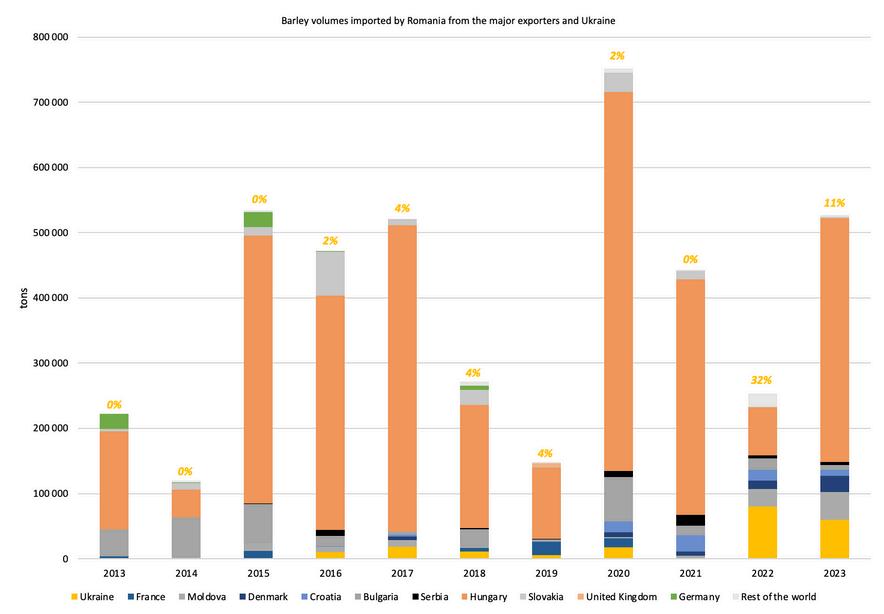
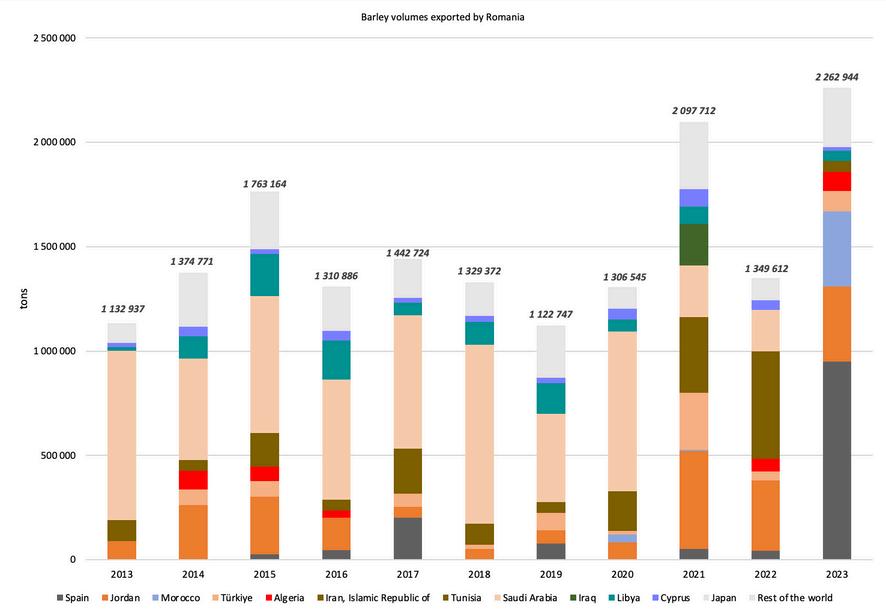
Appendix 20: Romania - Wheat imports and exports. Source : based on Eurostat data.
(a)wheatimportsfromallovertheworld
(b)cerealexportsworldwide
(c)wheatexportstotheEU-27
Appendix 21: Corn production in Ukraine and European Union. Source: based on FAOStatdata(revisedDecember2023)andUSDA.
*2023 and 2024 refer to USDA data for Oct 2023/Sept 2024 and July Oct/Sept 2025 (forecast)
Appendix 22: Harvested area, corn, Ukraine and European Union. Source: based on FAOStat (revised December 2023) and USDA data.
*2023 and 2024 refer to USDA data for Oct 2023/Sept 2024 and July Oct/Sept 2025 (forecast).
Appendix23:EvolutionofUkrainianandEuropeancornyields.Source:basedon FAOStat(December2023revision)andUSDA(2023and2024)data.
Appendix25:Italy-Cornimportsandexports.Source:basedonEurostatdata.

(b)cornexportsworldwide
(c)cornexportstoEU-27
Appendix 26: Netherlands - Corn imports and exports. Source: based on
(b)cornexportsworldwide
(c)cornexportstoEU-27
(b)cornexportsworldwide
(c)cornexportstoEU-27

(b)cornexportsworldwide
(c)cornexportstoEU-27
Appendix 29: Barley production in Ukraine and European Union. Source: based on FAOStat(revisedDecember2023)andUSDAdata.
*2023 and 2024 refer to USDA data for July 2023/June 2024 and July 2024/June 2025 (forecast)
Appendix30:Areaharvested,barley,UkraineandEuropeanUnion.Source:basedon FAOStat(revisedDecember2023)andUSDAdata.
*2023 and 2024 refer to USDA data for July 2023/June 2024 and July 2024/June 2025 (forecast)
Appendix31:EvolutionofUkrainianandEuropeanbarleyyields.Source:basedon FAOStat(December2023revision)andUSDA(2023and2024)data.
(b)barleyexportsworldwide
(c)barleyexportstotheEU-27.
(b)barleyexportsworldwide
(c)barleyexportstotheEU-27.

(b)barleyexportsworldwide
(c)barleyexportstotheEU-27.