Australian national suicide data 2022

(Australian Bureau of Statistics, Causes of Death, 2022)
Released 27 September 2023

(Australian Bureau of Statistics, Causes of Death, 2022)
Released 27 September 2023
1. About this summary
2. Key terms
3. General summary
4. Age standardised suicide rates (1992-2022)
5. Suicide rates by gender
6. Aboriginal and Torres Strait Islander people
7. State and territory summary
8. Suicide rates by age groups
9. Risk factors
10. Risk factors by gender and age groups
11. Suicide in the COVID-19 pandemic
12. Suicide by country of birth
• This summary was prepared by Everymind using the Australian Bureau of Statistics (ABS) Causes of Death (Catalogue No. 3303.0) data, released 27 September 2023. The data summary was used to support the Everymind team in the Mindframe briefing for media and sector and further dissemination of the data through Life in Mind.
• When exploring suicide data, it is important to remember that behind the numbers are individuals, families and communities impacted by suicide in Australia. The reasons individuals take their own life are often complex; there is no single reason why a person attempts or dies by suicide.
• Media and communications professionals accessing this summary are reminded to be responsible and accurate when communicating about suicide, as there is potential risk to people in the community who may be vulnerable to suicide. Context is therefore important. Resources to support reporting and professional communication are available at mindframe.org.au/suicide
• A full summary of data can be found on the Life in Mind portal at lifeinmind.org.au/suicide-data/australian-bureauof-statistics/abs-causes-of-death-data
ABS advises that care should be taken in comparing 2022 data with:
- Previous years, as some data has been subject to quality improvement processes
- Pre-2006 data, as this data was not subject to the revision process.
• From 2022, Causes of Death data is presented by the year the death was registered. This represents a change from previous years where data was presented by the reference year. This change has been applied from 2013 onwards.
• In 2022, the process for identifying Aboriginal and Torres Strait Islander deaths in NSW has improved. Comparisons with previous years should be made with caution.
• Due to the relatively small population size in some states and territories, even one or two deaths can have a significant impact on state-specific age-standardised suicide rates. Therefore, comparisons across Australia must be done with caution.
This release includes 2022 preliminary data, 2021 preliminary revised data and 2020 revised data. Data for 2013 to 2019 are considered final. Final data for 2020, revised data for 2021, and preliminary revised data for 2022 will be released in early 2024.
Throughout this summary, rates are used to describe patterns and trends in the data. Alongside the number of suicide deaths, they help us to better understand and compare suicidal behaviours in different groups and over time.
Crude rates
A crude rate is the number of deaths divided by the population times 100,000.
Crude rates do not account for population differences, such as proportions of people of different ages (‘age structures’), when comparing different groups.
Age-specific rates are used to measure how many deaths occurred in a specific age group. This is calculated by dividing the number of suicide deaths in a particular age group by the total number of people in the specific age group.
Age-standardised rates use a formula to calculate a rate that reflects a ‘standard’ age structure of the population. This is useful to be able to make fairer comparisons between groups or populations over time.
It is best to use age-standardised rates when comparing populations with different age groups (e.g. male and females) if possible.
In 2022, there were 3,249 deaths by suicide with an age-standardised rate of 12.3 per 100,000.
In 2021, there were 3,166 deaths by suicide with an age-standardised rate of 12.1 per 100,000.
In 2020, there were 3,196 deaths by suicide with an age-standardised rate of 12.3 per 100,000.
This equates to an average of 8.9* deaths by suicide in Australia each day.
There were 2,455 male deaths at an age-standardised rate of 18.8 per 100,000.
There were 794 female deaths at an age-standardised rate of 5.9 per 100,000.
This equates to an average of 8.7* deaths by suicide in Australia each day.
There were 2,375 male deaths at an age-standardised rate of 18.3 per 100,000.
There were 791 female deaths at an age-standardised rate of 6.1 per 100,000.
This equates to an average of 8.8* deaths by suicide in Australia each day.
There were 2,420 male deaths at an age-standardised rate of 18.8 per 100,000.
There were 776 female deaths at an age-standardised rate of 5.9 per 100,000.
• In 2022, there were 3,249 deaths compared to 3,166 deaths in 2021.
• The age standardised rate increased slightly from 2021 to 2022 (12.3 per 100,000 in 2022, compared to 12.1 per 100,000 in 2021).
• The suicide rate for males increased by 2.6% from 2021.
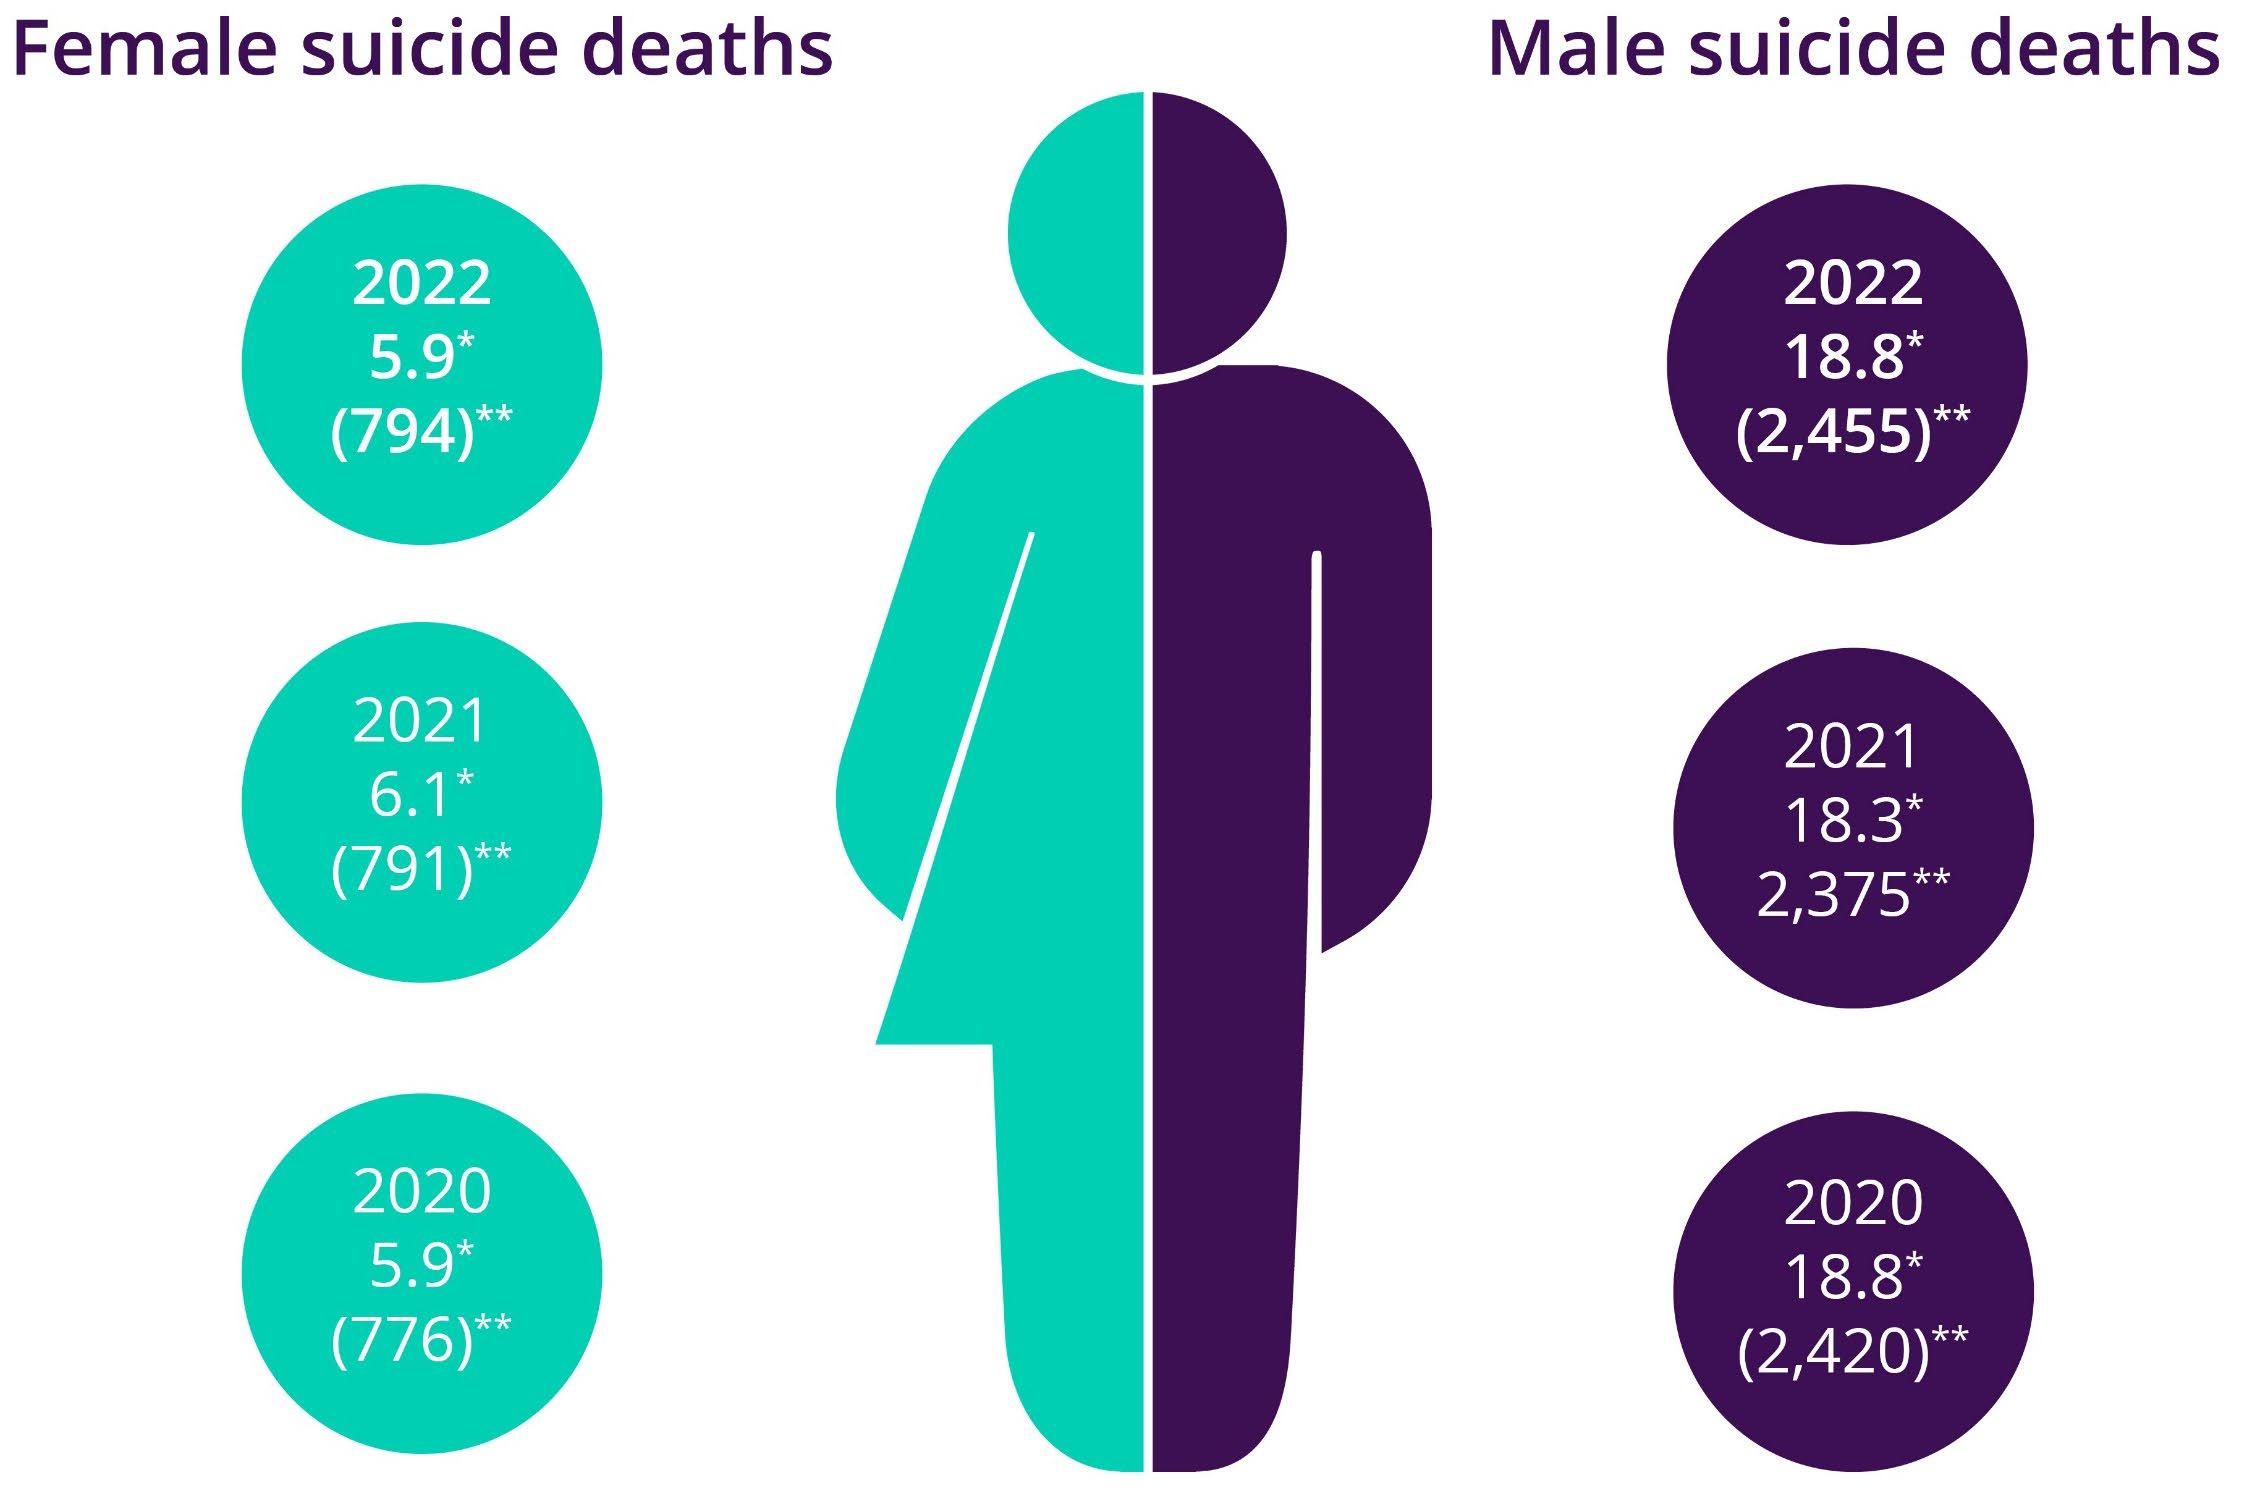
• The suicide rate for females decreased by 2.3% from 2021.
• Young and middle-aged people were more likely to die by suicide than those in older age cohorts.
* Age-standardised rate per 100,000. ** Number of deaths. 2020 data have been subject to revision; 2021 data are preliminary revised; and 2022 data are preliminary.
Males 2022
Males 2021
Females 2022
Females 2021
• Males aged over 85 years had the highest age-specific suicide rate and accounted for 2.9% of suicides of males.
• Males aged between 45-49 years had the highest age-specific suicide rate of those aged under 85 years, accounting for the largest proportion of deaths due to suicide (10.7%).
• Males aged between 45-49 years had the largest increase in their age-specific suicide rate (up 9.4 deaths per 100,000).
• Males aged between 80-84 years had the largest decrease in their age-specific suicide rate (down 9.4 deaths per 100,000).
Age-specific rate per 100,000.
• In 2022, females aged over 85 years had the highest age-specific suicide rate for the first time since the beginning of the ABS mortality data time series (in 1968) with a rate of 10.6 per 100,000.
• Females aged between 45-49 years had the highest age-specific suicide rate of females aged under 85 years (8.8 deaths per 100,000).
• Between 2021 and 2022, females aged between 70-74 years had the largest increase in their age-specific suicide rate (up 1.7 deaths per 100,000).
Age-specific rate per 100,000. 2021 data are
*2013 – 2019 data are final. 2020 data have been subject to revision; 2021 data are preliminary revised; and 2022 data are preliminary.
• In 2022, 239 Aboriginal and Torres Strait Islander people died by suicide.
• The median age of death was 33.4 years.
• Using data from New South Wales, Queensland, Western Australia, South Australia and Northern Territory, the age-standardised suicide rate for Aboriginal and Torres Strait Islander people was 29.9 per 100,000. This is the highest suicide rate in the 10-year time series.
Note: Age-standardised suicide rates are compiled from the jurisdictions of NSW, QLD, WA, SA and NT.
• Between 2021 and 2022, all states except Queensland, the Australian Capital Territory and Western Australia had an increase in the agestandardised suicide rate. New South Wales remained the same.
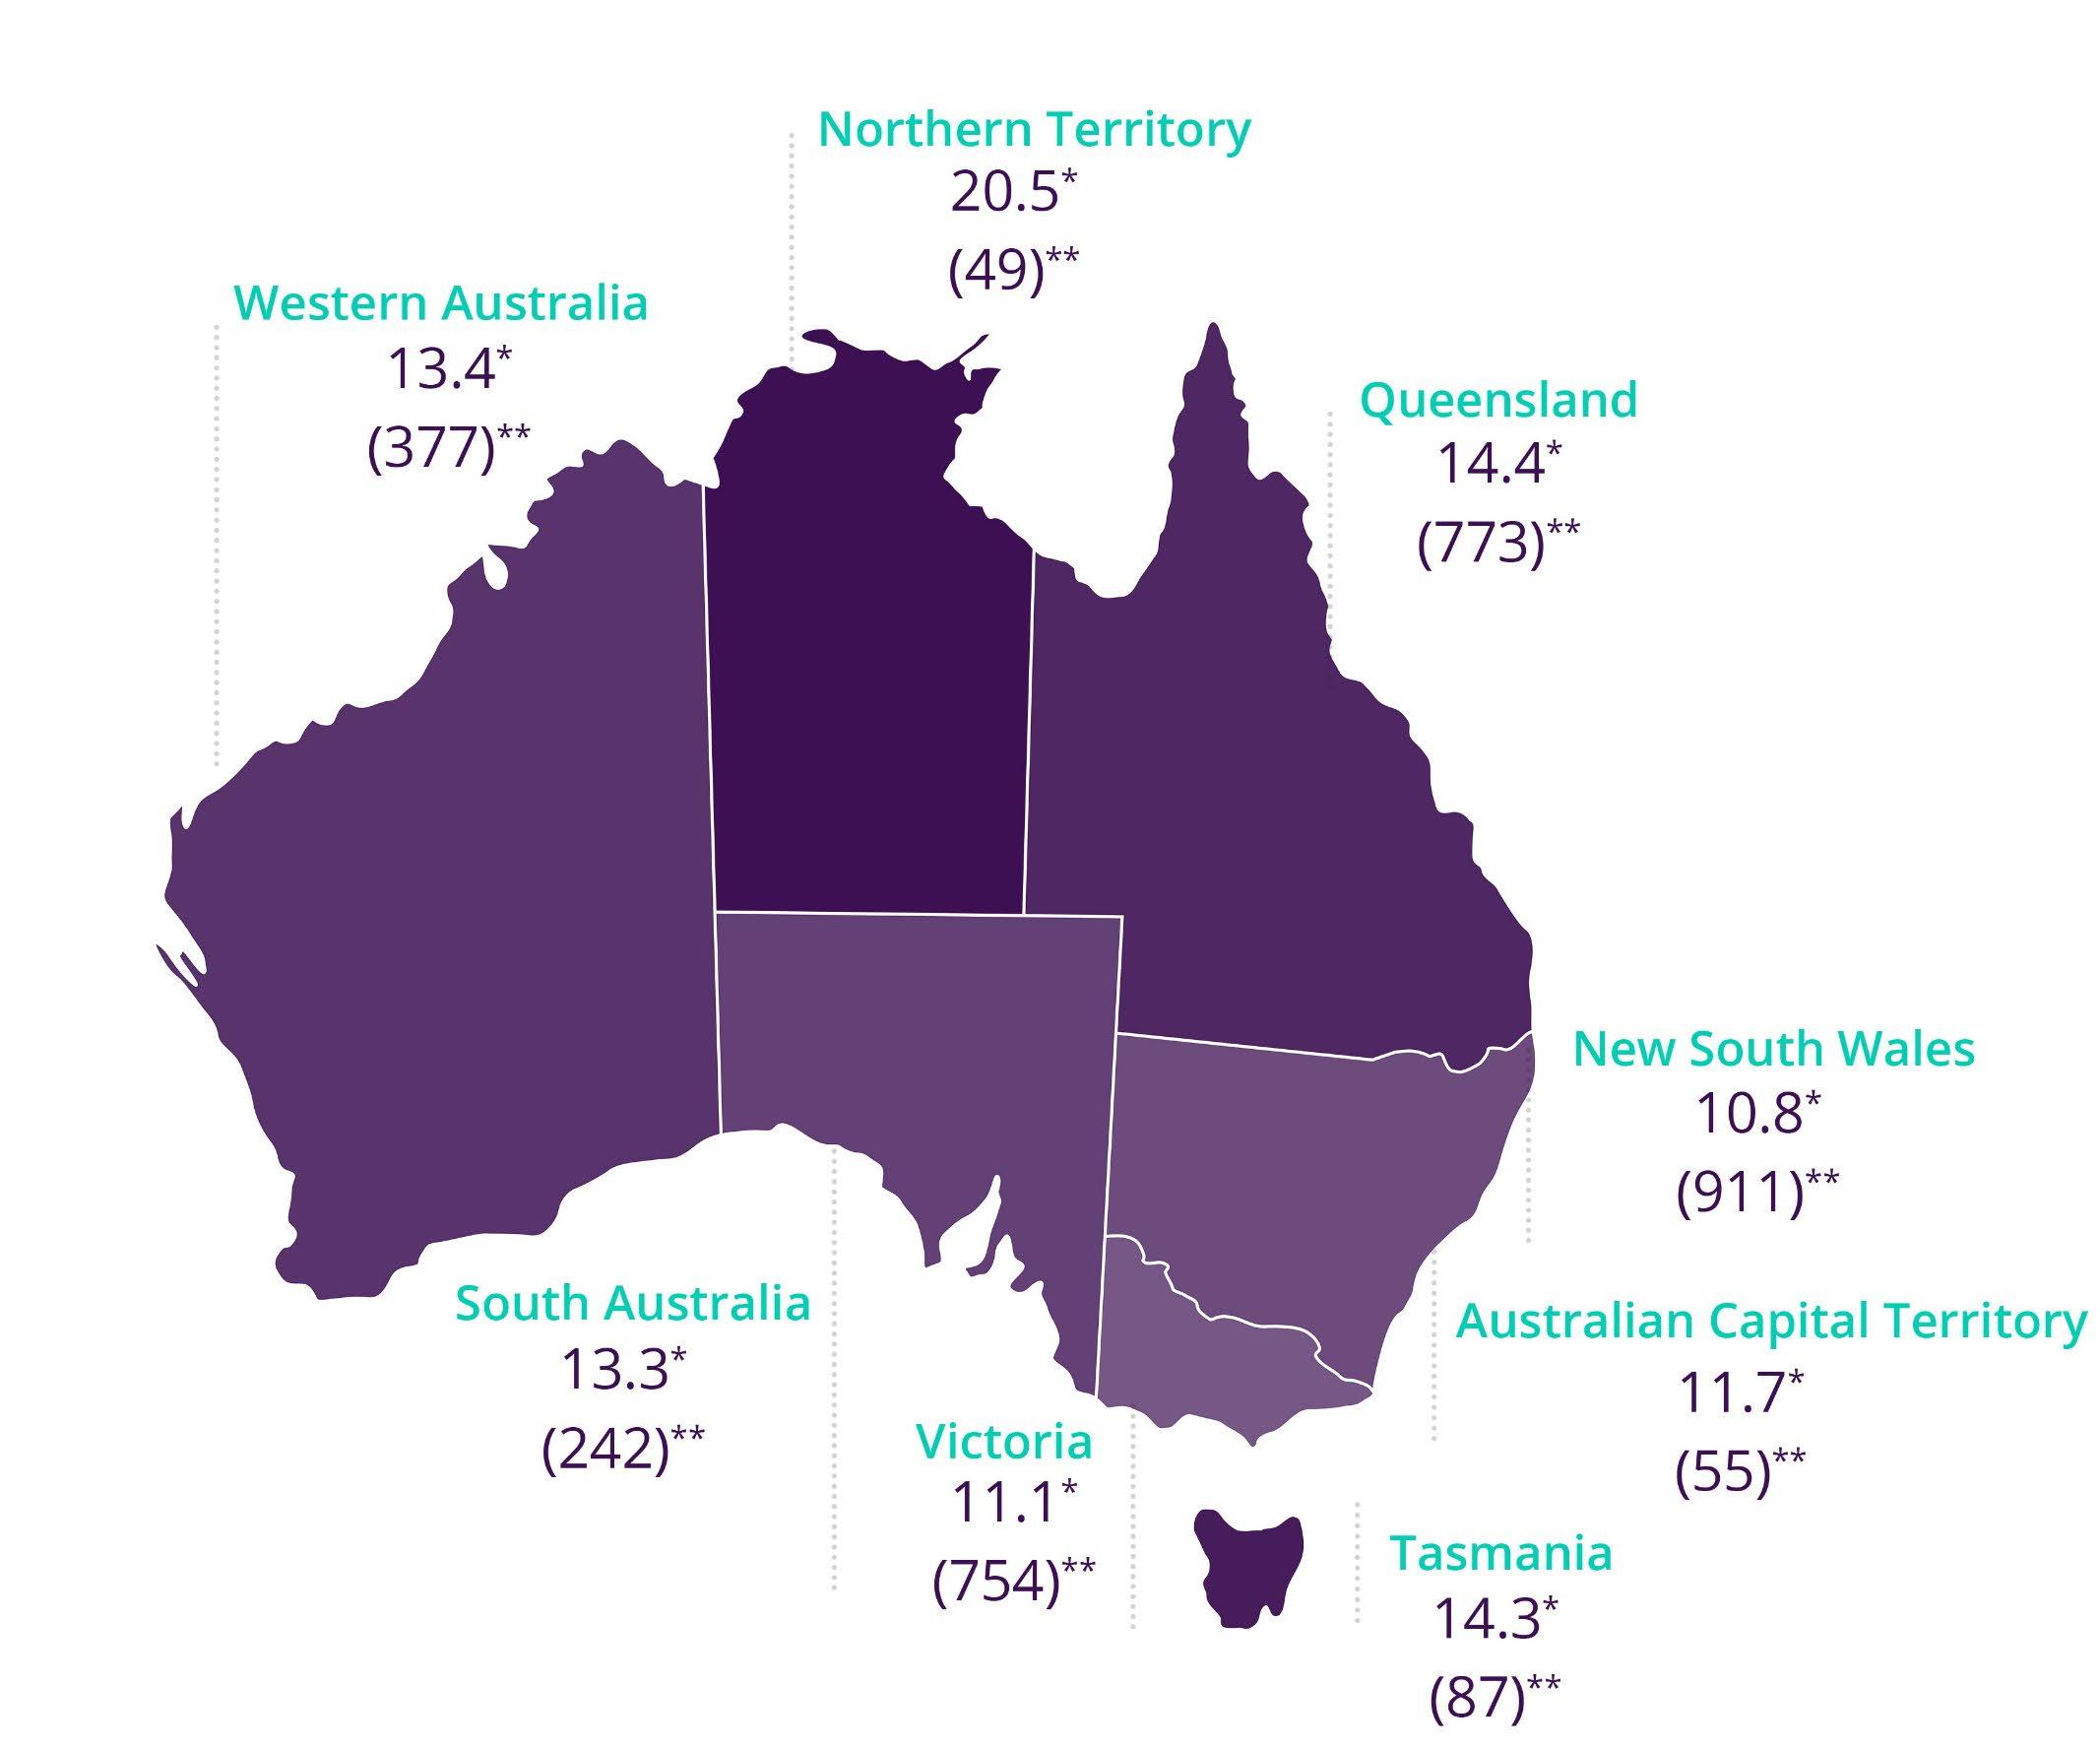
• Three-quarters of people who died by suicide had a usual residence of New South Wales (911), Queensland (773) or Victoria (754).
• The Northern Territory had the lowest number of people who died by suicide (49) but recorded the highest rate of suicide (20.5 per 100,000 people).
*Age-standardised rate per 100,000. **Number of deaths.
*2018 and 2019 data are final and no longer revised; 2020 data have been subject to revision; 2021 data are preliminary revised; and 2022 data are preliminary
• Suicide among children (aged 0-14) is an extremely sensitive issue and rare occurrence, with considerably fewer deaths than any other age group.
• There were 13 deaths by suicide among youth aged 0-14 years with an age-specific rate of 0.3 per 100,000.
• There were 8 deaths among male youth in this age group at an age-specific rate of 0.3 per 100,000.
• There were 5 deaths among female youth in this age group at an age-specific rate of 0.2 per 100,000.
2013 – 2019 data are final. 2020 data have been subject to revision; 2021 data are preliminary revised; and 2022 data are preliminary.
Note: Dotted line represents overall trend.
2013 – 2019 data are final. 2020 data have been subject to revision; 2021 data are preliminary revised; and 2022 data are preliminary.
2013
2019 data are final. 2020 data have been subject to revision; 2021 data are preliminary revised; and 2022 data are preliminary.
2013 – 2019 data are final. 2020 data have been subject to revision; 2021 data are preliminary revised; and 2022 data are preliminary.
– 2019 data are final. 2020 data have been subject to revision; 2021 data are preliminary revised; and 2022 data are preliminary.
– 2019 data are final. 2020 data have been subject to revision; 2021 data are preliminary revised; and 2022 data are preliminary.
2013 – 2019 data are final. 2020 data have been subject to revision; 2021 data are preliminary revised; and 2022 data are preliminary.
2013 – 2019 data are final. 2020 data have been subject to revision; 2021 data are preliminary revised; and 2022 data are preliminary.
Female 2008 data not reportable at time of finalisation.
2013 – 2019 data are final. 2020 data have been subject to revision; 2021 data are preliminary revised; and 2022 data are preliminary.
Five year trend (Male and Female combined)
80 – 84 year olds
Female 2008 data not reportable at time of finalisation. 2013 – 2019 data are final. 2020 data have been subject to revision; 2021 data are preliminary revised; and 2022 data are preliminary.
• Factors associated with a death by suicide could include mental health conditions, chronic diseases or psychosocial risk factors. Since 2020, this has also included issues related to the COVID-19 pandemic.
• It is important to note that no one single factor causes a person to die by suicide. Understanding risk factors provides insight into the complex interaction between biological, psychological and psychosocial factors, which have contributed to these deaths.
• The capture of information on associated causes of death is reliant on the documentation available for any given death. The associated factors presented here reflect information contained within reports available on the National Coronial Information System (NCIS) and do not necessarily reflect all factors associated with all suicide deaths.
• It is important to recognise that the presence of one or more risk factors in a person’s life does not indicate the presence of suicidal behaviour. This context is important to avoid normalising suicide for those with a similar risk factor.
• In 2022, 85.8% of people who died by suicide had at least one risk factor reported, with an average of 3 to 4 factors mentioned.
• Mood disorders (including depression) were the most common risk factor for both males (34.9%) and females (43.3%), and across all age groups except for those 85 years and older.
Top five risk factors across all ages in 2022:
• Mood disorders, including depression (36.9%)
• Suicidal ideation (thoughts) (25.7%)
• Problems in spousal relationships circumstances (25.1%)
• Personal history of self-harm (21.5%)
• Anxiety and stress related disorders (17.5%).
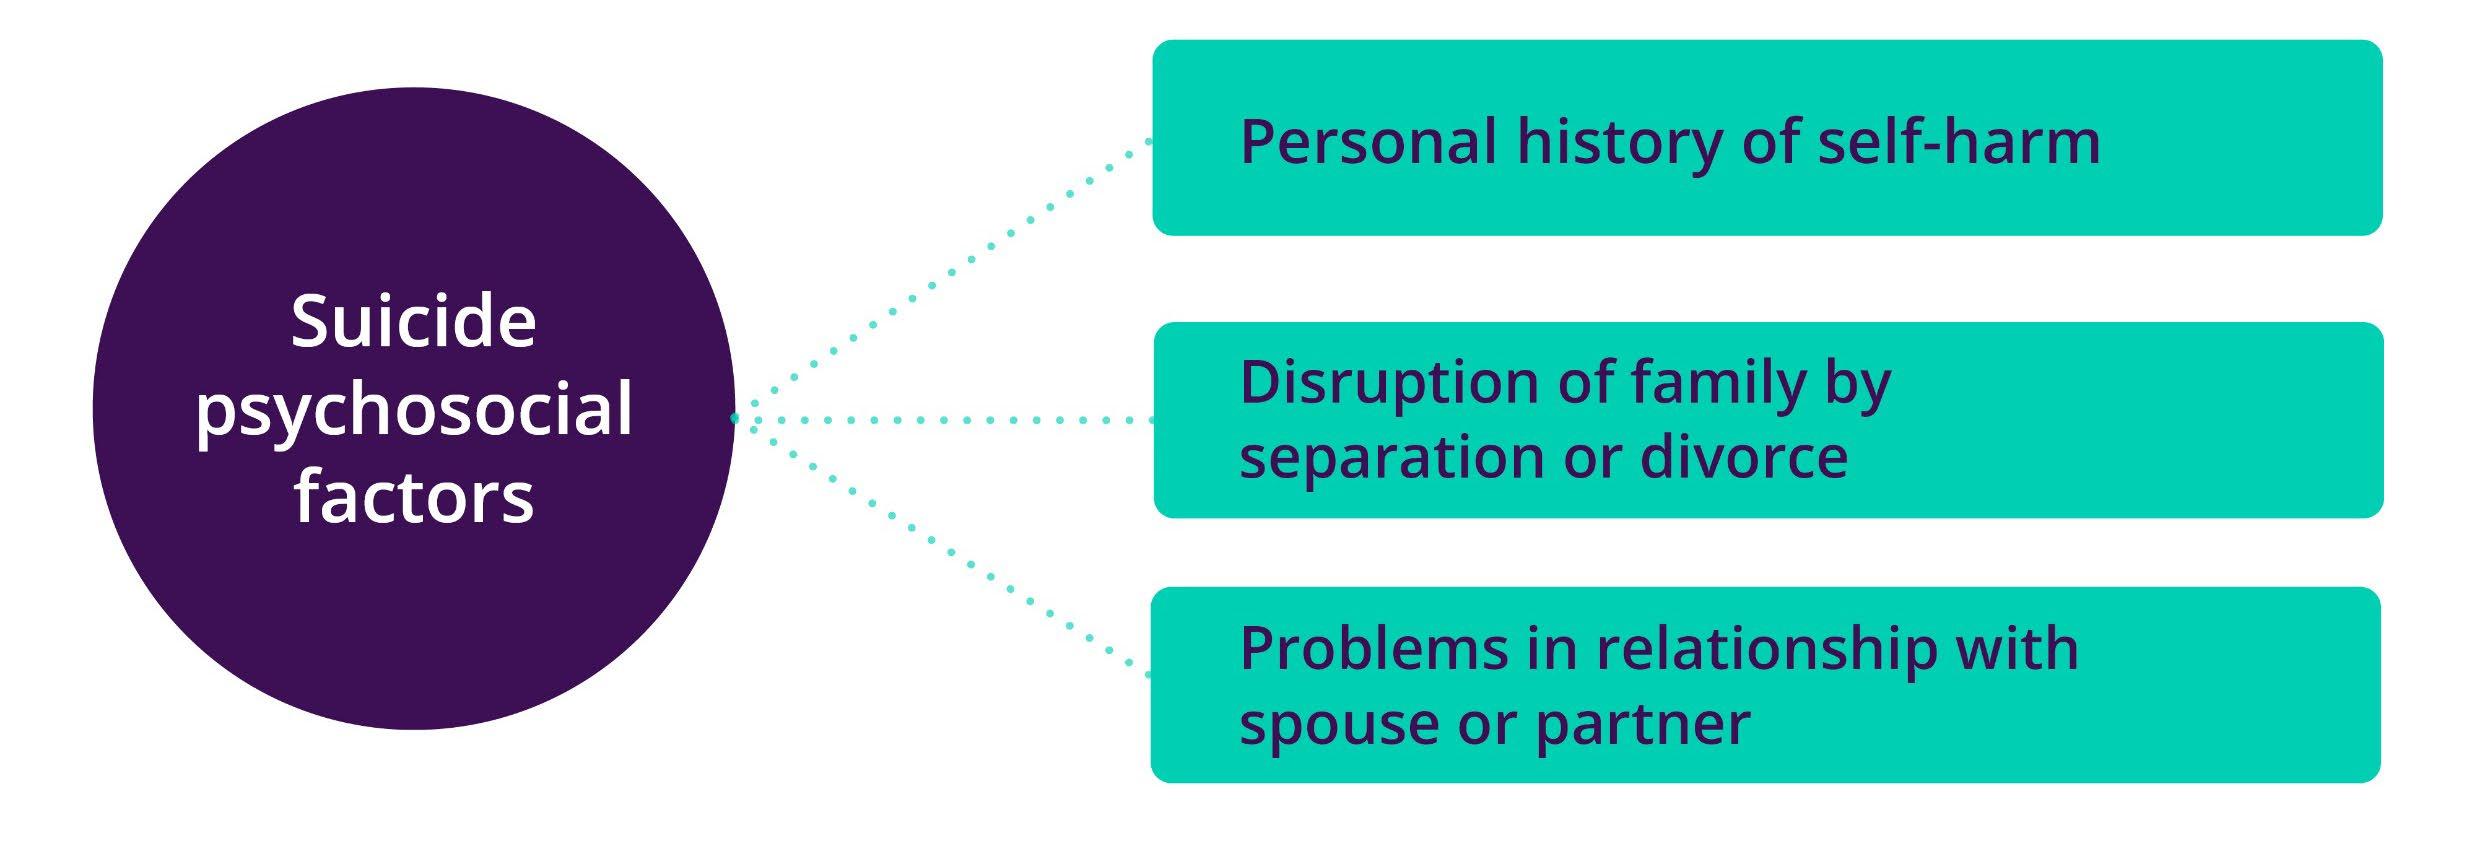
• Psychosocial risk factors are social processes and social structures that can interact with a person’s thoughts, behaviour or health.
• In 2022, 68.3% of suicide deaths (67.4% for males and 71.3% for females) in Australia were found to have at least one psychosocial risk factor.
• Psychosocial risk factors associated with suicide were largely age dependent and differed throughout the lifespan.
*Refers to proportion of suicides with one or more associated psychosocial factors.
Top three psychosocial factors associated with suicide for those aged 5-24 years, 2022
*Refers to proportion of suicides with one or more associated psychosocial factors.
Top three psychosocial factors associated with suicide for those aged 25-34 years, 2022
*Refers to proportion of suicides with one or more associated psychosocial factors.
Top three psychosocial factors associated with suicide for those aged 35-44 years, 2022
*Refers to proportion of suicides with one or more associated psychosocial factors.
Top three psychosocial factors associated with suicide for those aged 45-54 years, 2022
*Refers to proportion of suicides with one or more associated psychosocial factors.
Top three psychosocial factors associated with suicide for those aged 55-64 years, 2022
*Refers to proportion of suicides with one or more associated psychosocial factors.
Top three psychosocial factors associated with suicide for those aged 65 years and over, 2022
• A number of people who died by suicide in 2022 had issues relating to the COVID-19 pandemic mentioned in either a police, pathology or coronial finding report. This information was collected in the National Coronial Information System (NCIS).
• Issues relating to the COVID-19 pandemic included job loss, lack of financial security, family and relationship pressures and not feeling comfortable with accessing health care.
• Three additional ICD-10 codes are used by the ABS to capture different scenarios where the COVID-19 pandemic was stated to be a risk factor for an individual:
- F41.8 Other specified anxiety disorder (pandemic related anxiety and stress)
- Z29.0 Isolation (individual was in isolation or quarantine [hotel or home])
- Z29.9 prophylactic measure, unspecified (measures put in place through health directives, including closure of business, stay at home measures).
In 2022, there were 84 people (2.6% of all suicide deaths) who died by suicide with the COVID-19 pandemic mentioned in either a police, pathology or coronial finding report.
For people with issues relating to the COVID-19 pandemic, it did not appear as an isolated risk factor. They had an average of 6.5 risk factors mentioned including 3.5 psychosocial risk factors.
For the 84 people who died by suicide with issues relating to COVID-19 as a risk factor:
• 47.6% also had problems related to employment or unemployment
• 46.4% also had a mood disorder (including depression)
• 35.7% also experienced suicidal ideation (thoughts)
• 27.4% also had anxiety and stress related disorders
• 25.0% also had problems in spousal relationships
• 25.0% also had chronic alcohol use disorders
• 21.4% also had chronic psychoactive substance use disorders.
• People from culturally and linguistically diverse backgrounds may have unique experiences in relation to mental health and suicide, including cultural and family views and how health services are accessed.
• Death registrations do not directly collect information on whether a person was part of a multicultural community.
• Data items from the death registration which can provide some indication of cultural and linguistic diversity are country of birth and years of residence in Australia.
• While these two variables do not provide complete information on suicide for people of culturally and linguistically diverse backgrounds, they do provide some additional insights into suicide in Australia.
For the five-year period 2018 to 2022:
• Those who were born in Australia had an age-standardised rate of 14.7 deaths per 100,000 people.
• Those who were born overseas had an age-standardised rate of 8.2 deaths per 100,000 people.
Hong Kong (SAR of China)
China (excludes SARs and Taiwan)
Age-standardised suicide rate (per 100,000)
Country of birth uses the Standard Australian Classification of Countries (SACC).
This summary is based on data derived from the Australian Bureau of Statistics’ Causes of Death release on Intentional self-harm.
abs.gov.au/statistics/health/causes-death
This data will also form part of the Australian Institute of Health and Welfare’s Suicide and Self -harm Monitoring System and should be taken in context with other data sources.
aihw.gov.au/suicide-self-harm-monitoring
Life in Mind is a knowledge exchange portal providing translated evidence, policy, data and resources in suicide prevention, and is host of the National Communications Charter.
Life in Mind connects suicide prevention and related sectors to the evidence, information and resources they need, and communities to help-seeking information, with the aim to promote best practice in suicide prevention and support the sector and the community to respond to and communicate about suicide and its impacts.
lifeinmind.org.au