Australian national suicide data 2021


• This summary was prepared by Everymind using the Australian Bureau of Statistics (ABS) Causes of Death (Catalogue No. 3303.0) data, released 19 October 2022. The data summary was used to support the Mindframe team in briefing the media and sector and further dissemination of the data through Life in Mind.
• When exploring suicide data, it is important to remember that behind the numbers are individuals, families and communities impacted by suicide in Australia. The reasons individuals take their own life are often complex; there is no single reason why a person attempts or dies by suicide.
• Media and communications professionals accessing this summary are reminded to be responsible and accurate when communicating about suicide, as there is potential risk to people in the community who may be vulnerable to suicide. Context is therefore important. Resources to support reporting and professional communication are available at mindframe.org.au/suicide
• A full summary of data can be found on the Life in Mind website at lifeinmind.org.au/about-suicide/suicidedata/suicide-facts-and-stats
• ABS advises that care should be taken in comparing 2021 data with: - Previous years, as some data has been subject to quality improvement processes; and - Pre-2006 data, as this data was not subject to the revision process.
• Due to the relatively small population size in some states and territories, even one or two deaths can have a significant impact on state-specific age-standardised suicide rates. Therefore, comparisons across Australia must be done with caution.
• This summary represents suicide rates and trends in the 2021 (preliminary) data, trends by age group over time and state variations.
• This release includes 2020 and 2021 preliminary data, 2019 first-revision data and 2012 to 2018 final data. The second and final revision for 2019 data and the first revision for 2020 data will be released in 2023.
• Following a reconciliation exercise between the ABS and the Victorian Registry of Births, Deaths and Marriages (RBDM), 72 additional suicides from 2013 to 2016 were identified and the data updated.
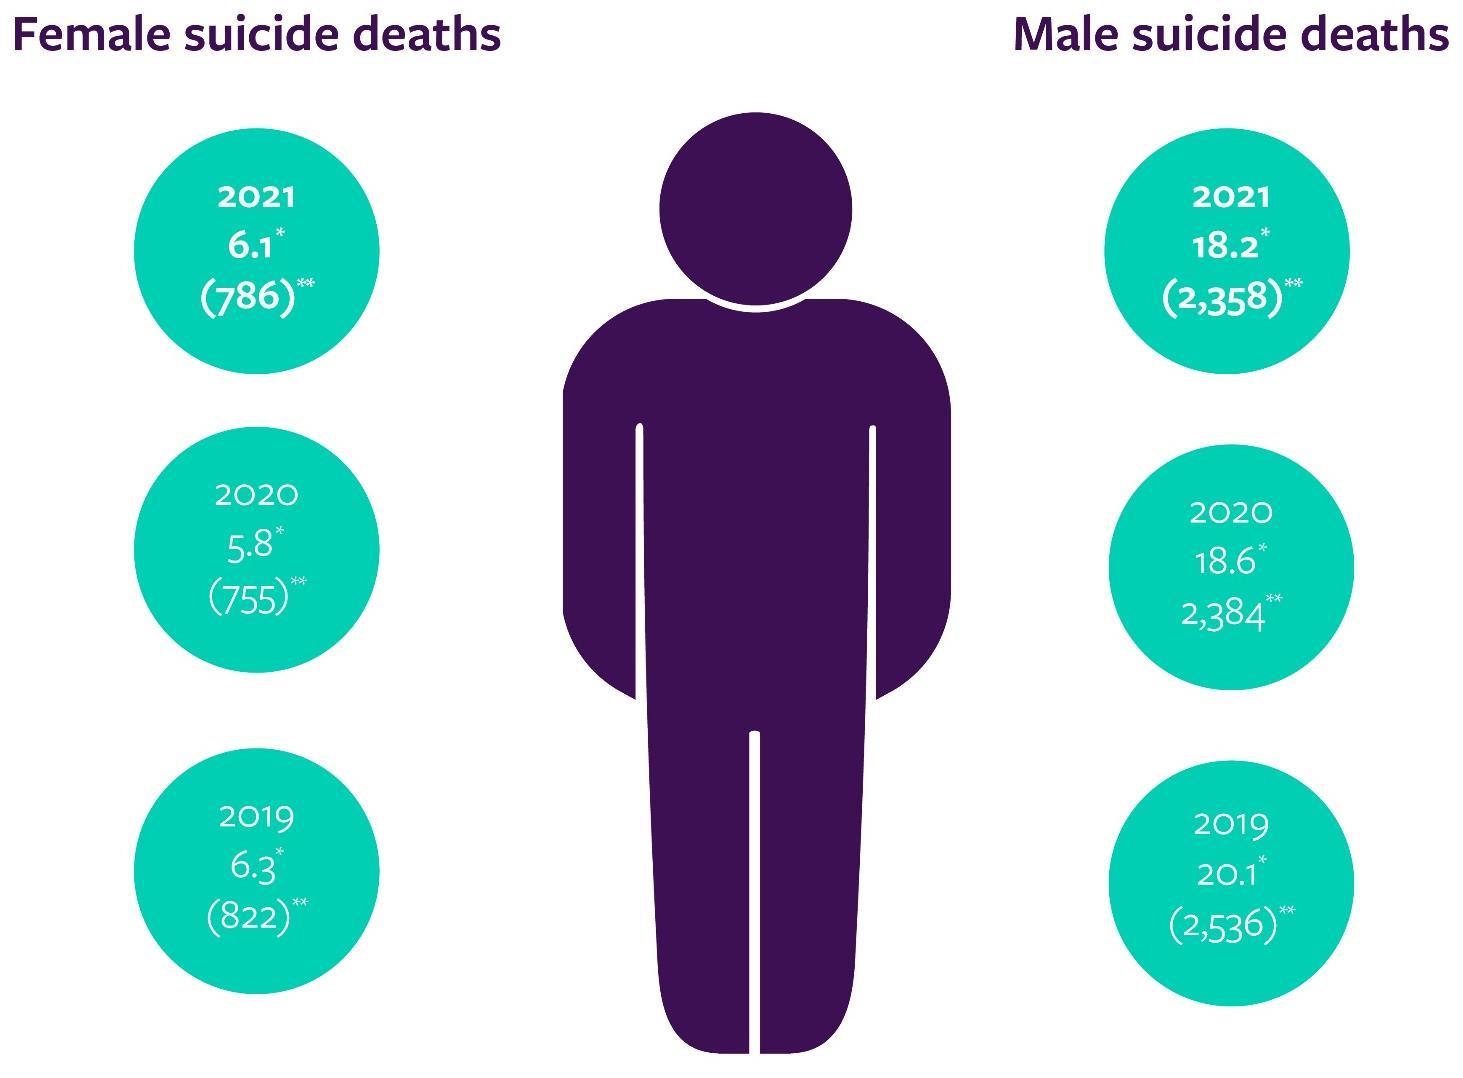
In 2021, there were 3,144 deaths by suicide with an age-standardised rate of 12.0 per 100,000. This equates to an average of 8.6* deaths by suicide in Australia each day. There were 2,358 male deaths at an age-standardised rate of 18.2 per 100,000.
There were 786 female deaths at an age-standardised rate of 6.1 per 100,000.
In 2020, there were 3,139 deaths by
suicide with an age-standardised rate of 12.1 per 100,000.
This equates to an average of 8.6*
deaths by suicide in Australia each day.
There were 2,384 male deaths at a age-standardised rate of 18.6 per 100,000.
There were 755 female deaths at an age-standardised rate of 5.8 per 100,000.
In 2019, there were 3,358 deaths by suicide with an age-standardised rate of 13.1 per 100,000.
This equates to an average of 9.2*
deaths by suicide in Australia each day.
There were 2,536 male deaths at a age-standardised rate of 20.1 per 100,000.
There were 822 female deaths at an age-standardised rate of 6.3 per 100,000.
*This is calculated by Everymind and we recommend using with caution. ** 2019 data have been subject to revision; 2020 and 2021 data are preliminary.
• In 2021, there were 3,144 deaths compared to 3,139 deaths in 2020.
• Whilst the number of deaths by suicide increased slightly, the age standardised rate reduced (12.1 per 100,000 in 2020 compared to 12.0 per 100,000 in 2021).
• The suicide rate for males decreased by 2.3% between 2020 and 2021.
• The suicide rate for females increased by 5.0% between 2020 and 2021.
• Young and middle-aged people are more likely to die by suicide, with 81.9% of people under 65 years.
* Age standardised rate per 100,000. ** Number of deaths.
*** 2020 and 2021 preliminary data, 2019 revised data.
• Men over 85 years had the highest male age-specific suicide rate but accounted for a small proportion (3.2%) of male suicides.
• Men aged between 50-54 years had the highest male age-specific suicide rate of those under 80 years and accounted for 9.1% of suicides of males.
• Men aged 80-84 years had the largest increase in male age-specific suicide rates, from 21.7 deaths per 100,000 in 2020 to 31.2 per 100,000 in 2021.
• Males aged 15-19 years had the largest proportional decrease in their age-specific suicide rate, from 17.0 per 100,000 in 2020 to 13.1 per 100,000 in 2022.
Suicide rate (per 100,000)
45.0
40.0
35.0
30.0
25.0
20.0
15.0
10.0
General summary 0.0
50.0 0-14 15-19 20-24 25-29 30-34 35-39 40-44 45-49 50-54 55-59 60-64 65-69 70-74 75-79 80-84 85 and over
5.0
Age specific rate per 100,000. 2020 and 2021 data are preliminary.
• In 2021, women aged between 50-54 years had the highest female age-specific suicide rate and accounted for the highest proportion (9.9%) of female suicides.
• Between 2020 and 2021, women aged between 50-54 years moved from the 7th to the leading age group of suicides in females.
• Between 2020 and 2021, women aged between 45-49 years had the largest decrease in the female age-specific suicide rate.
Suicide rate (per 100,000)
40.0
35.0
30.0
25.0
20.0
15.0
10.0
5.0
0.0
0-14 15-19 20-24 25-29 30-34
and
Age specific rate per 100,000. 2020 and 2021 data are preliminary.
data are final and no longer revised.
note on changes to Victorian data from 2013 to
data have been subject to
and
data are
group
group
• In 2021, 219 Aboriginal and Torres Strait Islander peoples died by suicide.
• The median age of death was 30.2 years.
• Using data from New South Wales, Queensland, Western Australia, South Australia and Northern Territory, the age-standardised suicide rate for Aboriginal and Torres Strait Islander people was 27.1 per 100,000.
Age standardised death rate (per 100,000)
30.0
25.0
20.0
15.0
10.0
5.0
0.0
Note: Age standardised suicide rates are compiled from the jurisdictions of NSW, QLD, WA, SA and NT.
• Between 2020 and 2021, all states except Queensland and the Australian Capital Territory had a decrease in the age-standardised suicide rate. New South Wales and Western Australia remained the same.
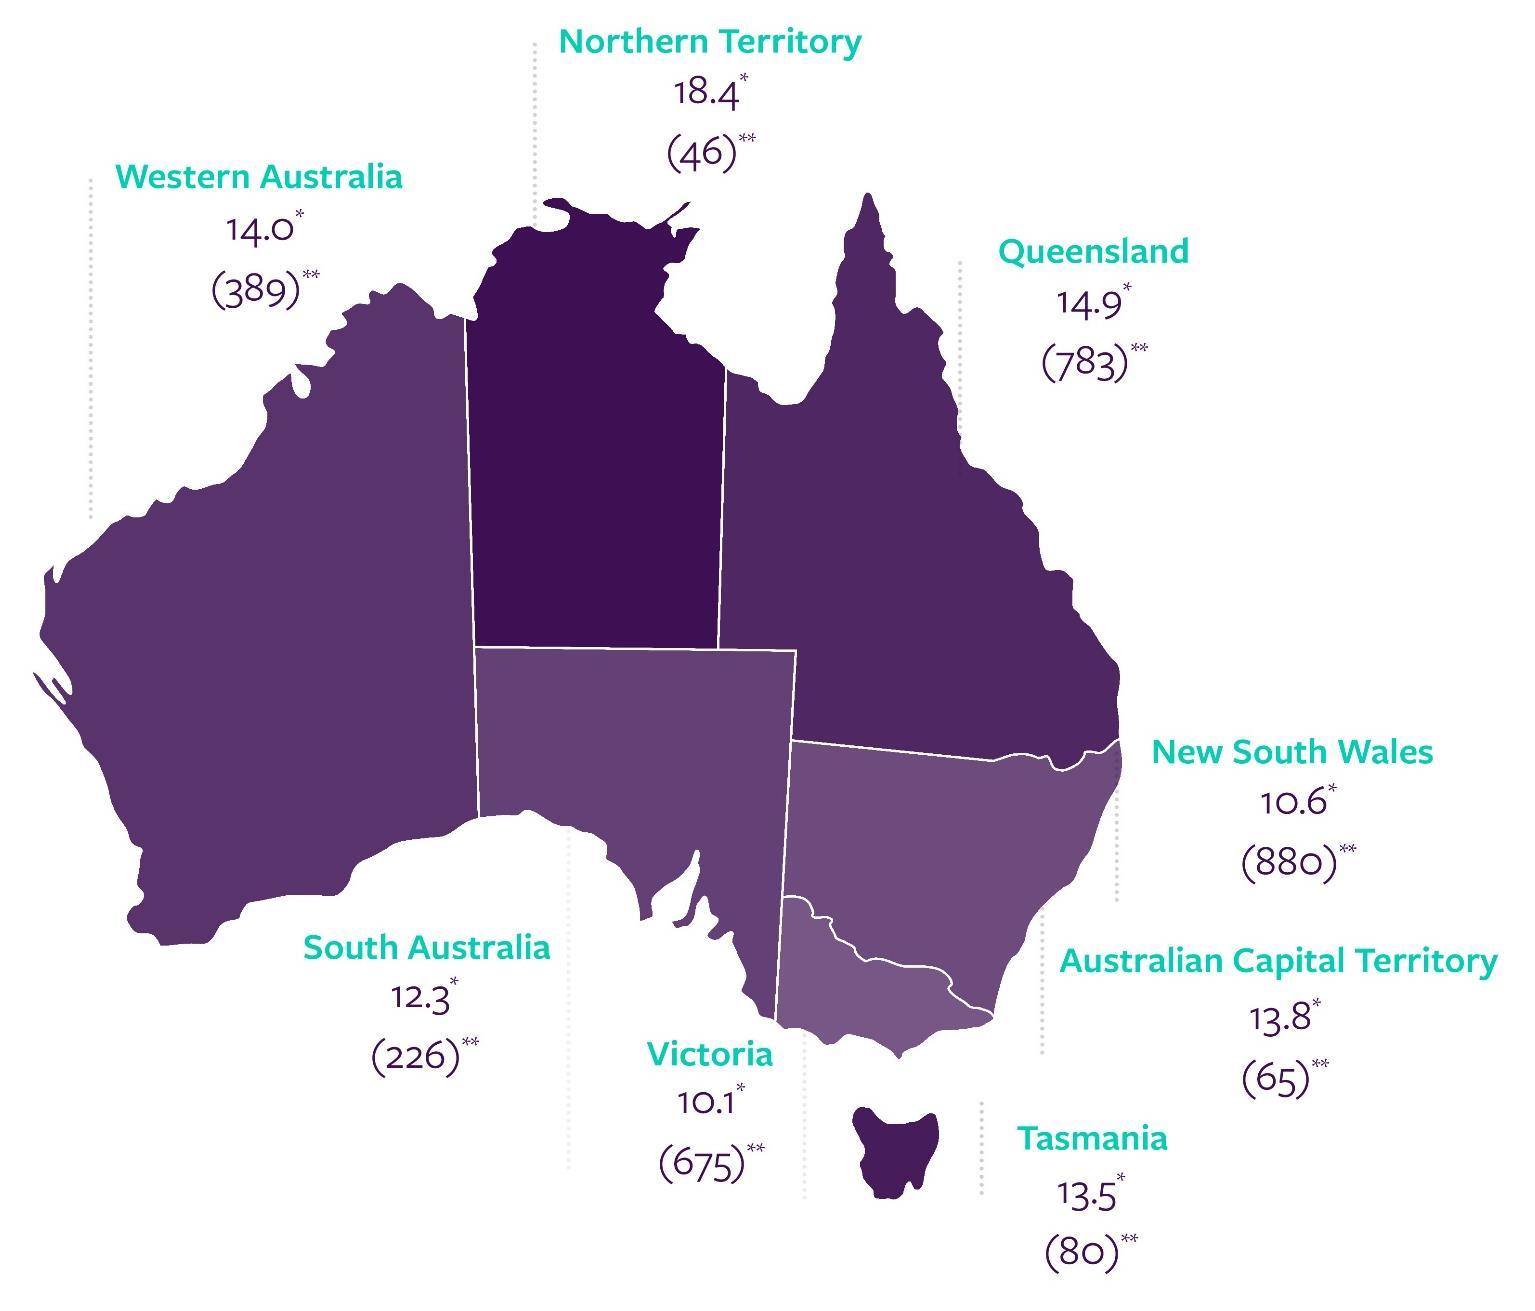
• Almost three-quarters of people who died by suicide had a usual residence of New South Wales (880), Victoria (675) or Queensland (783).
• Northern Territory had the lowest number of people who died by suicide (46) but the highest rate of suicide* (18.4 per 100,000 people).
*Age standardised rate per 100,000. **Number of deaths.
Greater capital cities total Rest of states total
• Suicide among children (aged 0-14) is an extremely sensitive issue and rare occurrence, with considerably fewer deaths than any other age group.
• There were 32 deaths by suicide amongst youth aged 0-14 years with an age-specific rate of 0.7 per 100,000.
rate (per 100,000)
• There were 14 deaths among male youth in this age group at an age-specific rate of 0.6 per 100,000.
• There were 18 deaths among female youth in this age group at an age-specific rate of 0.8 per 100,000.
*2012 2018 data are final and no longer revised. 2019 data have been subject to revision. 2020 and 2021 data are preliminary.
note on changes to Victorian data from 2013 to 2016.
rate (per 100,000)
data are
note on
rate (per 100,000)
Note: Dotted line represents overall trend.
to Victorian
from
rate (per 100,000)
rate (per 100,000)
rate (per 100,000)
data are final and no longer revised.
note on changes to Victorian data from 2013 to
data have been subject to revision.
and
data are
rate (per 100,000)
2018 data are final and no longer revised. 2019 data have been subject to revision.
note on changes to Victorian data from 2013 to 2016.
rate (per
and 2021 data are preliminary.
rate (per
data are final and no longer revised.
data have been subject to revision.
note on changes to Victorian data from 2013 to 2016.
and
data are
rate (per
data are
rate (per 100,000)
20.0
See
and
data from
Five year trend (Male and Female combined)
49 year olds
rate (per
rate (per
rate (per
data are final and no longer
note on changes to Victorian data from 2013 to
data have been subject to
are
rate (per
rate (per
rate (per
Five year trend (Male and Female combined)
64 year olds
rate (per
rate (per 100,000)
data are final and no
See note on changes to Victorian data from
rate (per 100,000)
20.0
15.0
10.0
data
been
to
rate (per
rate (per 100,000)
rate (per
are
See note on
rate (per
and
to Victorian data from
rate (per 100,000)
rate (per 100,000)
20.0
15.0
10.0
5.0
*Female 2008 data not reportable at time of finalisation.
*2012-2018 data are final and no longer revised. 2019 data have been subject to revision. 2020 and 2021 data are preliminary. See note on changes to Victorian data from 2013 to 2016.
rate (per 100,000)
20.0
15.0
10.0
5.0
rate (per 100,000) Year
*2012-2018 data are final and no longer revised. 2019 data have been subject to revision. 2020 and 2021 data are preliminary. *Statistics available prior to 1997 reported the eldest category as 75 plus. To include this data for illustrative purposes, data here represents 75+ for all data pre 1997. See note on changes to Victorian data from 2013 to 2016.
• For intentional self-harm deaths, associated factors could include mental health conditions, lifestyle factors or chronic diseases that can interact and increase the risk of suicide. In 2021, this also included issues related to the COVID-19 pandemic.
• It is important to note that associated factors do not indicate a causal association and that categories are not mutually exclusive. Associated risk factors should therefore not be considered in isolation. Instead they provide an insight into the complex interaction between biological, psychological and psychosocial factors, which have contributed to these deaths.
• The capture of information on associated causes of death is reliant on the documentation available for any given death. The associated factors presented here reflect information contained within reports available on the National Coronial Information System (NCIS) and do not necessarily reflect all factors associated with all suicide deaths.
• It is important to recognise that the presence of one or more associated factors in a person’s life does not indicate the presence of suicidal behaviour. This context is important, so as to avoid normalising suicide for those with a similar risk factor.
• Almost 90% of people who died by suicide had at least one risk factor reported, with an average of three to four factors mentioned per person.
• Mood disorders (including depression) were the most common risk factor for both males (36.2%) and females (41.6%), and across all age groups except for those 85 years and older.
Top five risk factors across all ages in 2021:
• Mood disorders, including depression (37.5%)
• Suicidal ideation (24.6%)
• Problems in spousal relationships circumstances (24.0%)
• Acute alcohol use and intoxication (20.6%)
• Personal history of self-harm (20.5%).
•
Psychosocial risk factors are social processes and social structures that can have an interaction with individual thought, behaviour or health.
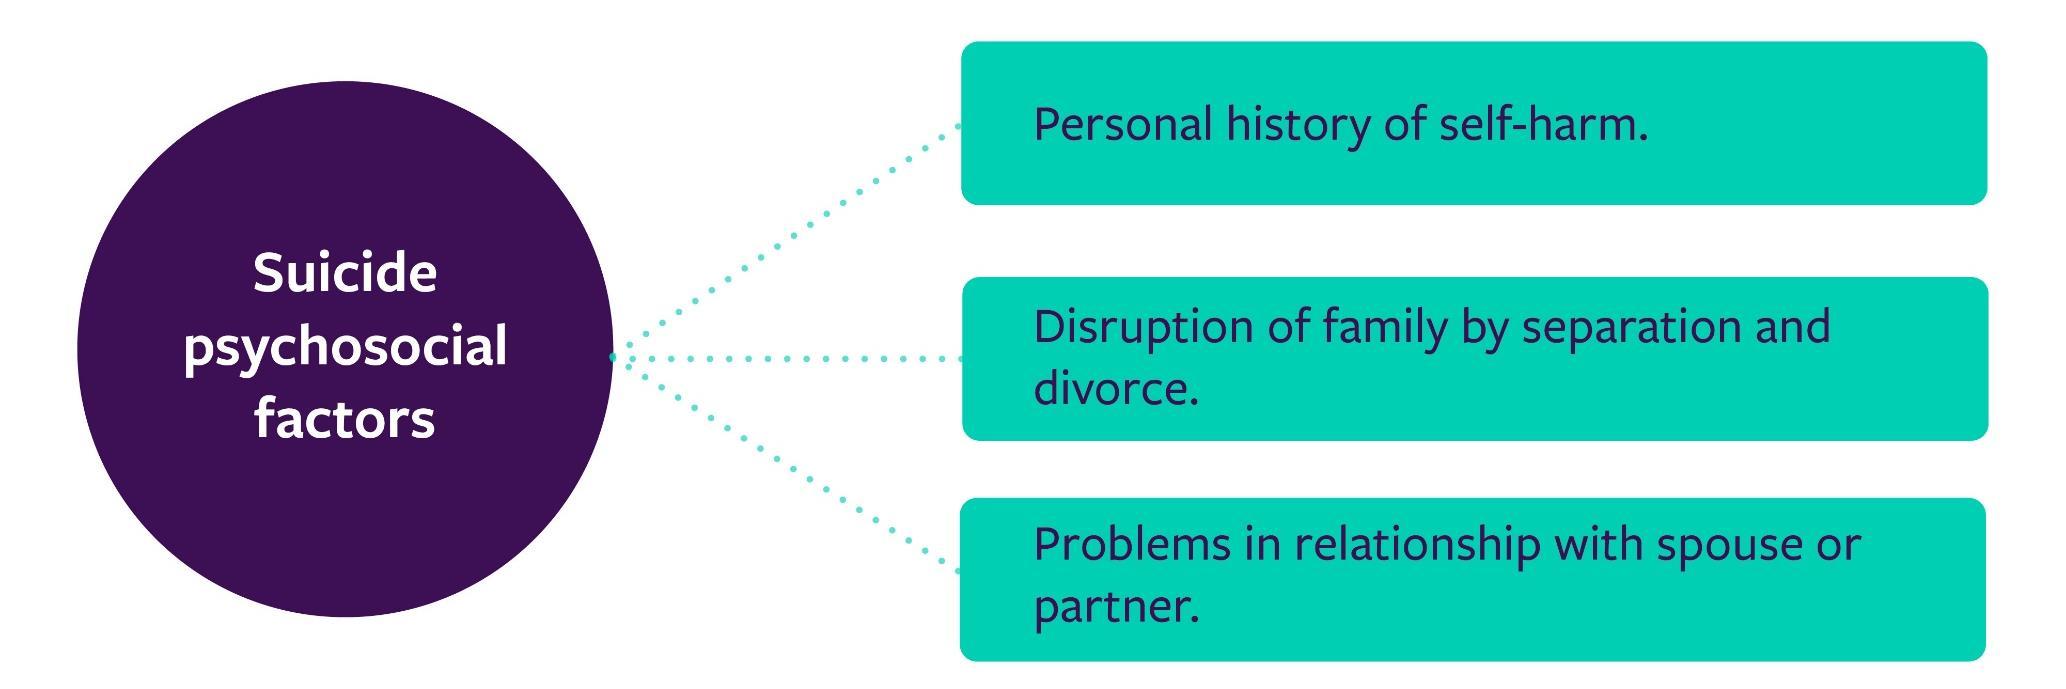
• In 2021, 65.1% of all coroner-referred suicide deaths (63.3% for males and 70.6% for females) in Australia were found to have at least one psychosocial risk factor.
•
Psychosocial risk factors associated with suicide were largely age dependent and differed throughout the lifespan.
history of
of family by
Personal history of self-harm
in relationship with spouse
of family by
and
relationship
Disruption of family by separation and divorce
history of self-harm
history of self-harm
in relationship with spouse or partner
in relationship with spouse or partner
to proportion of
with
of family by separation and divorce
Disruption of family by
and
history of
history of
of family by
relationship with spouse
relationship with
Personal history of selfharm
of family by separation and divorce
history of selfharm
to
of activities
Limitation of activities due to disability
and death of a family member
with
Limitation of activities due to disability
of self-
and death of a family member
of activities due to
of
and death
• A number of people who died by suicide in 2021 had issues relating to the COVID-19 pandemic mentioned in either a police, pathology or coronial finding report. This information was collected in the National Coronial Information System (NCIS).
• Issues relating to the COVID-19 pandemic included job loss, lack of financial security, family and relationship pressures and not feeling comfortable with accessing health care.
• Three additional ICD-10 codes were also used by the ABS to capture different scenarios where the COVID-19 pandemic was stated to be a risk factor for an individual:
F41.8 Other specified anxiety disorder (pandemic related anxiety and stress)
Z29.0 Isolation (individual was in isolation or quarantine [hotel or home])
Z29.9 prophylactic measure, unspecified (measures put in place through health directives, including closure of business, stay at home measures).
There were 81 people (2.6% of all suicide deaths) who had the COVID-19 pandemic mentioned in either a police, pathology or coronial finding report.
For people with issues relating to the COVID-19 pandemic, it did not appear as an isolated risk factor. They had on average six risk factors, including on average three psychosocial risk factors.
For the 81 people who died by suicide with issues relating to the COVID-19:
65.4% also had a mood disorder (including depression)
39.5% also had problems related to employment or unemployment
30.9% also experienced suicidal ideation
27.2% also had problems in spousal relationships
27.2% also had acute alcohol use and intoxication.
This summary is based on data derived from the Australian Bureau of Statistics’ Causes of Death release on Intentional self-harm.
www.abs.gov.au/statistics/health/causes-death
This data will also form part of the Australian Institute of Health and Welfare’s Suicide and Self-harm Monitoring System and should be taken in context with other data sources.
www.aihw.gov.au/suicide-self-harm-monitoring
Life in Mind is a knowledge exchange portal providing translated evidence, policy, data and resources in suicide prevention, and is host of the National Communications Charter.
Life in Mind connects suicide prevention and related sectors to the evidence, information and resources they need, and communities to help-seeking information, with the aim to promote best practice in suicide prevention and support the sector and the community to respond to and communicate about suicide and its impacts.
lifeinmind.org.au