APPEAL OF EMBREY’S MARKETS STARTS WITH HIGH GROWTH
Prepared by: Jeanette I. Rice, CRE, Rice Economics, LLC


EMBREY’s development and acquisition activity is focused on 11 metropolitan areas: eight where the company is already active — Austin, Dallas/Fort Worth, Denver, Phoenix, San Antonio, Charlotte, Nashville, and Orlando — and three likely expansion markets: Salt Lake City, Raleigh, and Tampa.
EMBREY’s metro markets have been carefully chosen for their potential for strong market performance and favorable financial returns.
This report focuses on EMBREY’s western markets Austin, Dallas/Fort Worth, Denver, Phoenix, Salt Lake City, and San Antonio. Part 2, to be published later, will review the eastern markets.
FIVE MARKET CHARACTERISTICS CREATE MARKET AND INVESTMENT APPEAL 5
Five general characteristics go far in explaining the appeal of EMBREY’s six western markets for development and acquisitions.
Four characteristics capture the key multifamily demand drivers . The fifth characteristic covers the markets’ appeal to investors.
DEMOGRAPHICS: IMPRESSIVE POPULATION GROWTH
Strong population growth is a key driver of multifamily demand in all EMBREY’s western markets. A large portion of the population growth comes from in-migration, which is particularly powerful for creating multifamily demand. Population growth has been extraordinarily high over the past few decades and is expected to continue to significantly outpace the nation in the years to come.
| 3 |
1
EMBREY’s six western markets combined welcomed over 4 million residents over the past 11 years or nearly 20% of the nation’s total population gain.

From 2010 to 2021 total population in the combined six metros rose by 21.4%, nearly three times the national rate of 7.5% ( FIGURE 1 ).
Growth rates ranged from Denver’s 16.4% — more than twice the U.S. average — to Austin’s 37.1% — the highest increase among all 56 metros in U.S. with at least one million people. Each EMBREY western market ranked among the top 14 for growth rate.
Dallas/Fort Worth, the country’s fourth largest metro, alone added 1.4 million new residents in the 2010-2021 period. Phoenix added over 750,000 people for the fift h highest gain in the country. Phoenix is now the 10th largest metro in the U.S. (bumping Boston down to 11th largest a few years ago).
SOURCE: EMBREY Partners; Rice Economics, LLC; U.S. Census Bureau. 2021 is latest available from Census. *MSAs, Denver covers Denver MSA and Boulder MSA; Salt Lake City covers Salt Lake City MSA, Ogden MSA, and Provo MSA. Rank among 56 metros with at least one million population in 2021.
FIGURE 1 POPULATION GROWTH IN WESTERN EMBREY MARKETS, 2010-2021
U.S. 331,894,000 23,148,000 7.5Major U.S. Metros 191,258,000 16,753,000 9.6Western EMBREY Markets 23,629,000 4,161,000 21.4Austin 2,352,000 636,000 37.1 1 Dallas/Fort Worth 7,760,000 1,393,000 21.9 5 Denver 3,302,000 464,000 16.4 14 Phoenix 4,946,000 753,000 18.0 11 Salt Lake City 2,667,000 455,000 20.6 9 San Antonio 2,602,000 459,000 21.4 8
METRO 2021 TOTAL 2010-2021 INCREASE NUMBER PERCENT U.S. RANK | 4 |
The population in EMBREY’s markets is also relatively young; an important demographic benefit for multifamily demand. Every metro has a lower median age than the nation as a whole and higher percentage of younger adults ( FIGURE 2 ). On average, the median age for EMBREY’s western markets is 2.7 years younger than the U.S. The percentage of residents in their prime renting years is 21.8% versus the national average of 20.2%.
EMPLOYMENT: ROBUST JOB CREATION
Employment growth contributes significantly to multifamily deman d. High rates of job creation attract newcomers to a region. More job opportunity increases consumer confidence. Both trends lead to higher levels of household formation.
EMBREY’s western markets have all experienced robust employment expansion over the past few decades and are well positioned to continue to do so. National economic downturns have, of course, impacted these metros, but to a lesser degree than most other metros.

Employment growth in 2022 illustrates EMBREY’s western markets’ impressive job growth ( FIGURE 3 ).
EMBREY’s western markets added a half million jobs last year. The job growth rate was 4.3%, outpacing the national growth rate of 3.2%.
FIGURE 2
U.S. 38.8 67,019,000 20.2 EMBREY Western Metros 36.1 4,763,000 21.8 Austin 35.8 556,000 23.7 Dallas/Fort Worth 35.5 1,644,000 21.2 Denver 37.2 673,000 22.6 Phoenix 37.6 1,036,000 20.9 Salt Lake City 33.7 292,000 23.1 San Antonio 35.6 562,000 21.6
RENTER AGE DEMOGRAPHICS IN WESTERN EMBREY MARKETS, 2021
METRO
MEDIAN AGE POPULATION AGED 20-34 PERCENT OF TOTAL
SOURCE: EMBREY Partners; Rice Economics, LLC; U.S. Census Bureau, based on 2021 population.
2 | 5 |
Dallas/Fort Worth led the country in 2022 job creation — both by total number and percentage gain. The Metroplex added an impressive total of 234,700 jobs for a 5.9% gain.
San Antonio, Austin, and Denver are also enjoying very strong gains and growth rates well above the national rate. Phoenix has slowed to the U.S. growth rate of 3.2%, but that still represents an addition of 74,300 jobs in 2022.
Salt Lake City’s employment growth also moderated in 2022. The metro’s extraordinarily low unemployment rate of 2.0% in December creates challenges for em ployers trying to fill positions.
SOURCE: EMBREY Partners; Rice Economics, LLC; U.S. Bureau of Labor, December 2022. For employment change Denver covers Denver MSA and Boulder MSA; Salt Lake City covers Salt Lake City MSA, Ogden MSA, and Provo MSA. Unemployment data is not seasonally adjusted and is for the principal MSA of the metro only.
jobs
one million population).
Historical unemployment data further reflects the strong economi c health and growth of EMBREY’s western markets. Over various economic cycles of the past few decades, unemployment rates in EMBREY’s western markets have largely trended lower than the U. S. and have often been significantly lower.
One exception was Phoenix’s unemployment during and after the Great Financial Crisis. The metro, hard hit by the housing contraction, experienced high unemployment on par with the U.S. average. Denver’s unemployment was also higher than the other EMBREY markets during that period and around the U.S. average.
One of the most compelling characteristics of EMBREY’s western markets is the rapid growth of the high-tech industry. Five of EMBREY’s western markets are leaders for tech employment growth.
 FIGURE 3
EMPLOYMENT GROWTH IN WESTERN EMBREY MARKETS, 2022
FIGURE 3
EMPLOYMENT GROWTH IN WESTERN EMBREY MARKETS, 2022
U.S. 4,814,000 3.2 - 3.3 Major Metros 3,166,100 3.5 -Western EMBREY Markets 500,200 4.3 -Austin 50,900 4.2 13 2.7 Dallas/Fort Worth 234,700 5.9 1 3.2 Denver 66,600 3.8 20 2.8 Phoenix 74,300 3.2 28 2.7 Salt Lake City 27,100 2.0 41 2.0 San Antonio 46,600 4.3 10 3.3 METRO 2022 JOB GROWTH UNEMPLOYMENT, DEC. 2022 (%) NUMBER PERCENTAGE U.S. RANK
U.S.
53
at least 500,000
rank among
metros with
(about
| 6 |
HIGH-TECH: DRAMATIC GROWTH OF HIGH-TECH SECTOR
High-tech expansion has occurred everywhere in the U.S. in rece nt decades. But most of EMBREY’s western markets have experienced growth significantly greater th an the national trend. High-tech will also help secure substantial economic growth in the years to come.
The most obvious example is Austin’s evolution into one of the most important high-tech centers in the country. For example, Austin ranked sixth highest in the U.S. and Canada in CBRE’s 2022 “Tech Talent” report. Austin also ranked third in the U.S. and Canada (after Vancouver and Toronto) for high-tech employment growth with a 25% rise in high-tech software and ser vices jobs in the two-year 2020-2021 period ( FIGURE 4 ).
Denver’s high-tech growth in 2020 and 2021 ranked sixth among the leading 30 tech markets in the U.S. and Canada. Denver has long been a recognized tech center with its talented workforce and ability to offer a lower-cost work environment. Salt Lake City (“Silicon Sl opes”) has rapidly emerged as a high-tech center for the same reasons.
Dallas/Fort Worth receives less attention than Austin but has f ar more high-tech jobs than the Texas capital. The Metroplex continues to add them at a faster rate than the U.S.
San Antonio’s high-tech sector does not rank well in the CBRE studies, but the metro has an important biosciences sector along with other fields of high-tech activity . UTSA’s new School of Data Science facility and National Security Collaboration Center downtown are also expected to stimulate more high-tech growth especially in cybersecurity. Also, given San Antonio’s lower living and business costs vis-à-vis Austin, San Antonio’s role in supporting Austin’s tech sector will likely become more important in the future.
The growth of the top high-tech markets in 2020 and 2021 also illustrates the geographical dispersion of high-tech employment. The trend started long before COVID and likely will continue in the future due to business costs and employee lifestyle choices. (CBRE estimated that in 2021, Austin’s high-tech business costs including office rent and salaries, were 30.6% less than in San Francisco.) While Austin experienced a 25% increase in high-tech jobs in 2020 and 2021, San Francisco’ s high-tech employment rose by only 4.7%.
FIGURE 4
HIGH-TECH GROWTH IN EMBREY WESTERN MARKETS
U.S. 9.8 - -Tech 30 Metros 10.8 - -Austin 25.0 3 65.2 6 Dallas/Fort Worth 11.9 12 58.6 9 Denver 14.2 6 57.5 10 Phoenix 8.4 13 54.0 16 Salt Lake City 12.0 11 52.5 18 San Antonio N/A N/A 27.8 47 METRO
SOURCE: EMBREY Partners; Rice Economics, LLC; CBRE “Tech-30 2022,” October 2022 and “Tech Talent,” based on 50 major markets, July 2022. Two-year growth in high-tech software and services jobs.
RANK AMONG
HIGH-TECH EMPLOYMENT TECH TALENT SCORECARD INDEX GROWTH, 2020 AND 2021 (%) MAJOR METROS
RANK AMONG “TECH-30” METROS 3 | 7 |
50
In EMBREY’s western markets, home price appreciation has averaged more than 9% per year for the past 11 years, even higher than the 7.3% average annual rate for the country.
4 QUALITY OF LIFE: LOWER COST OF LIVING AND MORE
Quality-of-life factors contribute to attracting and retaining households, and thereby help create multifamily demand.
Salt Lake City, Denver, and Phoenix, to a lesser extent, are growing due to their proximity to mountains and other recreational areas for winter and summer outdoor activity. For example, Salt Lake City has 10 ski resorts located less than one hour from downtown.
Many people are attracted to Austin for its music scene and festival culture. San Antonio’s military base history makes it particularly appealing to families with current or prior military experience. People are often attracted to Phoenix and the Texas metros for their warmer winter climates. Dallas/Fort Worth, Denver, and Phoenix have all four major pro sports.
The lower cost of living in most of EMBREY’s western markets (Denver the exception) is clearly attractive, especially with many employers allowing their workers to work r emotely and/or at regional offices. Paychecks usually go further in EMBREY’s western markets than in the higher-cost coastal markets.
The lower cost of living theoretically means that new residents can afford to buy a house sooner than in higher-cost metros. However, home prices have appreciated signi ficantly over recent years, making moves into homeownership more difficult. Moving into homeownership is n ot as easy as is often perceived in these markets. Renters are staying in rental housing longer, thereby increasing multifamily demand.
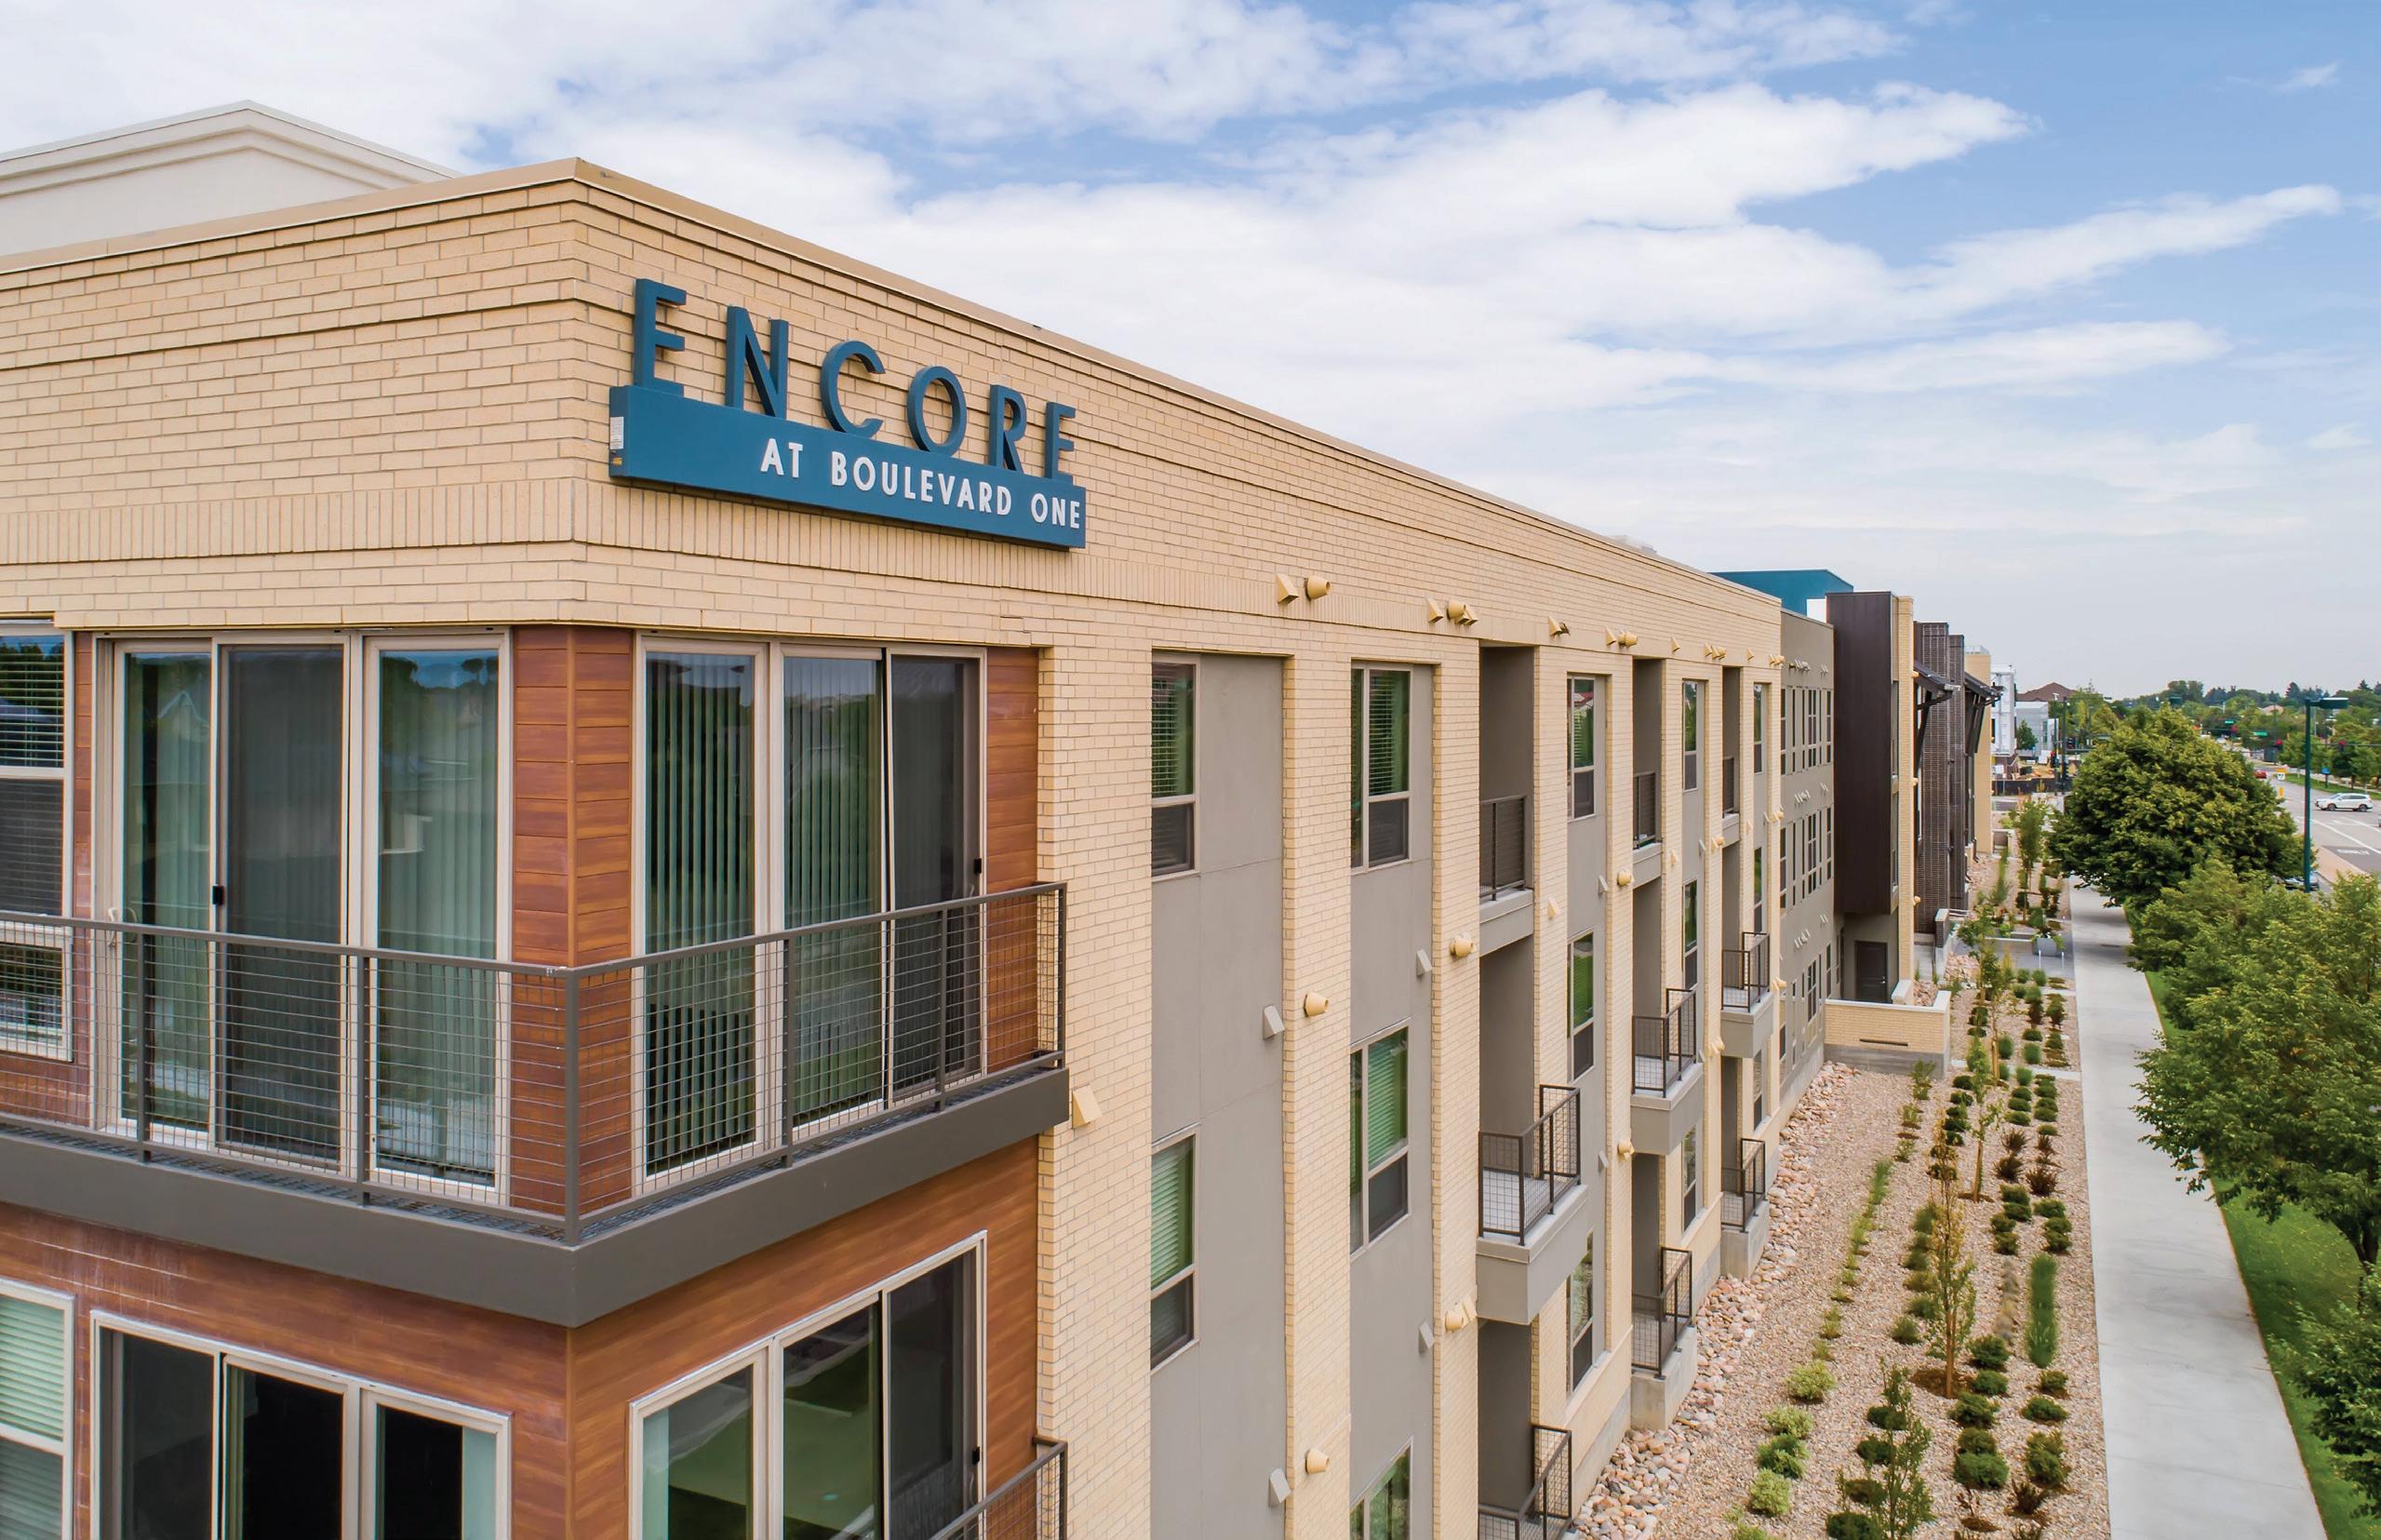
enCore at boulevard one | denver, co | 8 |
In the 11 years since home values troughed after the Great Financial Crisis, U.S. home values have appreciated at an average annual rate of 7.3%. In EMBREY’s western markets, home prices have been rising faster. The top metros for increases were Phoenix, Austin, and Denver — all with average annual increases of 10% or higher ( FIGURE 5 ).
SOURCE: EMBREY Partners; Rice Economics, LLC; U.S. Federal Housing Finance Agency, U.S. Census Bureau (homeownership average for 2022). HPI, 100 = Q1 1991; Q2 2011 represents the HPI bottom following the GFC; Q3 2022 is most recent data available. Homeownership data for Dallas/Fort Worth metro.
Homeownership rates also confirm that a large percentage of hous eholds cannot or choose not to buy homes in EMBREY’s western markets. Homeownership rates in Phoen ix and Salt Lake City were only slightly higher than the U.S. in 2022; homeownership rates in EMBREY’s other western markets were lower than the national average.
The dynamic growth of EMBREY’s western markets, especially from high rates of in-migration, means that a significant proportion of households are in transition. These individuals and families often choose to rent for a period thereby keeping homeownership rates lower and rental demand higher.
INVESTOR APPEAL: STRONG INVESTOR APPETITE IN THE MARKETS
EMBREY’s western markets are appealing to investors. They have experienced generally increasing and high levels of investment for many years. Strong investor appeal provides greater access to capital for development or acquisitions and greater security of selling assets at exit — in other words strong liquidity. Strong investor appeal contributes to a more competitive buying environment, but also favorable value appreciation and higher pricing at exit.
Multifamily investment in the U.S. has been very impressive over recent years. And even though 2022’s total of $294 billion was down 16.8% from the prior year, 2022 was the second highest volume since the industry started tracking investment in 2001.
U.S. multifamily investment has also been favoring high-growth metros for many years and is expected to continue to do so. That preference is well represented in EMBRE Y’s western markets’ five-year investment volume which reached $227 billion ( FIGURE 6 ).
FIGURE 5 HOME PRICE APPRECIATION & HOMEOWNERSHIP
U.S. 176 389 7.3 65.8 Austin 256 782 10.4 62.4 Dallas 165 441 9.1 60.4 Fort Worth 159 420 9.0 60.4 Denver 248 726 10.0 64.6 Phoenix 161 610 12.6 68.0 Salt Lake City 201 469 7.8 66.5 San Antonio 261 756 9.9 63.0 METRO INDEX Q3 2022 INDEX Q2 2011 AVERAGE ANNUAL INCREASE (%) HOMEOWNERSHIP RATE (%)
5 | 9 |
In the past five years, multifamily investment in EMBREY’s western markets alone reached $227 billion or a phenomenal 19.4% of all U.S. investment over the period.

Dallas/Fort Worth, with $83.3 billion invested and 7.1% of the U.S. total, led the country for multifamily investment over the past five years, followed by New York, Los A ngeles, Atlanta, and Phoenix. Denver and Austin also ranked in the top 10 markets.
EMBREY Developers Provide Additional Insights on Western Markets
Interviews with EMBREY’s development leaders confirmed the overr iding theme of high growth in EMBREY’s western markets as well as the increasingly challenging development environment. The interviews also brought to light some of EMBREY’s strategies for the western markets.
SAN ANTONIO. The beauty of developing in one’s hometown means that EMBREY us ually receives the first look at prospective sites and can choose the very best. Geographically, Pearl historic district is very appealing for development. EMBREY is also keeping an eye on the emerging Southtown neighborhood, just southeast of downtown.
San Antonio’s rapid expansion is also creating opportunities in newer suburban areas particularly to the northwest, north, and northeast — conducive for garden and built-to-rent (BTR) communities. The U.S. 281 freeway extension north of Texas Loop 1604 to Comal County is opening new development possibilities.
AUSTIN. Austin’s high-tech expansion and cultural vibe cannot be underestimated. They serve as a magnet for people from all around the U.S. The impressive growth in Austin’s airline connections, including some international flights, is indicative of Austin’s rise in importa nce among U.S. metros.
Given development challenges of topography and watershed on the west and stricter entitlement processes especially in northern suburbs, EMBREY considers Austin’s southwestern and southeastern suburbs among the better areas for development opportunity. For higher-density product, Austin’s downtown and The Domain areas are very appealing.
DALLAS/FORT WORTH. The Metroplex’s high-paced growth and very large size provides more development opportunities than EMBREY’s other markets. The development challenges are not as pronounced here compared to other markets given fewer physical limitations for growth. However, many suburban municipalities and neighborhoods are less welcoming to multifamily development than in the past (a pattern found everywhere).
Despite the latter, the growth dynamics of the newer northern suburbs are quite attractive for garden and BTR development. But given Dallas/Fort Worth’s growth in nearly all directions, EMBREY is finding appealing sites across the Metroplex. In recent years, the urban submarkets have been very competitive and not a focus for EMBREY; however, over the next few years with fewer DFW multifamily starts, urban development may become more appealing.
PHOENIX. EMBREY development leaders confirm that Phoenix’s rapid growth is still an integral component to Phoenix, despite some recent slowdown in growth metrics. The metro is still attracting large numbers of Californians and others looking for more affordable living. Whil e Phoenix has development challenges, the area is generally more open to growth than most of the other EMBREY markets. Local municipalities and other agencies will help to find solutions.
EMBREY finds Scottsdale, Southeast Valley (Chandler and nearby c ities), and Midtown among the most attractive areas for development. The company is not pursuing BTR opportunities here. Phoenix was the birthplace of modern BTR product and remains the leader for BTR development today, creating a very competitive BTR environment.
| 13 |
the finch | denver, co
DENVER. EMBREY’s 20+ years of development experience in Denver confirms its deep attraction to the city. Denver has one of the most vibrant urban cores in the country a nd has all four major professional sports venues located downtown. The economy continues to attract jobs and young people, despite notable losses in affordability in the past two decades.
Development is becoming much more challenging in the region. Impact fees in Denver’s suburban municipalities are very high (especially in Jefferson County), m aking many potential proj ects unfeasible. Within the City of Denver is new housing legislation created wi th the intention of helping housing affordability. However, it adds cost to new development projects and has led t o a significant falloff in construction starts. Despite the challenges, EMBREY believes the best opportunities are in the urban neighborhoods.
SALT LAKE CITY. The features that stand out to EMBREY include the attractive lifestyle and culture that make this city appealing to students and families. Another key quality-of-life amenity is TRAX, the light rail line linking downtown with communities north and south as well as the airport and University of Utah.
EMBREY finds many neighborhoods in and near downtown Salt Lake C ity very attractive for development. Salt Lake City’s unique situation between the Wasatch Mountains to the east and the Great Salt Lake and Utah Lake to the west (and surrounded by large quantities of federal lands) also means that urban growth is generally to the north or to the south. This geography is creating longer commutes for Salt Lake City residents living in the newer suburbs. It also adds to the challenge in fi nding suitable suburban sites which are within reasonable commuting distance.
| 14 |
MARKET PERFORMANCE TODAY AND 2023 OUTLOOK
EMBREY’s western markets have generally performed very well over recent years. In the two years leading up to midyear 2022, the markets experienced record levels of demand and peak levels of rent growth.
In 2023, market performance will be less dramatic with subdued but still positive rent growth. Supply will slightly outpace net absorption. Long term, given expected high levels of demand, market performance should remain largely favorable.
Combined, the new supply in EMBREY’s western markets represents a 5.8% increase to the existing inventory, almost double the national average. Among the markets, San Antonio and Dallas/Fort Worth supply-toinventory ratios are more in line with historical patterns, while Austin, Denver, Phoenix, and Salt Lake City reflect quite high increases.
The high level of new supply is a concern and will lead to pockets of oversupply, slower-than-expected lease-ups of some properties, and more aggressive marketing. Ho wever, RealPage is also forecasting robust demand in EMBREY’s western markets. The net absorption forecast of 120,219 units is nearly as high as expected deliveries, thereby mitigating the potential negative impact of new supply.
The 2023 rent forecasts reflect the balanced outlook between sup ply and demand. Rents are expected to rise in all of EMBREY’s western markets this year, but at much more moderate levels than experienced in 2021 and 2022.
Nationally, rent growth is forecast at 2.9%, well below 2022’s 6.6% and 2021’s 13.9%. However, this level is close to RealPage’s 25-year historical average of 3.1%.
3.9%
Dynamic markets with active pipelines typically have slightly lower occupancy levels than less active markets. This is true for EMBREY’s western markets where occupancy levels are averaging about one point lower than the national average of 95%.
Further deterioration in the national economy — leading to higher unemployment and lower consumer confidence — could lead to less robust demand nationally and in EMBREY markets later this year. However, for now the multifamily outlook is for steady performance throughout the year.
EMBREY ’s western metros are expected to remain leaders for multifamily demand and investment activity over the foreseeable future.
DALLAS RENTS ARE FORECAST TO RISE 3.9% IN 2023, THE LARGEST INCREASE AMONG EMBREY’S WESTERN MARKETS.
| 15 |
conclusion
The factors which have created high levels of demand in recent years are expected to continue to drive these markets and the outlook for overall market performance is favorable. Investment capital will follow.
EMBREY’s western markets do face some near-term and longer-term challenges. Near term, the markets may deliver over-abundant supply. However, demand should hold u p quite well.
Construction starts are slowing. In addition to the higher cost s of capitalizing new projects, development faces a growing array of challenges including increasing local regulation, NIMBYism, affordable housing regulations, and lack of suitable sites.
The development challenges are exacerbated by larger infrastructure issues which are facing EMBREY’s western metros. The markets’ rapid expansion over the past few decades has led to inadequate transportation and utility infrastructure. Long-term supply of water is of concern in many metros. Cities are addressing the issues, but solutions take money and time.
In addition to making development activity more difficult and cos tly, the challenges will likely moderate new supply in the future. At the same time, multifamily demand in EMBREY’s western metros will remain strong given continued high levels of population and employment growth, coupled with the rising cost of homeownership. Investor appetite for product in EMBREY’s markets will remain strong.
FIGURE 9 MULTIFAMILY MARKET SUMMARY, WESTERN EMBREY MARKETS
U.S. 18,869,100 575,591 3.1 492,862 95.1 95.0 1.96 1,781 2.9 Western EMBREY 2,238,100 128,705 5.8 120,219 Markets Percent of U.S. 11.9 22.4 24.4 Austin 285,500 25,618 9.0 24,729 94.1 94.3 1.91 1,667 2.8 Dallas 672,000 26,790 4.0 28,058 94.3 94.7 1.78 1,576 3.9 Fort Worth 225,600 9,862 4.4 8,524 93.6 93.3 1.63 1,403 2.9 Denver 322,800 19,159 5.9 18,086 94.4 94.4 2.14 1,868 2.2 Phoenix 391,000 28,245 7.2 23,894 93.5 92.9 1.88 1,637 0.7 Salt Lake City 120,500 10,587 8.8 9,533 95.0 94.6 1.76 1,594 2.8 San Antonio 220,600 8,444 3.8 7,395 93.0 92.8 1.48 1,269 2.4 METRO NEW SUPPLY TO INVENTORY RATIO (%) COMPLETION 2023 FORECAST SUPPLY / DEMAND INVENTORY OCCUPANCY EFFECTIVE RENT UNITS Q4 2022 DEMAND 2023 FORECAST CHANGE 2023 FORECAST (%) MONTHLY RENT ($) Q4 2022 RENT PSF Q4 2022 Q4 2023 FORECAST Q4 2022 | 16 |
SOURCE: EMBREY Partners; Rice Economics, LLC; RealPage, Q4 2022. Data based on communities with 50+ units.
ARTICLE AUTHOR: JEANETTE I. RICE, CRE RICE ECONOMICS, LLC.
Ms. Rice is one of the country’s leading multifamily economists. She is the founder of Rice Economics, LLC, a consulting firm providing real estate economics and business c onsulting for commercial real estate firms.

Prior to Rice Economics, LLC, Ms. Rice was Americas Head of Mul tifamily Research for CBRE, the largest multifamily debt and equity intermediary in the U.S. At CBRE, Ms. Rice covered nearly all aspects of the U.S. multifamily property and capital markets. She was a frequent speaker at industry events and wrote hundreds of white papers and research briefs on the sector. Her more notable white papers included: The Case for Workforce Housing; The Single-Family Built-to-Rent Hou sing Sector; The Way Forward - Path to Urban Multifamily Recovery; Global Outlook 2030 - Multifamily; and U.S. Multifamily Primer for Offshore Investors.
Ms. Rice began her career in the multifamily sector. One of her first positions was with EMBREY Investments where she conducted feasibility analysis for prospective developments and provided investment strategies for EMBREY ’s geographic expansion in the 1980s. Following EMBREY , Ms. Rice held research leadership positions with HFF (now part of JLL), Lend Lease Real Estate Investments, Crescent Real Estate Equities, and Verde Realty.
Ms. Rice has been involved with many professional organizations through her 40-year career. In particular, she has been active with the National Multifamily Housing Counc il for many years. She is a Counselor of Real Estate and has held numerous leadership positions with the Counselors of Real Estate organization. Ms. Rice currently serves on the TCU Center for Real Estate Executive Council.
Ms. Rice earned a B.A. in history from the University of Washington and M.A. in urban geography from Queen’s University in Canada. She also completed two years of graduate coursework in urban geography at The University of Chicago. Ms. Rice is a 40-year Texas resident, currently based in Fort Worth.
| 17 |
ABOUT EMBReY
EMBREY is a fully integrated real estate investment, acquisition, development, construction and management firm focused on creating maximum value for our partne rs. EMBREY ’s strong performance over nearly half a century demonstrates the value created by disciplined investing and a keen eye for detail.


48+ YEARS IN BUSINESS
5,000+ UNITS UNDER CONSTRUCTION
$1B+ CURRENT ANNUAL DEVELOPMENT PRODUCTION $652MM EQUITY CURRENTLY MANAGED
44,000+ MULTIFAMILY UNITS DELIVERED


10,700+ UNITS UNDER MANAGEMENT

| 18 |
SAN ANTONIO, TX DALLAS, TX PHOENIX, AZ HOUSTON, TX ORLANDO, FL AUSTIN, TX CHARLOTTE, NC DENVER, CO NASHVILLE, TN


7600 Broadway, Suite 300 San Antonio, TX 78209 EMBREYDC . com