Austin’s Multifamily Outlook Brightening | EMBREY March 2025
by: Jeanette I. Rice, CRE, Rice
austin, texas
WINDOW HAS OPENED FOR MULTIFAMILY InvestMENT
Austin is one of the most dynamic metropolitan areas in the United States. Its unique culture and employment opportunities continue to attract large numbers of newcomers from near and far. A skilled labor force and advantageous business climate have created a highly conducive environment for corporate relocations and expansion. Both of these trends will fuel high rates of population and household growth for the foreseeable future.
In turn, this growth will continue to create elevated demand for new housing. The multifamily sector remains positioned to capture a sizeable portion of this demand due to high for-sale housing costs, low home affordability and a history of relatively low homeownership rates in Austin.
Looking at Austin today, it is easy to focus on the current market disruption. The multifamily market is a national poster child for the impact of building too new product too quickly. The oversupply led to two years of deterioration in market fundamentals, most particularly a doubledigit decline in rents and revenues since the end of 2022 – a tough challenge for operators and a barrier for underwriting new development.
ALL MEASURES OF MULTIFAMILY CONSTRUCTION INDICATE A DRAMATIC SLOWING THAT WILL RESULT IN SIGNIFICANTLY LOWER DELIVERIES IN 2025 AND 2026
Yet, Austin multifamily construction is slowing rapidly. Starts peaked in 2022 and then fell rapidly in 2023 and 2024. The 2024 total was the lowest since 2013. Completions are declining at very fast rates. (Figure 1)
Due to the rapidly falling levels of new supply combined with sustained high levels of demand, the market is at an inflection point. Further deterioration in market fundamentals is not expected beyond Q1 2025; 2025 and 2026 will experience substantial improvement in occupancy and effective rents.
Figure 1
AUSTIN MULTIFAMILY COMPLETIONS BY QUARTER
Clearly, Austin needs 2025 and 2026 to absorb the excess multifamily supply added over the past two years and to fully achieve market balance again. The period following, from 2027 onwards, is positioned to offer much healthier market conditions given Austin’s steadfast economic and demographic strength combined with limited new supply over the next two years.
On the horizon is a new, positive multifamily outlook, one that opens the window for strategic investment opportunities today.
PART 1: THE MARKET CLIMATE
MULTIFAMILY CONSTRUCTION HAS SLOWED DRAMATICALLY
The dramatic slowdown in multifamily construction is the key to understanding the improving market environment in Austin. All construction measures show significant declines.
Permits. Multifamily permits peaked in 2021 (25,642 units). In 2024, multifamily units receiving building permits fell 31% from the prior year to a total of 15,008 units.
Starts. Multifamily starts peaked in 2022 at 24,371 units and then dropped dramatically in both 2023 and 2024. Last year’s figure of only 7,497 units was Austin’s lowest annual total since 2013. (Figure 2)
Under Construction. Total units under-construction peaked in Q1 2023 at 51,035. As of Q4 2024, the count had fallen to 24,996, half of the Q1 2023 peak. (Figure 3)
Completions. Multifamily completions are falling dramatically. After 2024’s record level of 31,233 units, 16,646 completions are projected for 2025 –43.0% below 2024. Only 8,104 units should be delivered in 2026.
Figure 2
Figure 3
starting new deals remains challenging
The level of new multifamily supply in 2027 and the following years is being governed by current market conditions and today’s governmental policy. Getting new deals done is very challenging and, with limited institutional capital available, multifamily deliveries will remain muted in 2027 and 2028.
Development costs remain high, and, while there appears to be some loosening on nonurban site acquisition prices, prices on the best urban sites have not budged. Underwriting new development at today’s reduced rents is challenging for all multifamily locations and product types.
Additionally, despite the long-term robust demand for housing and concerns about housing affordability, local development policies are not making it easier to build multifamily housing. One example is the Parkland Dedication Ordinance which came into effect last year and layers on another expense to development. A second example is the Density Bonus 90 (DB90) program which began in 2024. It was designed to help develop higher-density housing in Austin’s urban core, but its inclusionary income requirements have added complexity and reduced revenue potential to those deals.
MARKET FUNDAMENTALS ARE AT AN INFLECTION POINT
Declining construction activity is partly a result of soft market conditions. But, more importantly, the dramatic development slowdown puts into play an important correct in market performance beginning in 2025.
Austin’s recent and current market weakness resulted from too much supply delivered in a short period of time, but not from low demand. Net absorption rose considerably in 2023 and soared to a new peak of 29,515 units in 2024. In fact, last year Austin achieved the fourth highest net absorption total in the U.S. (after New York, Houston, and Dallas/Fort Worth).
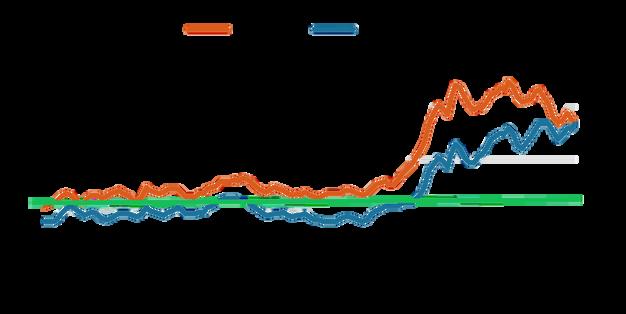
However, over the past few years demand could not keep pace with the elevated new supply thereby causing market softness in 2023 and 2024. In particular, Austin’s average effective rent dropped 13.9% from the Q3 2022 peak to the end of 2024. (Figure 4)
In 2025 and 2026, net absorption is projected to remain at high levels and exceed new supply, thereby reversing recent market trends. Improvement in market conditions is expected from early 2025, with rents stabilizing and owners beginning to pull back on concessions. RealPage calculates that the 2023 and 2024 downward trend in effective rents is stabilizing this quarter (Q1 2025). The firm expects market recovery in 2025 to be primarily in occupancy, and then shift to rental recovery in 2026.
RealPage conservatively forecasts an average annual effective rent increase of 1.6% for the next three years, putting rents back to the pre-COVID trend line. CoStar’s outlook for the next three years is higher at 3.1% on average: 1.1% in 2025, 3.9% in 2026 and 4.3% in 2027.
We believe that with new supply dwindling to historically low levels and multifamily housing demand remaining strong, Austin rents should experience considerably larger increases than these two projections suggest.
SOURCE: EMBREY; Rice Economics, LLC; RealPage as of Q4 2024 Note: We believe effective rents will appreciate faster than these forecasts show
Figure 4
PART 2: AUSTIN GROWTH MACHINE
DRIVES HOUSING DEMAND
Rapid population growth, sustained economic expansion, and Austin’s distinctive culture and emphasis on quality-of-life characteristics form the foundation for why Austin will continue to create high levels of housing demand.
Population Growth. Austin is expected to remain one of the fastest growing metros in the country for the foreseeable future. Among major metros, Austin has consistently ranked at or near the top for both total population increase and rate of change. Austin’s population has doubled since 2000.
Economic Expansion. Due to expansion in nearly every industry, and especially high tech, Austin’s economy has been one of the country’s growth leaders for decades. Given its economic structure with high tech and other “creative class” industries, its highly educated workforce, and its favorable business climate, Austin’s economy is positioned to continue as one of the fastest growing metros in the country.
Appealing Culture. Austin is famous for its music scene, food, emphasis on outdoor activities, and other quality-of-life characteristics that make the metro particularly appealing to young adults and to businesses wanting to recruit the same. Austin’s culture helps retain works and attract new families to town.
AUSTIN IS COUNTRY’S LEADER FOR POPULATION GROWTH
Austin’s population growth is legendary. Forecasts suggest that while the rate of growth will moderate going forward, Austin will remain one of the country’s fastest growing metropolitan areas.
AUSTIN’S POPULATION HAS DOUBLED SINCE 2000
Austin’s 2024 metro population was 2.55 million based on the Census Bureau estimates. Metro population statistics are for the five-county region: Travis, Bastrop, Caldwell, Hays and Williamson counties.
Most recently, between 2020 and 2024, Austin added 267,251 new residents for an 11 7% increase, the fastest growth rate by far among the 55 U.S. metros with 1+ million population. During the same period, U.S. population climbed 2.6%.
Austin’s total 2020-2024 gain ranked sixth highest in the U.S. (after Dallas/Fort Worth, Houston, Phoenix, Miami and Atlanta – metros that are two or three times Austin’s size).
A high percentage of the population growth comes from in-migration (which creates higher levels of housing demand than gains from natural increase). While short-term international migration will likely be curtailed under the current federal administration, domestic migration has the potential to increase in response to job growth.
POPULATION TO RISE TO 3 MILLION BY 2032
Rapid population growth will remain part of Austin’s story. The pace of growth will likely moderate as Austin grows larger but still continue well above national trends. (Figure 5)
The Texas Demographics Center forecasts population to reach 3 million by 2032 and then 4 million by 2046.
Between 2024 and 2030, the metro should add roughly 391,000 new residents, growing at an annual average of 2.4% rate.
Household growth is a proxy for new housing unit demand. The average household size in Austin was 2.36 persons in 2023. Based on this, Texas Demographics Center’s population projection for the 2024-2030 period translates into approximately 166,000 new households.
Figure 5
AUSTIN POPULATION BY DECADE, 2000-2050
SOURCE: EMBREY; Rice Economics, LLC; Census Bureau (historical data); Texas Demographics Center (forecasts as of 2022 which are latest available and based on migration continuing at same pace as 2010-2020; new forecasts to be released spring 2025).
AUSTINITES ARE RELATIVELY YOUNG, HIGHLY EDUCATED,
AND WELL PAID
In addition to high growth rates, many of Austin’s principal demographic characteristics help explain the metro’s attractiveness for corporations as well as the character of the urban environment.
Younger Population. Austin residents, on average, are younger than the U.S. Austin’s median age was 36.3 years in 2023, 2.5 years below than the 38.8 years median for U S population living in metropolitan areas. The lower age is primarily due to Austin having a higher percentage of adults in their 20s and 30s than the nation.
Rising Income. Income for Austinites has risen faster than the U.S. for many years. In 2023, Austin’s median household income was $98,508, 26.7% greater than the national level of $77,719. In 2010, the metro median was $55,744, only 11.4% above the U.S. level.
Austin also has the highest median household income among Texas metros: $98,508 compared to Dallas/Fort Worth’s $86,860, Houston’s $79,463, and San Antonio’s $73,195.
Figure 6
LEADING METROS FOR EDUCATIONAL ATTAINMENT
SOURCE: EMBREY; Rice Economics, LLC; Census Bureau (American Community Survey, 2023). Rank out of 54 metros with 1+ million population.
Educational Attainment. Austin has one of the highest educational levels in the country. As of 2023, 52.1% of the adult population had at least a bachelor’s degree compared to 36.2% nationally. Austin ranked sixth highest among major U.S. metros. (Figure 6)
AUSTIN’S ECONOMIC GROWTH HAS BEEN EXPLOSIVE
AUSTIN IS THE SIXTH BEST U.S. METRO FOR OVERALL ECONOMIC HEALTH OUT OF 203 METROS RANKED.
Austin’s economic growth has been explosive, and the path is set for further exceptional economic expansion. Certainly, national business cycles have impacted the local economy over the years, but the metro’s historical industry cornerstones of state government and education combined with very rapid expansion of high tech, especially over the past decade, have resulted in a level of economic growth rivalled by few other metros.
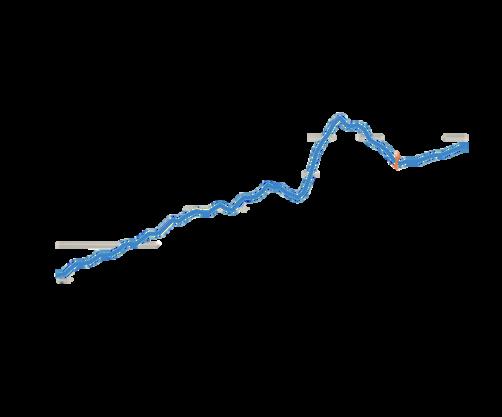
The growth of Austin’s overall economy is well illustrated through gross domestic product. Every year over the past 20+ years, except 2012, Austin’s economic growth has surpassed that of the U S and nearly all years by a wide margin (Figure 7) From 2010 to 2023, Austin’s total GDP more than doubled to $207 billion. The 105.8% increase was nearly three times that of the nation’s 35.0% gain.
SOURCE: EMBREY; Rice Economics, LLC; U.S. Bureau of Economic Analysis. Based on real (adjusted for inflation) GDP totals. Note: 2023 is the latest year available for Austin.
Austin U.S.
OFFICE DEMAND REFLECTS STRENGTHING ECONOMY
A further indication of Austin’s economic health is its return to positive office demand. After a weak 2023 where demand shrunk by 1.2 million square feet, office net absorption totaled 537,955 square feet according to CBRE.
Of the 57 markets tracked by CBRE, only 19 or one-third experienced positive net absorption in 2024 Austin ranked fifth highest for 2024 net office absorption after Manhattan, New Jersey, San Jose, and Nashville.
AUSTIN ACHIEVED THE FIFTH HIGHEST LEVEL OF OFFICE DEMAND IN 2024 OUT OF ALL U.S. MARKETS
EMPLOYMENT CREATION HAS BEEN MOVING AT HIGH SPEED
Austin’s employment growth has been explosive, and few U.S. metros have created as many jobs as Austin over the past several years. Over the past decade:
Total employment rose by 427,500 jobs for a 45% increase. (Figure 8)
Austin’s employment growth rate was more than three times that of the U.S.
Austin ranked first, by far, among all major metros (54 metros with 1+ million population) for rate of job growth. Raleigh and Orlando, with the second and third highest rates, experienced 32% increases.
Austin ranked sixth highest among major metros for total employment gain. The five metros ahead of Austin – Dallas/Fort Worth, Phoenix, Atlanta, Miami and Houston – are all much larger metros.
8
AUSTIN HISTORICAL EMPLOYMENT CHANGE, 2014-2024
SOURCE: EMBREY; Rice Economics, LLC; U.S. Bureau of Labor Statistics.
Figure
EMPLOYMENT GROWTH TODAY IS MORE MODERATE BUT ABOVE THE NATIONAL RATE
Austin employment rose 1.7% in 2024 based on December employment statistics (latest available and not yet subject to annual revisions). This pace is down from the metro’s torrid growth over the past decade but is higher than the national employment expansion of 1.3%.
The more tepid climb in 2024 reflects both short-term softness in high tech hiring as well as a very tight labor market. Austin’s unemployment rate has been consistently low for years and was only 3.1% in December 2024 (U.S. unemployment was 3.8% as of December 2024).
MODERATE EMPLOYMENT GROWTH RATE PROJECTED, BUT REALITY LIKELY TO BE HIGHER
Austin has consistently created more jobs than projected. Going forward, the metro is very likely to continue to surprise forecasters on the upside.
The Texas Workforce Commission’s job forecasts from 2023 (latest available) showed Austin employment growing at an annual rate of 2.2% in the decade from 2022 to 2032.
RealPage’s forecasts (from Q4 2024) reflect an average annual increase of 1.5% over the next five years, translating into a total employment gain of about 104,000 jobs.
CoStar, citing Oxford Economics, also forecasts 1.5% average annual gains for Austin (and 0.5% for the U.S.) over the next five years.
All three projections seem disconnected from Austin’s economic history, current business characteristics and prospects for future economic expansion. We expect employment growth over the next few years to exceed all of these forecasts, barring a national recession.
SILICON HILLS WILL CONTINUE TO FUEL AUSTIN’S ECONOMY
Austin has long been known for its thriving tech industry. Rapid expansion in a diversity of innovative industries in recent years has put the exclamation point on Austin’s tech reputation. Given the presence of these companies plus the skilled workforce, Austin is well situated to continue to attract new high-tech and related companies and fuel major expansions from companies inside and outside Austin.
Over the short term, at least, higher trade tariffs and reshoring could also translate into even more tech jobs coming to Austin.
Austin Ranked First in Country for 2019-2023 Tech Employment Expansion
There are many ways to define tech employment. CBRE’s statistics for “high-tech software and services” employment provides a useful picture. Moreover, the statistics clearly show Austin’s high-tech prowess.
Austin was the 13th largest high-tech metro in 2023 based on CBRE research and the fifth most concentrated high-tech metro. (Figure 9)
Most importantly, Austin ranked first in the country for high-tech employment growth rate in the 20192023 period at 40.9% growth.
Behind these statistics have been many notable hightech headlines. These include impressive expansions by Apple, Tesla, and Samsung in the last few years. Additionally, large high-tech companies like Dell, IBM, Google, Oracle, Amazon, Facebook (Meta), NXP Semiconductor, and Advanced Micro Devices have contributed greatly to Austin’s high-tech supremacy.
Figure 9
LARGEST U.S. HIGH-TECH METROS
SOURCE: EMBREY; Rice Economics, LLC; CBRE (Tech 30 - 2024 report). *High-tech software and services employment, 2023 **High-tech employment as percentage of all office-using employment
Many of Austin’s other large employers have played a role in the development of high-tech industries and/or benefitted from high-tech growth. These include the Texas state government, The University of Texas, and Charles Schwab. State government employed 81,100 people or 5.9% of Austin’s total as of December. UT employs about 24,000 workers; its fall 2024 enrollment established a new record at 53,864 students, up 1.5% from prior year. Charles Schwab has a major operations hub in Austin, a growing centerpiece for Austin’s financial sector.
HIGH-TECH EXPANSION IS NOT ONLY FROM LARGE CORPORATIONS
Austin’s high-tech growth as well as the industry’s potential for further expansion comes not only from large tech companies but also from smaller businesses and start-ups. Venture capital often fuels their growth. Additionally, the venture capital statistics exemplify Austin’s national prominence in high tech. (Figure 10).
Austin came in eighth highest in the country for venture capital investment in the 10-year period from 2015 through 2024. Pitchbook calculates Austin’s total venture capital investment at $34.4 billion, similar to that of Seattle, Chicago, and Denver.
Figure 10
LEADING U.S. METROS FOR VENTURE CAPITAL INVESTMENT
SOURCE: EMBREY; Rice Economics, LLC; Pitchbook *Except Austin which is MSA
Austin has its own culture. And to many, especially younger adults, this culture is very appealing, an important factor for Austin’s demographic and economic growth. At its core, Austinites place a high priority on quality-of-life. Austinites are definitely Texan, down-to-earth, active and enjoy activities outside of work.
Austin, dubbed the “Live Music Capital of the World,” is most well-known for its live music scene including Sixth Street and the South by Southwest and Austin City Lights music festivals. Austinites place a high priority on being able to enjoy the area’s natural beauty. Rapidly emerging are Austin’s food and art scenes. Austin has long been famous for barbeque, but its culinary options today rival those of much larger metros.
Austin’s growing size has also enabled the region to recruit and support professional sports teams and events. Teams include Austin FC (Major League Soccer), Austin Rise FC (women’s professional soccer), and Round Rock Express (Triple-A affiliate of the Texas Ranger). NASCAR hosted its first race in Austin in 2021 at the newly built Circuit of the Americas racetrack.
non-stop air destinations from aus have risen 80% over the past decade
With Austin home to companies and people from all over the U.S. and world, there is a growing demand and need for more air connections. As of March 2025, Austinites can fly non-stop to 88 destinations (75 domestic and 13 international). The destination total is up 80% than 10 years ago when the city had non-stop flights to 44 domestic and only 5 international destinations.
MULTIFAMILY WILL CAPTURE SIGNIFICANT PORTION OF FUTURE HOUSING DEMAND
Multifamily housing will capture a significant portion of the robust housing demand created from Austin’s rapid growth due to high for-sale housing costs, low for-sale housing affordability and a history of relatively low homeownership rates in Austin.
AUSTIN’S HOMEOWNERSHIP RATE IS ONE OF LOWEST IN COUNTRY AT 58%
Austin has historically experienced relatively low levels of homeownership due to its younger population and its more transient nature (a high percentage of population growth coming from in-migration). Austin’s homeownership rate was 58.1% in 2023, well below the U.S. average of 65.2% according to annual Census data. Austin also had the sixth lowest Figure 11
SOURCE: EMBREY; Rice Economics, LLC; National Association of Realtors for single-family home purchases only.
homeownership rate among major U.S. metros. Only high-priced coastal markets of Los Angeles, New York, San Diego, San Jose and San Francisco plus transient (high in-migration) Las Vegas had lower homeownership rates.
FOR-SALE HOUSING IS EXPENSIVE AND UNAFFORDABLE TO MANY AUSTIN HOUSEHOLDS
For-sale housing prices in Austin have nearly doubled over the past decade. The average annual increase was 6.7%, far exceeding inflation levels. (Figure 11) Certainly, Austin was not alone in experiencing high for-sale price increases, and prices have edged down since 2022. Still, current home pricing in Austin is a formidable challenge for rental households considering homeownership. Added to expensive home prices are high mortgage costs, making moving into homeownership even more financially challenging.
One way to view this unaffordability situation is to compare housing costs to income. When housing costs are below 30% of household income, housing is considered affordable. Higher ratios represent unaffordability, and the larger the ratio, the less affordable the housing market. The Federal Reserve Bank of Atlanta calculates that Austin’s median owned housing cost represents 47% of household income today, well above the 30% benchmark. (Figure 12)
SOURCE: EMBREY; Rice Economics, LLC; Federal Reserve Bank of Atlanta. Housing costs are based on median principal and interest payments, mortgage cost, taxes, insurance, and PMI. Ratios higher than 30% are considered unaffordable.
Article Author
Jeanette I. Rice, CRE Rice Economics, LLC
Ms. Rice is one of the country’s leading multifamily economists. She is the founder of Rice Economics, LLC, a consulting firm providing real estate economics and business consulting for commercial real estate firms.
Before Rice Economics, LLC, Ms. Rice was Americas Head of Multifamily Research for CBRE, the largest multifamily debt and equity intermediary in the U.S. At CBRE, Ms. Rice covered nearly all aspects of the U.S. multifamily property and capital markets. She was a frequent speaker at industry events and wrote hundreds of white papers and research briefs on the sector. Her more notable white papers included: The Case for Workforce Housing; The Single-Family Built-to-Rent Housing Sector; The Way Forward – Path to Urban Multifamily Recovery; Global Outlook 2030 – Multifamily; and U.S. Multifamily Primer for Offshore Investors.
Ms Rice began her career in the multifamily sector One of her first positions was with EMBREY Investments where she conducted feasibility analysis for prospective developments and provided investment strategies for EMBREY’s geographic expansion in the 1980s. Following EMBREY, Ms. Rice held research leadership positions with HFF (now part of JLL), Lend Lease Real Estate Investments, Crescent Real Estate Equities and Verde Realty.
Ms. Rice has been involved with many professional organizations throughout her 40-year career. In particular, she has been active with the National Multifamily Housing Council for many years. She is a Counselor of Real Estate and has held numerous leadership positions with the Counselors of Real Estate organization. Ms. Rice currently serves as an advisor to the TCU Center for Real Estate.
Ms Rice earned a B A in history from the University of Washington and M.A. in urban geography from Queen’s University in Canada. She also completed two years of graduate coursework in urban geography at The University of Chicago. Ms. Rice is a 40-year Texas resident, currently living in Fort Worth.
www.embrey.com
50
Years in Business
Current Annual Development Production
Multifamily Units
Delivered
About EMBREY
Units Under Construction or In Development
Units Under Management Equity Currently Managed
San Antonio-based EMBREY is a vertically integrated real estate investment company that develops, builds, acquires, owns and manages multifamily communities and commercial assets in select markets throughout the United States. In 2024, EMBREY celebrates its 50th year in business with 50,000 multifamily units and more than six million square feet of commercial property completed in its history. As a leading developer in the multifamily sector, the company has more than 6,000 units under construction or in development.