Oral Semaglutide : Revolutionizing Diabetes Care with a Patient-Friendly GLP-1 Receptor Agonist
The journey of oral semaglutide represents a significant milestone in diabetes therapeutics. Traditionally, GLP-1 receptor agonists, used for their potent glucose-lowering effects and cardiovascular benefits, have been administered via subcutaneous injections. This method of administration often posed barriers to adherence and patient acceptance due to needle phobia and the inconvenience of injections.
Oral Semaglutide, marketed under the brand name Rybelsus, was developed to overcome these barriers. It is the first oral GLP-1 receptor agonist approved for the treatment of Type 2 Diabetes Mellitus (T2DM). The approval came after extensive clinical trials under the PIONEER program, which assessed its efficacy, safety, and tolerability compared to other antidiabetic agents. The development of oral semaglutide leveraged advances in pharmaceutical technology, specifically the use of an absorption enhancer, Sodium N-[8-(2-hydroxybenzoyl) Amino] Caprylate (SNAC), which facilitates the absorption of semaglutide in the stomach. This innovation addressed the challenge of delivering a peptide drug, which typically degrades in the gastrointestinal tract, through an oral route.
Mechanism of Action :
Semaglutide is a GLP-1 receptor agonist that mimics the incretin hormone GLP-1. It enhances glucose-dependent insulin secretion and inhibits glucagon release, which helps in lowering blood glucose levels. Additionally, it slows gastric emptying and promotes satiety, contributing to weight loss.
The mechanism of action of semaglutide includes —
(1)Stimulation of Insulin Secretion : In response to food intake, semaglutide enhances the secretion of insulin from pancreatic beta cells in a glucose-dependent manner, reducing the risk of hypoglycemia.
(2)Inhibition of Glucagon Release : It suppresses the release of glucagon from alpha cells in the pancreas, decreasing hepatic glucose production.
(3)Gastric Emptying Delay : By slowing gastric emptying, semaglutide helps in reducing postprandial glucose spikes.
(4)Promoting Satiety : It acts on the brain to promote a feeling of fullness, thereby aiding in weight reduction.
Oral semaglutide, using the SNAC technology, is absorbed in the stomach. The SNAC component creates a local high pH environment which protects semaglutide from degradation and enhances its permeability across the gastric epithelium. Once absorbed, it follows the same metabolic pathway as injectable semaglutide, exerting its therapeutic effects systemically.
Advantages of Oral Administration over Injectable Forms :
The oral formulation of semaglutide offers several advantages over its injectable counterparts, which can lead to improved patient adherence and outcomes:
(1)Enhanced Patient Adherence : The oral administration route is generally preferred by patients over injections. This preference can significantly improve adherence to therapy, particularly in those with a fear of needles or an aversion to injections.
(2)Convenience : Oral semaglutide can be easily incorporated into daily routines without the need for special training on injection techniques, storage requirements for injectable formulations, or the discomfort associated with injections.
(3)Early Initiation of Therapy : The convenience and acceptability of an oral GLP-1 receptor agonist can facilitate earlier initiation of therapy in the course of T2DM management. This can be crucial in achieving early glycemic control and reducing the risk of diabetes-related complications.
(4)Reduction of Injection-Related Issues : The oral route eliminates complications related to injections, such as injection site reactions, which can include pain, bruising, and infection . These advantages make oral semaglutide a promising option for many patients with T2DM, particularly those who are averse to injections. It expands the therapeutic options available and aligns with patient preferences, potentially leading to better adherence and improved clinical outcomes.
Oral semaglutide represents a paradigm shift in the management of T2DM, providing the benefits of GLP-1 receptor agonist therapy in a patient-friendly oral formulation. Its development is a testament to the advances in pharmaceutical technology and a significant step forward in diabetes care.
Clinical Efficacy :
Overview of Pivotal Clinical Trials (PIONEER Programme)
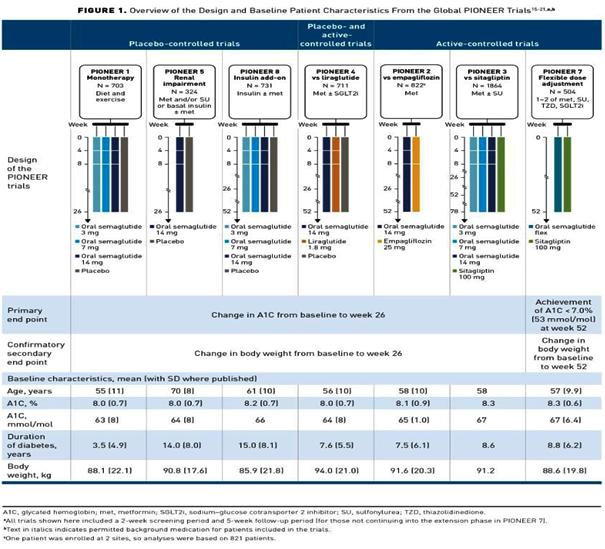
The clinical efficacy of oral semaglutide has been extensively evaluated through the PIONEER program, a series of phase 3 clinical trials designed to assess its safety and effectiveness in managing Type 2 Diabetes Mellitus (T2DM). The PIONEER program includes 10 pivotal trials, each addressing different aspects of oral semaglutide therapy, including its comparison with other antidiabetic agents, its effects in various patient populations, and its cardiovascular outcomes.
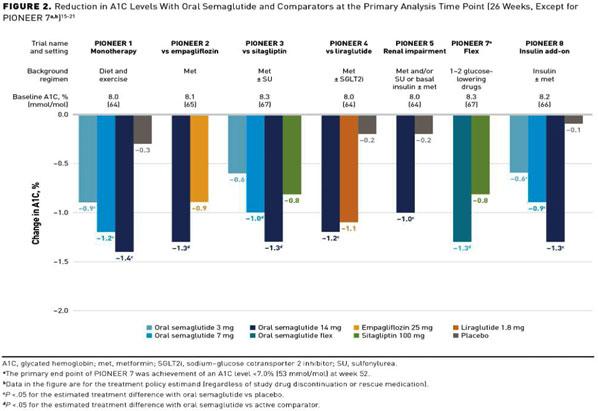
(1)Impact on Glycemic Control (HbA1c Reduction)
The primary endpoint in the majority of the
PIONEER trials was the reduction in HbA1c levels. Oral semaglutide consistently demonstrated superior glycemic control compared to placebo and other active comparators.
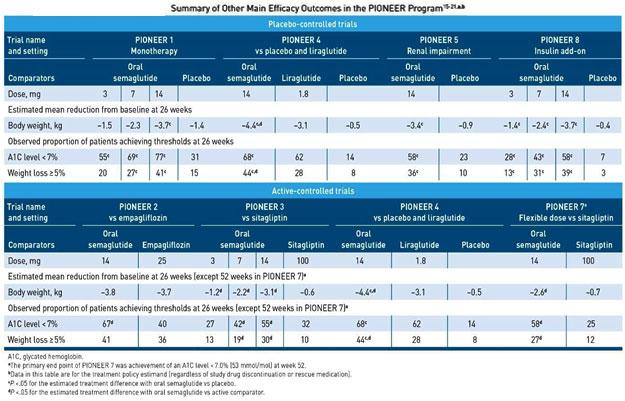
In the PIONEER 1 trial, which evaluated oral semaglutide as monotherapy, patients treated with oral semaglutide 14 mg once daily achieved a mean reduction in HbA1c of 1.5% from baseline, compared to 0.1% with placebo (P<0.001). Similarly, in the PIONEER 2 trial, oral semaglutide 14 mg once daily reduced HbA1c by 1.3% compared to a 0.9% reduction with empagliflozin (P<0.001). The PIONEER 3 trial compared oral semaglutide with sitagliptin, showing a significant reduction in HbA1c of 1.0% versus 0.3% with sitagliptin (P<0.001).
The results of these trials underscore the potent glucose-lowering effect of oral semaglutide, making it a valuable option for achieving glycemic targets in patients with T2DM.
(2)Weight
Loss Benefits
In addition to its effects on glycemic control, oral semaglutide has shown significant benefits in weight reduction, an important consideration for many patients with T2DM. The weight loss effects were consistently observed across the PIONEER trials.
In PIONEER 1, patients treated with oral semaglutide 14 mg once daily experienced an average weight loss of 4.2 kg, compared to 1.2 kg with placebo (P<0.001) . In PIONEER 2, the mean weight reduction was 4.7 kg with oral semaglutide 14 mg once daily, versus 3.1 kg with empagliflozin (P<0.001). PIONEER 4, which compared oral semaglutide with subcutaneous liraglutide, reported a weight loss of 4.3 kg for oral semaglutide 14 mg daily, compared to 3.0 kg for liraglutide (P<0.001) .
These findings highlight the dual benefits of oral semaglutide in managing both blood glucose levels and body weight, offering a comprehensive therapeutic advantage for patients with T2DM. Table 1 summarises the key results of PIONEER trials.
The safety and tolerability profile of oral semaglutide is generally consistent with other GLP-1 receptor agonists, with gastrointestinal adverse events being the most commonly reported. In clinical trials, nausea, vomiting, and diarrhea were frequently observed, particularly during the initial weeks of treatment as the body adjusts to the medication.
(1)Nausea : Nausea was the most frequently reported adverse event, affecting a significant portion
Table1 — Overview of PIONEER Trials for Oral Semaglutide
PIONEER ComparisonDuration Primary OutcomeMeanWeightReference Trial(weeks)HbA1c Loss Reduction(%)(kg)
PIONEER 1Placebo26 HbA1c Reduction1.54.2Aroda VR, et al. Diabetes Care 2019; 42:1724-32.
PIONEER 3Sitagliptin78HbA1c Reduction1.02.6Rosenstock J, et al. JAMA. 2019;321:1466-80.
PIONEER 4Liraglutide52HbA1c Reduction1.24.3Pratley R, et al. Lancet. 2019;394:39-50.
PIONEER 5Placebo26 HbA1c Reduction1.02.3Mosenzon O, et al. Lancet Diabetes Endocrinol. 2019;7:515-27.
PIONEER 6Placebo 104CardiovascularN/AN/AHusain M, et al. N Engl J Med. 2019;381:841-851. Outcomes
PIONEER 7Sitagliptin52HbA1c Reduction1.32.9Pieber TR, et al. Lancet Diabetes Endocrinol. 2019;7:528-39.
PIONEER 8Placebo52 HbA1c Reduction0.92.0Zinman B, et al. Diabetes Care. 2019;42:2262-71.
PIONEER 9Liraglutide26HbA1c Reduction1.63.8Yamada Y, et al. J Diabetes Investig. 2019;10:30.
PIONEER 10Dulaglutide52HbA1c Reduction1.43.0Yabe D, et al. J Diabetes Investig. 2019;10:30.
of patients. In the PIONEER 1 trial, 20% of patients treated with oral semaglutide 14 mg experienced nausea, compared to 3% in the placebo group. Similarly, in the PIONEER 2 trial, nausea was reported in 16% of patients receiving oral semaglutide 14 mg compared to 5% of those on empagliflozin.
(2) Vomiting : Vomiting was less common than nausea but still reported at a higher incidence than with placebo or some other comparators. In PIONEER 4, 8% of patients on oral semaglutide 14 mg experienced vomiting, compared to 2% in the placebo group and 4% in the liraglutide group.
(3) Diarrhea : Diarrhea was another common gastrointestinal side effect. In the PIONEER 3 trial, 9% of patients on oral semaglutide 14 mg reported diarrhea, versus 4% in the sitagliptin group.
These gastrointestinal side effects were generally mild to moderate in severity and tended to diminish over time. A gradual dose-escalation strategy can help mitigate these adverse events.
(B) Comparison with Other GLP-1 Receptor Agonists —
When compared with other GLP-1 receptor agonists, oral semaglutide shows a similar safety profile, but with some variations in the incidence of gastrointestinal adverse events.
(A) Liraglutide : In the PIONEER 4 trial, oral semaglutide 14 mg had a comparable incidence of nausea and vomiting to liraglutide 1.8 mg, with nausea reported in 20% of patients on oral semaglutide versus 19% on liraglutide . Vomiting was reported in 8% of patients on oral semaglutide compared to 6% on liraglutide.
(2) Dulaglutide : The PIONEER 10 trial compared oral semaglutide with dulaglutide and found similar rates of gastrointestinal adverse events. Nausea was reported in 15% of patients on oral semaglutide 14 mg and 12% of those on dulaglutide 1.5 mg.
(3) Exenatide and Other GLP-1 Agonists : Similar rates of gastrointestinal side effects have been
reported with other GLP-1 receptor agonists like exenatide. However, the oral administration of semaglutide offers a more convenient option, which may enhance patient adherence despite the comparable side effect profile.
Overall, the incidence and severity of gastrointestinal adverse events with oral semaglutide are consistent with those observed with subcutaneous GLP-1 receptor agonists. The key to managing these side effects lies in patient education and gradual dose titration.
(C) Long-Term Safety Data —
Long-term safety data for oral semaglutide have been evaluated primarily through the PIONEER 6 trial, a cardiovascular outcomes trial that provided insights into the extended safety profile of this medication.
(1) Cardiovascular Safety : The PIONEER 6 trial demonstrated that oral semaglutide does not increase the risk of Major Adverse Cardiovascular Events (MACE) compared to placebo. The trial included patients at high cardiovascular risk and found a nonsignificant reduction in the composite endpoint of cardiovascular death, nonfatal myocardial infarction, and nonfatal stroke (Hazard Ratio [HR] 0.79; 95% CI 0.57-1.11).
(2) Mortality : All-cause mortality was lower in the oral semaglutide group compared to placebo, with an odds ratio (OR) of 0.58 (95% CI 0.37-0.92). Cardiovascular mortality was also reduced (OR 0.55, 95% CI 0.31-0.98).
(3) Diabetic Retinopathy : Concerns about diabetic retinopathy have been raised with GLP-1 receptor agonists. However, the PIONEER trials indicated no significant increase in the incidence of diabetic retinopathy with oral semaglutide compared to placebo or active comparators. Further studies are needed to fully understand the long-term impact on diabetic retinopathy, particularly in patients with preexisting retinopathy.
(4) Pancreatitis and Other Serious Adverse Events : The incidence of acute pancreatitis was low and not significantly different between oral semaglutide and comparators in the PIONEER trials. Similarly, there was no increased risk of severe hypoglycemia or other serious adverse events attributable to oral semaglutide .
In summary, oral semaglutide has a safety profile comparable to other GLP-1 receptor agonists, with the most common adverse events being gastrointestinal in nature. Long-term data from the PIONEER program support its cardiovascular safety and overall tolerability, making it a viable option for the management of T2DM.
Cardiovascular Outcomes :
(A) Cardiovascular Safety and Benefits
Oral semaglutide, like other GLP-1 receptor agonists, has shown promising cardiovascular safety and benefits, particularly in reducing Major Adverse Cardiovascular Events (MACE). The PIONEER 6 trial, a dedicated cardiovascular outcomes trial, provided substantial evidence supporting the cardiovascular safety of oral semaglutide. This trial included patients with Type 2 Diabetes Mellitus (T2DM) who were at high cardiovascular risk and aimed to demonstrate that oral semaglutide does not increase the risk of cardiovascular events compared to placebo.
(B) PIONEER 6 Trial Results
The PIONEER 6 trial was a randomized, doubleblind, placebo-controlled trial designed to evaluate the cardiovascular safety of oral semaglutide in patients with T2DM. The primary endpoint was the first occurrence of a Major Adverse Cardiovascular Event (MACE), which included cardiovascular death, nonfatal myocardial infarction, or nonfatal stroke.
Trial Design and Population : The trial enrolled 3,183 patients with T2DM and high cardiovascular risk. Participants were randomly assigned to receive oral semaglutide or placebo in addition to standard care.
Primary Endpoint : The primary composite endpoint (MACE) occurred in 3.8% of patients in the oral semaglutide group compared to 4.8% in the placebo group (Hazard Ratio [HR], 0.79; 95% CI, 0.57 to 1.11).
Although the trial was not powered for superiority, the results suggested a numerical reduction in MACE with oral semaglutide.
Secondary Endpoints : Cardiovascular death occurred in 0.9% of patients in the oral semaglutide group compared to 1.9% in the placebo group (HR, 0.55; 95% CI, 0.31 to 0.98).
Nonfatal myocardial infarction occurred in 2.3%
of patients in both groups (HR, 1.18; 95% CI, 0.73 to 1.90).
Nonfatal stroke occurred in 0.8% of patients in the oral semaglutide group compared to 1.0% in the placebo group (HR, 0.74; 95% CI, 0.35 to 1.57).
All-Cause Mortality : All-cause mortality was lower in the oral semaglutide group compared to the placebo group (HR, 0.58; 95% CI, 0.37 to 0.92).
Implications for Patients with High Cardiovascular Risk.
The results from the PIONEER 6 trial have significant implications for the management of patients with T2DM who are at high cardiovascular risk.
(C) Cardiovascular Safety
The trial confirmed that oral semaglutide does not increase the risk of major adverse cardiovascular events, thus supporting its cardiovascular safety profile.
This finding is consistent with the cardiovascular benefits observed with other GLP-1 receptor agonists, such as liraglutide and injectable semaglutide.
Potential Cardiovascular Benefits : While the trial was not powered to demonstrate superiority, the numerical reduction in cardiovascular events suggests potential cardiovascular benefits of oral semaglutide.
The significant reduction in cardiovascular death and all-cause mortality provides further support for the use of oral semaglutide in patients at high cardiovascular risk .
Clinical Implications : The cardiovascular safety profile of oral semaglutide makes it a viable option for T2DM patients, especially those with established cardiovascular disease or at high cardiovascular risk.
The convenience of oral administration may improve adherence to GLP-1 receptor agonist therapy, potentially leading to better cardiovascular outcomes in the long term.
Comparative Effectiveness :
The PIONEER trials provide extensive data on the comparative effectiveness of oral semaglutide against other antidiabetic agents, including SGLT-2 inhibitors, DPP-4 inhibitors, and other GLP-1 receptor agonists. These head-to-head comparisons as shown in Table 2 highlight the advantages of oral semaglutide in terms of glycemic control, weight loss, and adverse event profiles.
Advantages Over SGLT-2 Inhibitors, DPP-4 Inhibitors, and Other GLP-1 Receptor Agonists— (1) Advantages Over SGLT-2 Inhibitors (eg, Empagliflozin)
Glycemic Control : In the PIONEER 2 trial, oral semaglutide demonstrated a greater reduction in
Table 2 — Head-to-Head Comparisons with Other Antidiabetic Agents
PIONEER 2Empagliflozin1.34.716Rodbard HW, et al. Diabetes Care. 2019;42(12):2272-2281.
PIONEER 3Sitagliptin1.02.69Rosenstock J, et al. JAMA. 2019;321:1466-1480.
PIONEER 4Liraglutide1.24.320Pratley R, et al. Lancet. 2019;394:39-50.
PIONEER 7Sitagliptin1.32.911Pieber TR, et al. Lancet Diabetes Endocrinol. 2019;7:528-539.
HbA1c compared to empagliflozin (1.3% versus 0.9%).
Weight Loss : Patients on oral semaglutide experienced more significant weight loss than those on empagliflozin (4.7 kg versus 3.1 kg) .
Adverse Events : While gastrointestinal adverse events were more frequent with semaglutide, the overall tolerability was similar when considering the benefits of weight loss and glycemic control.
(2) Advantages Over DPP-4 Inhibitors (eg, Sitagliptin)
Glycemic Control : In both PIONEER 3 and PIONEER 7 trials, oral semaglutide showed superior HbA1c reductions compared to sitagliptin (1.0% versus 0.3% and 1.3% versus 0.8%, respectively).
Weight Loss : Oral semaglutide led to greater weight loss compared to sitagliptin (2.6 kg versus 1.1 kg in PIONEER 3 and 2.9 kg versus 0.6 kg in PIONEER 7).
Adverse Events : Gastrointestinal events were more common with semaglutide, but its benefits in weight reduction and glycemic control outweigh these side effects for many patients.
(3) Advantages Over Other GLP-1 Receptor Agonists (eg, Liraglutide)
Glycemic Control : In the PIONEER 4 trial, oral semaglutide provided similar HbA1c reductions compared to liraglutide (1.2% versus 1.1%).
Weight Loss : Oral semaglutide showed comparable weight loss benefits to liraglutide (4.3 kg versus 3.8 kg) .
Adverse Events : The incidence of gastrointestinal side effects was similar, with nausea being the most common. However, the oral route of administration may improve adherence compared to the injectable form of liraglutide.
Patient Adherence and Quality of Life :
Impact of Oral Formulation on Patient
Adherence
One of the significant advantages of oral semaglutide over injectable formulations of GLP-1 receptor agonists is its potential to improve patient adherence. Medication adherence is a critical factor
in the management of chronic conditions such as Type 2 Diabetes Mellitus (T2DM). Non-adherence to prescribed medication regimens can lead to suboptimal glycemic control, increased risk of complications, and higher healthcare costs.
Convenience and Ease of Use : Oral semaglutide offers a convenient alternative to injections, which can be a barrier to adherence for many patients. The ease of swallowing a pill compared to administering an injection can significantly improve the willingness of patients to initiate and continue therapy.
Reduced Injection-Related Anxiety : Needle phobia and discomfort associated with injections can deter patients from adhering to injectable therapies. Oral semaglutide eliminates the need for needles, reducing the anxiety and discomfort that some patients experience with injectable GLP-1 receptor agonists.
Simplified Treatment Regimen : The oral formulation allows for a simplified treatment regimen, which can enhance adherence. Patients can integrate oral semaglutide into their daily routine without the need for special storage or administration techniques associated with injectable medications.
122, No 10, October 2024Journal
Patient Preferences and Satisfaction :
The preference for oral medication over injections is well-documented in the literature. Patient satisfaction is influenced by multiple factors, including the route of administration, frequency of dosing, and perceived efficacy and safety of the medication.
(1)Preference for Oral Medication: Surveys and studies have shown that patients with T2DM generally prefer oral medications over injectable therapies. This preference is driven by the desire for convenience, ease of use, and avoidance of pain or discomfort associated with injections.
In a survey conducted among patients with T2DM, a significant proportion indicated a preference for oral semaglutide over injectable GLP-1 receptor agonists, highlighting the importance of patient-centric treatment options.
(2)Satisfaction with Treatment : Treatment satisfaction encompasses several dimensions, including efficacy, side effects, and ease of use. Patients treated with oral semaglutide have reported high levels of satisfaction due to its effective glycemic control and weight loss benefits, combined with the convenience of oral administration.
In clinical trials, patient-reported outcomes have indicated greater satisfaction with oral semaglutide compared to other treatments, underscoring the positive impact on patient experiences.
Quality of Life Improvement :
Managing T2DM effectively involves not only controlling blood glucose levels but also enhancing the overall quality of life for patients. Quality of life improvements are a critical aspect of comprehensive diabetes care.
(1)Improved Glycemic Control : Effective glycemic control with oral semaglutide leads to a reduction in diabetes-related symptoms and complications, contributing to a better quality of life. Patients achieving target HbA1c levels often experience fewer symptoms of hyperglycemia and hypoglycemia.
(2)Weight Loss Benefits : Weight loss is a significant benefit of GLP-1 receptor agonists, including oral semaglutide. Weight reduction can lead to improvements in physical health, mobility, and selfesteem, which are important components of quality of life.
Patients who experience weight loss with oral semaglutide often report enhanced physical functioning and reduced limitations in daily activities, contributing to overall well-being.
(3)Reduced Cardiovascular Risk : Oral semaglutide has been shown to have cardiovascular
benefits, reducing the risk of major adverse cardiovascular events. Improved cardiovascular health directly correlates with better quality of life, as it reduces the burden of cardiovascular disease and associated complications.
(4)Mental Health and Emotional Well-Being: The anxiety and stress associated with managing a chronic condition like T2DM can impact mental health. By providing a convenient and effective treatment option, oral semaglutide can reduce the mental burden of diabetes management, leading to improvements in emotional well-being.
Patient-reported outcomes have shown that those using oral semaglutide experience less diabetesrelated distress and a more positive outlook on their health and treatment regimen.
Administration and Practical Considerations :
Dosing Regimen and Administration Guidelines : Oral semaglutide is indicated as an adjunct to diet and exercise to improve glycemic control in adults with Type 2 Diabetes Mellitus (T2DM). The recommended dosing regimen and administration guidelines are critical for ensuring the medication’s efficacy and minimizing adverse effects.
The initial dosing schedule begins with 3 mg once daily for 30 days to allow the body to adjust and to minimize gastrointestinal side effects. After 30 days, the dose should be increased to 7 mg once daily. If further glycemic control is required, the dose can be increased to 14 mg once daily after an additional 30 days. Dosing schedule and administration instructions are described in Table 3.
Challenges and Solutions for Effective Absorption :
Effective absorption of oral semaglutide is essential to achieve its therapeutic benefits. Several factors can influence its absorption, and practical solutions can help mitigate these challenges :
(1)Gastric Emptying : Oral semaglutide delays gastric emptying, which can impact the absorption of other oral medications. Patients should closely follow administration instructions to mitigate this effect.
(2)Timing with Other Medications : To avoid interactions, patients should take oral semaglutide at least 30 minutes before any other oral medications. This helps ensure that the semaglutide is absorbed effectively before other drugs are introduced into the digestive system .
(3)Hydration : Taking semaglutide with more than 4 ounces of water or any other beverage can reduce its absorption. Patients should be instructed to take it with only a small amount of plain water.
Table 3 — Dosing Schedule and Administration Instructions
3 mgOnce dailyTake at least 30 minutes before the firstAfter 30 days on the 3 mg dose,Swallow tablets whole. for 30 daysfood, beverage, or other oral medicationsincrease the dose toDo not cut, crush, of the day with no more than 4 ounces of plain water.7 mg once daily.or chew tablets.
7 mgOnce dailyTake at least 30 minutes before the firstIf additional glycemic control is Swallow tablets whole. food, beverage, or other oral medications of the dayneeded after at least 30 daysDo not cut, crush, or with no more than 4 ounces of plain water.on the 7 mg dose, increase thechew tablets. dose to 14 mg once daily.
14 mgOnce dailyTake at least 30 minutes before the firstN/ASwallow tablets whole. food, beverage, or other oral medications of the dayDo not cut, crush, with no more than 4 ounces of plain water.or chew tablets.
Patient Education and Support :
Patient education and support are crucial for optimizing the benefits of oral semaglutide and ensuring adherence to the treatment regimen :
(A) Understanding the Regimen : Patients should be thoroughly informed about the dosing schedule, the importance of taking the medication on an empty stomach, and the required waiting period before eating or taking other medications. This information helps patients understand the necessity of strict adherence to the administration guidelines.
(B) Managing Side Effects : Common side effects, such as nausea and vomiting, should be discussed with patients. They should be provided with strategies to manage these effects and encouraged to contact their healthcare provider if they experience severe or persistent symptoms. Starting with a lower dose and gradually increasing can help manage these side effects effectively.
(C) Support Resources : Providing patients with access to support resources, such as educational materials and patient support programs, can help them better understand their treatment and manage their condition effectively. Resources should include contact information for healthcare providers and patient hotlines.
Economic Considerations :
(A) Cost-Effectiveness Analysis
The cost-effectiveness of oral semaglutide has been evaluated in various studies, highlighting its economic value compared to other antidiabetic treatments. Table 4 summarizes key findings from the relevant studies.
Conclusion: Oral semaglutide is cost-effective compared to several other treatments. However, the cost per QALY is higher compared to Empagliflozin.
(2) Feng, et al (2023):
Population: China Cost per QALY: $39,853.22
Comparators: Placebo, Injectable GLP-1 RAs
Conclusion: Oral semaglutide is cost-effective compared to placebo and several injectable GLP1 RAs at a reduced price. The study emphasizes the need for further price reductions to enhance cost-effectiveness.
(B) Impact on Healthcare Costs
Oral semaglutide’s impact on healthcare costs is significant due to its ability to improve glycemic control and reduce diabetes-related complications, which can lead to substantial long-term savings:
(1) Reduction in Complications
Oral semaglutide has demonstrated efficacy in reducing major adverse cardiovascular events (MACE) and improving overall glycemic control. This reduction in complications can decrease the need for hospitalizations and other costly medical interventions.
(2) Hospitalization and Treatment Costs : Improved glycemic control and weight management can lead to lower healthcare costs by reducing the incidence of diabetes-related
Table 4 — A Few Cost Effectiveness Analysis Studies StudyPopulationCost per QALYComparatorsConclusion Guzauskas, et al. 2021US$117,500Sitagliptin, Empagliflozin,Cost-effective compared to several other Liraglutide treatments, but higher than Empagliflozin Feng, et al. 2023China$39,853.22Placebo, Injectable Cost-effective compared to placebo and GLP-1 RAsseveral injectable GLP-1 RAs at a reduced price
complications. Effective management with oral semaglutide may translate to fewer emergency visits and hospital admissions .
(C) Insurance and Reimbursement Issues
Ensuring access to oral semaglutide involves navigating insurance coverage and reimbursement policies:
(1)Coverage Variability : Insurance coverage for new medications like oral semaglutide can vary widely. Inclusion in formularies and understanding patient coverage options are critical for ensuring access.
(2)Prior Authorization : Many insurance plans may require prior authorization for oral semaglutide, necessitating detailed documentation from healthcare providers to justify its use based on medical necessity and patient benefit.
(3)Patient Assistance Programs : Pharmaceutical companies often provide patient assistance programs to help those who cannot afford their medications. Information on these programs should be made readily available to patients and healthcare providers to ensure access to treatment .
Future Directions and Research : Ongoing and Future Clinical Trials
Research into oral semaglutide continues to
expand, focusing on its long-term efficacy, safety, and potential new applications. Several ongoing and future clinical trials aim to address these areas:
(1) Long-Term Efficacy and Safety : Studies are underway to assess the long-term efficacy and safety of oral semaglutide beyond the typical trial durations. These studies aim to provide more comprehensive data on the sustainability of glycemic control and weight loss, as well as the long-term impact on cardiovascular health and other diabetes-related complications.
(2) New Indications : Researchers are exploring the potential use of oral semaglutide for other conditions beyond type 2 diabetes. This includes investigating its effects on prediabetes, obesity, and even Non-alcoholic Steatohepatitis (NASH), given its impact on weight loss and metabolic parameters.
(3) Comparative Effectiveness : Future trials are planned to compare oral semaglutide directly with other emerging diabetes treatments, including newer GLP-1 receptor agonists, dual agonists, and SGLT-2 inhibitors, to further establish its place in therapy. Potential New Indications and Formulations :
(1) Indications : Beyond type 2 diabetes, there is interest in evaluating oral semaglutide for weight
122, No 10, October 2024Journal
management in patients without diabetes, given its significant impact on weight reduction. Studies are also looking at its potential in reducing cardiovascular events in high-risk populations without diabetes.
(2) Formulations : Future research may lead to new formulations of oral semaglutide that improve its bioavailability and patient compliance. This could include different dosing strategies, combination therapies with other antidiabetic agents, or formulations that reduce gastrointestinal side effects. Research on Long-Term Effects and Real-World Data :
Long-Term Effects :
(1) Long-term studies are critical to understanding the effects of chronic use of oral semaglutide, particularly regarding its impact on diabetic retinopathy, renal function, and cardiovascular health over several years.
(2) Real-World Data: Real-world evidence is being gathered to complement clinical trial data, providing insights into the medication’s performance in routine clinical practice. This includes data on adherence, effectiveness in diverse populations, and long-term safety.
Conclusion :
Oral semaglutide represents a significant advancement in the management of type 2 diabetes, offering an effective oral alternative to injectable GLP1 receptor agonists. Key findings from the literature highlight its efficacy in reducing HbA1c, promoting weight loss, and providing cardiovascular benefits. The medication’s safety profile is consistent with that of other GLP-1 receptor agonists, with gastrointestinal issues being the most common adverse events.
Clinical Implications for Healthcare Providers: For healthcare providers, oral semaglutide offers a valuable option for patients who prefer oral medications over injections, potentially improving adherence and outcomes. It is important to educate patients on the correct administration to ensure maximum absorption and efficacy. Monitoring for side effects and adjusting doses as needed will help manage adverse reactions and optimize therapy.
Future Outlook for Oral Semaglutide in Diabetes Management : The future of oral semaglutide in diabetes management is promising, with ongoing research likely to expand its indications and improve formulations. As more data become available from long-term studies and real-world evidence, the role of oral semaglutide will be further clarified, potentially leading to broader use in diabetes care and other metabolic conditions.
FURTHER READINGS
1Avgerinos I, Michailidis T, Liakos A Oral semaglutide for type 2 diabetes: A systematic review and meta-analysis. Diabetes Obes Metab 2019; 21(2): 351-9. DOI: 10.1111/ dom.13899.
2Husain M, Birkenfeld AL, Donsmark M — Oral semaglutide and cardiovascular outcomes in patients with type 2 diabetes. N Engl J Med 2019; 381: 841-51. DOI: 10.1056/ NEJMoa1901118.
3Zinman B, Aroda VR, Buse JB — Efficacy, safety, and tolerability of oral semaglutide versus placebo added to insulin ± metformin in patients with type 2 diabetes: The PIONEER 8 trial. Diabetes Care 2019; 42(12): 2262-71. DOI: 10.2337/ dc19-0898.
4Rodbard HW, Rosenstock J, Canani LH — Oral semaglutide versus empagliflozin in patients with type 2 diabetes uncontrolled on metformin: The PIONEER 2 trial. Diabetes Care 2019; 42(12): 2272-81. DOI: 10.2337/dc19-0883.
5Rosenstock J, Allison D, Birkenfeld AL — Effect of additional oral semaglutide vs sitagliptin on glycated hemoglobin in adults with type 2 diabetes uncontrolled with metformin alone or with sulfonylurea: The PIONEER 3 randomized clinical trial. JAMA 2019; 321(15): 1466-1480. DOI: 10.1001/jama.2019.2942.
6Pratley R, Aroda VR, Lingvay I — Oral semaglutide versus subcutaneous liraglutide and placebo in type 2 diabetes (PIONEER 4): A randomized, double-blind, phase 3a trial. Lancet 2019; 394(10192): 39-50. DOI: 10.1016/S01406736(19)31271-1.
7Aroda VR, Rosenstock J, Terauchi Y — PIONEER 1: Randomized clinical trial comparing the efficacy and safety of oral semaglutide monotherapy with placebo in patients with type 2 diabetes. Diabetes Care 2019; 42(9): 1724-32. DOI: 10.2337/ dc19-0882.
8Yamada Y, Katagiri H, Hamamoto Y — Efficacy and safety of oral semaglutide monotherapy versus placebo or liraglutide in Japanese patients with type 2 diabetes (PIONEER 9): An open-label, randomized, phase 3a trial. Diabetes Obes Metab 2019; 21(12): 2825-34. DOI: 10.1111/dom.13828.
9Pieber TR, Binder C, Haddouche M — Efficacy and safety of oral semaglutide with flexible dose adjustment versus sitagliptin in type 2 diabetes (PIONEER 7): A multicenter, open-label, randomized, phase 3a trial. Lancet Diabetes Endocrinol 2019; 7(7): 528-39. DOI: 10.1016/S2213-8587(19)30194-3.
10RYBELSUS (semaglutide) tablets, for oral use. Initial U.S. Approval: 2019. Full Prescribing Information.
11Guzauskas GF, Rind DM, Fazioli K — Cost-effectiveness of oral semaglutide added to current antihyperglycemic treatment for type 2 diabetes. J Manag Care Spec Pharm 2021; 27(4): 455-68.
12Feng Z, Tong WK, Zhang X, Tang Z — Cost-effectiveness analysis of once-daily oral semaglutide versus placebo and subcutaneous glucagon-like peptide-1 receptor agonists added to insulin in patients with type 2 diabetes in China. Front Pharmacol 2023; 14: 1226778.
14Helena W — Efficacy of Oral Semaglutide: Overview of the PIONEER Clinical Trial Program and Implications for Managed Care.
1Hony Editor, JIMA Sanjoy Banerjee1 2MD, DM (Clinical Pharmacology) Shambo S Samajdar2 PG Dip Endo & Diabetes (RCP), Fellowship in Respiratory and Critical Care (WBUHS), Fellow Diabetes India, Fellow Indian Pharmacological Society; Independent Clinical Pharmacologist Consultant Physician
Original Article
The Relationship between Bruxism in Children and the Psychosocial Status of
their Parents
Masoumeh Khataminia1, Razie Meshki2, Marzieh Araban3, Maede Faratseh4
Background : Bruxism is a disorder characterized by abnormal tooth wear due to grinding, which harms children. The leading cause of Bruxism is unknown; however, children often do it in stressful situations.
Aims and Objectives : This study aimed to investigate the relationship between Bruxism in children aged 4-10 years and the Psychosocial status of their parents.
Methods: A total of 200 children aged 4 to 10 years referred to the paediatric ward of Ahvaz Dental School together with their parents (either mother or father) were randomly selected to complete the questionnaires and entered into the present cross-sectional study. The researchers used DASS21 and Rozenberg questionnaires to collect data. They performed Statistical analysis using Chi-square, t-test and SPSS 20.
Results : The mean scores of depression, anxiety and stress in parents of children with Bruxism were significantly higher than in parents with a healthy child (P<0.001). Also, there was a statistically significant relationship between the degree of Depression, Anxiety and Stress of parents and the incidence of bruxism in children (P<0.001). There was no significant relationship between parents’ education level and the incidence of bruxism in children. In contrast, parents’ employment status can significantly play a role in the incidence of Bruxism in their children (P=0.01).
Conclusion : Considering the relationship between parents’ psychosocial status and children with Bruxism disorder, it seems necessary to provide educational programs and counseling to parents in this field.
Key words :Bruxism, Children, Psychosocial Status.
Oral habits such as bruxism (tooth grinding) are a kind of dental disorders in children under ten years old1. Bruxism is characterized by abnormal tooth wear resulting from grinding and clenching of the jaw muscles. Bruxism multiplies harm to oral health by damaging oral tissues2. Bruxism may be caused by Genetic, Physiological, Environmental and Psychological conditions. The latest studies rejected the theory that occlusal interactions can cause Bruxism3. Kato and Rompre4 reported the role of autonomic nerves in people’s jaws with Bruxism using electroencephalogram measurements. Vanderas and Manetas5 reported that catecholamine levels in urine and the incidence of Bruxism in children were directly related to their stress levels. Stress and anxiety can cause both types of Bruxism; however, depression is associated only with awake Bruxism6. One of the reasons for stress in children is the psychological condition of their parents. Studies show that mental
Department of Pedodontics, Jundishapur University of Medical Sciences, Ahvaz, Khuzestan, Iran
1MD, Assistant Professor
2MD, Assistant Professor and Corresponding Author
3MD, Associate Professor, Department of Public Health, Faculty of Health
4MD, Dentist, Department of School of Dentistry
Received on : 31/07/2022
Accepted on : 26/04/2023
[J Indian Med Assoc 2024; 122(10): 21-5]
Editor's Comment :
The level of Depression, Anxiety and Stress in parents of children with bruxism were significantly higher than those with healthy children.
In contrast, the mean self-esteem score was lower in parents of children with bruxism.
Due to the impact of poor psychosocial status of parents on the incidence of bruxism in their children, it seems necessary to provide educational programs by dental and mental health professionals to parents.
disorders in parents can directly cause mental disorders in their children7,8. Accordingly, the poor mental state of the parents can develop Bruxism in children. Thus, the present study aimed to investigate the relationship between bruxism in children aged 410 years referred to the paediatric ward of Ahvaz Dental School with psychosocial issues of their parents.
MATERIALS AND METHODS
Participants : The Research Ethics Committee approved this cross-sectional study of Ahwaz Jundishapur University of Medical Sciences. Among the children referred from other general or specialist dentists or they had come for treatment or check-ups themselves to the dental school during one year, 597 were eligible for the study.
Inclusion Criteria :
The inclusion criteria in the study were clinically healthy children aged between 4 to 10 (This group is the most referred to the faculty) with or without Bruxism. One of the reasons for bruxism is toothache and periapical infection. Concerning the aim of study, we excluded cases with disorders such as caries in dentin , children with systemic diseases or parasitic disease, history of trauma, dental pain, extensive stage caries (distinct cavitation exposing visible dentin)8, having prosthetic or orthodontic appliance which causes functional movements of the Mandible, Allergic Rhinitis, Sleep Obstructive Apnea, Malocclusion, Mental Retardation, Autism or Cerebral Palsy; taking medications that may affect the muscular activity such as antihistamin, anxiolytic, homeopathic or medications with suppressive effect on the Central Nervous System, uncooperative behavior, undergoing orthodontic treatment, otorhinolaryngological treatment or speech therapy and reluctance of parents to complete the questionnaire.
Instrumental and self-reported evaluation of Bruxism are primary tools in Bruxism studies and clinical practice9,10
According to the parents’ reports, 135 of the eligible participants in the study had Bruxism, 100 of them completed the questionnaire so, children were randomly selected as the control group (n=100).
Data were collected using DASS21 and Rozenberg questionnaires. To evaluate the validity of the study content, questionnaires were distributed among 9 Assistant professors and Bruxism experts at Pedodontics Department of Jundishapur Dental School.
Parents filled out questionnaires being guided by a final year psychology student (who was not part of the research team) to complete it correctly. He helped them during this process.
Research Tools :
Researchers have used The DASS21 and Rozenberg questionnaires to measure Depression, Anxiety, Stress and Self-esteem, respectively. The DASS 21 questionnaire includes 21 questions for three components of depression, anxiety and stress with7 questions each component asks. The final scores are obtained through the sum of the scores. A score of zero (is not appplied to me at all) to 3 (is applied to me) was considered for each question. Lovibond and Lovibond11 reported a 77% validity of the DASS-21 questionnaire. The reliability of the questionnaire by alpha-Cronbach was 0.89, 0.84 and
0.82 for Depression, Anxiety and Stress, respectively. The self-esteem questionnaire consists of 10 fourscale (strongly agree, agree, disagree and strongly disagree) questions (min= 10, max= 40) In previous studies 7 , Cronbach’s alpha coefficient for the Rosenberg questionnaire was 0.74. In the present study, Cronbach’s alpha coefficient for DASS21 and Rozenberg questionnaires were 0.80 and 0.77, respectively, which indicates their appropriate reliability.
Statistical Analysis :
The data collected in this study were analyzed by SPSS 20 using Chi-square, t-test, and logistic regression. The mean scores of Depression, Anxiety, Stress and self-esteem were compared between parents of children with Bruxism and those with healthy children using t-test. Chi-square test was used to investigate the relationship between parents’ psychosocial status and the incidence of Bruxism in their children. Significance level of comparisons was considered to be P <0.05.
RESULTS
Table 1 displays the demographic characteristics of the participants and suggests that 100 (50%) of children had bruxism, 50% of the children were female, 58% of parents were women (mothers),
60.5% of the parents were 25 to 35 years old, 54% of the parents of the children in the study were unemployed.
Table 2 shows the results from comparing the mean scores of depression, anxiety, stress and selfesteem between parents of children with Bruxism and those with healthy children based on t-test are.
Its shows that the mean scores of Depression, Anxiety and Stress in parents of children with Bruxism were significantly higher than those with healthy children (P <0.001). The mean score of self-esteem in parents of a child with Bruxism was significantly lower than those with a healthy child (P <0.001, Table 2).
The results of the relationship between parents’ psychosocial status and Bruxism disorders in children based on the Chi-square test are presented in Table 3. It shows that 3%, 35% and 12% of parents of a child with Bruxism and 88% and 2%, parents with a healthy child had normal and severe depression, respectively. There was a statistically significant relationship between the level of parental depression and the child with Bruxism disorder (P <0.001).
Besides it shows that 29% and 28% of parents with children with bruxism and 66% and 2% of parents with healthy child had normal and very severe anxiety, respectively. Therefore, there was a statistically significant relationship between the level of parental anxiety and Bruxism in their children (P <0.001). Also, 45% of parents with a child with Bruxism and 89% of parents with a healthy child had normal stress, respectively. Further, 13% of parents with a child with bruxism were in a very severe state of stress, while this rate was zero in the parents of a healthy child. There was a statistically significant relationship between parent’s stress status and incidence of Bruxism in their children (P<0.001).
The present study showed that 37% of parents with a child with Bruxism and 7% of parents with a healthy child had low self-esteem, respectively. There was a significant relationship between parents’ self-esteem status and incidence of Bruxism in children (P<0.001). The results showed that there is no significant relationship between parents’ education level and incidence of Bruxism in their children (P>0.05). On the other hand, parents’ employment status can significantly affect the incidence of Bruxism in their children (P=0.01). Accordingly, 63% of parents of children with bruxism were unemployed, compared to 45% of parents with a healthy child. The logistic regression analysis results of the variables that cause Bruxism in children are shown in Table 4. Beta value of parents’ self-esteem and stress scores is significantly higher than other variables (P<0.05, Table 4).
Table 2 — The comparison of Depression, Anxiety, Stress and Self-esteem Scores in Parents of Children with Bruxism and Parents of Healthy Children
Parents of childrenParents ofP-value with bruxismhealthy children
Psychological disorder score Depression15.0
Self-esteem
Values are means ± SD
Table 3 — Association between Parent’s Psychosocial Status and Bruxism Disorders in Children
VariableBruxismBruxism - Yes- No
Psychological status of
DISCUSSION
The mean scores of depression, anxiety and stress in parents of children with bruxism were significantly higher than those with healthy children. In contrast, the mean self-esteem score was lower in parents of children with Bruxism. Moreover, there was a significant relationship between the level of Depression, Stress and Anxiety of parents and the incidence of bruxism in children. Thus, the poor
Table 4 — Multivariate Logistic Regression Analysis for Predicting Bruxism among Children
Variable (predictors)BSEDfSig.Exp(B)
Levels of parental education-0.0310.11610.7910.970
Employment status of parents0.6510.36710.0761.918
Self-esteem score of parents0.1430.04410.0011.154
Psychological score of parents
Depression-0.0750.04110.0660.927
Anxiety0.0180.053 10.7391.018
Stress-0.0920.03810.0150.912
mental state of the parents can develop Bruxism in children. Previous studies have shown that parents with psychological symptoms can transmit these symptoms and emotions to their children through learning patterns. Thus, the resultant anxiety and stress in the child can lead to the emergence of behavioral disorders such as Bruxism7,12,13. Studies show that maternal depression increases the risk of behavioral disorders and anxiety in children14-16
On the other hand, behavioral disorders and potential emotional problems and mental disorders (such as stress and depression) in children are directly related to the development of Bruxism1,9 Studies reported a strong correlation between the level of anxiety and stress and behavioral disorders in children with Bruxism9,17,18. In general, mental disorders in children are appears as the etiopathogenesis of parafunctional functions such as bruxism, nail biting, finger sucking habits and sleep disorders19. El la, et al, found a statistically signiûcant association between bruxism and stress (p<0.001), with or without craniofacial dystonia and without identification of the bruxism type20. Therefore, according to the results of previous and present studies, mental disorders in parents cause stress and anxiety in children resulting in Bruxism21. Goettems, et al 22 reported that the prevalence of Bruxism was higher in children of mothers with symptoms of anxiety and depression which is consistent with the results of this study. Seow, et al23 also reported a correlation between the degree of Depression and Anxiety in mothers with the severity of children’s oral diseases.
Sampaio, et al24 did not find a relationship between stress of mothers and the incidence of Bruxism in their children, which is inconsistent with the results of the present study. Genetic factors can develop Bruxism in children whose parents have stress and anxiety4. The present study showed no statistically significant relationship between the level of education of parents and the incidence of Bruxism, which is consistent with the results of the study of Serra-Negra et al25. Laberge, et al 26 reported no association
between parents’ socio-demographic variables and the incidence of Parasomnias disorder in children. In contrast, Cheifetz, et al27 reported that most children with bruxism have parents with low levels of education, either father or mother (without a college degree). Socio-economic and cultural characteristics may be associated with the occurrence of SB. On the other hand, Tsitadze, et al 29 stated that this disorder are common among children from families with a better socioeconomic status, which may be related to the higher number of daily duties and demands by children than children from a poor level. The difference between both studies arise from different nature of the studied societies24
There was a statistically significant relationship between parent’s occupational status and incidence of Bruxism in their children, so parents of children with this disorder were mostly unemployed. SerraNegra, et al25 reported that fathers of children with Bruxism are low-income. In fact, the economic inability of parents to meet the needs of the child and the financial worries of parents as a stressful situation can develop Bruxism in their children27. Regarding the relationship between parents’ occupations and children with bruxism, Seraj, et al28 reported that higher levels of social awareness among employee fathers rather than farming fathers made their children less prone to Bruxism. In contrast, Halvani, et al29 reported that children with employed mothers had a higher rate of Bruxism rather than housewife mothers, which may be due to spending more time on children’s emotional welfare.
CONCLUSION
The present study shows that the mean scores of depression, anxiety and stress in parents of children with Bruxism were significantly higher than those with healthy children. In contrast, the mean self-esteem score was lower in parents of children with Bruxism. Although no statistically significant relationship was found between parents’ education level and the incidence of bruxism, the prevalence of bruxism was higher in children with unemployed parents. Due to the impact of poor psychosocial status of parents on the incidence of Bruxism in their children, it seems necessary to provide educational programs by dental and mental health professionals to parents.
The potential limitations in the present study include coronavirus pandemic, decreased clients, shortage of Bruxism parameters and improper diagnosis of Bruxism in children. Also, because
Vol 122, No 10, October 2024Journal of
sampling was done based on questions from parents, it was possible to lose some samples.
Funding : This study was not funded.
Conflict of interests : Authors have no conflict of interest to declare.
Ethics : The Research Ethics Committee approved this descriptive-survey research of Ahwaz Jundishapur University of Medical Sciences
REFERENCES
1Antonio AG, da Silva Pierro VS, Maia LC — Bruxism in children: a warning sign for psychological problems. Journal of the Canadian Dental Association 2006; 72.
2Nishigawa K, Bando E, Nakano M — Quantitative study of bite force during sleep associated bruxism. J Oral Rehabil, 2001; 28: 485-91.
3Okeson JP — Management of temporomandibular disorders and occlusion-E-book: Elsevier Health Sciences; 2019.
4Kato T, Rompre P, Montplaisir JY, Sessle BJ, Lavigne GJ — Sleep bruxism: an oromotor activity secondary to microarousal. J Dent Res 2001; 80: 1940-4.
5Vanderas AP, Manetas MKJ — Relationship between malocclu. sion and bruxism in children and adolescents: a rewew”, Pediatric Dentistry 1995; 17.
6Fluerasu MI, Bocsan IC, Tig IA, Iacob SM, Popa D, Buduru S — The Epidemiology of Bruxism in Relation to Psychological Factors”, Int J Environ Res Public Health 2022; 19.
7Riahi F, Amini F, Salehi Veisi M — The children’s behavioral problems and their relationship with maternal mental health. Pars of Jahrom University of Medical Sciences 2012; 10: 4652.
8Narayanan MK, Naerde A — Associations between maternal and paternal depressive symptoms and early child behavior problems: Testing a mutually adjusted prospective longitudinal model. J Affect Disord 2016; 196: 181-9.
9Brancher LC, Cademartori MG, Jansen K, da Silva RA, Bach S, Reyes A, et al — Social, emotional, and behavioral problems and parent-reported sleep bruxism in schoolchildren”, J Am Dent Assoc 2020; 151: 327-33.
10Ahlberg J, Wiegers JW, van Selms MKA, Peltomaa M, Manfredini D, Lobbezoo F, et al — Oro-facial pain experience among symphony orchestra musicians in Finland is associated with reported stress, sleep bruxism and disrupted sleepIndependent of the instrument group. J Oral Rehabil 2019; 46: 807-12.
11Lovibond PF, Lovibond SH — The structure of negative emotional states: Comparison of the Depression Anxiety Stress Scales (DASS) with the Beck Depression and Anxiety Inventories. Behaviour Research and Therapy 1995; 33: 335-43.
12Douglas J — Behavioral problems in children. Trans Yasaei M Tehran: Markaze Nashr Publ 1995; 38.
13Pilowsky DJ, Wickramaratne P, Talati A, Tang M, Hughes CW, Garber J, et al — Children of depressed mothers 1 year after the initiation of maternal treatment: findings from the STAR*DChild Study. Am J Psychiatry 2008; 165: 1136-47.
14Brennan PA, Hammen C, Andersen MJ, Bor W, Najman JM, Williams GM — Chronicity, severity, and timing of maternal depressive symptoms: relationships with child outcomes at age 5. Dev Psychol 2000; 36: 759-66.
15Hammen C, Burge D, Burney E, Adrian C — Longitudinal study of diagnoses in children of women with unipolar and bipolar affective disorder. Arch Gen Psychiatry 1990; 47: 11127.
16Meadows SO, McLanahan SS, Brooks-Gunn J — Parental Depression and Anxiety and Early Childhood Behavior Problems Across Family Types. Journal of Marriage and Family, 69 2007; 1162-77.
17Serra-Negra JM, Ramos-Jorge ML, Flores-Mendoza CE, Paiva SM, Pordeus IA — Influence of psychosocial factors on the development of sleep bruxism among children”, Int J Paediatr Dent 2009; 19: 309-17.
18Carvalho AL, Cury AA, Garcia RC — Prevalence of bruxism and emotional stress and the association between them in Brazilian police officers. Braz Oral Res 2008; 22: 31-5.
19Castelo PM, Barbosa RS, Gaviao MB — Quality of life evaluation of children with sleep bruxism. BMC Oral Health, 2010; 10: 16.
20Ella B, Guillaud E, Langbour N, Guehl D, Burbaud P — Prevalence of Bruxism in Hemifacial-Spasm Patients. J Prosthodont 2017; 26: 280-3.
21Washington Kids Count, Human Services Policy Center.Family matters: mental health of children and parents. Washington: Univ Washington; 2001. Accessed October 28/2010.”,
22Goettems ML, Poletto-Neto V, Shqair AQ, Pinheiro RT, Demarco FF — Influence of maternal psychological traits on sleep bruxism in children. Int J Paediatr Dent 2017; 27: 46975.
23Seow WK, Clifford H, Battistutta D, Morawska A, Holcombe T — Case-control study of early childhood caries in Australia. Caries Res 2009; 43: 25-35.
24Sampaio NM, Oliveira MC, Andrade AC, Santos LB, Sampaio M, Ortega A — Relationship between stress and sleep bruxism in children and their mothers: A case control study. Sleep Sci 2018; 11: 239-44.
25Serra-Negra JM, Paiva SM, Seabra AP, Dorella C, Lemos BF, Pordeus IA — Prevalence of sleep bruxism in a group of Brazilian schoolchildren. Eur Arch Paediatr Dent 2010; 11: 1925.
26Laberge L, Tremblay RE, Vitaro F, Montplaisir J — Development of parasomnias from childhood to early adolescence. Pediatrics 2000; 106: 67-74.
27Cheifetz AT, Osganian SK, Allred EN, Needleman HL — Prevalence of bruxism and associated correlates in children as reported by parents. Journal of Dentistry for Children 2005; 72: 67-73.
28Seraj B, Ahmadi R, Mirkarimi M, Ghadimi S, Beheshti M — Temporomandibular disorders and parafunctional habits in children and adolescence: A review, (2009).
29Halvani N, Zarebidoki F — Evaluation of the Prevalence of Bruxism and Its Associated Factors among 3-6-Year-Old Children in Yazd”, Journal of Mashhad Dental School 2021; 45: 22-33.
Original Article
Evaluation of Peak Expiratory Flow Rate (PEFR) in Children Residing in Urban Areas of Dhule District
Background : Childhood asthma is commonly seen in children and Peak Expiratory Flow Rate (PEFR) is a reliable and easy to measure parameter to access condition of airway, narrowing of which is the cause of asthma. PEFR varies with many factors and we don’t have any normative data for this part of India, Dhule, Maharastra.
Materials and Methods : PEFR is recorded in children of age group 12 to 16, from various schools selected randomly and data is statistically analyzed to find mean PEFR for different age groups. Regration formula is also calculated from data obtained.
Observation : Mean values of PEFR for male children of age group 12, 13 14, 15, 16 years are 248±35.93, 291.5±52.3, 316.69±66.46, 351.66±77.14, 378.5±79.02 L/min respectively, while that for female children of age group 12, 13 14, 15, 16 years are 270±42.42, 285±55.44, 300±47.39, 313.76±52.16, 313.75±62.09 L/min respectively.
Conclusion : PEFR shows no significant difference in male and female children except for children of 15 years’ age group. This may be because of significant difference in height of male and female children of that age group which is one of the factor affecting PEFR.
Key words :PEFR, Children, Normative Data, Asthma.
Respiratory diseases are most common cause of illness in children. Childhood asthma is one of the chronic respiratory conditions seen in children1 And its prevalence is increasing day by day. Peak Expiratory Flow Rate (PEFR) is very simple, easy to measure and reliable parameter used to access condition of airway in obstructive disease 2 Continuous monitoring of PEFR at home with adequate training for performing it, helps patient to reach for medical help at early stage. This helps in preventing acute attacks of severe asthma and improve the quality of life of Children.
PEFR is dependent on several variables like airway resistance, voluntary muscular efforts and compressive effect of the maneuver on intrathoracic airways3,4
PEFR values vary in different geographical areas and in different ages. Studies have been conducted to find out normal values of PEFR in some part of
1MD, Assistant Professor, Department of Physiology, Shree Bhausaheb Hire Government Medical College, Dhule, Maharashtra 424002 and Corresponding Author
2 MD (Paediatrics), Associate Professor, Department of Paediatrics, Shree Bhausaheb Hire Government Medical College, Dhule, Maharashtra 424002
3 MD (Physiology), Assistant Professor, Department of Physiology, ACPM Medical College, Maharashtra 424002
Received on : 09/07/2024
Accepted on : 17/09/2024
[J Indian Med Assoc 2024; 122(10): 26-8]
Editor's Comment :
The study showed that normal range of PEFR values is different than many other studies conducted in other parts of india. So, while dealing with childhood asthama values from the area where the patient resides should be considered. For this a widespread research project can be conducted in all parts of the India to find normative data in each corner of the country.
India like north India and south India, but there is lack of data for children in this part of Maharashtra5-11. So in this study we tried to find out normal values of PEFR for children residing in urban areas of Dhule district. Normal values of PEFR vary with Age, Sex, Ethnicity and Regional and Environmental factors12 Before diagnosing an airway obstruction from PEFR value of a child, care has to be taken that the value with which we are comparing is from same population. No data is available for the population in this region so in this study we will try to find normal values for children in urban areas of Dhule district.
MATERIALS AND METHODS
The study was conducted after obtaining Institutional Ethical Committee permission. Total 612 normal, healthy school children of 12 to 16 years of age were selected from various schools, which were selected randomly. Informed written consent was obtained from the guardians and the study carried
122, No 10, October 2024Journal
out in school hours with prior permission of school authority. Exclusion criteria taken into consideration were, history of active or passive smoking, history suggestive of any Chronic Respiratory Disease, any chest deformity or any injury to lungs and airways, any acute respiratory infection in last 15 days.
Detailed relevant history was taken. General and systemic examination was done. Prior to testing required instructions were given and test was properly explained and demonstrated. PEFR of all the participants was recorded three times after giving them a trial of the instrument. Mini Wright’s Peak expiratory flow meter was used to measure PEFR. Best of the three readings was taken as PEFR record of that person.
RESULT
Study was conducted on total 612 children of age group 12-16 years; out of which 206 were females and 406 were males. Data collected was analyzed statistically to find out regration formulae. Age specific distribution of the children is shown in Table 1.
Table 2 and 3 respectively shows mean Height and Weight of study groups.
Table 4 shows comparison PEFR values in Males and Females with respect to age. In which there is significant difference in PEFR values of males and females of age 15 and 16 years.
Regration formula for females is — PEFR = -64.5+10.97 age+1.319 height+0.217 weight
Regration formula for Males is — PEFR=-455.7+14.66 age+3.573 height+0.519 weight
DISCUSSION
Age wise distribution of the total 612 students show that 206 were females and 406 were males. In all age groups number of females is less than that of males; this may be due to fewer enrollments of girls in schools and low sex ratio13
Mean height of males and females show significant difference in age groups 13 and 15 years. For age group 13 years females show more height as compare to boys of same age group. In group 15 years boys show more height as compare to females this may be due to early occurrence of growth spurt in females as compared to boys.
Mean weight of boys and girls doesn’t show any significant difference in any of the age group.
Mean PEFR values for males and females shown in Table 4 don’t show any significant difference except for age groups 15 and 16 years. This finding differs from many previous studies conducted which show significant difference in all age groups. In this study, there is no significant difference in weight of males and females and in case of height, significant difference seen only in two age groups 13 and 15 years. Difference in PEFR between males and females is due difference in their build which is not the case in this study population
Regration equations were also obtained to calculate PEFR which will be helpful to calculate PEFR for every child. Table 1 —
Table 3 — Mean Weight
Table 4 — PEFR with respect to Age AgePFER (Mean ± SD)(L/min)P value (in
PEFR can be calculated using the regration formula obtained for the children in Dhule district. Difference in PEFR is seen only in 15 and 16 years of age may be because in early age there is lesser difference in build of boys and girls.
Few children don’t attend the schools which are missed in this study. Further improvement can be done in the study by taking samples by random selection of children from each area instead of taking from schools.
REFERENCES
1Disorders of Respiratory System. In Ghai OP, Paul V, Bagga A. (eds) Essentials of pediatrics. 7th ed. Delhi. CBS Publishers & Distributors pvt Ltd 2010. 345-71.
2Li JT — Home peak expiratory flow rate monitoring in patients with asthma. Mayo Clin Proc 1995; 70(7): 649-56.
4Pande JN, Mohan A, Khilnani S, and Khilani GC — Peak Expiratory Flow Rate in School – Going Children. Indian J Chest Dis Allied Sci 1997; 39: 87-95.
5Malik SK, Jindal SK, Sharada SK, Banga N — Peak expiratory flow rate of healthy school boys from Punjab. Indian Pediatrics 1981; 18: 517-21.
6Swaminathan S, Venkatesham P, Mukunth R — Peak Expiratory Flow Rate in South Indian Children. Indian Pediatr 1993; 30(2): 207-11.
7Reddy UN, Umran Khan MA, Anjum S, Mohd Nasirmohiuddin, Pratap Rao S, Narsing Rao J, et al — Evaluation of mean peak expiratory flow rate (PEFR) of healthy children belonging to urban areas of Hyderabad. Asian Pac J Health Sci 2014; 1(2): 113-9.
8Challa N, Madras V — A Study of Peak Expiratory Flow Rate in Children International Journal of Recent Trends in Science And Technology, ISSN 2277-2812 E-ISSN 2249-8109, 2014. 10(2): 259-62.
9Sharma R, Kaur A, Gupta M, Kaur A, Arora H, Singh S — A cross sectional study to assess peak expiratory flow rate in healthy school children for establishment of normative data. J Nepal Paediatr Soc 2020; 40(1): 1-6.
10Taksande A, Jain M, Vilhekar K, Chaturvedi P — Peak expiratory flow rate of rural school children from Wardha district, Maharashtra in India. World J Pediatr 2008; 4(3): 211-4.
11Ahmed M, Gavhane J, Goel S — Age Specific Peak Expiratory Flow Nomogram in Children. Indian J Pediatr 2017; 84(4): 271-5. doi: 10.1007/s12098-017-2297-1. Epub 2017 Feb 4.
12Adeniyi BO, Erhabor GE — The peak flow meter and its use in clinical practice. African Journal of Respiratory Medicine 2011; 5-8.
13Maharashtra Population | Sex Ratio | Literacy. https:// www.census2011.co.in/census/state/maharashtra.html
Original Article
Monitoring
of
Ovulation — By Adopting “Dutta’s New Scoring” Technique & Pregnancy Outcome
Background : Ovulation usually occurs in between 12th to 16th day of normal menstrual cycle of 28 days, but due to non-synchronization in timing of releasing estrogen, progesterone & LH hormone during ovulation and its subsequent effect on Endometrial Thickening (ET) & Cervical Mucus, it may lead to failure of implantation of fertilized ovum or embryo finally leading to failure of pregnancy outcome.
Aims and Objectives : To analyze the efficacy of Dutta’s New Scoring Technique & its impact on exact date of ovulation, timely sex and use of drugs for successful pregnancy outcome.
Materials and Methods : This study was conducted at GICE Infertility Clinic, GICE NH, Kalyani, Nadia, WB from April, 2018 to March, 2022. In 800 cases were selected for this study.
Detection of ovulation was done by adopting Dutta’s Scoring technique. The following observations were done on D13 which includes :-
Score of 0,1,2 were given on each observations. Three groups were created depending on scoring such as Group –A (N=418) - 8 to 10, Group B – (N=274) 5 to 7, Group –C (N=108) < 5 for better management as per scoring (Materials & Methods) technique.
Observation & Result : Excellent Results were observed in Group A Patients particularly in terms of implantation, biochemical pregnancy and clinical pregnancy as compared to Group B Patients and Group C patients.
Treatment Protocol according to Scoring Methods :
Treatment Group A (Score 8-10 with sample size 418) = N-418, Inj hcG (5000IU) on D 13 and Dydrogesterone 20 mg daily from D14 X 10days.
Treatment Group B (Score 5 to 7 with sample size 274) = Inj FSH (75 IU) on D2& D8, Estradiol Valerate (2mg) from D5 for 10 days, Inj hcG (5000 IU) IM on D13 of cycle and Dydrogesterone – 20mg/daily from D14 for 10 days.
Treatment Group C (Score <5 with sample size 108) = Inj FSH (75 IU IM) on Day 2 and Day 8, Clomiphene Citrate (100mg)- Day 3 to Day 7, Estradiol Valerate (2mg) from Day 5 of Cycle for 10 days, Inj hcG (5000 IU IM) on Day 13 and Dydrogesterone – 20mg/daily from D14 for 10 days were found to have better option for successful pregnancy rate.
Conclusion : Dutta’s Scoring technique is done to accurately predict the exact date of ovulation, subsequent timely sex and also help to implement proper drugs for successful implantation thus increasing chances of subsequent pregnancy rate.
In normal 28 days of menstrual cycle, ovulation usually occurs in between 12th to 16th day of cycle but due to non- synchronisation in hormone release1 and its action at receptor level, the endometrial proliferation and changes of cervical mucus during pre – ovulation1,2 or day of ovulation may play some role in causing failure of implantation or pregnancy outcome.
1 MD, PhD, FRCOG, Senior Consultant, Department of Obstaetrics and Gynaecology, Gynaecology Institute of Clinical Excellance, Kalyani, West Bengal 741235
2MBBS, MS , PGDHHM, PGDMLS, Professor and Unit Head, Department of Obstetrics and Gynaecology, IQ City Medical College Hospital, Durgapur, West Bengal 713206
3MBBS, MD (Radiodiagnosis), Assistant Professor, Department of Radiodiagnosis, Gouri Devi Institute of Medical Sciences and Hospital, Durgapur, West Bengal 713212 and Corresponding Author
Received on : 18/07/2024
Accepted on : 06/08/2024
Editor's Comment :
"Dutta’s Scoring Technique” Helps to find the exact date of ovulation, actual timing of sex in a normal cycle and also proper use of drugs for a successful clinical pregnancy.
Scoring technique is done to accurately predict the exact date of ovulation2,3, subsequent timely sex and also help to implement proper drugs for successful implantation thus increasing chances of subsequent pregnancy rate4,5.
Scoring helps to identify which patient should be given which drug rather than rampant and irrational use of drugs to induce ovulation. Scoring enables us
122, No 10, October 2024Journal
to group which patient requires basic treatment or which requires cycle stimulation. This is also beneficial in Rural Population where affordability of basic Drugs is less and compliance is poor.
MATERIALS AND METHODS
This study was conducted at GICE Infertility Clinic, Kalyani, from April, 2018 to March, 2022. During this period 800 cases were selected. Patients were selected on Double blinded randomization for only those who had infertility and we are observing them for Natural Cycle monitoring or basic Infertility Treatment to induce Ovulation by Scoring Various Parameters
Inclusion Criteria : All women who are being chosen for natural cycle and ovulation monitoring as well as those who require basic induction/stimulation for Ovulation
Exclusion Criteria : Anatomical factors, cervical factors and other causes like PID, endometriosis, leiomyoma.
Consent was taken from each participant before they participate, Funding is self, Ethical standards were maintained as none of the drugs used are experimental, but are the same medicines approved by Government of India and Drug Controller, Ethical Permission was obtained.
This Study is just using an observational method and grouping patients according to their score and giving established drugs in a planned manner to avoid unnecessary/ rampant use of medicines randomly.
Monitoring of exact time of ovulation were done by USG (TVS), cervical mucus study (per speculum examination) and hormonal analysis on D13 of 28 days normal menstrual cycle, Scoring were done which includes size of Graafian Follicle (GF), Endometrial Thickening (ET), Cervical Mucus(CM), Progesterone (P) and LH hormone (L) levels.
Score of 0,1,2 were given on each Observations on D-13 of cycle
Criteria of Scoring as per findings in Observations
012
Size of Graafian Follicle (GF) <15mm 16-20mm >20mm
Group A8-10 (GF – 2, ET- 1 or 2, CM – 1or 2, P-2, LH- 2)
Group B5-7 (GF – 1, ET- 1 or 2, CM – 1, P- 1 or 2, LH- 1 or 2)
Group C<5 (GF – 0 or 1, ET- 0 or 1, CM – 0-1, P- 0-1, LH- 0-1)
Management Protocols
Group –AInj-hcG (5000 IU) on D13, (418)Dydrogesterone – 20mg/daily from D14 for 10 days.
Group –BFSH (75 IU) on D2& D8, Estradial Valerate (2mg) (274)from D5 for 10 days, Inj-hcG (5000 IU) on D13, Dydrogesterone – 20mg/daily from D14 for 10 days.
Group –CFSH (75 IU)- on D2 and D8, Clomiphene Citrate (108)(100mg)- D3 to D7, Estradiol Valerate (2mg) D5 for 10 days , Inj-hcG (5000 IU) on D13, Dydrogesterone – 20mg/daily from D14 for 10 days.
OBSERVATIONS
Duration of infertility more than 4 years were found to be 15.6% (n-125) of the patients, 37.6% (n-300) of patients in between 2-4 years & 46.8% (n-375) patients in between 1-2 years respectively (Table 1).
On 5th day of missed period and with/without a history of light bleeding, nausea & mood swings, USG (TVS) was done. It is interesting to observe that Implantation rate in Group A – (N-418) were found to be better (71.7%) as compared to Group B (N-274) –45.6% & Group C (N-108) 37% respectively (Table 2).
After Implantation (Table 3) the embryo usually produces sufficient amount of hCG to be detected in the initial pregnancy test which is either conducted in blood or urine in the absence of an definite identifiable pregnancy (foetal pole) on USG.
It was observed that Group A – 64.6% (N-418) had more percentage of biochemical pregnancy as compared to Group B – 38.3% (N-274) & Group C –32.4% (N-108).
It is also seen that in Group A In spite of 71.7% Implantation Rates, Biochemical Pregnancy rates have reduced to 64.6% as compared to in Group B (Implantation to Biochemical Conversion Rate) of
45.6% to 38.3% and in Group C - 40% to 32.4% respectively indicating that further study like biochemical, immunological, molecular and genetic study may require for better diagnosis& treatment.
During follow-up (Table 4) of 375 pregnancy cases with proper history and physical examination, β-hcG in serum & Urine and USG(TVS) were done on 6 weeks of pregnancy.
It was interesting to note that in Group -A approx 62.3% (N-418) had successful clinical pregnancy (ie, Presence of Foetal pole) as compared to Group B –36.1% (N-274) and Group C – 28.7% (n-108) clinical pregnancy.
Hence it is important to note that dydrogesterone were found to be better result to have clinical pregnancy rate as per scoring 8-10 ( Group A) through it reduces from 64.6% (Bio-chemical pregnancy) to 62.3% (Clinical pregnancy) as compared to Group B 38.3% (Bio-chemical) to 36.1% ( Clinical) & GroupC -32.4% (Bio-chemical) to 28.7% (clinical) pregnancy respectively which also require further study of maternal & foetal immunological and genetic factors etc.
DISCUSSION
Ovulation usually occurs in between 12th to 16th days of normal 28 days menstruation cycle. Every woman had ovulation about 14th days before her next period. Normal timing of sex is also paramount important for successful pregnancy outcomes1
Exclusion of PCOS, Hypothyroid, Hyperprolactinemia, POF and obesity is very much important, ( Who had the history of irregular menstrual cycle) to diagnose exact date of Ovulation.
Hence, detection of ovulation and timely sex/IUI/ IVF & ET is found to be very important for the successful pregnancy outcome7.
To have a successful Implantation Rate as well as viable clinical pregnancy - there should be excellent endometrial receptivity and synchronization in between size & shape of Graafian follicle (>20mm), Oestrogen level >600 pg, Endometrial Thickening (ET) >8 mm , cervical mucus (cascade) as well as good vascularisation of endometrial wall.
Level of LH (>25 mIU/ml) is very much significant as regards rupture of mature Graafian follicle and excellent nutritional environment at endometrium (good receptivity by progesterone) for embryo implantation2.
Although in practical reality it is not found to occur (non-synchronization) in between size of Graafian Follicle with Estrogen secretion 3,4 endometrial thickening, cervical mucus changes and exact timing
Table 4 — Clinical Pregnancy
GroupNumberPercentage
Group A (418) 245(62.3%)
Group B (274) 99(36.1%)
Group C (108) 31(28.7%)
of sex which may be the important causes of failure of pregnancy5,6
Due to above facts “Dutta’s Scoring” were undertaken at GICE Infertility clinic. 800 cases were selected for a randomized trial. Monitoring of exact time of ovulation were done by USG (TVS), as well as hormone assays on D13 of 28 days normal menstruation cycle.
Depending on findings – scoring were done which included the size of Graafian Follicle (GF), Endometrial Thickening (ET), Cervical Mucus (CM) as well progesterone (P) & LH (L) hormone level. Score of 0,1,2 were given an each observations. Criteria of scoring were given as per finding on observations. Accordingly, distribution of scoring were done in different groups – Group A – 8-10 (N-418), Group B – 5-7(N-274) & Group C - <5(N-108) as well as management protocols – which include Group A –(N-418) =Inj-hcG (5000 IU) on D13,Dydrogesterone -10mg - twice daily from D14 for 10 days. In Group B – (N-274)- FSH (75mg) in D2 & D8, Estradiol Valerate (2mg) from D5 to D15 and Inj-hcG (5000 IU) on D13, Dydrogesterone 10 mg twice daily from D14 for 10 days & in Group C – (N-108) – FSH (75 IU) or D2 and D8 , Clomiphene citrate (CC) 100mg from D3 to D7, Estradiol Valerate (2mg) from D5 to D15 and Inj-hcG (5000 IU) on D13, Dydrogesterone 10 mg twice daily from D14 for 10 days .
Once pregnancy is confirmed by β -hcG in both blood and urine – continuation of Dydrogesterone were advised till clinical pregnancy and to be continue upto 28 weeks of pregnancy.
From our randomized study – it is very much important to observe that following “ Dutta’s Scoring” and management protocols - Implantation Rate (IR) were found to be better in Group A – (418) - 71.7% as compare to Group B (N-274) – 45.6% and Group C – (N-108)- 37% respectively.
On follow-up study it was also interesting to note that Group A –64.6% (N-418) had biochemical pregnancy as compare to Group B – 38.3 % (N-274) and Group C –32.4 (N-108) cases. On further analysis it is also seen that in Group A in spite of 71.7% Implantation Rate (gestational sac) has reduced to 64.6% (biochemical pregnancy) as compare to Group B – from 45.6% to 38.3% and Group C- from 37% to 32.4% respectively, require further study to know
122, No 10, October 2024Journal
exact causes of failure which may be due to biochemical, molecular, or maternal and foetal immunological, or genetic problem.
It is very much significant to observe that – during routine check-up of 6 weeks of pregnancy which includes history, physical examination, β-HcG in blood & urine and USG – it was noted that in Group A –62.6% (N-418) had successful clinical pregnancy (presence of foetal heart rate)as compare to Group B – 36.1% (N-274) and Group C – 28.7% (N-108) respectively.
It is also showed from this study that Dydrogesterone therapy were found to be better to have successful clinical pregnancy rate in Group A ,–where scoring is in between 8-10 as compare to Group B and Group C. On further analysis, it was also observe that in Group A – 64.6% (BP) has reduced to 62.3% (CP) as compare to Group B –38.3% (BP) to 36.1% (CP) pregnancy, Group C –32.4% (BP) to 28.7% (CP) which indicates that through investigations is to be undertaken to know the exact causes of failure.
CONCLUSION
It is concluded from this study that “Dutta’s Scoring Technique” helps to find the exact date of ovulation in 28 days of normal menstrual cycle and also helps to know actual timing of sex as well as implementation of proper drugs for a successful clinical pregnancy rate, but further study is to be undertaken in future whether Dutta’s Scoring Technique is really a good method to know exact date & time of ovulation, timely sex and implementation of different drugs or not.
Compliance with Ethical Standards
Conflict
of Interest
: Dilip Kumar Dutta, Indranil Dutta, Dr Rumpa Banerjee Dutta declare that they have no conflicts of interest.
Informed consent : All procedure followed were in accordance with the ethical standards of the responsible committee on human experimentation (institutional and national) and with the Helsinki Declaration of 1975, as revised in 2008. Informed consent was obtained from all patients for being included in the study.
REFERENCES
1Su HW,Yiyc, Weity, Chang Tc, Cheng CM — Detection of Ovulation” A Review of currently available method. Bioeng Transl Med 2017; 2(3): 238-46.
2Leiva RA, Bouchard TP. Abdullah SH, Ecochard R — Urinary Luteinizing Hormone Tests: Which concentration threshold best predict ovulation? Front Public Health 2017; 5: 320.
3Guermandi E, Vegetti W, Bianchi MM, Uglietti A, Ragni G, Crosignani P — Reliability of ovulation tests in infertile women. Obstet Gynecol 2001; 97(1): 92-6. doi: 10.1016/s00297844(00)01083-8. PMID: 11152915.
4Fehring RJ — Accuracy of the peak day of cervical mucus as a biological marker of fertility. Contraception 2002; 66(4): 2315. doi: 10.1016/s0010-7824(02)00355-4. PMID: 12413617.
5Manders M, McLindon L, Schulze B, Beckmann MM, Kremer JA, Farquhar C — Timed intercourse for couples trying to conceive. Cochrane Database Syst Rev 2015; (3): CD011345. doi: 10.1002/14651858.CD011345.pub2. Update in: Cochrane Database Syst Rev. 2023 Sep 15;9:CD011345. PMID: 25775926.
6Eissa HM, Ahmed AM, Ehab A — Elsehely; Implementation of smart ovulation detection devices. Recent Advances in Biomedical & Chemical Engineering and Materials Science 2014; 82-6.
7Betts K — The Billings method of family planning: an assessment. Stud Fam Plann 1984; 15(6 Pt 1): 253-66. PMID: 6515667.
Original Article
Association Between T p-e / QT Ratio In 12 Lead ECG and Major Adverse Cardiac Events during Hospital Stay among Acute ST Elevation Myocardial Infarction Patients
Ankur Sumantrai Patel1, Deep Rasikbhai Bavaria2
Background : T peak to T end interval divided by QT interval (T p-e / QT ratio) in 12 lead ECG (Electrocardiogram) is better indicator of total repolarization dispersion as compared to other ECG parameters. Elevated value of T p-e / QT ratio detected in acute ST elevation Myocardial Infarction (MI) patients on admission is associated with poor in hospital prognosis due to various Major Adverse Cardiac Events (MACE) like Tachyarrhythmia, Cardiogenic Shock, Congestive Cardiac Failure and Death.
Material and Methods : This is a hospital based prospective study done in 73 patients of acute ST elevation MI admitted in our Tertiary Care Hospital. Patients having age of more than 18 years, giving informed written consent and having acute ST elevation MI were enrolled from duration of March, 2021 to October, 2022. Patients who were not willing for study as well as ECGs unsuitable for analysis, taking antiarrhythmic drugs, having electrolyte abnormalities, previous history of MI and having other Structural Heart Diseases like Valvular Heart Disease, myocarditis, pericarditis, Cardiomyopathies were excluded. On admission, T p-e / QT ratio was calculated in all enrolled patients confirmed with acute ST elevation MI. This was correlated with relevant demographic and clinical variables as well as MACE, mortality and recovery of patients during hospital stay.
Results : Total 41 patients (56.16%) had normal ratio of T p-e / QT (<0.25). 24 patients (32.87%) had Mild elevation of ratio between 0.25 to 0.35. In 8 patients (10.96%) presented with very high ratio of >0.35. Association of all MACE showed positive correlation with high values of T p-e / QT ratio (> 0.25). It was very strongly associated with values >0.35 and statistically significant too.
Conclusion : In acute ST elevation patients, deranged T p-e / QT ratio predicts poor in hospital prognosis even in ECG carried out on admission. This interpretation helps to explain poor prognosis, to provide close monitoring for MACE and early referral to higher center for further intervention.
Key words :T p-e / QT ratio, ECG, Acute ST elevation MI, MACE.
Myocardial Infarction (MI) is defined as myocardial necrosis due to coronary ischemia. MI is a common cardiovascular disease and a leading cause of death Worldwide1. The annual number of deaths from CVD in India has increased from 2.26 million (1990) to 4.77 million (2020)2
Coronary Heart Disease prevalence rates in India have been estimated over the past several decades and have ranged from 1.6% to 7.4% in rural populations and from 1% to 13.2% in urban populations3.
Many advanced approaches have been developed for the management of patients with MI, such as thrombolytic therapy and interventional therapy4-6 However, MI remains a major problem worldwide.
1MD, Associate Professor, Department of Medicine, SMIMER Hospital & Medical College, Surat, Gujarat 395010 and Corresponding Author
2MD (Medicine), Senior Resident, Department of Medicine, Shri M P Shah Government Medical College, Jamnagar, Gujarat 361008
Received on : 24/09/2023
Accepted on : 10/12/2023
[J Indian Med Assoc 2024; 122(10): 33-8]
Editor's Comment :
During evaluation of all patients with myocardial infarction, calculate this ECG parameter T p-e/QT Ratio, so that complications can be predicted on admission itself and timely refer patients for higher centers.
Patients with complicated acute MI, many times present with ventricular arrhythmias and other subsequent adverse events during early periods and have significant risk of mortality7,8.
Recently, the interval from the peak to the end of T wave [T peak-Tend interval (Tp-e)] was used in predicting arrhythmias, associated Major Adverse Cardiac Events (MACE) and Sudden Cardiac Death (SCD) in some cardiac conditions9-11
Within ECG, heart rate is a factor, that can also affect Tp-e interval. So Tp-e/QT ratio, which is not affected by the variations in heart rate, was proposed as a more precise index than QT and QTc dispersion or Tp-e interval, for demonstrating the Dispersion of Repolarization (DOR). Tp-e/QT ratio can be used as
122, No 10, October 2024Journal
an index of arrhythmogenesis even in the presence of short , normal , or long QT intervals and additionally they indicated Tp-e/QT ratio as a better marker of ventricular repolarization12
The Tp-e/QT ratio shows consistency within the narrow range of 0.15 to 0.25. A higher Tp-e/QT ratio has been associated with arrhythmic and other adverse events associated with many clinical conditions12. There are many Major Adverse Cardiac Events (MACE) seen in patients of acute ST elevation patients which include Congestive Cardiac Failure (CCF), Ventricular Tachycardia (VT), Ventricular Fibrillation (VF), Shock, etc.
Yet only limited knowledge is available about this index (Tp-e/QT ratio) in patients presenting with STEMI. So, this current study was aimed to determine the Tp-e/QT ratio in patients with STEMI at the time of admission and its association with Major Adverse Cardiac Events (MACE) during the hospital stay.
MATERIAL AND METHODS
It was a prospective cohort hospital-based study during March, 2021 to October, 2022. Total 73 Indoor patients admitted to Medicine Department of our Tertiary Care Hospital having age more than 18 years who had fulfilled criteria for Acute ST elevation Myocardial Infarction and given informed written consent for study participation were enrolled. Institutional Ethical Committee approval was taken prior to study. Methods of Electrocardiography (ECG), advantages and disadvantages by the study were explained to patients and relatives.
Objectives :
•To determine Tp-e/QT ratio in ECG of acute ST elevation MI patients.
•To determine association between Tp-e/QT ratio with Major Adverse Cardiac Events (MACE) during hospital stay.
At the time of admission, 12 lead Electrocardiography (ECG) was taken after explaining all procedure to the patients. Within ECG, T wave peak to T wave end distance ( T p-e interval) as well as QT interval were measured. Ratio of T p-e interval and QT interval was calculated. Ratio <0.25 was considered normal. Ratio in range of 0.25 to 0.35 was considered mildly abnormal and >0.35 severely abnormal.
Evaluation of Tp-e was done only in leads showing ST-segment elevation at the J point. The QT interval was calculated from the beginning of the QRS complex to end of T wave (Te). Tpeak (Tp) is defined at the point having maximal deflection of the T wave,
while T end (Te) is defined as the point on descending limb of the T wave at which the maximal downslope’s tangent crosses the isoelectric baseline. The distance between Tpeak to T end is called Tp-e interval. All measured Tp-e intervals were expressed at the end as average of measurements made from 2 or 3 consecutive complexes.
Patient’s having age less than 18 years, ECGs unsuitable (like atrial fibrillation) for analysis, taking anti-arrhythmic drugs, having structural heart diseases like Cardiomyopathies, Myocarditis, Pericarditis, past history of Myocardial Infarction, electrolyte imbalance and not willing for study participation were excluded.
Detailed history, thorough general and systemic examination were done for each patient as per proforma of study. Investigations including ECG, Echocardiography, cardiac enzymes (like CPK MB and Troponin) and other basic reports were done.
Patients were evaluated serially throughout their hospital course to identify Major Adverse Cardiac Events (MACE) which include Congestive Cardiac Failure (CCF), Ventricular Tachycardia (VT), Ventricular Fibrillation (VF), Shock, need for ventilator Support, Sudden Cardiac Death, etc.
The data was entered in MS excel spread sheet and analyzed with the help of Open epi and SPSS software. Qualitative data was represented by percentage whereas quantitative data was represented by mean and SD. Chi Square and Fisher Exact test were applied to know the association between two qualitative variables at 95% level of confidence.
RESULTS
In present study, out of total 73 patients, for age group of 56-65 years, we included maximum number of patients ie, 29 (39.72%). It was followed by 16 patients (21.91%) in age group >65 years, 14 patients (19.17%) in age group 46-55 years, 10 patients (13.69%) in age group 35-45 years and 4 patients (5.47%) in age group of <35 years. Mean age in the study group was 57.28 with Standard Deviation of 13.08 years.
Out of all patients, 48 patients (65.75%) were Male and 25 Patients (34.24%) were females.
39 patients (53.42%) were Hypertensive and 34 patients (46.57%) were non-hypertensive. 37 patients (50.68%) were diabetic and 36 patients (49.31%) were non-diabetic.
Distribution of patients according to demographic and clinical variables are shown in Table 1.
On ECG interpretation, Tp-e / QT ratio was within
Table 1 — Distribution of STEMI patients according to Age, Gender, Hypertension and Diabetes. (Demogrphic and clinical variables)
Age (years)No of cases (n=73)Cases (%)
GenderNo of cases (n=73)Cases (%) Male4865.75%
HypertensionNo of cases (n=73)Cases (%)
DiabetesNo of cases (n=73)Cases (%)
the normal ratio of <0.25 in 41patients (56.16%), followed by 24 patients (32.87%) presenting with ratio between 0.25-0.35.
There were 8 patients (10.95%) presenting with very high Tp-e/QT ratio, ie, more than 0.35. Table 2.
In the present study, out of all the patients suffering from Major Adverse Cardiac Events, the maximum number of patients developed Congestive Cardiac Failure ie, 19 patients (26.02%). It was followed by cardiogenic shock in 15 patients (20.54%) and Tachyar Rhythmias (VT/VF) in 12 patients (16.43%). There were 5 patients (6.84%) who required ventilator support. Mortality was seen in 5 patients (6.84%).
Patients presenting with Anterior wall MI were maximum ie, 26 patients (35.61%). It was followed by patients presenting with Inferior wall MI- 18 patients (24.65%), Antero-Septal MI - 13 patients (17.80%) and Antero-Lateral MI – 8 patients (10.95%). There were 4 patients (5.47%) presenting with Posterior wall MI, 3 patients (4.10%) presenting with Infero-Posterior wall MI and 1 patient (1.36%) presenting with Lateral wall MI.
According to our study, average T p-e / QT ratio was maximum in Infero-Posterior Wall MI patients which was 0.31 followed by Anterior Wall MI patients and Antero-Lateral MI patients which was 0.27. Average T p-e / QT ratio of patients presenting with Inferior Wall MI was 0.25; of patients presenting with Antero-Septal MI was 0.21; of patients presenting with Posterior Wall MI was 0.21 and of patients presenting with Lateral Wall MI was 0.20
Major Adverse Cardiac Events were seen maximum in patients of AnteriorWall
Table 2 — Distribution of STEMI patients according to Tp-e/ QT ratio
Tp-e/ QT ratio (in ECG atNo of casesCases (%) the time of admission)(n=73)
MI followed by patients of Antero-Lateral wall MI, Inferior wall MI, Infero-Posterior Wall MI and Posterior wall MI.
No Major Adverse Cardiac Events were seen in patients of Antero-Septal wall MI and Lateral wall MI (Table 3).
On correlation of MACE with ECG, CCF was seen in all the 8 patients (100%) having Tp-e/QT ratio >0.35, in 10 patients (41.66%) with ratio in the range of 0.25-0.35 followed by 1 patient (2.43%) with ratio <0.25. P value is <0.0001 which is statistically significant.
Tachyar-rhythmias, VT/VF were seen in 6 patients (75%) having T p-e/QT ratio > 0.35, in 6 patients (25%) having Tp-e /QT ratio in range of 0.25-0.35 and none having <0.25 ratio. P value is <0.0001 which is statistically significant.
Shock was seen in 5 patients (62.5%) having Tpe / QT ratio >0.35, in 9 patients (37.5%) having ratio 0.25-0.35 followed by 1 patient (2.43%) having ratio <0.25. P value is <0.0001 which is statistically significant.
Ventilator support was needed in 2 patients (25%) having ratio >0.35, in 3 patients (12.5%) having ratio 0.25-0.35 and none having ratio <0.25. P value is 0.01 which is statistically significant.
Death occurred in 3 patients (37.5%) having ratio >0.35, in 2 patients (8.33%) having ratio 0.25-0.35 and none with ratio <0.25. P value is 0.0013 which is statistically significant (Table 4).
DISCUSSION
The interval from the peak of the T wave (which coincides with end of repolarization of epicardial cells)
Table 3 — Details of Wall Involved and Major Adverse Cardiac Events (MACE) in STEMI patients
MI accordingCCF VT/VF(Ventricular ShockVSDeath to Wall(CongestiveTachycardia/(Ventilatory InvolvementCardiacVentricularSupport) Failure)Fibrillation)
Table 4 — Correlation of Tp-e / QT ratio and Major Adverse Cardiac Events (MACE) in STEMI patients
MACE (Major AdverseTp-e/QTratiop value
Cardiac Events)<0.250.25-0.35>0.35
CCF (Congestive Cardiac Failure) :
Present1(2.43%)10(41.66%)8(100%)<0.0001
Absent40(97.56%)14(58.33%)0
VT/VF (Ventricular Tachycardia/Fibrillation) :
Present06(25%)6(75%)<0.0001
Absent41(100%) 18(75%)2(25%)
Shock :
Present1(2.43%)9(37.5%)5(62.5%)<0.0001
Absent40(97.56%)15(62.5%)3(37.5%)
VS (Ventilatory Support) :
Present03(12.5%)2(25%)<0.01
Absent41(100%)21 (87.5%)6(75%)
Death :
Present02(8.33%)3(37.5%)<0.0013
Absent41(100%)22(91.66%)5(62.5%)
to the end of the T wave (which coincides with the end of repolarization of endocardial cells) serves as an index of total dispersion of repolarization (transmural, apicobasal and global). This descending limb of T wave correlates with relative refractory period. If it is prolonged, that means myocardium is more vulnerable. So, changes in this parameter (Tpe interval) may forecast the risk of ventricular arrhythmia and other complications13.
Among other ECG parameters, QT interval denotes ventricular depolarization and repolarization. QT Interval is taken as the distance between the beginning of the Q wave and the end of T wave. But it varies according to heart rate.
In comparison with T p-e interval and QT interval, Tp-e / QT ratio is shown to be a more sensitive index of ventricular repolarization, as it provides an estimate of the dispersion of repolarization relative to the total duration of repolarization. Moreover, Tp-e/QT ratio (standardizing T p-e interval with corresponding QT interval) was found to remain constant despite dynamic changes in heart rate. This novel index has been suggested to be surrogate marker of arrhythmogenesis, other major complications and sudden Cardiac Death14
A higher Tp-e/QT ratio has been linked to arrhythmia and subsequent adverse events in a variety of clinical conditions including myocardial infarction.
Patients with acute ST elevation MI, can present with many life threatening immediate, early and late complications. Out of all these cardiac arrhythmias, particularly tachyarrythmias, Cardiogenic Shock, CCF, hypoxia needing ventilator support and sudden Cardiac Death are major adverse cardiac events
known as MACE15.
Our study was done in patients presenting with acute ST elevation MI to assess Tp-e/QT ratio in ECG and to evaluate its relationship with Age, Sex, Hypertension, Diabetes Mellitus, Wall Involved and MACE (including CCF, VT/VF, Shock, Ventilator Support and Death).
Out of all our enrolled patients, maximum number of patients, total 29 (39.72%) were in age group of 56-65 years and minimum number, total 4 (5.47%) were in age group of <35 years.
Mean age in the study group was 57.28 with Standard Deviation of 13.08 years.
In similar study done by Kiran GR, et al16, out of 321 subjects the majority of patients, 196 (61.1%) belonged to the age group of 50-69 years; followed by 50 (15.6%) in age group 40-59 years; followed by 44 (13.7%) in age group more than 70 years and followed by 31 (9.6%) in age group less than 30 years. According to Nag T, et al17, majority (73.3%) patients had age >60 years and 11.8 % patients had age between 20 to 39 years. According to study by Walia R, et al18, the mean age± SD (year) was 42.7±16.6 year.
We had total 48 Males (65.75%) and 25 Females (34.24%) for study participation. In study by Kiran GR, et al16, out of total 321 patients, 73.2% Males and 26.8% Females were enrolled. According to Walia R, et al18, the study population included 2227 subjects, of which there were 1068 Men and 1159 Women, ie, 48% Males and 52% Females. According to Deora S, et al19, the study population included 611 subjects, there were 589 Men and 22 Women, ie, 96.4% males and 3.6% females. According to Katakam PC, et al20 the study population included 126 subjects there were 109 men and 17 women, ie, 86.5% Males and 13.5% Females.
We enrolled 39 patients (53.42%) of hypertension, while similar study by Kiran GR, et al16 had 39.2 %, Walia R, et al18 had 43.6%, Deora S, et al19 had 10 % and Katakam PC, et al20 had 52 % hypertensive patients.
We enrolled 37 patients (50.68%) of diabetes while similar study by Kiran GR, et al16 had 34.5 %, Walia R, et al18 had 16.4 %, Deora S, et al19 had 8.9 % and Katakam PC, et al20 had 19% Diabetes patients.
During our study we found maximum number of patients with anterior wall involvement followed by inferior wall and antero-septal MI. Similar proportion was seen in study by Kiran GR, et al16, Pandya T, et al21, Zachariah G, et al22
During our study, Tp-e / QT ratio was within the
Vol 122, No 10, October 2024Journal
normal ratio of <0.25 in 41 patients (56.16%), followed by 24 patients (32.87%) present with ratio between 0.25-0.35. There were 8 patients (10.95%) presenting with very high Tp-e / QT ratio, ie, more than 0.35.
Study by Saylýk F, et al23, and Shu J, et al24 had found that as compared to healthy individuals, T p-e / QT ratio was abnormally high in patients with complicated Ischaemic Heart Disease.
Out of 73 subjects in our study, MACEwere found overall in 25 (34.24%) patients. It included 19 patients (26.02%) of CCF, 15 patients (20.54%) of Cardiogenic Shock, 12 patients (16.43%) of tacharrhythmias, 5 patients (6.84%) needing Ventilator Support and death in 5 patients (6.84%). According to Kiran GR, et al16 , out of 321 patients included in study, during hospitalization about 66 (20.5%) patients experienced MACE. Out of which 58 patients (18.1%) had heart failure, 33 patients (10.3%) had Ventricular Tachyarrhythmias and 27 patients (8.4%) had Cardiogenic Shock. The in-hospital all cause mortality was seen in 16 patients (5%). According to Zhao X, et al25, out of 338 subjects, 99 subjects (29.3%) had MACE. Mortality was seen in 29 subjects (8.6%). According to Reza AT, et al26, out of 178 subjects, 19 subjects (10.7%) had MACE. According to Shu J, et al 24 , out of 120 subjects, 34 subjects showed malignant ventricular arrhythmia.
We also found in this study that Anterior wall MI patients had maximum number of MACE followed by Antero-lateral wall MI, Inferior wall MI, Infero-posterior wall MI and Posterior wall MI. No MACE were seen in patients with Anteroseptal and Lateral wall MI. Average T p-e / QT ratio was also found higher in Anterior wall MI, Infero-posterior wall MI and Anterolateral wall MI. Study by Kiran GR, et al16,Özbek SC, et al27, Reza AT, et al26 had also similar findings.
There was statistically significant association found between high T p-e / QT ratio and MACE in present study. MACE were highest in patients with ratio >0.35, followed by mid range ratio of 0.25-0.35 and lowest for normal range of ratio <0.25.According to Kiran GR, et al16,Tp-e / QT ratio is significantly higher in patients experiencing MACE and who died in hospital.
According to Zhao X, et al25, out of 388 subjects, 115 subjects had high Tp-e / QT ratio. Out of 115 subjects with high Tp-e / QT ratio, MACE was seen in 48.1% subjects of which death was seen in 21.9% subjects. According to Reza AT, et al26, out of 178 subjects, 82 subjects had high Tp-e / QT ratio. Out of 82 subjects with high Tp-e / QT ratio, there was occurrence of malignant ventricular arrhythmia in 16
subjects (19.5%). According to Shu J, et al24,Tp-e/ QT ratio in patients with acute Myocardial Infarction is obviously longer than that in healthy individuals and has a notable association with malignant ventricular arrhythmia. According to Shenthar J, et al28 Tpeakend/QT ratio is prolonged in patients with STEMI compared with healthy individuals and higher Tpeakend/QT ratio predicts malignant ventricular arrhythmias. According to Mugnai G, et al29,Tpeakto-Tend /QT remains a predictor of early ventricular arrhythmias and arrhythmic death.
CONCLUSION
Patients having abnormally high T p-e / QT ratio in ECG was strongly associated with major adverse cardiac events during hospital stay, which was statistically significant. ECG being primary modality in diagnosing MI, can serves as easy, bedside, affordable and feasible tool to predict poor prognosis, need of close monitoring and early referral for MI patients. There should be routine practice to calculate T p-e / QT ratio in ECG done on arrival for MI patients. Financial Support and Sponsorship : Nil Conflicts of Interest : There are no conflicts of interest.
REFERENCES
1Benjamin EJ, Muntner P, Alonso A — 2019 Heart disease and stroke statistics-2019 update: a report from the American Heart Association. Circulation 2019; 139: e58-e528.
2Gupta R, Joshi P, Mohan V, Reddy KS, Yusuf S — Epidemiology and causation of coronary heart disease and stroke in India. Heart 2008; 94:16-26.
3Yusuf S, Hawken S, Ounpuu S — Effect of potentially modifiable risk factors associated with myocardial infarction in 52 countries (the INTERHEART study): case-control study. Lancet 2004; 364: 937-52.
4Bawaskar HS, Bawaskar PH, Bawaskar PH — Preintensive care: thrombolytic (streptokinase or tenecteplase) in ST elevated acute myocardial infarction at peripheral hospital. J Family Med Prim Care 2019; 8: 62-71.
5Chien CW, Wang CH, Chao ZH — Different treatments for acute myocardial infarction patients via outpatient clinics and emergency department. Medicine 2019, e13883, 98.
6Wang K, Chen ., Liu L — The effects of atorvastatin on interventional therapy in patients with acute myocardial infarction. Minerva Med 2019; 110: 101-6.
7Henkel DM, Witt BJ, Gersh BJ — Ventricular arrhythmias after acute myocardial infarction: a 20-year community study. Am Heart J 2006; 151: 806-12. doi: 10.1016/ j.ahj.2005.05.015.
8Khairy P, Thibault B, Talajic M — Prognostic significance of ventricular arrhythmias post-myocardial infarction. Can J Cardiol 2003; 19: 1393-1404.
9Castro Hevia J, Antzelevitch C, TornesBarzaga F — Tpeak-
Vol 122, No 10, October 2024Journal of the Indian Medical Association
Tend and Tpeak-Tend dispersion as risk factors for ventricular tachycardia/ventricular fibrillation in patients with the Brugada syndrome. J Am Coll Cardiol 2006; 47: 1828-34.
10Kanters JK, Haarmark C, Vedel-Larsen E — Tpeak Tend interval in long QT syndrome. J Electrocardiol 2008; 41: 603-8.
11Kors JA, Ritsema van Eck HJ, van Herpen G — The meaning of the Tp-Te interval and its diagnostic value. J Electrocardiol 2008; 41: 575-80.
12Gupta P, Patel C, Patel H — Tp-e/QT ratio as an index of arrhythmogenesis. J Electrocardiol 2008; 41: 567-74
13Zehir R, Karabay CY, Kalaycý A, Akgün T, Kýlýçgedik A, Kýrma C — Evaluation of Tpe interval and Tpe/QT ratio in patients with slow coronary flow. Anatolian Journal of Cardiology 2015; 15(6): 463.
14Li D, Weng Y, Zhen G, Jiang L — Tp-Te Interval and Tp-Te/ QT Ratio Are Valuable Tools in Predicting Poor Outcome in Sepsis Patients. Frontiers in Cardiovascular Medicine 2022; 9.
15Libby P, Bonow RO, Mann DL, Tomaselli GF, Bhatt D, Solomon SD, et al — Braunwald’s Heart Disease-E-Book: A Textbook of Cardiovascular Medicine. Elsevier Health Sciences; 2021 Oct 15.
16Kiran GR, Ramesh K, Chandrashekar V — Association between QTd, Tp-e/QT Ratio and In-hospital Prognosis in Thrombolysed Acute ST-elevation Myocardial Elevation (STEMI) Patients. The Journal of the Association of Physicians of India 2017; 65(12): 24-39.
17Nag T, Ghosh A — Cardiovascular disease risk factors in Asian Indian population: A systematic review. Journal of cArdiovascular Disease Research 2013; 4(4): 222-8.
18Walia R, Bhansali A, Ravikiran M, Ravikumar P, Bhadada SK, Shanmugasundar G, et al — High prevalence of cardiovascular risk factors in Asian Indians: A community surveyChandigarh Urban Diabetes Study (CUDS). The Indian journal of Medical Research 2014; 139(2): 252.
19Deora S, Kumar T, Ramalingam R, Manjunath CN — Demographic and angiographic profile in premature cases of acute coronary syndrome: analysis of 820 young patients from South India. Cardiovascular Diagnosis and Therapy 2016; 6(3):193.
20Katakam PC, Srinivas P, Dasari SK, Tirumala MVV, Komanapalli RK, Palla DS — Analysis of Risk Factors of Myocardial Infarction in the Young (<40 years). JMSCR 2019; 7(12): 683-6.
21Pandya T, Suranagi MJ, Subramanyam K, Srinivasa KH — Study of young Indians with ST elevation myocardial infarction: risk factors, clinical presentation, angiographic profile and short-term prognosis. Int J Contemp Med Surg Radiol 2020; 5: D7-13.
22Zachariah G, Ramakrishnan S, Das MK, Jabir A, Jayagopal PB, Venugopal K, et al — Changing pattern of admissions for acute myocardial infarction in India during the COVID-19 pandemic. Indian Heart Journal 2021; 73(4): 413-23.
23Saylýk F, Çýnar T, Selçuk M, Akbulut T — Association of Tpe/QT ratio with SYNTAX score II in patients with coronary artery disease. Scandinavian Cardiovascular Journal 2022; 56(1): 325-30.
24Shu J, LI H, Yan G, Cui C — Tp-e/QT ratio as a predictive index of sudden cardiac death in patients with ST-segment elevation myocardial infarction. Journal of Xi’an Jiaotong University (Medical Sciences). 1982.
25Zhao X, Xie Z, Chu Y, Yang L, Xu W, Yang X, et al — Association between Tp e/QT ratio and prognosis in patients undergoing primary percutaneous coronary intervention for ST segment elevation myocardial infarction. Clinical Cardiology 2012; 35(9): 559-64.
26Reza AT, Rashid MM, Hossain MM, Hussain KS, Rahman MT, Ahsan MM, et al — Association of Increased Tpeak-toend/QT ratio with Malignant Ventricular Arrhythmias in Acute Anterior ST-Segment Elevation Myocardial Infarction. Bangladesh Heart Journal 2017; 32(1): 10-7.
27Özbek SC, Sökmen E — Usefulness of Tp-Te interval and Tp-Te/QT ratio in the prediction of ventricular arrhythmias and mortality in acute STEMI patients undergoing fibrinolytic therapy. Journal of Electrocardiology 2019; 56: 100-5
28Shenthar J, Deora S, Rai M, Manjunath CN — Prolonged Tpeak-end and Tpeak-end/QT ratio as predictors of malignant ventricular arrhythmias in the acute phase of ST-segment elevation myocardial infarction: a prospective case-control study. Heart Rhythm 2015; 12(3): 484-9.
29Mugnai G, Benfari G, Fede A, Rossi A, Chierchia GB, Vassanelli F, et al — Tpeak-to-Tend/QT is an independent predictor of early ventricular arrhythmias and arrhythmic death in anterior ST elevation myocardial infarction patients. European Heart Journal: Acute Cardiovascular Care 2016; 5(6): 473-80.
Original Article
Evaluation of the Impact of Reinforced Training of BLS on the Ability to Retain the Imparted Knowledge and Skill amongst OT Personnel Including Nursing Staff and Technicians : A Prospective Interventional Study
Background : Operation Theatre being a critical area, it is vital for OT staff to have knowledge and skills of Basic Life Support (BLS). Although this training is conducted as a part of induction, retention of knowledge and skills remains questionable. This prospective interventional study included OT nurses, technicians and patient attendants. A pre-test comprising of 25 structured questions was used to assess baseline knowledge of BLS and training was conducted based on AHA guidelines, followed by assessment. Reinforced training was conducted every month, which concentrated on specific aspect of BLS. Post-test and Objective Structured Clinical Examination (OSCE) were conducted immediately, 3 months and 6 months later to assess retention of Knowledge and Skills.
Results : Average scores for questionnaire were 12.54 (Pre-test), 16.61 (Post test), 18.24 (3 months) and 19.60 (6 months). OSCE scores were 13.24 immediately following training, 13.6 at 3rd months and 13.7 at 6th months. Teamwork with good team dynamics is essential for favorable outcome of cardio-pulmonary resuscitation. In Crisis situations in OT, optimum assistance must be ensured for better outcome. It has been observed that knowledge and skills were improved immediately following training, but it does not ensure retention. AHA proposes reinforced training at shorter intervals with focus on specific content, thus ensuring retention. Reinforcing BLS training of OT personnel at periodic intervals results in positive outcome especially in critical zone such as Operation Theater. BLS training should be reinforced for staffs in critical areas at regular interval
Key words :Cardio Pulmonary Resuscitation, Nurse Training.
Cardiac arrest is a medical emergency that mandates immediate initiation of Cardiopulmonary Resuscitation for improved survival. Literature suggests an incidence of more than 3 million cardiac arrests per year worldwide with a survival rate less than 8%1-3. Along with updated knowledge and skills, a good team dynamic is essential for a favourable outcome of CardioPulmonary Resuscitation (CPR)4 Operation Theatre (OT) being a critical area in the hospital, it is essential for OT staff to have knowledge and skills regarding Basic Life Support (BLS) Anaesthesiologist, being the team leader in critical situations, needs assistance from the team members including nurses, technicians
1 MBBS, DA, DNB, Assistant Professor, Department of Anaesthesia, Symbiosis Medical College for Women, Pune, Maharashtra 412115
2MBBS, MD (Aaesthesiology), Professor, Department of Emergency Medicine, Bharati Vidyapeeth Deemed University Medical College, Pune, Maharashtra 411043 and Corresponding Author
3MBBS, MD (Preventive and Social Medicine), Assistant Professor, Department of Community Medicine, Symbiosis Medical College for Women, Pune, Maharashtra 412115
Received on : 30/06/2023
Accepted on : 13/11/2023
[J Indian Med Assoc 2024; 122(10): 39-45]
Editor's Comment :
Reinforced training of BLS shows improvement in retention of knowledge and skills amongst the OT personnel. It would be advisable to incorporate BLS trainings of OT team at regular intervals as a hospital protocol.
and helpers. Ours being a new teaching institute, we do not have support of postgraduate students and are dependent on technicians and nursing staff while handling crisis situations in perioperative period. Although Basic Life Support (BLS) training is conducted as a part of induction, retention of knowledge and skills remains questionable which in turn affects the outcome Unlike western countries, strict adherence to licensing of BLS training is yet to be developed5. American Heart Association (AHA) has emphasized on reinforcement of knowledge and skills by conducting short frequent training sessions but it has not been implemented yet.
Thus, we conducted the present study with the objectives to assess the current knowledge, to estimate the gain in knowledge and skill of performing BLS following training and to evaluate the retention of knowledge and skills with reinforced training at one, three and six months.
MATERIAL AND METHODS
Study Design :
It was a prospective interventional study conducted in a Tertiary Care Medical College Hospital.
Study Population :
The OT staff inclusive of nurses, technicians and patient care attendants willing to participate were included in the study after informed consent. Those with incomplete questionnaires or drop outs during the duration of study were excluded.
Sampling Technique :
Sampling was purposive.
Sample Size Calculation :
MATERIALS AND METHODS
After obtaining ethical clearance from the IEC and CTRI registration, the study was conducted in the Department of Anaesthesiology at a Tertiary Care Centre, Symbiosis Medical College for Women. A pretest comprising 25 structured questions was prepared based on AHA 2020 guidelines and conducted prior to training to assess the baseline knowledge. Structured and standardized training was conducted based on AHA 2020 guidelines. The format of training comprised lectures, demonstration, videos and hands-on training using mannequins.
Instructor to student ratio was 1:6 using one mannequin at skill stations. AHA certified instructors were recruited from the Department of Anaesthesiology. The skills taught were chest compression, bag-mask ventilation, chest compression and bag-mask ventilation together, defibrillation and management of cardiac arrest scenario as a team. Objective Structured Clinical Examination (OSCE) and post test questionnaire for knowledge-based assessment were administered at the end of the training session.
Thereafter, reinforcement training was planned which included short sessions related to cardiac arrest algorithm, chest compressions, bag- mask ventilation and defibrillation conducted every month. At the end of 1st month, 3rd months and 6th months, knowledge and skill-based assessments were repeated.
Questionnaire :
(1) BLS is advocated by
a) American Thoracic Society
b) World Health Organization
c) Academic Emergency Medicine
d) American Heart Association
(2) What does ‘BLS’ stand for?
a) Best Life Support
b) Basic Life Support
c) Basic Lung Support
d) Basic Life Services
(3) In Basic Life Support guidelines, the order of steps for initially starting CPR is
a) Circulation, Airway, Breathing (C-A-B)
b) Airway, Circulation, Breathing (A-C-B)
c) Airway, Breathing, Circulation (A-B-C)
d) Breathing, Circulation, Airway (B-C-A)
(4) When you find someone unresponsive in the middle of the road, what will be your first response? (Note: You are alone there)
a) Open airway
b) Start chest compression
c) Look for scene safety
d) Give two breathings
(5) Respiratory efforts should be assessed by:
a) Looking for Chest and/or abdominal movement
b) Listening for breath sounds
c) Feeling for expired air
d) All of the above together.
(6) If you confirm somebody is not responding to you even after shaking and shouting at him, what will be your immediate action?
a) Start CPR
b) Activate EMS
c) Put him in recovery position
d) Observe
(7) What does the abbreviation ‘EMS’ stand for
a) Effective Medical Services
b) Emergency Management Services
c) Emergency Medical Services
d) External Medical Support
(8) In BLS, how long will you check pulse and breathing to confirm cardiac arrest?
a) 1–5 seconds
b) 5–10 seconds
c) 10–20 seconds
d) 30–60 seconds
(9) We should check for pulse during CPR every
a) 2 minutes
b) 3 minutes
c) 5 minutes
d) 1 minute
(10) Which location is preferred to check the pulse?
a) Carotid
b) Brachial
c) Femoral
d) Radial
(11) What is the location for chest compression in adults?
a) Left side of the chest
b) Right side of the chest
c) Lower half of sternum
d) Xiphisternum
( 12) What is the location for chest compressions in infants?
a) One finger breadth below the nipple line
b) One finger breadth above the nipple line
c) At the intermammary line
d) At xiphisternum
(13) Depth of chest compressions in adults during CPR
a) 5- 6 cm
b) 4- 5 cm
c) 3- 4 cm
d) 2- 3 cm
(14) Depth of compression in infants during CPR should be
a) ½ – 1 inch
b) 1 – 1½ inches
c) 2 – 2 ½ inches
d) 2½ – 3 inches
(15) Rate of chest compression in adult and children during CPR
a) 120 -140/ min
b) 100 - 120/ min
c) 80 -100/ min
d) 60 -80/ min
(16) Ratio of chest compressions to ventilation in adult is
a) 15:2
b) 10:2
c) 20:2
d) 30:2
(17) In children the chest compression and ventilation ratio in case of lone rescuer is
a) 10:2
b) 15:2
c) 20:2
d) 30:2
(18) Which of the following is not a part of the triple manoeuvre used to clear an obstructed airway?
a) Head lift
b) Head tilt
c) chin lift
d) jaw thrust
(19) If you do not want to give mouth-to-mouth CPR, the following can be done EXCEPT
a) Mouth-mask ventilation and chest compression
b) Chest compression only
c) Bag mask ventilation with chest compression
d) Wait for EMS to arrive
(20) How do you give rescue breathing in infants?
a) Mouth-to-mouth with nose pinched
b) Mouth-to-nose only
c) Mouth-to-mouth without nose pinched
d) Mouth-to- mouth and nose
(21) What does the abbreviation AED stand for?
a) Automated External Defibrillator
b) Automated Electrical Defibrillator
c) Advanced Electrical Defibrillator
d) Advanced External Defibrillator
(22) If you and your friend are having food in a canteen and suddenly your friend starts expressing symptoms of choking, what will be your first response?
a) Give abdominal thrusts
b) Give chest compression
c) Confirm foreign body aspiration by talking to him
d) Give back blows
( 23) You are witnessing an infant who suddenly started choking while he was playing with the toy, you have confirmed that he is unable to cry (or) cough, what will be your first response?
a) Start CPR immediately at the rate of 100120/min
b) Try to remove the suspected foreign body by blind finger sweeping technique
c) Back blows and chest compression of five cycles each then open the mouth and remove foreign body only when it is seen
d) Give water to the infant and open his mouth
(24) You are witnessing an adult unresponsive victim who has been submerged in fresh water and just removed from it. He is unresponsive. What is the first step?
a) Compress the abdomen to remove the water
b) Give 2 rescue breaths followed by chest compressions
c) CPR for one minute and inform EMS
d) Keep him in recovery position
(25) CPR should be stopped in the following conditions except?
a) The patient starts breathing normally
b) Patient is not revive2d after 20 minutes of CPR
(1) Check the patient’s surroundings are safe before approaching (2) Check the patient for a response (3) Call for help if there is no response from the patient
(4) Position the patient on their back (5) Assess for a carotid pulse for 5-10 seconds (6) Simultaneously look, listen and feel for signs of breathing (7) If there are no signs of life commence CPR (8) Position the hand over lower half of the sternum (9) Perform chest compressions at a rate of 100120 compressions per minute
(10) Perform chest compressions of depth 5-6 cm (11) Allow complete chest recoil (12) Minimum interruptions between the compression (13) Advocate triple maneouver to maintain the patency of airway
(14) Deliver one breath over a second to cause adequate chest rise and to avoid excessive ventilation (15) Deliver 2 ventilations after performing 30 chest compressions
(16) Switch the personel performing chest compression every two minutes (17) Check for pulse every 2 minutes between the CPR
(18) Identifies ROSC
(19) Enumerates 5 H and 5 T
(20) Stops BLS once ROSC is achieved
Statistical Analysis :
Data was entered in MS excel spreadsheet and was analysed using EPI INFO 7.0. Appropriate statistical methods including ANOVA, Student t-test and multivariate logistic regression analysis was applied. Accounting for Boneferonni correction, a P Value <0.005 was considered statistically significant. The scores obtained in the pre-test and post test, at 1 month, 3 months and 6 months was compared OSCE scores on the day of training, at 1st month, 3rd months and 6th months were compared.
DISCUSSION
Evidence shows a poor survival rate following in hospital cardiac arrest despite having defined resuscitation teams. Multiple factors contribute towards effective resuscitation namely early identification, immediate initiation of CPR, high quality CPR and early defibrillation. Each step is critical and
deficiency at any of the steps has a negative impact on the outcome. Bircher, et al suggested that a delay in CPR for longer than 2 minutes decreases survival rates by 2.4%6. Failure of a swift response and inability to follow the algorithm-based protocols, lack of coordination among team members may result in failure to revive7.
Literature review shows that poor resuscitation skills of the team is a reality. Inadequate knowledge, training, practice and lack of update are often responsible. [8,9] Superior patient outcome is often achieved by BLS-ACLS trained personnel. It has been observed that a gap in cognitive and psychomotor components have an adverse influence on participation and, performance of other team members, not limited to individual performance. [10,11]
High quality CPR is a fundamental requirement for improved survival. AHA 2020 guidelines recommend chest compressions at a rate of 100-120/ minute, depth 5-6 cm, ensuring adequate preload as well as outflow. Avoiding excessive ventilation, leaning over the chest, allowing complete chest recoil further aid in optimum venous return prior to the next compression. Use of real time audio-visual feedback devices and minimum interruptions in compressions help in achieving the target chest compression fraction of 80%. CPR coach, a new role introduced in 2020 guidelines primarily focuses on high quality CPR, in turn enhancing the team dynamics12,13
Teaching-learning methodology plays an important role in achieving the desired outcome. Mannequinbased skill training is perceived as a contextualized methodology, hence augments learning14,15 . This methodology resonates with the adult learning theory involving discussions, active participation, hands-on training and constructive feedback. We feel that the OT team being professionals involved in patient care, would have related to the scenario-based training as a reflection of actual work.
BLS training is included in the curriculum for all the Healthcare Workers in OT, namely doctors, nurses, anaesthesia technicians. In spite of this, lacunae are observed in practical application during crisis situations. Difficulty in teaching, learning and retaining the skills and correct sequence of steps in CPR has been documented. This may be attributed to CPR being a complex task involving cognitive as well as psychomotor components4,16-18. In the present study, the pre-test scores were lower than expected, with similar results found in literature. This could be attributed to lack of continuous medical education programs with a lack of opportunity to practice and refresh BLS knowledge since completion of educational qualification.
122, No 10, October 2024Journal
With the inception of the “chain of survival” concept, effective CPR training of the whole team involved in resuscitation should be a part of the institutional goal. Despite inclusion in institutional training program, it has been observed that proficiency immediately following training is inadequate along with poor retention of skills, as evident from literature. Unlike western countries, protocol for licensing and renewal is not mandatory in India. yet to be developed. [19] To achieve the aim of improved outcome of CPR, hospitals should ensure availability of trained resuscitation teams as highest priority7.
The above said reasons further highlight the need to refresh training for proficiency, ensuring standardized quality of CPR16,17. Guidelines are reviewed at regular intervals and updated based on research. AHA has recommended six-month interval as the optimum time for repeat training of professionals in CPR to counter the deterioration of knowledge retention12
In our study, the scores for both knowledge as well as skill assessment were highest immediately following the training as expected. We observed a slight dip in knowledge which further improved at 6 months, values being more prominent compared to the OSCE values. This suggests success of the small bursts of training conducted at regular intervals in this sustained effect. The OSCE scores were maintained but not improved at 6 months in contrast to the knowledge gain. We feel that lack of adequate time for practising skills by each individual during sessions for reinforcement may be responsible for the same. OT is a critical zone in a hospital where crisis situations are encountered frequently. This mandates
Table 1— Distribution of Mean scores of the post test at various months
Mean± SD0 month1 month3 month6 month
Post test19.59±2.716.61±3.1316.93±2.7918.24±2.14 OSCE13.67±1.19
Pretest mean : 12.54±2.96 given at zero month
Fig 1 — Distribution of mean scores of the tests conducted at various intervals
According to the Fig 1, the pre-test was considered constant which was given once at 0 month. Both Post test and OSCE line graphs suggest improvement better than pre-test scores at all levels. The above line graph suggests that the mean values of the tests
are maximum immediately post intervention at zero month, followed by steady decline at 1st month. However, at 3rd and 6th month, there is a steady improvement in performance. The post-test values are more prominent due to the intervention compared to the OSCE values. This suggests the success of knowledge gained by the participants immediately post intervention more and retention of knowledge gained in only few participants over a period of 6 months.
2 — Graphs at 0 month
3 — Graphs at 1st month
4 — Graphs at 3rd month
Fig 5 — Graphs at 6th month
The above Figs 2, 3, 4 and 5 depict pictorially with bar graph and histogram the same Mean±SD at various months showing maximum mean score values post 1st intervention at 0 month.
Fig
Fig
Fig
122, No 10, October 2024Journal
Table 2 — Distribution of paired t test scores and effect size of knowledge at various intervals
012.5±319.6±2.6 22.6<0.0012.76
112.5±316.6±3.1 13.7<0.0011.67
312.5±316.9±2.8 15.7<0.0011.92
612.5±318.2±2.1 18.5<0.0012.26
Fig 6 — Distribution of paired 't' test scores and effect size of knowledge at various intervals
According to table 2, the paired 't' test at various months shows highly significant for post tests with highest magnitude at immediately after knowledge dissemination at zero month with 't' value of 22.6 at p<0.001. This is followed by a steady decline at 1st month. However, a quick rise at 3rd month and catchup rise at 6th month. This suggests a good gain in knowledge level at 1st time with few drop in knowledge retention levels. The same is depicted in the line graph shown in Fig 6. The effect size is the magnitude of difference between average of observed differences and expected differences which is larger at zero month comparatively and follows similar in trend with that of 't' value. The results are found to be highly significant statistically.
Table 3 — Distribution of test scores of OSCE based on one way ANOVA test
Table 3 shows One way ANOVA test, using F distribution df(3,264) (right tailed) the difference between the averages of all groups is not big enough to be statistically significant as p-value equals 0.401205, [p( x <F)=0.598795 ]. The test statistic F equals 0.983104, and the observed effect size f is small (0.11) which indicates that the magnitude of the difference between the averages is small.
Table 5 — Distribution of test scores based on Tukey HSD / Tukey Kramer test and comparison with critical mean Group1st month3rd month6th month 0 month0.430.330.075 1 month00.10.36 3 month0.100.25
Applying the Tukey HSD / Tukey Kramer shows there is no significant difference between the means of any pair as shown in Table 4 and Table 5.
Fig 7 — Comparison of difference between mean values and critical values of different groups
Fig 7 shows that the difference of means between different groups where x1 – 0 month, x2 – 1 month, x3 – 3 month, x4 – 6 month. There is no difference and therefore OSCE has no difference as no intervention given at various levels and thus the knowledge gained remains same throughout almost.
a swift response of the whole team in a synchronized manner. Periodic training along with recreation of emergency scenarios in a simulated environment will enhance the performance. This will further boost the confidence and performance while handling emergencies19
Being a new institute, we often face a shortage of trained qualified junior anaesthetists for help. Thus, dependency on the team consisting of technicians and nursing staff is very high. Right timely assistance by a trained team helps the anaesthesiologist in the leader’s role to focus on other important aspects such as decision making. Hence, regular revision of algorithms and practice of steps is extremely relevant and essential for OT personnel.
Table 4 — Distribution of test scores based on Tukey HSD / Tukey Kramer test
Stress associated with CPR is a known entity with multifactorial etiology. Lack of confidence, inadequate training, inappropriate conduct of CPR and poor outcome may contribute to the associated stress. Stress itself may result in suboptimal performance. Failure to revive a patient may lead to a negative perception about CPR. Protocol based training, supervised mannequine based practice, formative
122, No 10, October 2024Journal
feedback and remediation of all the team members will be helpful in gaining confidence and competence which in turn will aid in reducing stress level7
CONCLUSION
To summarize, we propose that video based BLS training using mannequins with hands on component is an effective Teaching-learning methodology. Cardiac arrest scenarios further added to the relevance, enhancing the team dynamics. Conduct of short bursts of training at regular intervals helps in reinforcing the knowledge and skills related to BLS, thus enhancing retention.
Limitations : Diversity of the inclusion critera may have influenced the results.
The present study was conducted over a limited period of 6 months. Long term investigation may be required for generalizing the results.
Future directives : Policy with respect to licensing and periodic revision of BLS among OT personnel needs to be developed at the institutional as well as national level.
REFERENCES
1Boriani G, Valzania C, Diemberger I, Biffi M, Martignani C, Bertini M, et al — Potential of non-antiarrhythmic drugs to provide an innovative upstream approach to the pharmacological prevention of sudden cardiac death. Expert Opin Investig Drugs 2007; 16: 605-23.
2Josephson M, Wellens HJ — Implantable defibrillators and sudden cardiac death. Circulation 2004; 109: 2685-91.
3Sasson C, Rogers MA, Dahl J, Kellermann AL — Predictors of survival from out-of-hospital cardiac arrest: A systematic review and meta-analysis. Circ Cardiovasc Qual Outcomes 2010; 3: 63-81.
4Christenson J, Nafziger S, Compton S, Vijayaraghavan K, Slater B, Ledingham R, et al — PAD Investigators. The effect of time on CPR and automated external defibrillator skills in the Public Access Defibrillation Trial. Resuscitation 2007; 74(1): 52-62. doi: 10.1016/j.resuscitation.2006.11.005. Epub 2007 Feb 14. PMID: 17303309; PMCID: PMC2718839.
5Nambiar M, Nedungalaparambil NM, Aslesh OP — Is current training in basic and advanced cardiac life support (BLS & ACLS) effective? A study of BLS & ACLS knowledge amongst healthcare professionals of North-Kerala. World J Emerg Med 2016; 7(4): 263-9. doi: 10.5847/wjem.j.19208642.2016.04.004. PMID: 27942342; PMCID: PMC5143309
6Bircher NG, Chan PS, Xu Y — American Heart Association’s Get With The Guidelines–Resuscitation Investigators. Delays in Cardiopulmonary Resuscitation, Defibrillation, and Epinephrine Administration All Decrease Survival in In-hospital Cardiac Arrest. Anesthesiology 2019; 130(3): 414-22. doi: 10.1097/ ALN.0000000000002563. PMID: 30707123.
7Morgan R, Westmoreland C — Survey of junior hospital doctors’ attitudes to cardiopulmonary resuscitation. Postgrad Med J 2002; 78(921): 413-5. doi: 10.1136/pmj.78.921.413. PMID: 12151657; PMCID: PMC1742414.
8Sampaio LABN — Avaliação do processo ensinoaprendizagem da técnica de ressuscitação cardiopulmonar pela equipe de enfermagem [Tese]. Ribeirão Preto: Escola de Enfermagem de Ribeirão Preto, Universidade de São Paulo; 2003.
9Madden C — Undergraduate nursing students’ acquisition and retention of CPR knowledge and skills. Nurse Educ Today 2006; 26 (3): 218-27
10Verplancke T, De Paepe P, Calle PA, De Regge M, Van Maele G, Monsieurs KG — Determinants of the quality of basic life support by hospital nurses. Resuscitation 2008; 77(1): 75-80.
11Coelho OR, Cirillo W, Barbeiro RMD, Barbeiro AS — Ressuscitação cardiopulmonar. Rev Soc Cardiol Estado de São Paulo 1997; 7: 1-3.
13Abbas A — Knowledge of first aid and basic life support amongst medical students:a comparison between trained and untrained students. JPMA 2011; 61: 613
14Farah R, Stiner E, Zohar Z, Eisenman A, Zveibil F — The importance of CPR training for assessing the knowledge and skills of hospital medical and nursing personnel. Harefuah 2007; 146 (7): 529-33.
15Hopstock LA — Motivation and adult learning: a survey among hospital personnel attending a CPR course. Resuscitation 2008; 76 (3): 425-30.
16Lima, Sandro & Macedo, Larissa & Vidal, Marcela & Sá, Michel. (2009). Permanent education in BLS and ACLS: Impact on the knowledge of nursing professionals. Arquivos brasileiros de cardiologia. 93. 582-8, 630.
17Morgan CL, Donnelly PD, Lester CA, Assar DH — Effectiveness of the BBC’s 999 training roadshows on cardiopulmonary resuscitation: video performance of cohort of unforewarned participants at home six months afterwards. BMJ 1996; 313: 912-6. [PMC free article] [PubMed] [Google Scholar]
18Chamberlain D, Smith A, Woollard M — Trials of teaching methods in basic life support (3): comparison of simulated CPR performance after first training and at 6 months, with a note on the value of re-training. Resuscitation 2002; 53: 17987. [PubMed] [Google Scholar]
19Bhavar TD, Shetti AN, Gulve PB, Yenurkar PP — Evaluation of knowledge and skills of MBBS interns in basic life support/ advanced cardiovascular life support and their ability to retain. Indian Anaesth Forum 2021; 22: 86-90.
Original Article
Assessment of Perceived Stress in Healthcare Professionals Working in a COVID Hospital in West Bengal during COVID-19 Pandemic
Background : Pandemic, being unprecedented that can leads to several mental health problems, especially among the front-line Healthcare Professionals (HCPs). Front-line HCPs often suffer from many psychiatric morbidities like Anxiety, Depression, Burnout, Insomnia and Stress-related disorders. Despite the huge burden of mental health problems among the front-line HCPs, their psychological health is frequently overlooked.
Aims : This study is aimed to investigate the Perceived Stress in different Healthcare Professionals (HCPs) and to observe any changes occur in this COVID pandemic situation.
Objective : (1) To assess the Perceived Stress in HCPs. (2) To identify the factors associate with Perceived Stress in HCPs.
Materials and Methods : The present study was a Hospital based Cross-sectional observational study. This study was conducted 1.5 years at College of Medicine and Sagore Dutta Hospital, Kamarhati.
In 126 HCPs (Consultants, Senior Resident, Junior Residents, Interns, Nurses, Paramedical Staffs, Non-clinical staffs) were included in this study. 10 Item Perceived Stress Sale (1) was used to assess the psychiatric morbidity.
Result : In our study 65(51.6%) HCPs had low stress, 47(37.3%) HCWs had moderate stress and 14(11.1%) HCWs had High Perceived Stress. 46.15% of Consultants had low stress, 53.84 % had moderate stress but no one had severe perceived stress, in Senior residents 60% had low stress, 20% had moderate and 20% had severe stress, 52.94% Junior Residents had low stress and moderate and severe stress in Junior Resident are 29.41%,17.64% respectively. 55% Interns faced moderate stress where as low stress and severe level of stress in interns are 25% and 20% respectively. 61.11% Nurses had low level stress and 27.77% had moderate stress and only 11.11% had severe stress.
Conclusion : Healthcare Professionals had to do their duty in many adverse situations in COVID pandemic. They had face tremendous mental and physical pressure, frequently they became exhausted, in spite this they did their duty properly and saved millions of lives.So, their mental health should be assessed and proper intervention should be taken.
Key words :HCPs, PSS SCALE, COVID-19, Perceived Stress.
Currently, the entire humanity worldwide is facing a severe healthcare crisis, that is, the unprecedented COVID-19 pandemic for the 21stcentury population. In simpler words, a pandemic is defined as ‘an epidemic occurring worldwide, or over a very wide area, crossing international boundaries and usually affecting a large number of people’. However, it is not the first time that humanity is facing a pandemic. Over the last century, many pandemics such as Spanish flu, Severe Acute Respiratory Syndrome (SARS), Middle East Respiratory Syndrome (MERS), Ebola, Swine flu, and so on have emerged and been tackled. Existing literature supports that pandemic, apart from causing mortality
Department of Psychiatry, College of Medicine & Sagore Dutta Hospital, Kolkata, West Bengal 700058
1MBBS, MD, Senior Resident and Corresponding Author
2MBBS, MD, Senior Resident,
3MBBS, MD, Assistant Professor
4MBBS, MD, Associate Professor, 5MBBS, MD, Professor and Head
Received on : 20/09/2023
Accepted on : 15/11/2023
[J Indian Med Assoc 2024; 122(10): 46-8]
Editor's Comment :
All Healthcare professionals are vulnerable to get stressed or any mental health issues in this pandemic situation, which hampered there efficiency and productivity. They should visit nearby facility for mental wellbeing. Mental health professionals should come forward to help all healthcare workers.
and physical morbidities, also leads to tremendous mental health problems [Insomnia, Anxiety, Depression, Stress-related Disorders including Posttraumatic Stress Disorders (PTSD)] in the sufferers as well as in the non- infected public and in Healthcare professional.
Review of Literature :
Jaber MJ, et al2 found Healthcare Professionals (HCPs) were already vulnerable to mental health issues prior to the COVID-19 pandemic, but now they are even more prone to stress and frustration. Participants reported moderate to extremely severe levels of stress (26.5%) during COVID pandemic.
Lai J, et al3 found that a considerable proportion
122, No 10, October 2024Journal
of participants reported symptoms of Depression (50.4%), Anxiety (44.6%), Insomnia (34.0%) and Distress (71.5%).
MATERIALS AND METHOD
Study place : College of Medicine and Sagore Dutta Hospital, Kamarhati.
Study population : All categories of Healthcare Professionals working in COVID wing of College of Medicine and Sagore Dutta Hospital.
Study period : 1 year 6 months.
Study design : Cross-sectional Observational Study.
Sample size/design : There are about 898 Healthcare Professionals (HCPs) Consultants, Senior Resident,Junior Residents, Interns, Nurses, Paramedical Staffs, Non-clinical staffs working in this 500 bedded COVID tertiary centre. From the ‘National Mental Health Survey of India, 2015-2016' it is found that the orevalence of any Mental disorder is 10.6%.
In my study Targeted Population is 898. Now I am using Epi Info software, 95% Confidence Interval with 5% error of margin the sample size is 126 in my study. By using computer generated random number table, which will generates 200 random number from the range of 1 to 898. In 74 extra number is chosen because if any subject refuse to participate in the study or getting excluded as per Incusion and Exclusion criteria.
Inclusion criteria :
(1) Healthcare Professionals working in COVID wing of College of Medicine and Sagore Dutta Hospital.
(2) Who are giving consent for the study.
Exclusion criteria :
(1) Who having known psychiatric problems.
(2) Who are not willing to participate for the study.
Perceived Stress Scale (PSS) was used to assess the Perceived Stress in HCPs.
RESULT
In this study, 13 (10.3%) HCPs were consultant, 20 (15.9%) HCPs were Intern, 17 (13.5%) patients were Junior Resident (JR), 23 (18.3%) HCPs were Non-clinical staff, 36 (28.6%) HCPs were nurse, 12 (9.5%) HCPs were Paramedical Staff and 5 (4.0%) HCPs were nurse (Table 1).
In this study, 85 (67.5%) HCPs were Female and 41 (32.5%) HCPs were Male (Table 2).
The Table 3 showing In Consultant, the mean PSS (Mean±SD) was 14.2308±7.3467.
In Intern, the mean PSS (Mean±SD) was 18.9500± 2.3681.
In Junior Resident (JR), the mean PSS (Mean±SD) was 17.4706± 6.6543.
In Non-clinical Staff, the mean PSS (Mean± SD) was 11.8261± 8.0725.
In Nurse, the mean Age (Mean±SD) was 12.2778± 8.7732.
In Paramedical Staff, the mean PSS (Mean±SD) was 13.8333± 8.7918.
In Senior Resident (SR), the mean PSS (Mean±SD) of was 12.6000± 5.8138.
Distribution of mean PSS with Healthcare professional was statistically significant (p<0.0001)
In our study 65(51.6%) HCPs had Low Stress, 47(37.3%) HCPs had Moderate Stress and 14(11.1%) HCPs had high perceived stress (Table 4).
Table 5 showing 46.15% consultant had low stress, 53.84% had moderate stress but no one had severe stress, in Senior Resident 60%had low stress, 20%
Table 5 — Association between Stress and Category of Healthcare Professionals (P value <0.001)
Category of StaffStress level
LowModerateSever
Consultant46.15%53.84%0%
Senior Resident60%20%20%
Junior Resident52.94%29.41%17.64%
Intern25%55%20%
Nurse27.77%61.11%11.11%
Paramedics41.66%50%8.33%
Non-clinical Staff 73.9%26%0%
had moderate and 20% had severe stress, 52.94% Junior Resident (JR) had low stress and moderate and severe stress, in Junior Resident are 29.41%,17.64% respectively. 55% Intern faced moderate stress where as low stress and severe level of stress in Intern are 25% and 20% respectively. 61.11% nurse had moderate level stress and 27.77% had low stress and only 11.11% had severe stress. Among Paramedics 50% had moderate stress,among Non-clinical staffs 73.9% had low stress.
DISCUSSION
A study was done in India during COVID pandemic found that proportion of Healthcare Workers under low (PSS 1-13), moderate (PSS 14-26) and severe (PSS 27-40) stress was 15.65%, 78.26% and 6.09% respectively. This findings co-relate with current study4. Another study found that the prevalence of stress, as well as anxiety/depression, is higher in registered nurses compared to physicians. This findings also co-relate with current study5.
CONCLUSION
In summary, our study is a significant addition to the growing body of literature that lights on the growing mental health crisis amongst Healthcare Professionals in India. This study suggests that the mental health should be carefully monitored during the pandemic, and hospitals and workplaces should give psychological support for adapting to these circumstances through targeted intervention. A comprehensive and proactive strategy of providing mental health services on the entire Healthcare Professionals should be a key focus of all health care institutions and adequate resources should be provided in this direction.
REFERENCES
1Cohen S, Kamarck T, Mermelstein R — A global measure of perceived stress. Journal of Health and Social Behavior 1983; 24: 386-96.
2Jaber MJ, AlBashaireh AM, AlShatarat MH, Alqudah OM, Du Preez SE, AlGhamdi KS, et al — Stress, Depression, Anxiety, and Burnout among Healthcare Workers during the COVID19 Pandemic: A Cross-sectional Study in a Tertiary Centre. The Open Nursing Journal 2022; 16(1): 27.
3Lai J, Ma S, Wang Y, Cai Z, Hu J, Wei N, et al — Factors associated with mental health outcomes among health care workers exposed to coronavirus disease 2019. JAMA network open 2020; 3(3): e203976-.
4Bauddh NK, Sharda M, Shyoran S, Jain P, Bansal D — Perceived Stress among Healthcare Workers in COVID-19 Pandemic. J Assoc Physicians India 2021; 69(8): 11-12. PMID: 34472825.
5Aiyer A, Surani S, Ratnani I, Surani S — Mental Health Impact of COVID-19 on Healthcare Workers in the USA: A CrossSectional Web-Based Survey. J Depress Anxiety 2020; 9: 373. doi: 10.35248/2167-1044.20.9.373.
Original Article
Peritoneal Fluid from Pouch of Douglas is not a Suitable Specimen for Molecular Testing in the Diagnosis of Female Genital Tuberculosis in Women Presenting with Infertility
Background : Female genital tuberculosis is a form of Extra-pulmonary tubercular disease that primarily manifests as infertility in women. It's diagnosis is challenging because of difficulty in obtaining appropriate samples for testing. Conventional diagnostic methods, such as microscopy and culture, have limited effectiveness, leading to the use of molecular techniques for accurate diagnosis. This study was conducted to evaluate the suitability of Peritoneal Fluid in the pouch of Douglas or peritoneal washings as an alternate specimen for diagnosing female Genital Tuberculosis.
Materials and Methods : A prospective cross-sectional study was conducted on 30 infertile women, clinically suspected of Genital Tuberculosis. Laproscopy was performed to ascertain the presence of morphological signs of Genital Tuberculosis and Peritoneal Fluid or washings were collected for molecular testing of tuberculosis.
Results : Among the 30 infertile women (primary infertility = 20; secondary infertility = 10), 11 were aged 21-30 years, while 19 were aged 31-40 years. Pelvic ultrasonogram showed abnormalities in only a third of the cases. In laparoscopy, definite findings of Genital Tuberculosis were noted in 13 cases (43.3%). Others had probable findings of Genital Tuberculosis, comprising of, Pelvic Adhesions, Bilateral or Unilateral Tubal Block, Tubo-ovarian Mass, Fitz Hugh Curtis Syndrome and Hydrosalpinx. Laproscopically obtained Peritoneal Fluid or washings from all the 30 women were tested using cartridge-based Nucleic Acid Amplification and Polymerase Chain Reaction for Mycobacterium Tuberculosis. However, all the samples tested negative.
Conclusion : The use of Peritoneal Fluid as a specimen for molecular detection of Mycobacterium Tuberculosis did not yield positive results in this study. Further research is warranted to validate the study’s result and to explore better alternative approaches for the diagnosis of Female Genital Tuberculosis.
Tuberculosis (TB) poses a significant Worldwide health challenge with approximately 6.4 million new TB cases documented Globally. Majority of TB cases are detected in South East Asia, Africa, and Western Pacific regions, out of which India contributes to 26 percent of all TB cases1. In Indian population, about 80% of TB cases are primarily of pulmonary
1MD, Associate Professor, Department of Microbiology, Dr S S Tantia Medical College, Hospital and Research Center, Sri Ganganagar, Rajasthan 335002 And Corresponding Author
2MD, Scientist D, Department of Microbiology, Regional Medical Research Centre, Bhubaneswar, Odisha 751023
3MD, Assistant Professor, Department of Pathology and Lab Medicine, All India Institute of Medical Sciences Hyderabad, Bibinagar, Telangana 508126
4MD, Consultant, Department Of Gynaecology, Jeevan Rekha Nursing Home, Bhubaneswar, Odisha 751015
5MS, Consultant, Department Of Gynaecology, Jeevan Rekha Nursing Home, Bhubaneswar, Odisha 751015
6MD, Scientist G, Director, Regional Medical Research Centre, Bhubaneswar, Odisha 751023
Received on : 04/01/2024
Accepted on : 09/01/2024
Editor's Comment :
The present study tried to find out peritoneal fluid as an alternative sample for molecular diagnosis of female genital tuberculosis as the endometrial biopsy can be obtained through invasive procedure and has inhibitors for PCR reaction.
The study concluded that peritoneal fluid is not a suitable alternative. Patients with features of genital tuberculosis seen through laporascopy found to have negative PCR results. The study recommends clinical diagnosis through gynaecological procedures can be taken as benchmark to start antitubercular therapy irrespective of results obtained through molecular methods as immediate therapy can restore fertility in some cases of female genital tuberculosis.
origin and rest 20% manifests as Extra-pulmonary Tuberculosis (EPTB), which commonly affects Lymph Nodes, Meninges, Pleura, Osteo-articular System, Urogenital System, Eye, etc2
Female Genital Tuberculosis (FGTB) usually presents as infertility and accounts for 3-16% cases of EPTB in India3. Unlike Pulmonary TB, FGTB mostly presents with vague symptoms like infertility,
122, No 10, October 2024Journal
menstrual disorder and chronic pelvic inflammation thereby making it difficult to diagnose clinically4,5 Furthermore, cases of FGTB often pose diagnostic difficulty upon lab investigations also because of inherent difficulty in obtaining specimens from deep seated organs and low bacterial load in the obtained samples.
FGTB is paucibacillary in nature and hence conventional methods such as microscopic demonstration of Acid-fast Bacilli (AFB) by Ziehl Neelson staining is ineffective tool due to high false negativity4. Similarly, culture of tissue samples, such as endometrial curettage or biopsy usually yields inconclusive results6. Histopathological examination may show granuloma formation but it may not be a specific finding. It can only act as supplementary tool to clinical diagnosis and microbiological results. Therefore, detection of Mycobacterium tuberculosis specific genes by molecular methods is often resorted to for deriving a conclusive diagnosis. Cartridge Based Nucleic Acid Amplification (CBNAAT) or Gene expert (Cepheid, Sunnyvale, CA, USA) and Polymerase Chain Reaction (PCR) are proven to exhibit high degree of specificity but poor sensitivity in detecting FGTB in endometrial tissue specimen2. The limited sensitivity is attributed to presence of DNA inhibitors in blood of such specimen2. Therefore, this study was undertaken to test the suitability of Peritoneal Fluid present in pouch of Douglas or its washings as an alternate specimen to endometrial curettage or biopsy in infertility cases clinically suspected of FGTB presenting with infertility.
MATERIALS AND METHODS
A prospective cross-sectional study was carried out between January, 2022 to June, 2022 amongst 30 consecutive patients attending an Infertility Clinic and satisfying the inclusion criteria. Inclusion criteria were: (i) Women presenting with minimum one year of primary or secondary infertility and having minimum two failed ovulation induction attempts; (ii) Women having either definitive signs of TB by Laparoscopy such as tubercles, beaded appearance of the Fallopian Tubes, Caseous Nodules, Pelvic Adhesions, Fitz Hugh Curtis Syndrome, Bilateral or Unilateral Tubal Block, Hydrosalpinx and Tubo-ovarian Mass;7 (iii) Normal sperm count, motility and morphology on semen analysis of husband.Women already receiving anti-TB treatment were excluded. Prior to enrollment into the study, informed written consent was obtained from all participants. Primary infertility was characterized as the inability of women to conceive
after one year of unprotected intercourse, while secondary infertility was defined as inability to conceive again after a prior conception, regardless of the obstetric outcome8 Detailed history taking (including history of any contact with TB case), general physical examination and gynecological examination were carried out. Diagnostic procedures /interventions such as Ultrasonography of Pelvis, Laparoscopy, Hystero-salpingography and Hysteroscopy were done as a part of thorough work-up for infertility.
For diagnostic Laparoscopy and sample collection, a Laparoscope was introduced into abdomen after optimum carbon dioxide gas insufflation under General Anaesthesia. Presence of straw-colored fluid in pouch of Douglas, presence of any tubercles, adhesions or caseation were noted. Uterine tubes and ovaries were also inspected for any gross pathology like signs of endometriosis, presence of serosal fibroids or nodules or pelvic inflammatory disease. Simultaneous operative intervention was carried out to restore fertility in the same setting. Only those patients having either definite or probable signs of FGTB upon Laparoscopy, Peritoneal Fluid was collected. If there was no Peritoneal Fluid in suspected cases, 10 ml of normal saline was injected in a syringe into the peritoneal cavity through irrigation channel of the suction apparatus of Laparoscope and peritoneal washings were collected in a syringe. The specimen was transferred to two conical sterile test tubes. The tubes were properly labelled and sealed. One of the tubes was sent to a NABL accredited laboratory for CBNAAT testing and the second tube was sent to RMRC Bhubaneswar laboratory for TBPCR. Dispatching of the sample was done within half an hour of collection and cold chain was maintained during specimen transportation. During diagnostic Hysteroscopy, uterine cavity, fundus and bilateral tubal ostia were inspected for gross pathological findings like adhesion, polyp, ostial block and if present, appropriate therapeutic procedures such as adhesiolysis, polypectomy, tubal cannulation was performed in the same sitting. Chromopertubation was done by introducing methylene blue through cervix into fallopian tubes to see the patency of the fallopian tubes.
For CBNAAT, 5 ml of specimen was first decontaminated by mixing with an equal volume of N-acetyl-Cysteine -2% NaOH for eight minutes and then concentrated by centrifugation at 3000xg for 20 minutes. Most part of the supernatant was discarded, keeping 0.5 ml of lower part of supernatant along with the pellet. This pellet was then resuspended in 0.5 to
1 mL of Phosphate Buffered Saline (PBS). Sample reagent was added in a 2:1 ratio to the resuspended pellet, followed by vortexing the mixture twice for 10 seconds each.After incubating for 10 minutes at room temperature, 2 ml of the sample reagent treated specimen was charged into the Xpert MTB/RIF cartridge and loaded in the CBNNAT equipment. For TB PCR, the samples were diluted three times using sterile PBS and mixed thoroughly by vortexing, followed by centrifuging at 10,000 rpm for two minutes. The supernatant thus obtained was discarded and the pellet was re- suspended with 1%, N- Acetyl L - Cystine. After incubation, the it was again re-centrifuged at 10,000 rpm for two minutes and the again the supernatant was discarded. The remaining pellet was used for DNA Extraction, which was carried out according to manufacturer’s instruction using TRUPCR MTB DNA extraction kit. The extracted DNA was quantified and the purity was evaluated using Nanodrop - Lite (Thermofischer Scientific). This extracted DNA was stored at-20oC.TRUPCR MTB nested PCR Kit was used for the subsequent PCR reaction. It is a two-step PCR where in the first step Mycobacterium genus specific DNA get detected while in the second step PCR in the same reaction amplification of Mycobacterium tuberculosis complex specific DNA occurs.
RESULTS
Out of the 30 included women, 11 patients were in the age group of 21 to 30 years while 19 were in the 31 to 40-year age group. 5 patients belonged to lower socio-economic status while rest were hailing from lower middle-class family. All the patients had received BCG vaccination and had no history of TB contact, or drank unpasteurized milk. Twenty women presented with primary infertility while secondary infertility was observed in 10 cases. Average duration of infertility was 6.5 years. Normal menstrual cycles were seen in 11 women, while menstrual disorders seen were irregular cycles (n=13), scanty menses (n=12), heavy flow (n=4), and dysmenorrhea (n=2). One patient complained of Irregular heavy menses. Weight loss, Dyspareunia, Vaginal discharge and Lower Abdominal Pain were other presenting symptoms (Table 1). None of the patient had signs of lymphadenopathy or Chest Crepitations.
The gynaecological examination findings are detailed out in Table 2. During the per speculum examination, vaginal discharge was detected in 9 (30.0%) out of 30 women. On vaginal examination, 17 patients (56.7%) showed adnexal tenderness only
Table 1 — Patients’clinical Symptoms
History/ SymptomsNumber of Patients (n=30)
Menstrual patternsNormal menses11 (36.7%)
Heavy flow04 (13.3%)
Scanty menses12 (40.0%)
Irregular cycles13 (43.3%)
Dysmenorrhoea02 (6.7%)
Weight loss04(13.3%)
Dyspareunia05 (16.7%)
Vaginal discharge06 (20.0%)
Chronic pelvic pain18 (60.0%)
and one patient (3.3%) had both adnexal tenderness and adnexal mass. Ultrasonography of Pelvis did not reveal any abnormality in 20 patients (66.7%). Tuboovarian masses was present in 5 women (16.7%) while Polyp, Polycystic Ovaries, Fibroid, Thickened Endometrium & Hydrosalpinx were detected in one patient each. Hysterosalpingography was essentially normal in 7 women(23.3%), while others had either unilateral Tubal Block Only (n=9; 30.0%), Bilateral Tubal Block Only (n=11; 36.7%), Bilateral Tubal Block with Beaded Tubes (n=1;3.3%), Bilateral Tubal Block with Bicornuate Uterus (n=1;3.3%) and Septate Uterus (n=1;3.3%). In hysteroscopy, no abnormality could be detected in 18 women (60.0%), endometrial pallor and increased endometrial thickness was seen in one patient (3.3%) each, while pelvic adhesions were found in 9 cases (30.0 %). Among the patients with pelvic adhesions, one patient was having septate uterus and another showed bicornuate uterus which was corrected by operative procedure.
Upon diagnostic laproscopy, definite findings of FGTB (that is, beaded tubes with or without tubercles) were noted in 13 cases (43.3%) (Fig 1). Probable findings of FGTB were pelvic adhesions only and bilateral tubal block only in 7cases (23.3%) each, Bilateral Tubal Block with pelvic adhesions in three patients (10.0%), Bilateral Tubal Block with Tubo-
Fig 1 — Laproscopic picture of case 2 showing definitive signs of female genital tuberculosis
122, No 10, October 2024Journal
ovarian Mass in one patient (3.3%), Unilateral Tubal Block only in 06 cases (20.0%), Unilateral Tubal Block with Pelvic Adhesions in 3 patients(10.0%), Unilateral block with Fitz Hugh Curtis Syndrome in 1 (3.3%) case, Hydrosalpinx in 1 case (3.3%) (Fig 2). Laproscopically obtained samples, that is, peritoneal fluid/washings, from all the 30 women subjected for diagnosis of Mycobacterium tuberculosis by CBNAAT and nested PCR were found to be negative for Mycobacterium tuberculosis
DISCUSSION
Since Morgagni’s initial autopsy report of FGTB in a young female in 1744, its Worldwide incidence has been on the rise9 FGTB is one of the major causes of female infertility especially in developing countries like India where prevalence of TB is high4. Infertility may be caused due to tubal pathologies like tuberculous exo- or endo-salpingitis, salpingitis isthmica nodosa, interstitial tubercular salpingitis, or endometrial pathological changes such as endometrial thinning, synechiae, Asherman’s syndrome or pathological changes in ovaries like reduced ovarian reserve and inferior quality of ovum. As the duration of FGTB increases the damage to genital organs become increasingly profound. Hence, early and definitive diagnosis holds paramount importance in reversing the infertility through definitive management protocols.
Microbiological tests with higher specificity such as smear microscopy or culture of peritoneal biopsy or culture of endometrial aspirate or biopsy or, molecular tests like CB-NAAT or PCR on endometrial samples have low sensitivity results for detection of Mycobacterium tuberculosis primarily due to paucibacillary nature of disease and due to inhibition
of Polymerase Chain Reaction by inhibitory substances found in blood of such tissue samples10 Sharma, et al performed Gene Xpert on 240 endometrial samples and only seven (2.9%) cases were positive11. Agrawal M, et al found 18 positive samples (3.6%) out of 438 endometrial aspirate in infertile patients using TB-PCR12. Similar is the case of histopathological or radiological diagnostic methods, where the results are non-specific7. There is paucity of literature regarding the diagnostic utility of alternate specimen like Peritoneal Fluid accumulated at pouch of Douglas instead of endometrial tissue specimen for molecular diagnosis of FGTB, which was explored in the present study. Sharma J and colleagues evaluated the role of transvaginal and Transabdominal Ultrasound in diagnosis of FGTB and found it to be a useful adjunct tool for the diagnosis, especially in women with tuboovarian Masses 13 . In our study cohort, Pelvis ultrasonography revealed pathological abnormalities only in 10 cases (33.3%). Gynaecological techniques such as diagnostic Laparoscopy provide greater reliability in the diagnosis of FGTB as it allows direct visualization of the entire abdomino-pelvic cavity, enabling a direct examination of definitive and probable signs of FGTB and we opine the same. In a study of FGTB by Thangappah RBP, et al, Laparoscopy suggested a tubercular etiology in 59.7 per cent of cases4 Recently, Sharma, et al showed that diagnostic laparoscopy detected a greater number of FGTB cases than Gene Xpert, an indispensable diagnostic tool in pulmonary Tuberculosis, carried out on endometrial sample7. In the present study, primary or secondary infertility patients with ovulation induction failure with presence of definite or probable signs of FGTB on diagnostic Laparoscopic examination only were included and investigated further by molecular methods carried out in the peritoneal fluid accumulated in pouch of Douglas or in peritoneal washings.
Previously, Peritoneal Fluid or washings have also been studied by Thangappa, et al for Mycobacterium tuberculosis DNA PCR4. Amongst the seven aspirated peritoneal fluid samples, only two showed positivity. It was proposed by the authors that it could be attributed to paucibacillary nature of the specimen.4 In their study cohort of 72 infertile women, smears were positive for Acid Fat Bacilli in 8.3%, culture positivity was noted in 5.6% and histopathological examination showed epithelioid granulomas in 6.9% cases where as 36.7% cases were positive for Mycobacterium tuberculosis DNA by PCR.
Fig 2 — Laproscopic picture of case 15 showing probable signs of female genital tuberculosis
Case 229P0PY0403NNNBTBNBFTBTBN Case 329P0PY0602NADMTOMBTBNNilBTB+TOMBTB Case 438P1SY0502NNNUTBTNENilUTBUTB
Case 525P0A1SY0502NNNUTBNNilUTBUTB
Case 631P2L0SY0502NNNUTBNNilUTB+PAUTB Case 721P0PY0406NNPCODNPDNilPDDP Case 829P0A1SY0704NNTKEUTBTKENilUTBUTB Case 929P0PY1102NAT+ADM TOMBTBPAE+PANilPABTB+Frozen Pelvis Case 1027P0PY0404NNNBTBNNilPABTB
Case 1130P0PY0302VDNNUTBNNilUTBN Case 1234P0PY0503VDATNBTBNNilBTBDP Case 1337P0PY1702VDATFibroidsSeptatePD+BFTBTBDP UterusSeptations
Case 1437P0PY1204VDATNNADBFTNilN Case 1538P0PY1702NATTOMBicornuateBicornuateNilBTB +BTB Uterus UterusHydro+BTB salpinx
Case 1625P0PY0303VDATNBTBNBFTBTBBTB
Case 1726P0PY0503VDNNBTBNNilBTBDP
Case 1830P0PY0406VDAT TOM+BTBBTBNBFTBTB+PABTB
Case 1937P1SY0902VD ATNBTBNBFTBTB+PABTB
Case 2035P0PY0603VDATTOMBTBPABFD+BTB+PABTB Fibroid Uterus
Case 2132P0PY0506NATNNNBFTUTB+DP Fitz Hugh Curtis Syndrome
Case 2233A6P0SY0502NNNNPA,NilPAN Synechia
Case 2339P0PY0202NATNNNNilPAN
Case 2431P0PY0402NATNUTBNBFT+UTBUTB Tubercles
Case 2532P1L0SY0803NATNBTBNBFTPABTB
Case 2625A1P0SY0302NATNUTBPANilPA+UTBUTB
Case 2732A1P0SY1003NATHydrosalpinxBTBN BFT+PA+BTBBTB Hydrosalpinx
In the present study, Peritoneal Fluid/ Washings collected from 30 infertile women with laparoscopic findings suggestive of TB (43.3% of those with definitive findings of FGTB and rest with probable findings), were tested negative by PCR and CBNAAT for Mycobacterium tuberculosis . Similar to our findings, other investigators have also observed poor diagnostic yield with Peritoneal fluid2,14,15 Bhanu, et al performed DNA PCR on Peritoneal Fluid of clinically
suspected FGTB cases and found positivity rate of 16% only, whereas higher positivity rates were observed with endometrial aspirates (47.6 %), and endometrial biopsies (53.3 %) 14 . Rana, et al conducted a similar study utilising Peritoneal Fluid obtained from 200 infertile women, revealing that DNA PCR showed a positive result in only 9.6% cases15 On the contrary, they documented 44.85% positivity for Mycobacterium tuberculosis in endometrial specimens by PCR.
Vol 122, No 10, October 2024Journal of
CONCLUSION
To conclude, we found that Peritoneal Fluid from pouch of Douglas or peritoneal washings is not a suitable specimen for Mycobacterium tuberculosis detection by molecular methods in the diagnostic work-up of clinically or laproscopically suspected cases of FGTB. However, since the major limiting factor of the study is low sample size, further larger validation studies are needed.
Conflict of Interest : None declared.
REFERENCES
1World Health Organization. WHO global tuberculosis report 2021: Geneva: WHO; 2021.https://www.who.int/publications/ i/item/9789240037021accessed on 1st May 2023.
2Agrawal S, Kant S, Das V, Jain A, Mishra S — Limited role of GeneXpert in peritoneal fluid in the diagnosis of genital tuberculosis in infertile women. J Family Med Prim Care 2021; 10: 1656-60
3Grace GA, Devaleenal DB, Natrajan M — Genital tuberculosis in females. Indian J Med Res 2017; 145(4): 425-36.
4Thangappah RBP, Paramasivan CN, Narayanan S — Evaluating PCR, culture & histopathology in the diagnosis of female genital tuberculosis. Indian J Med Res 2011; 134: 40-6.
5Wang Y, Shao R, He C, Chen L — Emerging progress on diagnosis and treatment of female genital tuberculosis. Journal of International Medical Research 2021; 49(5): 1-8.
6Dahiya B, Kamra E, Alam D, Chauhan M, Mehta PK — Insight into diagnosis of female genital tuberculosis. Expert review of Molecular Diagnostics 2022; 22(6): 625-42.
7Sharma JB, Jain S, Dharmendra S, Singh UB — An evaluation of Composite Reference Standard (CRS) for diagnosis of Female Genital Tuberculosis. Indian J Tuberc 2023; 70(1): 70-6.
8Naik SN, Chandanwalea A, Kadama D, Sambareya PW, et al Detection of genital tuberculosis among women with infertility using best clinical practices in India: An implementation study. Indian J Tuberc 2021; 68(1): 85-91.
9Sharma JB, Sharma E, Sharma S, Dharmendra S — Female genital tuberculosis: Revisited. Indian J Med Res 2018; 148 (Suppl): 71-83.
10Bhanothu V, Theophilus JP, Rozati R — Use of Endo-Ovarian Tissue Biopsy and Pelvic Aspirated Fluid for the Diagnosis of Female Genital Tuberculosis by Conventional versus Molecular Methods. PLoS One 2014; 9(5): 5.
11Sharma JB, Kriplani A, Dharmendra S, Chaubey J, Kumar S, Sharma SK — Role of Gene Xpert in diagnosis of female genital tuberculosis: A preliminary report. Eur J ObstetGynecolReprodBiol 2016; 207: 237e238.
12Agrawal M, Roy P, Bhatia V, Dutt S, Gaur R — Role of microbiological tests in diagnosis of genital tuberculosis of women with infertility: A view. Indian J Tuberc 2019; 66: 234e239.
13Sharma J, Khurana A, Hari S, Singh U, Yadav R, Dharmendra S — Evaluation of role of transabdominal and transvaginal ultrasound in diagnosis of female genital tuberculosis. Journal of Human Reproductive Sciences 2021; 14(3): 250-9.
14Bhanu NV, Singh UB, Chakraborty M, Suresh N, Arora J, Rana T, et al — Improved diagnostic value of PCR in the diagnosis of female genital tuberculosis leading to infertility. J Med Microbiol 2005; 54: 927-31.
15Rana T, Singh UB, Kulshrestha V, Kaushik A, Porwal C,Agarwal N, et al — Utility of reverse transcriptase PCR andDNA PCR in the diagnosis of female genital tuberculosis. J Med Microbiol 2011; 60: 486-91.
If you want to send your queries and receive the response on any subject from JIMA, please use the E-mail or Mobile facility.
Know Your JIMA
Website:https://onlinejima.com www.ejima.in
For Reception:Mobile : +919477493033
For Editorial :jima1930@rediffmail.com
Mobile : +919477493027
For Circulation :jimacir@gmail.com
Mobile : +919477493037
For Marketing :jimamkt@gmail.com
Mobile : +919477493036
For Accounts:journalaccts@gmail.com
Mobile : +919432211112
For Guideline:https://onlinejima.com
Original Article
A Comparative Study on Nebulised Levosalbutamol versus Adrenaline in Wheeze Associated Condition of Children Between
1 Month to 6
Months of Age Admitted in Paediatric Ward of a Tertiary Medical College during COVID-19 Pandemic
Background : It is seen that most wheezing episodes in infancy during the COVID-19 pandemic are of viral origin commonly diagnosed as Acute Viral Bronchiolitis, Pneumonia or Wheeze associated Respiratory Tract Infection. Previous trials have provided conflicting evidence regarding the benefit of bronchodilators like β2 agonists, adrenaline, ipratropium bromide etc. It is proved that levosalbutamol is much safer alternative than salbutamol, but no clinical trial till date has assessed it's efficacy to nebulised adrenaline in wheezing episodes in infants. Thus this study will attempt to verify the efficacy of bronchodilators in wheeze associated respiratory conditions and assess the benefits of a β-2 specific agonist versus combined α and β (non-specific) agonist among the first time wheezing infants during this COVID-19 pandemic.
Materials and Methods : The study was conducted with 60 infants aged 1 month to 6 months of age attending the Paediatric Medicine Emergency Department of NRS medical college in Kolkata with first time wheeze. The study period was 1.4 years from March, 2020 to July, 2021. Of these 30 received nebulised levosalbutamol (0.1mg/kg/dose) (Group A) and remaining 30 were given adrenaline nebulisation (0.1mg/kg/dose in1:10,000 solution) (Group B) maintaining CDC COVID-19 protocol. In 3 doses of each drug were given along with O2 at 15 mins interval. Respiratory rate, Respiratory Distress Assessment Index (RDAI) score, heart rate and pulse oximetry were recorded before intervention, just after 2nd dose, 30 mins after last dose and 1 hour after last dose.
Results : Both adrenaline and levosalbutamol caused significant improvement in mean respiratory rate, RDAI score and oxygenation. However, the adrenaline group showed a significantly better improvement in study parameters than levosalbutamol group.
Conclusion : The study concluded that nebulised adrenaline is signifantly superior to levosalbutamol in reliving symptoms in infants with wheeze.
[J Indian Med Assoc 2024; 122(10): 55-9]
Key words :Nebulised Levosalbutamol, Nebulised Adrenaline, Wheeze, COVID-19.
Wheeze associated respiratory conditions is an extremely common problem in under 5 children with reported attack rates in the western literature being as high as 11.4 per 100 children in the first year and 6 per 100 children below 6 months of age1. True wheezing is particularly troublesome manifestation of obstructive lower respiratory tract disease of children. The site of obstruction may be anywhere from the intra thoracic trachea to the small bronchi or large bronchioles and the wheeze is produced due to turbulant airflow that collapse with
Department of Paediatric Medicine, Nilratan Sircar Medical College and Hospital, Kolkata 700014
1MBBS, MD, Senior Resident and Corresponding Author
2MBBS, MD, Senior Resident
3MBBS, DCH, MD, Associate Professor, Murshidabad Medical College and Hospital, Berhampore, West Bengal 742101
4MBBS, DCH, MD, Professor and Head
Received on : 01/02/2023
Accepted on : 15/11/2023
Editor's Comment :
This study on children of age 1 month to 6 months who presented with acute respiratory distress. 30 children were given nebulisation with levosalbutamol and the other half were treated with adrenaline.
The children who were treated with adrenaline nebulisation showed better outcome than the children with levosalbutamol nebulisation.
forced expiration. Children younger than 6 months are specially prone to wheezing because bronchospasm, mucosal edema and accumulation of excessive secretions have a relatively greater obstructive effect on their smaller airways. In addition, the compliant airways in young children collapse more easily with active expiration 2 . Bronchiolitis, pneumonia and wheeze associated Respiratory Tract Infection are common diagnosis in such infants3
In addition to anatomic factors related to the Lung
122, No 10, October 2024Journal
and Chest wall, immunologic and molecular influences wheezing in infants in comparison to older children4. The obstruction to flow is affected by the airway caliber and compliance of the infant’s lung. Resistance (R) to airflow through a tube is inversely related to the radius (r) of the tube to the 4th power.In children less than 5 years old, small caliber peripheral airways can contribute up to 50% of the total airway resistance. Marginal additional narrowing with mucosal edema and inflammation can cause further flow limitation and subsequent wheeze5. With the very compliant newborn chest wall, the inward pressure produced in expiration subjects the intrathoracic airways to collapse. Flow limitation is further affected by the differences in tracheal cartilage composition and airway smooth muscle tone causing further increase in airway compliance in infants compared to older children. All of these mechanisms combine to make the infant more susceptible to airway collapse, increased resistance, and subsequent wheezing. Many of these conditions are outgrown by the 1st year of life by normal growth and muscular development6. As already stated that immunologic and molecular influences can contribute to the infant’s propensity to wheeze, they have higher levels of lymphocytes and neutrophils, rather than mast cells and eosinophils in broncho alveolar lavage fluid as compared to older children. A variety of inflammatory mediators have also been implicated in the wheezing infant such as histamine and leukotrienes. Fetal and/ or early postnatal “programming” in which the structure and function of the lung are affected by factors including fetal nutrition and fetal and neonatal exposure to maternal smoking may also occur7 Available literature by different authors are reviewed to have a comprehensive idea. Pharmacological interventions used in wheeze associated respiratory conditions include antibiotics, bronchodilators like β2 agonists, adrenaline, ipratropium bromide and 3% saline. Other modalities used include corticosteroids8 but nebulisation with adrenaline and salbutamol are the main stay of pharmacological therapy. Levosalbutamol, though superior to salbutamol, has not been used in clinical trials before. Various other therapies are being practiced, but most have been shown to be ineffective or having only short term benefits when tested in rigorous clinical trials 9. A variety of agents ranging from parenteral epinephrine to nebulised racemic epinephrine, albuterol, salbutamol are routinely available10,11. The interest in epinephrine (α+ β non-specific action) has been significant due to: (a) α - adrenergic vasoconstrictor
action that decongest the respiratory mucosa, limit its own absorption and regulate pulmonary blood flow, with little effect on ventilation-perfusion matching (b) β2 adrenergic bronchial muscle relaxant effect (c) β2 adrenergic action suppress release of chemical mediators. (d) Physiological antihistamine effect that reverse histamine effects like edema (e) It also reduces catarrhal secretions 3 β 2 adrenergic bronchodilators have mucosal and pulmonary vasodilator effects by increased cAMP secretion in bronchial smooth muscle cells. The former increase mucosal absorption rates with resultant direct cardiac effects, by virtue of the residual inherent β 1 adrenergic activity effects of tachycardia. The latter enhance ventilation perfusion mismatching with resulting hypoxia and hypoxia induced tachyarrhythmia. Airway obstruction increases work of breathing and precipitates hypoxia; both of which are associated with tachycardia. Thus the vasoconstrictor and bronchodilator activities of adrenaline protect against its direct as well as hypoxia induced arrhythmogenicity. It is therefore not surprising that in clinical studies, drugs such as salbutamol, with minimal residual β 1 adrenergic activity, have more potential to cause tachycardia than adrenaline, which in spite of its potent β 1 adrenergic activity might reduce heart rate12,13. This tachycardiac side effect is much lesser in levosalbutamol as compared to salbutamol. Thus, we conducted a cross-sectional observational study to examine the effect of nebulised levosalbutamol versus adrenaline in children with wheeze associated respiratory conditions using clinical parameters where no previous study using levosalbutamol was done.
MATERIALS AND METHODS
The study was carried out in children who were admitted in Paediatrics Department of our institution through emergency between March, 2020 to September, 2021. Children between the ages of 1 month to 6 months admitted with first time wheeze were included in the study. Children needing nebulisation were selected on the basis of nasal discharge, wheezy cough in the presence of fine inspiratory crackles and/or high pitched expiratory wheeze. Signs of respiratory distress taken into consideration were increase in respiratory rate, tachycardia, increased work of breathing, chest retractions, fine crackles and wheeze. Infants who were below 1 month and above 6 months, infants who required mechanical ventilation or non-invasive ventilation in the past, infants suffering from any
congenital anomalies of Chest, Lung or Heart, children on regular use of bronchodilator or steroid use (more than 4 weeks prior to hospital admission), very sick infants needing PICU admission with impending respiratory failure and infants having high grade fever, raised TLC>15,000/mm 3, lobar consolidation on skiagram were excluded from the study. No cases were repeated. Ethical committee clearance was taken from the institutional ethical committee. A total of 60 children were taken. Of these, 30 children who received nebulised levosalbutamol (0.15 mg/kg/dose with 3ml saline)(Group 1) and another 30 children who received adrenaline nebulisation (0.5ml/kg/dose in1:1000 solution with 3ml saline)(Group 2) were enrolled. A written informed consent was taken for each child from the parent/caregiver. An arterial blood gas (ABG) and a chest skiagram were taken for each to exclude respiratory failure and lobar consolidation respectively. Each parent/caregiver had to answer a predetermined questionnaire. In 3 doses of each drug were given at 15 mins interval via nebuliser with O2 @6lts/min maintaining CDC COVID19 protocol14 as a part of treatment process. Heart rate, respiratory rate, oxygen saturation by calibrated multichannel pulse oximeter (SpO2) and Respiratory Distress Assessment Index (RDAI) score were recorded before intervention, just after 2nd dose, 30 minutes after last dose and 1 hour after last dose. A comparison between observations before and after nebulisation in the given groups and between the two groups were done. Data was recorded on a predetermined pro-forma and was analysed using statistical software (SPSS ver. 26). Along with the above, IV fluids (DNS+KCl), humidified oxygen through mask and syrup paracetamol for temperature above 100 o F were given in both the groups. Breastfeeding on demand or top feeding whatever the baby was on was continued. Response to treatment was determined by-changes in heart rate, changes in oxygen saturation in room air, changes in respiratory rate and changes in Respiratory Distress Assessment Index (RDAI) score. Data was recorded on a predetermined proforma and analysed using the paired and unpaired Student’s t-test. P value <0.05 was taken as significant.
RESULTS
months in Group 2. A total of 35% of children in Group 1 and 31.67% of children Group 2 were boys and the rest were girls. The two Groups were comparable with respect to their mean initial HR, RR, SpO2 and RDAI scores. The trends of the various parameters through the initial three nebulisations (based on mean values at 0, just after second dose, 30 minutes after third dose and 1 hour after third dose) in the two groups are shown in Tables 1-4. At the end of three nebulisations, the mean (SD) changes in parameters in both groups are given in Table 5. In Group 1, the post-nebulisation mean heart rate/min increased by (6.276±1.112), the mean respiratory rate/min decreased by (3.267±2.149), the mean SpO2% increased by (2.967±1.45) and the mean respiratory distress assessment score decreased by (1.733±1.311). In Group 2 also the post-nebulisation mean heart rate/min increased by (6.233±1.775), mean respiratory rate/min falling by 6.633±2.327, mean SpO 2% increasing by (4.633±1.67), mean
Table 1 — Comparison of serial recording of Heart rate values Heart rateHR 1HR 2HR 3HR 4 (HR)
Group 1138.17±11.35140.43±11.3142.27±11.15144.43±11.09 Group 2144.43±14.71146.73±14.60148.70±14.37150.67±14.17 t1.841.861.931.89 p0.070.060.050.06
Table 2 — Comparison of serial recording of respiratory rate values
RespiratoryRR 1RR 2RR 3RR 4 Rate (RR)
Group 161.93±6.4161.47±6.1960±6.2058.67±5.57
Group 264.40±5.7362.30±5.3460.27±5.2657.77±4.96 t1.560.5580.170.66 p0.120.570.85<0.001
Table 3 — Comparison of serial recording of oxygen saturation values
OxygenSpO2 1SpO2 2SpO2 3SpO2 4 saturation (Spo2)
Group 189.17±1.0889.67±1.0290.77±1.1092.13±1.19
Group 288.77±1.3590.00±1.3991.70±1.5093.40±1.32 t1.261.052.733.58 p0.210.290.08<0.001
Table 4 — Comparison of serial recording of RDAI scores
A total of 60 children in the age range of 1 to 6 months of age were included in the study with 30 in each group. The mean age of children was (3.49±1.59) months in Group 1 and (2.66±1.72)
Group 112.93±1.8112.87±1.8111.97±1.7111.20±1.54
Group 214.23±1.6113.03±1.6211.87±1.6310.20±1.82 t2.900.370.232.29 p0.050.700.81<0.001
122, No 10, October 2024Journal
respiratory distress assessment instrument score falling by (4.033±1.033). All the parameters in both the groups (within the groups) had registered a statistically significant change (p<0.0001). On comparing the two Groups for difference in the change of parameters brought about, it is noticed that there was no significant difference in change of heart rate, there was a significant difference in change in respiratory rate, oxygen saturation and RDAI score favouring adrenaline Group (p<0.0001) (Table 5). There were no significant side effects such as tachyarrythmia, irritability, tremors or facial blanching with either epinephrine /levosalbutamol initially or during subsequent nebulisations.
DISCUSSION
Table 5 — Comparison of initial and final parameters in both groups
Group 16.276±1.1123.267±2.1492.967±1.451.733±1.311 t = 30.864t =8.328t = 11.207t = 7.24 p <0.001p<0.001p<0.001p<0.001
Group 26.233±1.7756.633±2.3274.633±1.674.033±1.033 t = 19.235t = 15.617t = 15.188t =21.378 p<0.001p<0.001p<0.001p<0.001 t1.890.6603.582.29
pNot significant<0.001<0.001<0.001
kg subject to a maximum of 2.5 ml with saline to make it 3 ml). The study showed that respiratory status was better with significant improvement in RR, RDAI score and SpO2, decreased oxygen requirement and shorter hospital stay in the adrenaline group17
The main aim of our study was to determine efficacy between nebulised levosalbutamol and nebulised adrenaline in wheeze associated conditions of children between 1 month and 6 months of age according to clinical parameters.
In a study done by Sireesha S, et al on comparison of nebulized Salbutamol versus Adrenaline in the treatment of wheeze associated Respiratory Tract Infection between 2 months to 2 years of age mainly focussing on Bronchiolitis showed a total of 30 children were enrolled. 22 (73.3) were in age Group of 2 months to 1 year and 8 (26.7%) were in age Group of 1-2 years and they found no added advantage of decreasing the respiratory rates, wheezing and retractions of one over the other groups15
In another study done by Syama Prasad Sit, et al on Comparative Efficacy of Nebulised L-Adrenaline Versus Salbutamol in Infants with Bronchiolitis between 2 months to 12 months of age with bronchiolitis showed a total of 70 children were enrolled. 35 received L-adrenaline (0.1ml/kg/dose in 1 in 10,000 solution) (Group A) and 35 received salbutamol (0.1mg/kg/dose)(Group B).Both Ladrenaline and salbutamol caused significant improvement in mean symptom score and oxygenation16.
In another study done by Gayti Koley, et al on Comparison of Salbutamol to Adrenaline nebulisation in Acute Severe Bronchiolitis showed a total of 21 infants in the age Group of 1 month-1 year were enrolled in the study. They received salbutamol (0.15 mg/kg with saline to a total of 3 ml) through nebuliser with Oxygen or adrenaline 1:10000 (0.5 ml/
All of these studies came up with varied results and conclusion. Also all these studies had used salbutamol in infants presenting with wheeze. It is well established that levosalbutamol to be more efficacious than salbutamol in terms of improvement in respiratory and cardiac parameters. Again these studies used 0.1ml/kg of 1:10000 epinephrine which is much lesser than the recommended useful dose. In our study a total of 60 children in the age range of 1 to 6 months were included with 30 children in each Group. Each children who received either levosalbutamol (0.15mg/kg with 3ml saline) or epinephrine (1:1000, 0.5ml/kg with 3 ml saline) for wheeze were enrolled. Each of them were given 3 doses of each drug at 15 mins interval via nebuliser with O 2 @6lt/min maintaining COVID-19 CDC protocol. The mean age of children (mean ± SD) was (3.49±1.59) months in Group 1 and (2.66±1.72) months in Group 2. A total of 35% of children in Group 1 and 31.67% of children Group 2 were boys and the rest were Girls. The two Groups were comparable with respect to their mean pretreatment heart rate, respiratory rate, RDAI and oxygen saturation. Most of the cases had viral pneumonia with 40% of total patients; 33.33% of total patients had wheeze associated Lower Respiratory Tract Infection and rest others had bronchiolitis (26.67%). The major limitation of our study is that it is a cross-sectional observational study with no control group for comparison, the observations were done at a single point of time with no follow-up. However, comparison of various statistical variables helped us to draw some conclusion against major outcomes.
Vol 122, No 10, October 2024Journal of
CONCLUSION
Both adrenaline and levosalbutamol caused significant improvement in mean symptom score and oxygenation. On comparing the two groups for difference in the change of parameters brought about, it was noticed that there was no significant difference in change of Heart rate but there was a significant difference in change in Respiratory rate, Oxygen saturation and RDAI score favouring epinephrine group. Larger, multi centric, double blinded randomized controlled trials are required to confirm these results.
REFERENCES
1John B, Singh D — Comparision of Nebulised Salbutamol and L-epinephrine in First Time Wheezy Children. Medical Journal Armed Forces India 2010; 66(1): 9-13.
2Kliegman R, Stanton B, St Geme J, Schor N, Behrman R, Nelson W — ND Nelson textbook of pediatrics
3Ray MS, Singh V — Comparison of nebulized adrenaline versus salbutamol in wheeze associated respiratory tract infection in infants. Indian Pediatr 2002; 39(1): 12-22. PMID: 11805349.
4Klinnert M, Liu A, Pearson M, Ellison M, Budhiraja N, Robinson, J — Short-term Impact of a Randomized Multifaceted Intervention for Wheezing Infants in Low-Income Families. Archives of Pediatrics & Adolescent Medicine 2005; 159(1): 75.
5Frey U, Makkonen K, Wellman T, Beardsmore C, Silverman M — Alterations in Airway Wall Properties in Infants with a History of Wheezing Disorders. American Journal of Respiratory and Critical Care Medicine 2000; 161(6): 1825-9.
6Morton R, Sheikh S, Corbett M, Eid N — Evaluation of the wheezy infant. Annals of Allergy, Asthma & Immunology 2001; 86(3): 251-6.
7Joseph L, Goldberg S, Picard E — A Randomized Trial of Home Oxygen Therapy From the Emergency Department for Acute Bronchiolitis. Pediatrics 2006; 118(3): 1319-20.
8Sit SP, Kant DM, Maiti DS, Pal PS, Dey DS, Kuswaha DG — Comparative Efficacy of Nebulised L-Adrenaline Versus Salbutamol in Infants With Bronchiolitis. 2016.
9Wohl ME, Chernick V — State of the art: bronchiolitis. Am Rev Respir Dis 1978; 118(4): 759-81. doi: 10.1164/ arrd.1978.118.4.759. PMID: 212970.
10Lenney W, Milner A — Alpha and beta adrenergic stimulants in bronchiolitis and wheezy bronchitis in children under 18 months of age. Archives of Disease in Childhood 1978; 53(9): 707-9.
11Gadomski AM, Lichenstein R, Horton L, King J, Keane V, Permutt T — Efficacy of albuterol in the management of bronchiolitis. Pediatrics 1994; 93(6 Pt 1): 907-12. PMID: 8190575.
12Bertrand P, Araníbar H, Castro E, Sánchez I — Efficacy of nebulized epinephrine versus salbutamol in hospitalized infants with bronchiolitis. Pediatric Pulmonology 2001; 31(4): 284-8.
13Menon K, Sutcliffe T, Klassen T — A randomized trial comparing the efficacy of epinephrine with salbutamol in the treatment of acute bronchiolitis. The Journal of Pediatrics 1995; 126(6): 1004-7.
14Swarnakar R, Gupta N, Halder I, Khilnani G — Guidance for nebulization during the COVID-19 pandemic. Lung India 2021; 38(7): 86.
15Sireesha S, Prasad BS, Suresh J — Comparison of nebulized Salbutamol versus Adrenaline in the treatment of wheeze associated respiratory tract infection. International Journal of Contemporary Pediatrics 2018; 5(1): 169-172. DOI: http:// dx.doi.org/10.18203/2349-3291.ijcp20175580
16Sit SP, Kant M, Maiti S, Pal PS, Dey S, Kuswaha G — Comparative Efficacy of Nebulised L-Adrenaline versus Salbutamol in Infants With Bronchiolitis. International Journal of Scientific Study 2016; 5(2): 2025. doi:10.17354/ijss/2017/246.
17Koley G, Koley KC — Comparison of Salbutamol to Adrenaline Nebulization in Acute Severe Bronchiolitis: An Original Research Paper. International Journal of Scientific Study 2017; 5(2): 202-5. doi:10.17354/ijss/2017/246.
Original Article
Study of Effectiveness of Self-directed Learning Compared to the Traditional Method of Learning for Undergraduate Medical Students
Background : Competency-based Medical Education (CBME) is giving emphasis on a learner-centric approach for medical students rather than a teacher-centric approach. Self-directed Learning (SDL) is a learning process where the learner takes responsibility for their own learning process. Though it is an active learning process and encourages health professionals to be lifelong learners, very few studies have been done on SDL. Therefore, this study aimed to find out the effectiveness of implementing SDL in the undergraduate medical students curriculum.
Material and Methods : The study included 200 undergraduate medical students. A questionnaire was used to obtain the perception of students on SDL. Pre-test and post-test were carried out before and after the traditional lecture and SDL and the effectiveness of SDL was found by statistically comparing the test values.
Result : The students showed a positive perception toward SDL. The students scored significantly higher marks in the pre-test compared to the post-test marks. The post-test marks of the SDL session were significantly higher than the post-test marks of the lecture session.
Conclusion : We concluded from our study that SDL is an effective learning method and can be adopted as a teaching-learning method along with the traditional method of learning.
Key words :SDL, Learner-centric, CBME, Undergraduate Students.
The Medical Council of India (MCI) recommended implementing Competency-based Medical Education (CBME) curriculum for medical students in 20191. In this learner-centric approach, the main focus of CBME is on acquiring competencies as endpoints to produce competent doctors. One of the goals of Indian Medical Graduates is to become lifelong learner 2 and to achieve it, students should be motivated from within to learn. Self-directed Learning (SDL) is a self-driven method to reach objectives. It is a learning process where the learners consciously accept responsibility in andragogy. Compared to the didactic lecture, SDL is a powerful and active learning method3. SDL is one of the important learning parameters in Health Professions studies. SDL has been widely adopted to educate medical and other healthcare professional students worldwide4. It encourages Health Professionals to update their knowledge and continue their learning process during their careers to deal with the ever-
IMS and SUM Hospital, Siksha O Anusandhan deemed to be University, Bhubaneswar, Odisha 751003
1MD (Physiology), Professor, Department of Physiology and Corresponding Author
2MS (Surgery), Professor, Department of Surgery and Head, Department of Medical Education
3MD (Physiology), Professor, Department of Physiology
Received on : 23/08/2023
Accepted on : 26/08/2023
[J Indian Med Assoc 2024; 122(10): 60-3]
Editor's Comment :
Competency-based Education for medical students includes newer concepts like Self-directed Learning (SDL). SDL is an active form of learning where the learner takes responsibility for his/her learning process. This learning process promotes “deep learning” and “lifelong learning” as it kindles interest in the subject and helps in critical thinking. So, this form of teaching must be meticulously planned and implemented in the medical curriculum with the view of producing competent Indian Medical Graduates (IMGs).
challenging healthcare environment5. Researchers have found that SDL is an effective methodology for learning in medical schools6,7 . Because of these emerging trends on student-centric learning techniques and the limited research done related to the effectiveness of SDL, we planned this study. The main objective of this study was to find out the effectiveness of implementing Self-directed Learning techniques to study Physiology for 1st year medical students. To achieve this objective, a learning format was designed to give the students an interesting approach to study without deviating from the regular didactic lecture classes.
MATERIAL AND METHODS
A batch of 250 MBBS Phase-I students were included in the study. Out of the 250 students, 200 students who volunteered to participate were included as study participants. The study was started after
obtaining ethical clearance and consent from each student. The study was carried out in two parts.
The First part was to compare the two forms of teaching, ie, conventional teaching through didactic lecture and SDL. Two topics from Respiratory Physiology were included for conventional teaching and SDL session separately. The ‘Neural regulation of respiration’ was taken through didactic lecture and the ‘Chemical regulation of respiration’ was given to the students for SDL. A pre-test was given to the students before didactic lecture. The didactic lecture was taken for all the 200 students in the theory class for 45 mins then the post test was conducted. A pretest was conducted before SDL session. The SDL session was conducted in 10 small groups of 20 students each in the lecture theater with the teacher as the facilitator. The students were explained regarding SDL and they were provided with study materials like links to relevant PubMed articles,video links and references of standard textbooks of Physiology as resource materials. They were asked to read the topic assigned from the resources provided to them and prepared on the topic in the class for 45mins. Thereafter assessments of SDL session was done by a post-test. The pre-tests and post-tests involved 10 MCQs each (each set to be answered in 10 minutes) for a maximum of 10 marks per set. The MCQ papers were collected and evaluated manually with no negative marking and the results were tabulated.
Then in the second part of the study, a prevalidated questionnaire was used to obtain students’ perception towards both the teaching method and findings were expressed as percentages and were compared graphically8
Statistical analysis : The data obtained was analysed using SPSS version 22 software. Students’ pre-test and post-test were tabulated and compared. P value <0.5 was considered significant. Perception analysis of the students was done by calculating frequencies with percentages for all responses and was represented graphically.
OBSERVATIONS
On analysis of the pre-test and post-test marks before and after the conventional didactic lecture and SDL session it was found out that, there was no significant difference in the mean pre-test marks of conventional lecture (5.0 ± 2.0) and SDL (5.2 ± 1.6) with p-value 0.17 (Table1). The mean post-test marks following lecture class (6.3 ± 1.4) was significantly higher p-value <0.001) than the mean pre-test marks (5.0 ± 2.0) (Table 2). The mean post-test marks
following SDL (6.9 ± 1.2) were significantly higher (pvalue <0.001) than the mean pre-test marks (5.2 ± 1.6) (Table 3). The mean post-test marks (SDL) (6.9 ± 1.2) were significantly higher (p-value <0.001) than the mean post-test marks following the lecture (6.3 ± 1.4) (Table 4). Out of the 200 students who participated in the study majority agreed that SDL is more interesting, more satisfying than the conventional didactic lectures, it makes them more confident in applying clinical knowledge, they are more enthusiastic and SDL makes the learning process easier for them (Fig 1). Further, the students also agreed that SDL generates curiosity, and motivates them to learn but at the same time they agreed that SDL demands more effort from the students and the role of teacher is very important in this process (Fig 2).
DISCUSSION
Most of the subjects in basic science are taught by didactic lectures. This teaching method is mainly teacher-centric and the students lose their thinking and analytical ability. Basic science teaching is thought to be dry and uninteresting by students who think it is not ‘directly’ related to their career as practising healers and doctors in future9. In this type of teaching, emphasis is given only to acquiring knowledge only. However, the recently introduced CBME curriculum for undergraduates de-emphasizes such teaching. There have been a lot of inclusions in the CBME with a vision of producing competent doctors. One such inclusion is SDL.
In SDL, the medical students take the initiative to
Fig 1 — Comparison of students’ perception of SDL and conventional teaching method
learn, with or without the help of instructors or teachers, set learning goals, determine their learning needs, choose and implement learning strategies to acquire knowledge identify resources for learning and finally evaluate learning outcomes10
Our study was an attempt to find out the effectiveness of implementing SDL in the medical undergraduate curriculum by pre and post-tests following lecture and SDL session. We found out that, though there was no significant difference in the pretest marks of the students with both methods of learning (lecture and SDL) (Table 1). The pre-test marks were higher than the post-test marks of both the methods of learning (Tables 2,3). However, the post-test marks of SDL session was significantly higher than the post-test marks of didactic lecture class (Table 4). Our study agrees with the findings of Arunima Chaudhuri, et al11 who also showed that students performed better in the post SDL session compared to post lecture session. So, SDL is an effective method of learning for undergraduate students and can be preferred over didactic lecture in teaching certain topics.
According to researchers, SDL is an individual’s attitude towards learning, where they decide at what depth and breadth they need to learn12. They prepare their own learning goals, find reading material and implement the right learning strategies, which is in contrast to conventional teaching where a teacher delivers to a large audience of students 13. This process of dynamic learning aims to help medical graduates to take initiative in solving their learning problems and to become lifelong learners14. As per
our study majority of students find SDL to be more interesting, more satisfying; by SDL, they are more confident in applying clinical knowledge, they are more enthusiastic in learning, it is easier learning with SDL, it generates curiosity in them, better recall possible by SDL, it motivates students better however it demands more effort from students (Figs 1&2). Our findings are similar to the findings of Poonam Agrawal, et al8 . Knowles stated SDL as a dynamic process where the learner instills new experiences, co-relate present and previous experiences and identifies current experiences 15 . Candy said that in SDL, students acquire the ability to perform activities that is helpful for them to control their learning16. SDL is generally defined as “learning on one’s own initiative, with the learner having primary responsibility for planning, implementing, and evaluating the effort”17. SDL has been considered as an important tool for life-long learning, which is an integral part of a medical doctor’s professional life; so, SDL method is increasingly being promoted from the early phases of Medical College18
The present medical curriculum give emphasis on active learning and hence, this requires greater involvement of faculty members but the availability of faculty members is posing a huge challenge19
Table 1 — Comparison of Mean Pre-test marks of Conventional Lecture and SDL
Mean Pre-test marksMean Pre-test marksp-value (Lecture) ± SD(SDL) ± SD
± 2.05.2 ± 1.60.17
Table 2 — Comparison of Mean Pre-test and Post-test marks of Conventional Lecture
Fig 2 — Comparison of students’ view about SDL and conventional teaching method
CONCLUSION
Our study concludes that students’ performance is increasing with SDL and also, the students have a positive attitude towards SDL, so it can be considered as an alternate form of learning in acquiring knowledge. SDL is certainly an effective mode of teaching certain topics in Physiology. SDL should not supplement the traditional teaching approach rather, SDL sessions could cover only a few topics from the total content areas in the curriculum of the 1st year MBBS programme. Implementation of SDL should not be a challenge; wisely and timely planned SDL can be a boon for teaching more effectively and fascinatingly.
Limitations of our Study : our study was a shortduration study. A study of longer duration with a wideranging content area needs to be done to ascertain the impact of SDL on traditional curricula.
Funding : Nil
Conflict of interest : Nil
REFERENCES
1Prober CG, Khan S — Medical education reimagined: a call to action. Acad Med 2013; 88(10): 1407-10.
3Myat San Yi — Assessing Knowledge and Practice of SelfDirected Learning among Medical Students, UNIMAS. Research J Pharm and Tech 2021; 14(1): 303-7.
4Barrows HS — Problem-based, self-directed learning. J Am Med Assoc 1983; 250: 3077-80.
5Benedict N, Schonder K, McGee J — Promotion of Selfdirected Learning Using Virtual Patient Cases. Am J Pharm Educ 2013; 77: 151.
6Arroyo-Jimenez Mdel M, Marcos P, Martinez-Marcos A, Artacho-Pérula E, Blaizot X, Muñoz M, et al — Gross anatomy dissections and self-directed learning in medicine. Clin Anat 2005; 18: 385-91.
7Grieve C — Knowledge increment assessed for three methodologies of teaching physiology. Med Teach 1992; 14: 2732.
8Agrawal P, Mehta S, Verma N — Journal of Education Technology in Health Sciences, September-December 2019; 6(3): 72-6.
9Shankar PR, Piryani RM, Palaian S — Organizing and Conducting Small Group Interactive Learning Sessions. Indian J of Pharmaceutical Education and Research 2022; 56(3): 66772.
10El-Gilany AH, Fawzia El Sayed A — Self-directed learning readiness and learning styles among Saudi undergraduate nursing students. Nurse Educ Today 2013; 33(9): 1040-4.
11Chaudhuri A, Paul S, Goswami A — A Comparative Study to Evaluate the Role of Interactive Lecture Classes and SelfDirected Learning Sessions among First MBBS Students in the Department of Physiology during Implementation of Competency Based Medical Education. J Evid Based Med Healthc 2020; 7(46): 2715-8.
12Sekhar S, Premarajan KC, Ramalingam A, Iswarya S — Selfdirected Learning Readiness among Fifth Semester MBBS Students in a Teaching Institution of South India. Educ Health 2014; 27(3): 289-92.
13Ainoda A,Onishea H,yasuda Y — Definitions and goals of “selfdirected learning” in contemporary medical education literature. Ann Acad Med Singapore 2005; 34(8): 515-9.
14McGrath D,Crowley L, Rao S,Toomey M, Hannigan A, Murphy L — Outcomes of Irish graduate entry medical student engagement with self-directed learning of clinical skills.
15Knowles MS — Self-directed learning: A guide for learners and teachers. New York: Association Press. 4. Candy PC (1991) Self-direction for lifelong learning. San Francisco: Jossey-Bass, 1975.
16Dirkes MA — Metacognition: Students in charge of their thinking. Roeper Review 1985; 8(2): 96-100.
17Premkumar K, Pahwa P, Banerjee A, Baptiste K, Bhatt H — Does medical training promote or deter self- directed learning? A longitudinal mixed-methods study. Acad Med 2013; 88(11): 1754-64.
18Murphy P, Lee C, Eoin OM, Fergus ED, Colm MPO — Medical student knowledge regarding radiology before and after a radiological anatomy module: implications for vertical integration and self-directed learning Kevin. Insights Imaging 2014; 5(5): 629-34.
19Kumar A — Teaching systems biology: an active-learning approach. J Cell Biol Educ 2005; 4(4): 323-9.
Original Article
Effect of Papain Urea versus EUSOL in Diabetic Foot Ulcer Management
Sharath Rajkumar1, Achu Jacob Philip2, Sathish Rajkumar3, Rahul Raj C L4, Ashwin Chand5, Umaakanth Soundar C S6
Background : Cases of Diabetes Mellitus (DM) are increasing day by day with a perpetual increase in diabetic foot ulcer among these patients. Most of the patients present with infected ulcers with slough and unhealthy tissue. Surgical debridement needed as a initial line of management and later slough removal by chemical debridement agents. In our study we compared the effectiveness of chemical wound debridement using papain urea dressing as against Edinburgh University Solution of Lime (EUSOL) in diabetic foot ulcer. Also we tried to study the associated risk factors involved in the outcome of an ulcer.
Materials and Methods : Patients diagnosed with Type 2 Diabetes Mellitus with a foot ulcer classified under Wagner’s classification I and II were taken up for the study. They were randomly allocated into two groups of 51 members each. EUSOL was used in one group and Papain Urea in the other groups as dressing agent.The rate of healing and other factors related to the foot ulcer were compared between the two groups.
Results : It was observed that there was significant reduction in ulcer size and slough in ulcers where Papain Urea was used as dressing agent. There was also better and faster granulation tissue formation among the group of patients using Papain Urea as dressing agent. The observation was made by measuring the surface area of slough and granulation tissue.
Conclusions : In diabetic foot ulcer, Wagner’s classification I and II Papain Urea dressings showed significant reduction in the duration of healing time and faster slough removal. It also helped in forming healthy granulation tissue, without any associated complications. Hence, Papain Urea dressings can be considered as a good option for chemical debridement and wound healing for diabetic foot ulcer.
World wide there has been an increase prevalence of Type 2 Diabetes. The global prevalence of diabetes among adults over 18 years of age has risen from 4.7% in 1980 to 8.5% in 20141. As per the current statistics number of individuals having Diabetes Mellitus can go up to 366 million by 2030. This disease could definitely turn into a threat to health and become a potential epidemic in India with more than 62 million diabetic individuals currently diagnosed with the disease2,3.
It is predicted that by 2030 Diabetes Mellitus may afflict up to 79.4 million individuals in India and there will be an increase in the sequelae followed by it4,5 Among the foot problems associated with Diabetes Mellitus nearly 5-10% needs amputation. It has now
Department of General Surgery, Pondicherry Institute of Medical Sciences, Puducherry 605014
1MS (General Surgery), Assistant Professor
2MS (General Surgery), DNB, Associate Professor and Corresponding Author
3MS (General Surgery), Senior Resident
4MS (General Surgery), Assistant Professor
5MS (General Surgery), Professor
6MS (General Surgery), Associate Professor
Received on : 25/08/2022
Accepted on : 09/01/2024
Editor's Comment :
Diabetic Foot Ulcer treatment requires utmost care with proper debridement techniques.
Papain Urea dressing provides effective debridement, promotes healing, causes very minimal pain and allergic reaction are very minimal.
been demonstrated that up to 50% of amputations and ulcerations could be prevented through early diagnosis and adequate treatment6. Almost 85% of the problems resulting from diabetic foot can be prevented through specialized care7.
There are many methods of slough removal, namely surgical debridement, biological, mechanical or chemical debridement.A range of chemical agents, including hypochlorite’s such as EUSOL and Dakin’s Solution (Sodium Hypochlorite), Hydrogen Peroxide and Iodine, have been used to promote debridement of wounds. One trial comparing enzymatic debridement with saline-soaked dressings reported that the enzyme-treated wounds healed faster8
EUSOL is solution of chlorinated lime and boric acid, on exposure to the wound the nascent chlorine gets liberated and breaks down the di sulphide bond
122, No 10, October 2024Journal
of the protein in the tissue hence aids in denaturing the slough. Papain, obtained from papaya fruit breaks down cysteine residues in proteins. Urea is combined to increase its proteolytic action5. Studies involving Papain Urea have shown faster granulation compared to other products9,10. No studies have been done to compare EUSOL and Papain Urea chemical debridement agents, both which are easily available and economical to use. One of the main cause of non healing diabetic ulcer was development of osteomyelitis. Osteomyelitis in diabetic foot ulcers patients including ulcer size more than 2 cm and depth allowing visibly exposed bone or ability to probe to bone had lesser chance of healing and most of these cases needed amputation as an end measure11-14. The presence of a sausage toe with erythema and nonpitting edema that obliterates the normal contour of the digit has been associated with underlying Osteomyelitis in diabetic patients but the frequency of this finding is not known15. To conclude once bone involvement sets in there is no use of any chemical debridement agents and patient will end up with amputation. So, early diagnosis and treatment is a must for all diabetic foot ulcers.
Hence, this study is done to compare two easily available chemical debridement agents and to see their effect of debridement on diabetic foot ulcers.
MATERIALS AND METHODS
The study involved only human subjects. This was a randomized control open clinical trial study of 18 months duration from November, 2016 to May, 2018.
The sample size for this study was 51 in each group, total of 102 patients.
Inclusion Criteria :
•Adults (above 18 years of age), both gender.
•Wagner’s classification I and II.
•A wound in need of debridement (opinion of investigator).
• Patients under glycemic control.
Exclusion Criteria :
•Patients who were diagnosed to have vascular insufficiency.
•Clinical symptoms of osteomyelitis, inadequate nutrition, or uncontrolled diabetes.
•Clinically significant medical conditions that would impair wound debridement inclusive of renal, hepatic, hematologic, neurologic or immunological disease.
•Patients receiving corticosteroids, immunosuppressive agents, radiation or chemotherapy within one month prior to study entry.
Discontinuation Criteria :
The patient required any treatment/therapy that would compromise the evaluation of the test product, such as surgical debridement or skin grafting.
Topical Agents Used :
Group 1 : Papain Urea ointment - Composition: Each gram contains Papain IP >521700 units and Urea IP 100 mg.
Group 2 : EUSOL ( Edinburgh University Solution of lime) Composition : 12.5 gm bleaching powder + 12.5 gm boric acid distilled water to make 1 liter (Fig 2).
Drugs are approved by the drug controller of India
Parameters to be studied :
•Duration of ulcer
•Wound size
•Wound site
•The proportion of slough completely debrided or maximum percentage of slough debrided according to surface area of the ulcer was studied
•Periodical photographs of the ulcer was taken and was assessed for the amount of slough.
•Blood sugar levels was recorded periodically, fasting and post prandial sugars were measured every 3rd day and recorded.
Study Design :
All patients diagnosed with type 2 diabetes mellitus and who have a diabetic foot ulcer reporting to the hospital between November, 2016 to May, 2018 falling into the inclusion criteria was subjected to the study using either EUSOL or Papain Urea dressings. All patients was brought under adequate glycemic control. Empirical antibiotic of choice was amoxicillinclavulanate given orally at a dose of 625mg (500mg + 125mg) thrice a day to all patients and was changed according to their culture and sensitivity. Patients was randomly allocated to receive either Papain Urea (Group 1) or EUSOL (Group 2) dressings using computer generated random numbers.
Wound measurement was done by measuring the surface area of wound by mapping method. A transparent graft sheet was placed on the ulcer and areas of slough and total area of the ulcer was marked and recorded. Amount of slough present on the wound was measured and taken as percentage of total ulcer area (Fig 1).
Patient received once daily dressing according to the group they are placed in. Progress was monitored every 3rd day up to a period of 21 days. Periodic photographs was taken once at the end of every week and assessed for an objective assessment. The
progress in wound healing was assessed by a surgeon who was blinded from the study and chemical agent used.
Method of Statistical Analysis :
All the collected data was entered in Excel 2010, baseline characters (demography, clinical, bio chemical, hemodynamic changes) of the study was measured using mean and Standard Deviation for continuous variables and percentage for dichotomous and categorical variables. Two groups was compared using independent 'T' test for continuous variables and Chi Square test for dichotomous and categorical variables
Outcome variables the time taken for wound debridement and the percentage of granulation tissue growth was compared using Independent 'T' test. P-value of 0.05 was considered as statistically significant.
Ethical Consideration :
i)This trial was approved by the institute ethics committee – reference number IEC:RC/15/26
ii)This trial is registered under Clinical Trials Registry - India with Reference number REF/2015/ 10/009914
RESULTS
A total of 102 patients were included in this study. They were divided into two groups of 51 each. Group 1 patients received PAPAIN UREA ointment for wound treatment and Group 2 patients received EUSOL (Edinburgh University Solution of lime ) for wound management. Mean age was 55.8 years with Standard Deviation of 12.8 years. Minimum and maximum age was 30 years and 94 years respectively. Mean age in EUSOL group was 57.55 and Papain Urea group was 54.73.Gender wise 99(97.1%) patients were male and 3(2.9%) females. Group 1 had 37.3% patients under wagner grade 1 and 62.7% under wagner grade 2. Group 2 had 31% patients under wagner grade 1 and 69% under wagner grade 2. Both groups had comparable ulcers with equal distribution of Grade 1 (Erosion of epidermis) and Grade 2 (Involving muscle) ulcers. The ulcers were studied based on site. And both groups had an equal distribution of ulcers from all sites. Most common site present was on the plantar aspect followed by dorsum of foot (Fig 3.1). The mean difference in area of ulcer in the EUSOL group was –0.69cm2 . The mean difference in area of ulcer in the Papain Urea Group was – 0.83cm 2 . The mean difference in % area of slough in the PAPAIN UREA Group was – 1.61cm2 .The mean difference in % area of slough in the EUSOL group was – 1.01cm2
Papain urea method showed better slough removal after Day 6 of usage when compared to EUSOL. Papain urea also had a statistically significant faster presence of healthy granulation tissue (DAY6) Papain Urea had a more number of subjects showing a faster granulation from day 6 onwards, all of which were statically significant (Chi-square value 20.4, p<0.001 – significant ).
At the end of the study period, all 51 study subjects in the Papain Urea group showed healthy granulation tissue.In the EUSOL group 46 study subjects showed healthy granulation tissue , whereas 5 study subjects did not show healthy granulation tissue at the end of the study period.
All the parameters were statistically significantly better in the Papain Urea group when compared to EUSOL group. After assessing various parameters for wound healing in 51 patients in each group, it was observed that reduction in size of ulcer started with in minimum of 3 days, size of ulcers started reducing
Fig 1 — A-Graft sheet and the ulcer that needs to be measured. B-Graft sheet placed on the ulcer and outline marked. C-Area of slough marked. D-Total area of ulcer and slough area measured.
Fig 2 — A- Papain Urea debridement ointment. B- Edinburgh University Solution of Lime.
faster in Papain Urea group after day 6 onwards when compared to EUSOL group. Reduction in area of slough was significantly faster in Papain Urea group from day 6 onwards and showed maximum reduction on day 18 (Fig 3.2).
Granulations were started to see in the ulcer within 6th day in the PAPAIN UREA group which was faster than the EUSOL group which was observed only from day 12. All the subjects in Papain Urea group had healthy granulation tissue at the end of the study period when compared to EUSOL dressings. Actual slough area as well as picture based slough area were in correlation with each other.Factors such as site, side, FBS, PPBS did not affect wound healing.Slough reduction in younger patients was much faster than older age group. There was a statistical significance between the age groups (Figs 4.1 & 4.2; Table 1).
DISCUSSION
One of the major complication and common reason for hospitalization in Diabetes Mellitus is diabetic foot ulcer. It occurs in majority of patients with diabetes. This has become the preceding cause for almost 84% of all lower limb amputations and upto
14% to 20 % of patients with diabetic foot ulcers to undergo amputation 16,17 . There is a continuous search for an ideal method to accelerate wound healing which does not have any ill effects on the patient.
About 102 patients with diabetic foot ulcer were admitted under Surgery Department in Pondicherry Institute of Medical Sciences. Their wound condition at presentation was assessed and wounds were classified according to Wagner’s classification (grade 1 and grade 2 of Wagner’s classification). Their glycemic status were assessed by checking the biochemical parameters like FBS, PPBS and brought under control. The wounds that had slough and required debridement were brought under the study. The patients were randomized into two groups. Group 1 – Papain Urea and Group – 2 EUSOL respectively. Healing of the ulcer was monitored every 3rd day on the based on following parameters like reduction in size of ulcer, reduction in percentage area of slough
Fig 3.1 — Distribution of study subjects based on type of intervention and location of ulcer
Fig 3.2 — Distribution of study subjects based on type of intervention and percentage area of reduction.
Fig 4.2 — A - Foot ulcer Day 1 of Papain Urea Dressing , B - Day 7 , C - Day 14 and D-Day 21.
Fig 4.1 — A-Foot Ulcer Day 1 of EUSOL Dressing, B-Day 7, C-Day 14 and D Day 21.
122, No 10, October 2024Journal
Table 1 — Distribution of study subjects based on type of intervention and changes in variables from baseline to 21st day
VariablesInterventionNumberMeanStandardt-valuep-value of subjectsDeviation
Area of ulcerPAPAIN UREA510.82940.199293.94<0.001 Significant EUSOL510.68820.16081
% area of sloughPAPAIN UREA511.61570.552587.29<0.001 Significant EUSOL511.01180.21227
% area ofPAPAIN UREA51-0.27650.13355-5.26<0.001 Significant reductionEUSOL51-0.16080.08265
FBSPAPAIN UREA51-12.549044.140830.0030.998 Not Significant EUSOL51-12.568625.76607
PPBSPAPAIN UREA510.647139.58577-0.151 0.881 Not Significant EUSOL511.666727.78393
and presence of granulation. All the ulcers were mapped and compared with a similar ulcer among both groups. The condition of ulcer at the time of presentation was assessed and recorded. The wounds were managed with once a day dressings with Papain Urea ointment or EUSOL solution. The wound was assessed on every 3rd day up to 21 days.
The mean age among the total study population was 56.14 years with Standard Deviation of 12.174 years. Minimum and maximum age were 30 years and 94 years respectively. The reduction in size of ulcer started within minimum of 3 days, size of ulcers started reducing faster in Papain Urea group after day 6 onwards. The reduction in area of slough was significantly faster in Papain Urea group from day 6 onwards and showed maximum reduction on day 18.
Granulation tissue were started to appear in the ulcer within 6th day in the Papain Urea group which was faster than the EUSOL group. All the subjects in Papain Urea group had healthy granulation tissue at the end of the study period when compared to EUSOL dressings. Actual slough area as well as picture based slough area were in correlation. Factors such as site, side, FBS, PPBS did not affect wound healing. Slough reduction in younger patients was much faster than older age group.
A study done by Alvarez, et al18 showed that Papain Urea significantly reduced the area of necrotic tissue at 4-weeks by comparison to Collagenase in ulcers. They also have shown that ulcers treated with Papain Urea had a greater degree of granulation than those treated with Collagenase at weekly periods during a 4-week assessment. However a strong scientific conclusion could not be made.A PubMed literature review by J Ramundo and M Gray19, a total of nine studies were included in the review: eight Randomized Controlled Trials (RCTs) and one cohort study with at least 320 patients were included. They
showed that active treatment resulted in more rapid and effective removal of necrotic tissue from pressure ulcers, leg ulcers and partial thickness burn wounds. A comparison of collagenase and Papain Urea based ointments found faster removal of necrotic tissue in the Papain Urea group
Morrison, et al 20 demonstrated that 27 of 30 patients with decubitus ulcers, previously resistant to topical therapy, were completely healed within two to 6 weeks of Papain Urea. There are many types of debridement methodologies for the removal of nonviable slough. Only when the slough is removed does the healing take place. Here, we compare two medical methods of wound debridement, EUSOL application and Papain Urea dressings and their effectiveness in debriding diabetic foot ulcers. These two debridement agents haven’t been compared in previous clinical trials.
CONCLUSIONS
Diabetic foot ulcers are the most common complications in a diabetic patient. Debridement of an ulcer play a vital role in the healing of diabetic foot ulcers. Medical methods of debridement have an advantage where it can be used in patients who are unfit for anaesthesia and that it is painless. Also it can be done as an OPD basis. Papain Urea dressings has become one of the considerations as a debridement agent for various types of ulcers. It helps in wound healing by reducing the duration for wound healing by reducing the slough and also promoting granulation.
It was proved that Papain Urea ointment is a better again in debridement when compared to EUSOL. In the present study all 51 patients (grade 1 and grade 2 of Wagner’s classification) started showing features of reduction in ulcer size, area of slough and presence of healthy granulation tissue. In diabetic foot ulcer, Papain Urea dressings help in wound healing by decreasing the duration of healing time and faster slough removal, also promotes granulation, without any complications. Hence, Papain Urea dressings are a good option for debridement and wound healing in diabetic foot ulcer.
Vol 122, No 10, October 2024Journal
REFERENCES
1Global report on diabetes. World Health Organization. 2016.
2Joshi SR, Parikh RM — India diabetes capital of the world: now heading towards hypertension. J Assoc Physicians India 2007; 55: 323-4.
3Kumar A, Goel MK, Jain RB, Khanna P, Chaudhary V — India towards diabetes control: Key issues. Australas Med J 2013; 6(10): 524-31.
4Wild S, Roglic G, Green A, Sicree R, King H — Global prevalence of diabetes estimates for the year 2000 and projections for 2030. Diabetes Care 2004; 27(3): 1047-53.
5Whiting Dr, Guariguata L, Weil C, Shawj — IDF diabetes atlas: Global estimates of the prevalence of diabetes for 2011 and 2030. Diabetes Res Clin Pract 2011; 94: 311-21.
6Amaral A, Homem L, Gomes M, Campissi L, José M, Antonio M, et al — Prevention of lower limb lesions and reduction of morbidity in diabetic patients: Revista brasileira de ortopedia, 2014; 49(5): 482-87.
7Vijaykumar H, Pai SA, Pandey V, Kamble P — Comparative study of collagenase and papain-urea based preparations in the management of chronic nondebridement limb ulcers. Indian J Science and Tech 2011; 4(11): 1096-106.
8Smith F, Dryburgh N, Donaldson J, Mitchell M — Debridement for surgical wounds review: The cochrane library. 2011; (5).
9Bajaj G, Karn NK, Shrestha BP, Kumar P, Singh MP — A randomised controlled trial comparing eusol and sugar as dressing agents in the treatment of traumatic wounds. J Trop Doct 2009; 39(1): 1-3.
10Sarabahi S — Recent advances in topical wound care. Indian J Plast Surg 2012; 45(2): 379-87.
11Grayson ML, Gibbons GW, Balogh K — Probing to bone in infected pedal ulcers: a clinical sign of underlying osteomyelitis in diabetic patients. JAMA 1995; 273: 721.
12Newman LG, Waller J, Palestro CJ — Unsuspected osteomyelitis in diabetic foot ulcers: diagnosis and monitoring by leukocyte scanning with indium in 111 oxyquinoline. JAMA 1991; 266: 1246.
13Butalia S, Palda VA, Sargeant RJ — Does this patient with diabetes have osteomyelitis of the lower extremity? JAMA 2008; 299-806.
14Dinh MT, Abad CL, Safdar N — Diagnostic accuracy of the physical examination and imaging tests for osteomyelitis underlying diabetic foot ulcers: meta-analysis. Clin Infect Dis 2008; 47: 519.
15Rajbhandari SM, Sutton M, Davies C — Sausage toe: a reliable sign of underlying osteomyelitis. Diabet Med 2000; 1774.
16Lipsky BA, Peters EJ, Senneville E — Expert opinion on the management of infections in the diabetic foot. Diabetes Metab Res Rev 2012; 28(1): 163.
17Fulop AM, Dhimmer S, Deluca JR — A meta-analysis of the efficacy of phototherapy in tissue repair. Photomed Laser Surg 2009; 27: 695.
18Alvarez O — Chemical debridement of pressure ulcers: a prospective randomized comparative trial of collagenase and papain urea formulations. Wounds 2000; 12(2): 15-25.
19Ramundo J, Gray M — Enzymatic wound debridement wound ostomy and continence nursing 2008; 35(3): 273-80.
20Morrison J, Casali J — Continuous proteolytic therapy for decubitus ulcers. Am J Surg 1957; 93: 446-8.
Original Article
Evaluation of Alteration in Testicular Perfusion after Laparoscopic Hernioplasty : A Prospective Study Conducted at one of the Tertiary Care Centres of Western India
Background : Hernia repair is one of the most common general surgeries performed today. Despite its widespread use, the impact of laparoscopic Total Extraperitoneal (TEP) repair on Testicular Perfusion remains under-explored, especially in Indian literature. This study aims to evaluate changes in testicular blood flow following laparoscopic TEP hernia repair using Color Doppler Ultrasound (CDUS).
Materials and Methods : This prospective study was conducted at Sheth V S General Hospital, Ahmedabad in 25 male patients with clinically diagnosed Inguinal Hernia who underwent laparoscopic TEP repair. Testicular perfusion was assessed pre-operatively and post operatively at 24 hours, 1 week and 3 months using CDUS. Key parameters measured included Peak Systolic Velocity (PSV), End-Diastolic Velocity (EDV) and Resistive Index (RI). Statistical analysis was performed using Mean ± Standard Deviation, paired t-test, ANOVA and Pearson correlation.
Results : The study observed minor alterations in Testicular blood flow postoperatively. RI values showed a significant reduction in the testicular artery (p<0.05), while PSV and EDV demonstrated dynamic changes over time. The RI decreased slightly in the Testicular and capsular arteries with an increase in the Intratesticular Artery.
Conclusion : The findings suggest that TEP hernia repair does not lead to significant long-term alterations in Testicular Perfusion and health when measured at 3 months postoperatively. Research study with larger sample sizes and extended follow-up periods is recommended to fully understand the long-term impact of laparoscopic TEP repair on testes.
[J Indian Med Assoc 2024; 122(10): 70-5]
Key words :Laparoscopic TEP Hernia Repair, Testicular Perfusion, Color Doppler Ultrasound, Resistive Index, Peak Systolic Velocity.
Ahernia is defined as the abnormal protrusion of an organ or tissue through a defect in its surrounding walls. Although hernias can occur in various parts of the body, they most frequently involve the abdominal wall, particularly the inguinal region1
Inguinal hernia repair is one of the most frequently performed general surgeries today. Despite its prevalence, the technical aspects of hernia repair have significantly evolved over time and continue to advance2. Testicular complications, which can impact sexual function, are among the rare but serious issues requiring careful attention during inguinal hernia surgeries, as inguinal hernias are anatomically close to the testicular blood vessels.
The literature shows significant variation in the
Department of General Surgery, GCS Medical College, Hospital and Research Centre, Ahmedabad, Gujarat 380025
1MS (General Surgery), Assistant Professor and Corresponding
Author
2MS (General Surgery), Assistant Professor
3MD (Community Medicine), Assistant Professor, Department of Community Medicine, GMERS Medical College and Hospital Vadnagar, Ahmedabad, Gujarat 384355
Received on : 19/07/2024
Accepted on : 14/10/2024
Editor's Comment :
Laparoscopic hernia repair (TEP) minimally impacts testicular blood flow, maintaining perfusion levels up to 3 months postoperatively. This suggests that when performed by skilled surgeons, TEP repair is safe for testicular health. Further research with larger cohorts and extended follow-up period is needed to explore long-term effects on fertility and testicular function.
incidence of ischemic orchitis and testicular atrophy following hernia repair. According to Fong and Reid, primary ischemic orchitis occurs in 0.7% to 1.0% of patients undergoing open hernia surgery, with 0.35% to 0.65% developing testicular atrophy3,4
All meshes used in hernia repair induce an initial and chronic inflammatory response after implantation. One potential outcome of this inflammation is ischemic orchitis and/or testicular atrophy in adult males5
High-resolution Color Doppler Ultrasound (CDUS) is an effective and non-invasive technique which reliably demonstrates testicular arterial anatomy and blood flow which helps in detecting blood flow alterations6
Since Ger et al introduced laparoscopic inguinal hernia surgery in 19907, it has undergone significant modifications and is widely used in general surgery. Though safe and effective, laparoscopic surgery still
122, No 10, October 2024Journal
has its drawbacks. When performed meticulously, laparoscopic TEP repair results in complications and short-term recurrence rates comparable to open hernia repair, with less pain and faster recovery8
Few studies have evaluated the impact of Laparoscopic Inguinal Hernia Surgery on Testicular Perfusion, showing that blood flow typically normalizes to pre-operative levels after a few months9-12 There is limited Indian literature on this subject, highlighting the need for further research in this context.
Laparoscopic hernia repair is widely adopted for its minimally invasive approach and favorable recovery profile. However, there is limited data on its impact on Testicular Perfusion, which is crucial for preventing complications such as ischemic orchitis and testicular atrophy. This study aims to address this gap by measuring bilateral Testicular Perfusion using CDUS at multiple time points: pre-operatively and postoperatively at 24 hours, 1 week and 3 months. The primary objectives were to assess any alterations in testicular blood flow following laparoscopic TEP repair and to compare these measurements over time, thereby providing valuable insights into the procedure’s impact on testicular health and guiding improvements in surgical techniques.
MATERIALS AND METHODS
Study Design and Population :
This prospective controlled trial was conducted in the Department of General Surgery and Department of Radiodiagnosis, Sheth V S General Hospital, Ahmedabad. The study included 25 male patients, aged above 18 years, with clinically diagnosed inguinal hernia who underwent laparoscopic Total Extraperitoneal (TEP) repair from August, 2013 to July, 2015.
Inclusion and Exclusion Criteria :
Male patients above 18 years with a clinical diagnosis of inguinal hernia and suitability for laparoscopic TEP under general anesthesia were included. Exclusion criteria encompassed coagulation defects, undescended testis, recurrent hernia, coexistent varicocele, complicated hernias (irreducible, strangulated, obstructed), history of previous lower abdominal surgery or radiotherapy, and complete inguinal hernia.
Preoperative and Operative Preparation :
Informed consent was obtained from all participants. Pre-operative workup included filling out a detailed proforma, Routine Blood Tests, Chest Xray, ECG for patients over 40 years and pre-anesthetic
clearance. Testicular Perfusion was assessed using Color Doppler Ultrasound (CDUS) with Philips HD11™. For the laparoscopic TEP procedure, patients were given prophylactic antibiotics, kept nil per oral before surgery and underwent a laparoscopic repair with mesh placement under general anaesthesia.
Postoperative Care and Analysis :
Postoperative care included monitoring for complications, administering prophylactic antibiotics, and pain management with diclofenac sodium. Patients were discharged on the first postoperative day after CDUS evaluation and follow-up CDUS was conducted on the 7th day and at 3 months. Statistical analysis of results was performed using Mean ± Standard deviation, paired t-test, ANOVA and Pearson correlation with significance set at p<0.05, utilizing SPSS software (version 16.0).
RESULTS
Table 1 presents the results of a linear regression analysis examining how various demographic and clinical factors influence blood flow in the testicular, capsular and intratesticular arteries. The analysis identified several significant findings: Patients under 25 years old exhibited a significant decrease in Testicular Artery blood flow (β = 0.09, p = 0.031), suggesting that younger patients may be more vulnerable to changes in blood flow post-surgery. In contrast, no significant changes were observed in patients aged 26-45 or over 45 years. Smokers showed a significant reduction in Testicular Artery blood flow (β = 0.07, p = 0.047) and a near-significant decrease in Intratesticular Artery blood flow (β = 0.05, p = 0.058). These findings emphasize the negative impact of smoking on vascular health in the context of hernia repair.
The analysis found no significant differences in blood flow changes between unilateral and bilateral hernia repairs, indicating that the type of surgical approach does not markedly affect vascular outcomes. Similarly, whether the repair was performed on the right or left side did not significantly affect blood flow in any of the measured arteries. There was a non-significant trend toward reduced blood flow in the testicular artery for patients with direct hernias (β = 0.08, p = 0.077), but overall, the nature of the hernia (direct versus indirect) did not significantly impact blood flow. Patients without mesh fixation showed a significant increase in Intratesticular Artery blood flow (β = 0.04, p = 0.028), suggesting that avoiding mesh fixation could have beneficial
effects on blood flow in this artery. No significant effects were noted in patients with mesh fixation. These findings highlight the importance of considering patient-specific factors, such as age and smoking status, in the management and monitoring of hernia repairs, as they can significantly affect vascular health outcomes.
In the study, bilateral testicular perfusion was measured through the Resistive Index (RI) of different testicular arteries, including the Testicular Artery, Capsular Artery and Intratesticular Artery, both pre-operatively and three months postoperatively. Pre-operative measurements showed mean RI values of 0.77 (± 0.05) for the Testicular Artery, 0.64 (± 0.06) for the capsular artery, and 0.58 (± 0.07) for the Intratesticular Artery. Postoperative measurements indicated a slight decrease in the testicular artery RI to 0.72 (± 0.04), a minimal reduction in the capsular artery RI to
0.63 (± 0.05), and a minor increase in the intratesticular artery RI to 0.60 (± 0.06). Comparative analysis revealed significant changes in RI values postoperatively, with a reduction of 0.05 in the Testicular Artery RI and 0.01 in the Capsular Artery RI, while the Intratesticular Artery RI increased by 0.02. These changes were statistically significant, with p-values less than 0.05 (Tables 2&3).
Table 2 — Measurement of Bilateral Testicular Perfusion
Table 3 — Comparative Analysis of RI Changes
Table 1 — Impact of Demographic and Clinical Factors on Testicular, Capsular, and Intratesticular Artery Blood Flow : Linear Regression Analysis
Peak Systolic Velocity (PSV) : Preoperative measurements indicated PSV values of 17.3 ± 5.2 cm/s for the testicular artery, 9.0 ± 3.2 cm/s for the capsular artery, and 8.2 ± 3.3 cm/s for the intratesticular artery. At 24 hours postoperatively, there was a slight decrease in PSV in the Testicular Artery to 16.8 ± 6.7 cm/s, while the capsular and Intratesticular Arteries showed minor increases to 9.9 ± 2.5 cm/s and 8.5 ± 3.9 cm/s, respectively. One week postoperative measurements revealed a further reduction in PSV for the Testicular Artery to 15.1 ± 4.0 cm/s and for the Intratesticular artery to 7.5 ± 2.1 cm/s, while the capsular artery PSV decreased to 8.2 ± 2.7 cm/s. At 3 months postoperative, the testicular artery PSV remained stable at 15.0 ± 4.3 cm/s, the capsular artery showed a slight increase to 8.6 ± 1.6 cm/s, and the intratesticular artery PSV increased to 8.0 ± 2.2 cm/s. These findings reflect
the dynamic changes in blood flow characteristics following surgical intervention (Fig 1).
End-Diastolic Velocity (EDV) : Pre-operative EDV values were 4.2 ± 1.7 cm/s for the Testicular artery, 3.2 ± 1.5 cm/s for the capsular artery, and 3.1 ± 1.1 cm/s for the Intratesticular artery. At 24 hours postoperatively, EDV decreased to 3.5 ± 1.3 cm/s, 3.0 ± 1.0 cm/s, and 2.9 ± 1.3 cm/s for the respective arteries. By 1 week postoperatively, the values were relatively stable at 3.6 ± 1.1 cm/ s, 2.9 ± 1.0 cm/s, and 2.9 ± 0.9 cm/s. At 3 months postoperative, EDV values showed a slight recovery to 4.0 ± 1.0 cm/s for the testicular artery, 3.2 ± 0.8 cm/s for the capsular artery, and 3.1 ± 0.7 cm/s for the intratesticular artery (Fig 2).
Resistive Index (RI) : Pre-operative RI values were 0.75 ± 0.08 for the testicular artery, 0.65 ± 0.09 for the capsular artery, and 0.60 ± 0.08 for the
Fig 1 — Line graph depicting alteration in Peak Systolic Velocity of testicular vessels in postoperative period
Fig 2 — Line graph depicting alteration in End Diastolic Velocity of testicular vessels in postoperative period
122, No 10, October 2024Journal
Intratesticular Artery. At 24 hours postoperatively, RI values increased to 0.78 ± 0.07, 0.69 ± 0.10 and 0.64 ± 0.09, respectively. One week postoperatively, the values slightly decreased to 0.76 ± 0.07, 0.64 ± 0.08, and 0.61 ± 0.08. By 3 months postoperative, RI values further decreased to 0.72 ± 0.06 for the testicular artery, 0.63 ± 0.06 for the capsular artery, and remained steady at 0.61 ± 0.05 for the Intratesticular Artery (Fig 3).
DISCUSSION
Laparoscopic inguinal hernia repair, is leading to the development of two primary techniques: TAPP (Transabdominal Preperitoneal) and TEP (Totally Extraperitoneal Preperitoneal) 11 . TEP is often preferred due to its minimally invasive nature and preservation of the peritoneum. Studies have shown that TEP results in less postoperative pain, quicker recovery, and better cosmetic outcomes compared to open repair13
Despite the proven efficacy of laparoscopic hernia repair, limited data exists on its impact on the spermatic cord and testicular blood flow, especially concerning the potential effects of polypropylene mesh. Our study, which appears to be one of the first to examine these parameters, involved 25 male patients who underwent evaluation, surgery and a three-month follow-up.
The study population had a mean age of 42.1 years, with cases distributed between bilateral, left, and right-sided inguinal hernias. The analysis focused on alterations in testicular blood flow pre- and post-surgery, comparing unilateral to bilateral repairs and evaluating various perioperative parameters.
(1) Demographics and Preoperative Parameters: The majority of patients were middle-aged or older. No significant correlation was found between age or preexisting conditions (eg, diabetes, hypertension) and changes in testicular
blood flow post-surgery. These findings contrast with some studies where older age or comorbidities were linked to altered blood flow9,10
(2) Intraoperative Parameters : Most repairs were unilateral, with no significant difference in blood flow alterations based on hernia type, side, or mesh use. The duration of surgery was longer for bilateral repairs, but this did not significantly impact blood flow, except for a slight decrease in Resistive Index (RI) in the intratesticular artery in some cases9, This finding contrasts with Ersin, et al14 who observed significant changes in PSV and EDV postoperatively, but did not follow patients for as long as our study.
(3) Postoperative Parameters : The majority of patients were discharged within one to two days. Complications like pneumoscrotum resolved quickly and did not significantly affect blood flow. This aligns with the findings of Koksal, et al9 who reported no significant changes in RI postoperatively, while Celik, et al15 noted a decrease in RI in the testicular artery during the late postoperative period, which was not observed in our study.
The study observed changes in blood flow parameters (PSV, EDV, RI) in the testicular, capsular, and intratesticular arteries. Notably, there was a transient increase in PSV in the testicular artery postoperatively, but no significant long-term changes in RI were observed, indicating no substantial impact on testicular blood supply. This is consistent with Koksal, et al9 and contrasts with Stula, et al10, who
Fig 3 — Line graph depicting alteration in Resistive Index of testicular vessels in postoperative period
Vol 122, No 10, October 2024Journal
reported significant changes in RI and PSV postoperatively.
Our findings suggest that TEP hernia repair, particularly when performed by experienced surgeons, does not significantly compromise testicular blood flow. This conclusion aligns with some literature, though variations exist14-17 The study highlights the need for further research, especially involving larger sample sizes and exploring other factors influencing fertility. Additionally, there’s a notable gap in data specifically assessing the Indian population in this context.
CONCLUSION
Based on the aims and results of our study, we can conclude that no significant difference in testicular blood supply exists between the affected side with a reducible incomplete inguinal hernia and the normal side preoperatively. Additionally, laparoscopic Total Extraperitoneal (TEP) repair of a reducible incomplete inguinal hernia does not significantly alter testicular blood supply up to three months postoperatively.
Limitations :
Our study’s primary limitation is its small sample size, which included only 25 patients, limiting the generalizability of the results. Additionally, the followup period of three months may not be sufficient to capture all potential long-term effects on testicular blood supply and function.
Recommendations :
Future studies should aim to include a larger sample size to enhance the generalizability of the results. Extended follow-up periods beyond three months are recommended to better understand any long-term effects on testicular function. It would also be beneficial to compare the effects of different types of mesh and surgical techniques on testicular blood supply. Additionally, exploring the impact of laparoscopic TEP repair on fertility parameters, such as sperm count and anti-spermatic antibodies, could provide a more comprehensive assessment of the procedure’s effects.
Conflicts of Interest : None
REFERENCES
1Mark A Malangoni, Michael J Rosen. Hernias. In: Townsend CM, Beauchamp RD, Evers BM, Mattox KL. Sabiston Textbook Of Surgery: The Biological Basis Of Modern Surgical Practice, 9th ed. Philadelphia. Elsevier Saunders; 2012.
2Rutkow IM, Robbins AW — Demographic, classificatory, and socioeconomic aspects of hernia repair in the United States. Surg Clin North Am 1993; 73: 413.
3Fong MD, Wantz GE — Prevention of ischemic orchitis during inguinal hernioplasty. Surg Gynecol Obstet 1992; 174: 399404.
4Reid I, Devlin HB — Testicular atrophy as a consequence of inguinal hernia repair. Br J Surg l994; 81: 91-6.
5Klinge U, Klosterhalfen B, Muller M — Foreign body reaction to meshes used for the repair of abdominal wall hernias. Eur J Surg 1999; 165: 665-9.
6Middleton WD, Thome D, Melson GL — Colour Doppler ultrasound of the normal testis. AJR 1989; 152: 293-7.
7Ger R — The laparoscopic management of groin hernias. Contemp Surg 1991; 39: 15-9.
8Lai P, Kajla RK, Chander J, Shah R, Ramteke VK — Randomized controlled study of laparoscopic total extraperitoneal versus open Lichtenstein inguinal hernia repair. Surg Endosc 2003; 17: 850-6.
9Koksal N, Altinli E, Sumer A, Celik A — Impact of herniorrhaphy technique on testicular perfusion. Results of a prospective study. Surg Laparosc Endosc Percutan Tech 2010; 20(3): 186-9.
10Stula I, Druzijanic N, Srsen D, Capkun V, Perko Z, Sapunar A, et al — Influence of inguinal hernia mesh repair on testicular flow and sperm autoimmunity. Hernia 2012;16:417-24.
11Beddy P, Ridgway PF, Geoghegan T, Peirce C, Govender P, Keane FBV, et al — Inguinal hernia repair protects testicular function : A prospective study of open and laparoscopic herniorrhaphy. J Am Coll Surg 2006; 203: 17-23.
13Lai P, Philips P, Chander J, Ramteke VK — Is unilateral laparoscopic TEP inguinal hernia repair a job half done? The case for bilateral repair. Surg Endosc 2010; 24: 1737-45.
14Ersin S, Aydin U, Makay O, Icoz G, Tamsel S, Sozbilen M, Killi R — Is testicular perfusion influenced during laparoscopic inguinal hernia surgery? Surg Endosc 2006; 20: 685-9.
15Celik AS, Memmi N, Celebi F, Guzey D, Celik A, Kaplan R, et al — Impact of slit and nonslit mesh technique on testicular perfusion and volume in the early and late postoperative period of totally extraperitoneal preperitoneal technique in the patients with inguinal hernia. The American Journal of Surgery 2009; 198: 287-91.
16Sucullu I, Filiz Al, Sen B, Ozdemir Y, Yucel E, Sinan H, et al — The effects of inguinal hernia repair on testicular function in young adults: a prospective randomized study. Hernia 2010; 14: 165-9.
Isolated Native Tricuspid Valve Endocarditis with Pulmonary Septic Emboli Presenting as PUO in a Young Adult Female Managed Successfully with Surgical Intervention
Ajit Kumar Jadhav1, Anish Kumar Khan2, Digvijay D Nalawade3
Right Sided Infective Endocarditis (RSIE) is rare in immunocompetent adults without any predisposing factors and represents 5%-10% of all IE in adults. Among all RSIE native Tricuspid valve endocarditis represents 90% of the cases. They always possess a diagnostic challenge because they mimic the symptoms of Lower Respiratory Tract Infection in this case report, a 27-year-old woman was diagnosed with native Tricuspid Valve Endocarditis after presenting for 1 month with high-grade intermittent fever, a productive cough and decreased appetite without a history of intravenous drug use or any indication of an underlying cardiac abnormality.
Pyrexia of Unknown Origin (PUO) is a term used to describe a persistent febrile illness for which there is no known aetiology. To diagnose PUO is a big challenge and the patient remain undiagnosed in 30%-50% of the cases 1 . Less than 5% of PUO cases are caused by Infectious Endocarditis (IE)2. In immunocompetent, nonaddicted adults, isolated native Tricuspid Valve Endocarditis (TVE) is uncommon. We are presenting an interesting case of native Tricuspid Valve Endocarditis with Septic Pulmonary Emboli causing Pyrexia of unknown origin in a young adult female, where the delayed diagnosis from time of presentation was due to lack of risk factors and atypical presentation.
CASE REPORT
A 23-year-old female who had never used intravenous drugs, engaged in high-risk behavior or had any prior symptoms of rheumatic fever or congenital heart disease walked into our hospital’s medicine OPD. with complains of prolonged high grade intermittent fever, cough with expectoration, anorexia, loose stools on and off with intermittent blood in stool. She was in her early postpartum period after an uncomplicated vaginal delivery of her first child. At the time of her admission, she was conscious, alert and orientated on physical examination her heart rate was 120 beats/min, blood pressure was 124/70 mmHg, air room saturation was 95%, and body weight was 44 kg, she had a fever of 102º F and pallor. Two fingerbreadths
Department of Cardiology, Dr D Y Patil Medical College, Hospital & Research Centre, Maharashtra 411018
1MD (Medicine), DNB (Cardiology), Assistant Professor
3MD, DM (Cardiology), FACC, FSCAI, Associate Professor
Received on : 23/10/2023
Accepted on : 27/03/2024
Editor's Comment :
Isolated tricuspid valve endocarditis in a young adult, particularly without prior intravenous drug use or other typical risk factors, is a rare clinical scenario, highlighting the need for a high index of suspicion.
Pyrexia of unknown origin (PUO) can be an atypical presentation of endocarditis, especially in cases involving the right side of the heart, where symptoms may be less classic. Septic emboli to the lungs are a significant complication of right-sided endocarditis and can present with respiratory symptoms or be silent on initial examination.
Early and accurate diagnosis through echocardiography and other imaging techniques is crucial for timely multidisciplinary management, as delays can lead to complications.
With timely surgical intervention and appropriate antimicrobial therapy, the prognosis for isolated tricuspid valve endocarditis with complications like pulmonary septic emboli can be favorable.
below the costal margin, her spleen was palpable and firm and nontender. Cardiovascular auscultation revealed normal S1 and S2 without any significant murmur and chest auscultation revealed bi-lateral bronchial breath sounds in the infra-scapular and infra-axillary area with end-inspiratory crepitations.
The remainder of the physical examination went without incident. Microcytic anaemia was the only finding in the initial laboratory analysis; the serology results for Enteric Fever, Dengue Fever, Malaria, Viral Infections, Hiv, and Autoimmune Diseases were all negative. Her ultrasonography for abdomen and pelvis revels splenomegaly. Her HRCT thorax reveals multiple patchy areas of consolidation in bi-lateral lower lobes with few small thick-walled cavities in bi-lateral upper lobes. We suspected Health Care Associated Pneumonia (HCAP) and her blood culture was done which revealed Methicillin Sensitive Staphylococcus Aureus (MSSA) sensitive to flucloxacillin, Fosfomycin and Meropenem. She was given
122, No 10, October 2024Journal
Flucloxacillin (12gm) for 40 days, Fosfomycin for 18 days and Meropenem for 10 days. Though her fever did not subside and sputum for AFB and Broncho-alveolar Lavage was negative for Pulmonary Tuberculosis, but she was diagnosed as PTB on the basis of HRCT thorax, she was treated conservatively in our hospital & discharged home on ATD.
She again got admitted in hospital after 1 month due to continuous fever with anorexia. In view of persistent pyrexia, a possibility of infective endocarditis was thought as differential diagnosis and ECHO was done. ECHO reveals normal LV function with 16×10 mm vegetation on ATL, 16×11 mm vegetation in STL. (Figs A, B, C, D) Subsequent ECHO shows increase in vegetation size with severe low pressure TR. Patient was treated with IV antibiotics for 40 days but during this period she was having intermittent fever and also on repeat ECHO her vegetation size increased with severe TR. Her repeat blood C/S showed STAPH HEMOLYTICUS sensitive to Teicoplanin. She was transferred to other hospital where on PET Scan she was diagnosed to have Pulmonary Embolism (likely septic emboli in view of Tricuspid valve endocarditis). She came to our hospital once again for further evaluation.
At the time of her second admission, she was febrile, tachypneic, had tachycardia. On clinical examination she had pansystolic murmur of grade-III/VI at LLSB (4th to 5th ICS) & B/L coarse crepitations at basal regions of Lungs. During the course in our hospital, she was having intermittent fever, SOB, persistent dry cough. On ECHO
we re-confirmed the presence of vegetations on Tricuspid valve with endocarditis which did not even decrease in size with prolonged antibiotics treatment for last 2 months. In CT Pulmonary Angiography we found hypodense filling defect of Left Lower lobe pulmonary artery s/o Acute pulmonary thromboembolism (Fig E). In view of her worsening of symptoms, not responding to antibiotics, persistent vegetations & Acute pulmonary thrombo-
Fig A — Apical 4 Chamber View Showing Vegatation on ATL
Fig E — Showing Left Lower Lobe Pulmonary Artery Hypodense Filling Defect
Fig D — Basal Short Axis View Showing Vegatations
Fig C — Apical 4 Chamber View Showing Vegatation on ATL
Fig B — Apical 4 Chamber View Showing Vegatation on STL
Fig G & H — Tricuspid Valve Replacement
Fig F — Diseased Tricuspid Valve with Vegetation
Vol 122, No 10, October 2024Journal
embolism we discussed the case with CVTS as Heart team approach & offered her surgical intervention.
She had undergone Tricuspid valve replacement (29 mm Hancock Ii Bioprosthesis) and Pulmonary Thromboendarterectomy (Figs F, G, H). Tricuspid valve tissue culture reveals gram negative Klebsiella pneumoniae sensitive to Tigecycline & hence antibiotics regimen was changed. Post operative course was uneventful with gradual & complete recovery.
DISCUSSION
A rare condition, Tricuspid or Pulmonic valve infection makes up 5% to 10% of all cases of infective endocarditis3 Most often the Right Sided Infective Endocarditis (RSIE)(90%) involve the tricuspid valve4,5. RSIE is a rare phenomenon because there are fewer right-sided congenital heart diseases and rheumatic heart diseases than left-sided infective endocarditis, which is thought to be caused by low pressure and low oxygen saturation on the right chambers of the heart6. A right-sided cardiac anomaly, intravenous drug use, the presence of a Cardiac Implantable Electronic Device (CIED), and other intravascular devices are risk factors for RSIE7.
Native TVE in a young immunocompetent adult without risk factors or obvious endocarditis symptoms and signs is very unusual and rarely reported in case reports. RSIE usually presents with fever due to persistent bacteraemia, and septic emboli to the lungs. As a result of septic emboli to the lungs, the initial patient may complain of haemoptysis, coughing, or chest pains. In 80% of these cases, there are pulmonary events, which can range from small amounts of atelectasis in the basal pulmonary segments to large infiltrates, cavitations and exudative pleural effusion. When a patient has the “tricuspid syndrome,” which includes recurrent pulmonary events, anaemia, and microscopic hematuria8, clinical suspicion of TVE should be raised.
The two most crucial TVE diagnostic indicators are septic embolic phenomena, which our patient had and vegetation evidence on echocardiography. Due to low pressure in the right sided chambers, which allows the vegetation to grow large, TVE is more frequently found on the anterior leaflet of the Tricuspid valve. This vegetation is typically large (>20 mm). Vegetation size correlates with mortality. The high mobility of TVE vegetations accounts for the higher incidence of pulmonary embolism associated with this entity8,9. In between 5% and 16% of TVE cases, surgery is required, and the following circumstances should be taken into account : (1) incurable right-sided heart failure that does not improve with diuretics, (2) persistent bacteraemia in spite of receiving the proper
antimicrobial therapy, (3) large vegetation (>20 mm) that doesn’t get smaller despite getting embolized repeatedly., (4) fungal endocarditis, (5) concomitant left-sided IE and (7) prosthetic valve endocarditis 8,9. Valvectomy, valve replacement, or valve repair are the common surgical procedures performed for Tricuspid Valve Endocarditis.
CONCLUSION
Native Tricuspid Valve Endocarditis is rare in immunocompetent patients. The symptoms of native Tricuspid Valve Endocarditis mimic the symptoms of Lower Respiratory Tract Infection (Fever, Dyspnoea And Pulmonary Infiltration) making the diagnosis challenging. Our patient belongs to the subset of individuals without any predisposing factors. Therefore, even in cases of PUO who do not have any risk factors for TVE, there should be a high index of suspicion of the condition and Echocardiography should be performed as soon as possible to confirm the diagnosis. Patients with native valve infective Endocarditis and not responding to aggressive medical management should be subjected to surgical intervention.
Funding : None
REFERENCES
1Vanderschueren S, Knockaert D, Adriaenssens T, Demey W, Durnez A, Blockmans D, et al — From prolonged febrile illness to fever of unknown origin: The challenge continues. Arch Intern Med 2003; 163: 1033 41.
2Mir T, Dhobi GN, Koul AN, Saleh T — Clinical profile of classical fever of unknown origin (FUO). Caspian J Intern Med 2014; 5: 35-9.
4Akinosoglou K, Apostolakis E, Marangos M, Pasvol G — Native valve right sided infective endocarditis. European Journal of Internal Medicine 2013; 24(6): 510-9.
5Ortiz C, López J, García H — Clinical classification and prognosis of isolated right-sided infective endocarditis. Medicine 2014; 93(27): e137.
6Galal H, Rifaei O, Abdel Rahman M, El-Sayed H — Prevalence and characteristics of tricuspid valve endocarditis among patients presented to Ain Shams Hospital echocardiography lab; one year study. The Egyptian Heart Journal 2018; 70(2): 59-63.
7Raut N, Potdar A, Sharma S — Tricuspid valve endocarditis in non-drug abusers: a case series from India. Indian Heart Journal 2018; 70)(4): 476-81.
9Meel. Right-sided infective endocarditis secondary to intravenous drug abuse. Infective Endocarditis, 2019.
Brief Report
Current Conjunctivitis Epidemic in India — A Tale of Two Bugs
Nikunja Kumar Das1, Sadhana S Chate2, Sandhya S Kulkarni3, Gauri E Yadav4, Smita Anand Watwe5, Sumit Chavan4
The month of July saw unprecedented rainfall, floods in north India forcing a major disruption in peoples lives1. Many were left without shelter and were forced to live in relief camps. July also saw a large number of rising cases of Conjunctivitis in Delhi and adjacent states 2 Generally viral Conjunctivitis strives in these types of situations. Hospitals and OPDs were loaded with these patients. Adenovirus was detected after laboratory investigations was done 3. Viruses are responsible for causing more than 75 percent of infectious etiology of conjunctivitis4. It is estimated that up to 90 percent of viral infections are due to Adenovirus. A non-enveloped double stranded DNA virus5. The Adenovirus strains of 3, 4, 7 cause Pharyngoconjunctival fever. Adenovirus 8,19,37 cause Epidemic Keratoconjunctivitis. Month of July also saw rising cases of Conjunctivitis in most parts of Maharashtra. In Pune district there was an outbreak in Alandi region. Samples collected from National Institute of Virology, Pune detected Enteroviruses6. Enterovirus 70 and Coxsackie A24 are known and common causes of Acute Haemorrhagic Conjunctivitis. This is characterised by subconjunctival haemorrhage and also superficial punctate keratitis7. Although self-limiting, Conjunctivitis can be annoying and cause loss of man hours and in minority of cases lead to decrease of visual acuity and superadded bacterial infection. Fomites play a major role in transmission so proper precautions, isolation, hand hygiene, health education can play a huge role in mitigating the damage.
It is however unusual as two separate and unrelated viruses are causing this epidemic at the same time. Adenovirus being a double stranded DNA and Enteroviruses being single stranded positive sense RNA virus.
REFERENCES
1Vats V — Conjunctivitis and eye infection surge after heavy rainfall: Know symptoms, prevention tips, treatment and remedies. Available from https://www.ndtv.com/health/conjuctivitisand-eye-infection-cases-surge-after. Last assessed on 9.8.2023.
2Clarance D — Conjunctivitis cases on the rise: How does pink eye spread? Available from https://www.undiatoday.in/ health/story/conjunctivitis-cases-on-the-rise. Last assessed on 10.9.2023.
3AIIMS reporting 100 cases of acute conjunctivitis every day in Delhi: Doctors. Available from https://economictimes. indiatimes.com/news/india/aiims-reporting-100. Last assessed on 10.9.2023.
4Keen M, Thompson M — Treatment of Acute Conjunctivitis in the United States and Evidence of Antibiotic Overuse: Isolated Issue or a Systematic Problem? Ophthalmology 2017; 124(8): 1096-8.
5Azari AA, Barney NP — Conjunctivitis: a systematic review of diagnosis and treatment. JAMA 2013; 310(16): 1721-9.
6NIV finds enterovirus in samples of conjunctivitis-hit;Pune tally up to 14k. Available from https://timesofindia.indiatimes.com/ city/pune/niv-finds-enterovirus-in-samples-o. Last assessed on 10.8.2023.
Department of Microbiology, MIMER Medical College, Talegaon Dabhade, Pune, Maharashtra 410507
1MD, Associate Professor and Corresponding Author
2MD, Professor and Head
3MD, Professor and Principal 4MD, Assistant Professor
5MSc (Medical Microbiology), Assistant Professor
4MD, Assistant Professor
Received on : 10/08/2023
Accepted on : 26/08/2023
Letters to the Editor
[The Editor is not responsible for the views expressed by the correspondents]
Intravesical Knotting of an Infant Feeding Tube in a Child who Underwent Cardiac Surgery
SIR, — Infant feeding tubes are frequently used for urinary catheterization in neonates and infants undergoing cardiac surgery when it is not possible to catheterize with the smallest available Foleys catheter (6 no). Spontaneous knotting of the feeding tube is a rare complication and very few cases have been reported in literature. We report a case of spontaneous intravesical knotting of an infant feeding tube (size 5.0) in a child who underwent cardiac surgery. The feeding tube was gradually removed by careful and gradual manipulation under TIVA and local anaesthesia. The knot was found at the proximal end of the feeding tube. There was no haematuria or urethral bleeding and the child passed urine spontaneously 1 hr later.
CASE PRESENTATION
A 3-month-old 3.5 kg male child was taken up for surgical closure of VSD. After induction of Anaesthesia, since the urethral opening was small, urinary catheterisation was done with a 5.0 no. infant feeding tube. Intraoperative was uneventful and the child was extubated postoperatively in the PICU. On POD1, there was urinary leakage around the feeding tube suggesting a possible blockage and it was replaced with another same sized feeding tube. There were no urinary issues thereafter and all the routine postoperative investigations (CBC, RFT) were normal. On the following day, it was decided during the morning ICU rounds to deintensify further and remove all invasive lines and the urinary catheter. The feeding tube was gradually withdrawn when it got stuck in the urethra. With the assistance of the paediatric surgeon and under Total Intravenous Anaesthesia (Ketamine and midazolam) and local lignocaine application, the feeding tube was gradually manipulated and withdrawn completely. Inspection of the feeding tube revealed that the tip of the feeding tube had knotted (Fig 1) Intravenous analgesics were continued along with application of Lignocaine jelly on the urethral opening and a light dressing done. The child was monitored in the ICU for the next 48 hrs to rule out the possibility of urethral stricture or bleeding or urinary retention.
DISCUSSION
Urinary bladder catheterization is an essential and safe procedure performed during to paediatric cardiac surgery for haemodynamic assessment and monitoring prior to , during and post Cardiac bypass and postoperatively in ICU. Many paediatric cardiac centres use Feeding tubes as an alternative for urinary catheterisation in neonates and infants due to shortage of suitably sized Foleys catheter. Although these tubes are stiffer than the Foleys
catheters, blockage postoperatively can necessitate the need for frequent changing of the tube in the ICU. Intravesical knotting of catheters is rare with an incidence of 0.2 per 100000 mainly in male neonates1. Risk factors for knotting of the feeding tube are length of insertion, physical properties of the tubing, catheterisation technique and the patient’s anatomic characteristics. At birth, the length of a male urethra is about 5 cm and female urethra about 2.2 cm and the most common reported reasons for knotting are inserting the catheter > 10 cm and incorrectly inserting and improper external securing of the tube 2 Ideally the part inserted from the urethra should be kept as short as possible, sizing should be made beforehand, catheter should not be inserted further after observing urine flow and catheter should be tightly secured to prevent any further insertion. Several methods are available to remove a knotted catheter, including continuous gentle pulling under General anaesthesia, cystotomy or removal by endoscopy 3,4. The most common method is gentle but continuous retraction under General anaesthesia but with the risk of development of urethral trauma and later urethral stricture.
REFERENCES
1Anbu AT — Urethral catheter knotting in preterm neonates. Indian Pediatr 2004; 41: 631-2.
2Arena B, Mc Gillivray D, Doughty G — Urethral catheter knotting: Be aware and minimize risk. CJEM 2002; 4: 108-10.
3Lodha A, Ly L, Brindle M — Intraurethral knot in a very-lowbirth-weight infant: Radiological Recognition, surgical management and prevention. Paediatr Radiol 2005; 35: 713-6.
4Eric Mayer, Murali K Ankem, Victor H, Hartanto, Joseph G Barone — Management of Urethral catheter knot in a neonate. Can J Urol 2002; 9(5): 1649-50.
MBBS, DA, FCPS, DNB, PDCC Jeril George Kurien1 Consultant, Department of Paediatric Cardiac Sciences Sir HN Reliance Foundation Hospital, Mumbai, Maharashtra 400004
Fig 1 — Knotting of the Feeding tube
Is the Herbal Medicine in the Market Really Herbal? An opinion on Malpractices
SIR, — Medical science is stand on the base of patient diagnosis and treatment. Several countries have their own traditional medicine used from ancient times to diagnose and treat human beings. Majority of the traditional medicine are known as herbal medicine because they use natural products as raw materials to prepare various types of medicine like pills, powder, lotion, and many more1.
In last few years, people are moving from allopathy to herbal medicine for their treatment. The commonest alleged reason is the adverse effects or side effects of allopathic medicine because it prepares from synthetic components in various research laboratories and pharmacies. While herbal medicine prepares using plant and natural products and can be made at home but it is not completely true because people are not completely aware and educated about herbal medicine. They are believing in advertisements and unauthenticated results and reviews2
This herbal medicine is beneficial if it uses as per advice by clinicians, not by others. Nowadays we see some nonregistered local herbal medicine practitioners selling some powder or tablets in the name of herbal medicine. These powders contain high-dose of banned drugs, chemicals that give sudden relief from pain or a feeling of well-being. A few female patients we are seeing in our OPD, suffering from joints pain, taking some herbal powder for a few months and getting central obesity, red cheeks, moon facies, striae, high blood sugar levels, thinned-out skin, and other features of chronic steroid intake, suggesting that they are eating steroids in the name of some herbal powder. These fraud practitioners sell any kind of drug or material to earn money in name of herbal medicines. Patients are eating these unnamed products, thinking that herbal powders are free of side effects3
Patients getting deceived because these products not containing any herbal product. If it contains some, then the dose is inappropriate as it is not checked by any drug quality checking authority. Any kind of herbal or non-herbal medicine has some benefits and some side effects, so appropriate dose, and frequency are required for a particular illness. Although all kinds of herbal medicine are available in the market in the form of strips or powder in air-tight packing with preparation and quality control checks from a good pharmaceutical company, under the supervision of the AYUSH ministry, we can take on the prescription of a certified doctor, but some people still following the fraud practitioners for quick relief, unaware of lethal side effects4
Patients have to take precautions in the use of herbal medicine. Always check the product label the same as they checked before using other medicines for ingredients, formula, directions, side effects, and precautions. Always use drugs with and as per clinicians’ advice. Try to avoid the supplement for liver, heart, kidney disease, pregnant females, or children if it is not recommended for them. Self-medication is dangerous; however, whether it is herbal or not. Online purchasing of herbal medicine on the base of the advertisement has a risk of being unstandardized, faked, unauthorized, or unlicensed without a quality check. Various governing bodies like the Bureau of Indian Standards, Quality Control of India, and Pharmacopoeia Commission for Indian Medicine & Homoeopathy are available to approve the herbal medicine quality for human use5
As we conclude that every herbal is not herbal and safe. Avoid to taking the hidden risk for your life using unstandardized and unauthorized herbal medicine. Single non-judicial use of the medicine can harm your health and life.
REFERENCES
1Djordjevic SM— From Medicinal Plant Raw Material to Herbal Remedies [Internet]. Aromatic and Medicinal Plants - Back to Nature. InTech; 2017. Available from: http://dx.doi.org/10.5772/ 66618.
2Ekor M — The growing use of herbal medicines: issues relating to adverse reactions and challenges in monitoring safety. Front Pharmacol 2014; 4: 177. doi: 10.3389/fphar.2013.00177. PMID: 24454289; PMCID: PMC3887317.
3Ekor M — The growing use of herbal medicines: issues relating to adverse reactions and challenges in monitoring safety. Front Pharmacol 2014; 4: 177. doi: 10.3389/fphar.2013.00177. PMID: 24454289; PMCID: PMC3887317.
4Welz AN, Emberger-Klein A, Menrad K — Why people use herbal medicine: insights from a focus-group study in Germany. BMC Complement Altern Med 2018; 18: 92. https:/ /doi.org/10.1186/s12906-018-2160-6
5Alwhaibi M, Asser WM, A Al Aloola N, Alsalem N, Almomen A, Alhawassi TM — Evaluating the frequency, consumers’ motivation and perception of online medicinal, herbal, and health products purchase safety in Saudi Arabia. Saudi Pharm J 2021; 29(2): 166-72. doi: 10.1016/j.jsps.2020.12.017. Epub 2021 Jan 11. PMID: 33679178; PMCID: PMC7910136.
1MBBS, Postgraduate Resident, Harin Mahesh Bhavsar1 Department of Medicine, Lokesh Kumar1 DY Patil Medical College, Madhulika Mahashabde2 Maharashtra 411018 Yash Bhimani1 2MD (Medicine), Professor and Head Sahjid Mukhida3 3Postgraduate Resident, Department of Microbiology
Laparoscopic Repair of Symptomatic Direct Inguinal Hernia in an Apparently Healthy Boy
S IR , — Inguinal hernia is a common paediatric surgical problem and over 99% of them in children are indirect. The direct inguinal hernias are secondary to other diseases and it’s extremely rare in apparently healthy children1 . The incidence in fullterm babies is estimated at 1-5%, it is six times more common in boys, the right-sided hernias is more than three times that of leftsided hernias while the bilateral hernias are more common in premature infants2. A direct hernia involves herniation of intraabdominal content through a weakness in the posterior wall of the canal, known as Hesselbach’s triangle. A direct hernia is found medial to the inferior epigastric vessels, while an indirect hernia is found lateral to these vessels3
inguinal area
REFERENCES
A 5-yer-old boy has noticed a swelling in the right groin with a change in size with coughing or straining and it got painful at times especially during defecation and urination as he has chronic constipation in the background. On examination, the patient had reducible, non-tender, nontransilluminated, positive cough impulse, to get above the lump was not possible, was medial to the internal inguinal ring in the Hesselbach’s triangle and diagnosed as right direct inguinal hernia. Right testis was fully descended, of normal size, site, lie and texture. The silk glove sign was negative. At laparoscopy, the direct inguinal hernia defect could be seen in the Hesselbach’s triangle (Fig 1). Posterior wall repair and ligation of the hernial sac was performed. The patient was discharged home same evening and at follow up is well.
The advantages of the laparoscopic approach may include a lower risk of cord damage, less pain, better cosmetic results and less of postoperative complications. Our patient had congenital colo-rectal motility disorder and bowel dysfunction which is a known risk factor for the development of a hernia4
1Hutson JM, O’Brien M, Beasley SW, Teague WJ, King SK — Jones’ clinical paediatric surgery. 7th edn. Chichester: John Wiley & Sons, 2015. p. 332
2Weaver KL, Poola AS, Gould JL, Sharp SW, St Peter SD, Holcomb GW 3rd — The risk of developing a symptomatic inguinal hernia in children with an asymptomatic patent processus vaginalis. J Pediatr Surg 2017; 52(1): 60-4. doi: 10.1016/j.jpedsurg.2016.10.018
3Yeap E, Nataraja RM, Pacilli M — Inguinal hernias in children. AJGP 2020; 49(1-2): 38-42.
4Patel RV, Anthony FM, Govani ND, Govani DR, Panchasara N, Patel RR, Corracia R — Abdominal Wall Defects and Hernias-lessons learnt from observations rom the experimental fetal surgery gastroschisis model in rabbits and their clinical extrapolation. Medp Pediatr Child Health Care 2022; 1(1): mppchc-202201001, 2022, 1: 8-15 and Anthony FM, Govani D, Patel RR, Patel RV: Spontaneous regression of clinical inguinal hernias in preterm female infants-role of congenital secreto-motility disorders. Ped Surg Intl (in press, PESI-D21-00637)
Ramnik V Patel1, Rafael Cavalcante Correia2
1MB, MD (New York), MS, MCh, LLM, MNAMS, DNBS, DNBPS, FRCS (Ed), FRCS (Ped Surg), FEBPS, FACS, FAAP, DCH, DRCOG, Consultant, Department of Pediatric Surgery, PGICHR & KT Children Hospital, Rajkot, Gujarat 360001
2MD, Consultant, Department of Pediatric Surgery, Childrens, Hospital of the Sao Jose do Rio Preto Medical School, Santa Casa de Tatui General Hospital, Maneco Pereira Road, Tatui, Sao Paulo, Brazil
Fig 1 — Findings during laparoscopy of right direct inguinal hernia (A) The defect in the centre of Hesselbach’s triangle. (B) note that this image depicts a right direct inguinal hernia as the inferior epigastric vessels are lateral to it (to the right of the image in this view). (C) Closed deep inguinal ring on the right internal