First Break March 2024 - Reservoir Monitoring

Page 1

SPECIAL TOPIC

Reservoir Monitoring

EAGE NEWS Association launches New energies in America event INDUSTRY NEWS Norway announces APA 2023 winners

TECHNICAL ARTICLE Post-stack seismic inversion in Egypt’s Western Desert

VOLUME 42 I ISSUE 3 I MARCH 2024

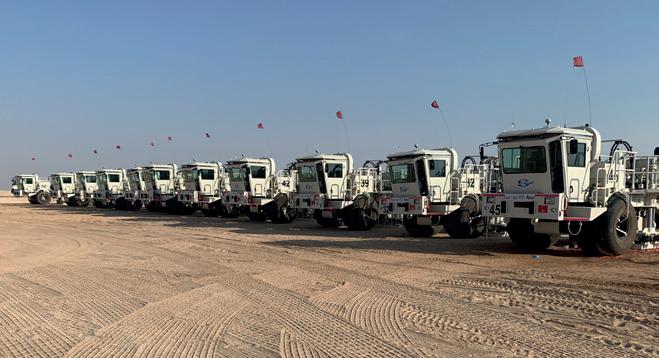
Discover Sercel Land Services

SOLVING COMPLEX CHALLENGES WITH TECHNOLOGY-DRIVEN EXPERTISE

Sercel specializes in solving the most complex operational challenges for seismic contractors and operators, ensuring that projects are completed on time, within budget, and according to technical specifications.

Trust us to streamline your operations, improve operational efficiency, and deliver unrivaled project success.

Explore our suite of land services:

• Train & launch

Start your project with confidence

• Asset optimization

Get the best from your equipment

• Operational excellence

Steer your crew performance

Nantes, France

sales.nantes@sercel.com

Houston, USA sales.houston@sercel.com

www.sercel.com

For more information

FIRST BREAK ®

An EAGE Publication

CHAIR EDITORIAL BOARD

Gwenola Michaud (gmichaud@gm-consult.it)

EDITOR

Damian Arnold (arnolddamian@googlemail.com)

MEMBERS, EDITORIAL BOARD

• Lodve Berre, Norwegian University of Science and Technology (lodve.berre@ntnu.no)

Philippe Caprioli, SLB (caprioli0@slb.com)

Satinder Chopra, SamiGeo (satinder.chopra@samigeo.com)

• Anthony Day, PGS (anthony.day@pgs.com)

• Peter Dromgoole, Retired Geophysicist (peterdromgoole@gmail.com)

• Kara English, University College Dublin (kara.english@ucd.ie)

• Stephen Hallinan, CGG (Stephen.Hallinan@CGG.com)

• Hamidreza Hamdi, University of Calgary (hhamdi@ucalgary.ca)

Clément Kostov, Freelance Geophysicist (cvkostov@icloud.com)

Martin Riviere, Retired Geophysicist (martinriviere@btinternet.com)

• Angelika-Maria Wulff, Consultant (gp.awulff@gmail.com)

EAGE EDITOR EMERITUS

Andrew McBarnet (andrew@andrewmcbarnet.com)

MEDIA PRODUCTION

Saskia Nota (firstbreakproduction@eage.org)

PRODUCTION ASSISTANT

Ivana Geurts (firstbreakproduction@eage.org)

ADVERTISING INQUIRIES corporaterelations@eage.org

EAGE EUROPE OFFICE

Kosterijland 48

3981 AJ Bunnik

The Netherlands +31 88 995 5055

• eage@eage.org www.eage.org

EAGE MIDDLE EAST OFFICE

EAGE Middle East FZ-LLC

Dubai Knowledge Village

Block 13 Office F-25 PO Box 501711

Dubai, United Arab Emirates

• +971 4 369 3897

• middle_east@eage.org

• www.eage.org

EAGE ASIA PACIFIC OFFICE

UOA Centre Office Suite 19-15-3A

No. 19, Jalan Pinang 50450 Kuala Lumpur Malaysia

• +60 3 272 201 40 asiapacific@eage.org

• www.eage.org

EAGE AMERICAS SAS

Av. 19 #114-65 - Office 205 Bogotá, Colombia

• +57 310 8610709

• +57 (601) 4232948

• americas@eage.org www.eage.org

EAGE MEMBERS CHANGE OF ADDRESS NOTIFICATION

Send to: EAGE Membership Dept at EAGE Office (address above)

FIRST BREAK ON THE WEB www.firstbreak.org

ISSN 0263-5046 (print) / ISSN 1365-2397 (online)

93

Editorial Contents

Technical Articles

31 Sand fairways delineation by post-stack seismic inversion and seismic wave form classification integration, Sitra Area, north Western Desert, Egypt

Ahmed H. Hafeez, Ahmed S. Abu-El Ata, Ashraf E. Ghonimi, Amir M. Lala and Ali M. Bakr

39 Mapping and detection of small-scale magnetic anomalies with shipborne vector magnetometer measurements. Case studies in the coastal shallow waters of the Bay of Brest and Iroise Sea (France) Jean-François Oehler, Guy Marquis, Verena Schifano, Hugo Reiller and Sylvain Lucas

Sp ecial Topic: Reservoir Monitoring

47 Monitoring CCS Projects: What is it going to take?

Tom Davis

55 Full elastic imaging – Shenzi Field, deep-water Gulf of Mexico

Allon Bartana, Jeff Codd and David Kessler, Joakim Blanch, Drew Eddy, Ramses Meza, Varendra Rambaran and J. P. Blangy and Yi Huang

65 Opportunistic 4D using a regional non-repeated 4D monitor, an Ærfugl case study D. Lecerf, S. Marinets, S. de Pierrepont, V. Zhelanov, A. Tantsereva, J. Oukili, R. Milne and A. Stav

71 Monitoring CO2 storage in the Morecambe depleted gas reservoirs through seafloor deformation and time-lapse gravimetry measurements

Filipe Borges, Helen Basford, Tom Calder, Martha Lien, Siri C. Vassvåg and Chris Ward

77 A distributed fibre-optic sensing monitoring platform for CCUS

Michael Mondanos, Pierpaolo Marchesini, Anna Stork, Carlos Maldaner, Garth Naldrett, and Thomas Coleman

85 A novel geophysical method to monitor ultra-shallow reservoirs: mapping of soil moisture content in subsiding peatlands to forecast drought effects and CO2 emissions Stefan Carpentier, Sjef Meekes, Arnoud Frumau, Manon Verberne, Thibault Candela and Kay Koster

93 Impact of effective pressure on acoustic impedance-velocity linear relationships: Ordovician Red River ‘C’ Zone reservoir, Williston Basin, USA Killian Ikwuakor

Special Feature

101 Minus CO2 Challenge 2023 – Student teams tackle load-balancing via compressed air and hydrogen storage in Carboniferous salt caverns: Cumberland County, Nova Scotia, Atlantic Canada Imad Smaini, Lucia Varela, Waithera Gakio, Vinicius Carneiro, Reem Al-Subaie, Helen Cen, Natasha MacAdam, Trevor Kelly, Fraser Keppie, Adam Macdonald, Maurice Dusseault, Grant Wach, Carla Skinner, Giancarlo Bernasconi, Antonia Hardwick, Karine Labatt, Roger Clark, Thomas Finkbeiner and Bill Richards

110 Calendar

cover: Optical fibres play a key role in projects featured this month.

FIRST BREAK I VOLUME 42 I MARCH 2024 1
3 EAGE News 17 Personal Record Interview — Eric Andersen 18 Monthly Update 20 Crosstalk 23 Industry News
Special Feature - Minus CO2 Challenge 2023

European Association of Geoscientists & Engineers

Board 2023-2024

Near Surface Geoscience Circle

Esther Bloem Chair

Andreas Aspmo Pfaffhuber Vice-Chair

Micki Allen Contact Officer EEGS/North America

Adam Booth Committee Member

Hongzhu Cai Liaison China

Deyan Draganov Technical Programme Officer

Wolfram Gödde Liaison First Break

Hamdan Ali Hamdan Liaison Middle East

Vladimir Ignatev Liaison CIS / North America

Musa Manzi Liaison Africa

Myrto Papadopoulou Young Professional Liaison

Catherine Truffert Industry Liaison

Mark Vardy Editor in Chief Near Surface Geophysics

Florina Tuluca Committee member

Oil & Gas Geoscience Circle

Yohaney Gomez Galarza Chair

Johannes Wendebourg Vice-Chair

Lucy Slater Immediate Past Chair

Erica Angerer Member

Wiebke Athmer Member

Tijmen Jan Moser Editor-in-Chief Geophysical Prospecting

Adeline Parent WGE & DET SIC liaison

Matteo Ravasi YP Liaison

Jonathan Redfern Editor-in-Chief Petroleum Geoscience

Aart-Jan van Wijngaarden Technical Programme Officer

Sustainable Energy Circle

Carla Martín-Clavé Chair

Giovanni Sosio Vice-Chair

SUBSCRIPTIONS

First Break is published monthly. It is free to EAGE members. The membership fee of EAGE is € 80.00 a year including First Break, EarthDoc (EAGE’s geoscience database), Learning Geoscience (EAGE’s Education website) and online access to a scientific journal.

Companies can subscribe to First Break via an institutional subscription. Every subscription includes a monthly hard copy and online access to the full First Break archive for the requested number of online users.

Orders for current subscriptions and back issues should be sent to First Break B.V., Journal Subscriptions, Kosterijland 48, 3981 AJ Bunnik, The Netherlands. Tel: +31 (0)88 9955055, E-mail: subscriptions@eage.org, www.firstbreak.org.

First Break is published by First Break B.V., The Netherlands. However, responsibility for the opinions given and the statements made rests with the authors.

COPYRIGHT & PHOTOCOPYING © 2024 EAGE

All rights reserved. First Break or any part thereof may not be reproduced, stored in a retrieval system, or transcribed in any form or by any means, electronically or mechanically, including photocopying and recording, without the prior written permission of the publisher.

PAPER

The publisher’s policy is to use acid-free permanent paper (TCF), to the draft standard ISO/DIS/9706, made from sustainable forests using chlorine-free pulp (Nordic-Swan standard).

2 FIRST BREAK I VOLUME 42 I MARCH 2024
Laura Valentina Socco Vice-President Edward Wiarda President Aart-Jan van Wijngaarden Technical Programme Officer Esther Bloem Chair Near Surface Geoscience Circle Maren Kleemeyer Education Officer Yohaney Gomez Galarza Chair Oil & Gas Geoscience Circle Carla Martín-Clavé Chair Sustainable Energy Circle Caroline Le Turdu Membership and Cooperation Officer Peter Rowbotham Publications Officer Pascal Breton Secretary-Treasurer

GET 2024 in Rotterdam to feature four key energy themes

EAGE’s fifth Global Energy Transition Conference & Exhibition (GET 2024) in Rotterdam from 4-7 November is to break new ground with the introduction of four dedicated sub-conferences highlighting key challenges facing the world’s future energy sector.

These specialised forums will focus on Offshore Wind Energy, Carbon Capture and Storage, Geothermal Energy, and Hydrogen and Energy Storage providing a crucial platform for addressing major issues and opportunities presented by the global energy transition. Showcasing the crucial role of geoscience and engineering expertise, the conference is intended to serve as a pivotal gathering for professionals involved in renewables, minerals,

Why GET matters

and decarbonisation technologies. It is an opportunity to share knowledge and foster collaboration in the drive towards the sustainable energy development the world is looking for.

The call for abstracts for GET 2024 is now open, inviting contributions to any of the four dynamic sub-conferences. In the Offshore Wind Energy conference, we are looking for insights on applying geoscience in the offshore wind sector, particularly focusing on, but not limited to, the contribution of subsurface disciplines in the development of wind farms. The Carbon Capture and Storage segment welcomes discussions on the latest progress in storage resources, alongside innovative approaches in reservoir management and risk assess-

Message from Marcel van Loon, CEO, EAGE Honoured guests, esteemed colleagues, and partners, I would like to welcome you to GET 2024 in Rotterdam with the ambition of shaping the future of energy.

A world as a better place for all is a mission that drives us to create a space where all professionals, geoscientists, and industry leaders can share their knowledge, accentuating the importance of sustainable energy sources and transitioning to low-carbon options.

As we strive to be a leading voice in the transition from oil and gas to green energy solutions, we recognise that this would

ment. The exploration and exploitation of Geothermal Energy, a field rich with potential, calls for insights into the variables influencing its success and sustainable growth. Complementing these, the rapidly advancing domain of Hydrogen and Energy Storage forum seeks contributions on the technological forefront of distributed renewable resources and the efficiency of energy storage systems.

Visit eageget.org for comprehensive information on the sub-conferences. Come join us for a rewarding experience in the vibrant city of Rotterdam on 4-7 November, where you can connect with peers, broaden your professional circle, and immerse yourself in the dynamic atmosphere of our event.

not be possible without you, our valued members. With your contributions, we will be connecting and sharing knowledge on key topics such as the use of innovative technologies, decarbonisation, renewables, and energy efficiency in support of climate action. We will also emphasise the contributions of subsurface professionals and their essential role in shaping the future of energy.

We aim to take this conference to the next level and make it a premier meeting space by expanding our programme and incorporating strategic and regulatory sessions. Besides informing you about advancements in the field, we want to give industries an opportunity to reach a vibrant audience.

On behalf of the entire team, we welcome you to enjoy this information-packed experience.

FIRST BREAK I VOLUME 42 I MARCH 2024 3
Geothermal in Ukraine 07 New
energies in America 10
16 HIGHLIGHTS
Oslo’s expanded Strategic Programme

See clearer, faster, with DUG MP-FWI Imaging

MPFWI DUG D U G M P F W I

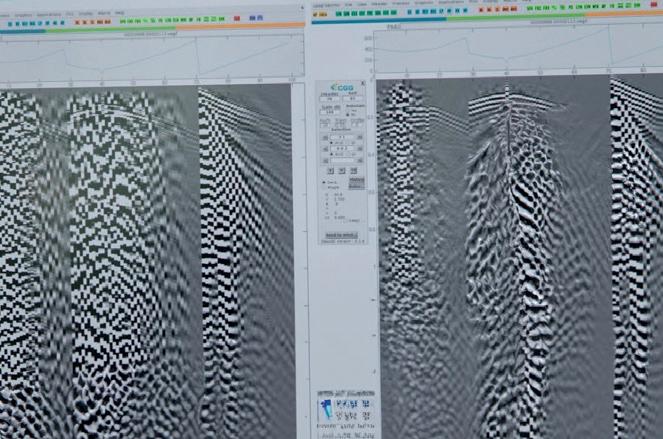
Focus on the results

CONVENTIONAL WORKFLOW

DUG MP-FWI IMAGING

The choice has never been clearer. Conventional processing and imaging can be a blur of time-consuming, subjective steps. DUG Multi-parameter FWI Imaging completely replaces the traditional workflow, delivering high-resolution reflectivity images for both structural and quantitative interpretation using field-data input. Focus on superior results, much sooner.

•ISO 27001• OC M PASSASSURANCESERV SEC •ISO 9001• OC M PASSASSURANCESERV SEC dug.com/fwi Let’s talk—contact info@dug.com
Data courtesy of AkerBP 110 Hz Data courtesy of Seismic Partners and Geoex MCG 60 Hz 40 Hz

Nothing like learning at your own pace

The evolution of the digital age has transformed the education landscape, providing unprecedented access to knowledge and learning resources. It makes self-pace learning a much more realistic prospect.

EAGE’s Self-Paced Courses capitalise on the flexibility they offer to participants. Learners can access pre-recorded lectures, study materials, quizzes, and exercises at any time and from anywhere, enabling them to strike a balance between their professional commitments and educational aspirations.

EAGE’s mission to deliver high-quality content is evident in the diverse range of courses available. From fundamental concepts to advanced topics, the courses cater

to professionals at different stages of their careers. The latest addition, ‘Near surface modelling for static corrections’ by instructor Ralph Bridle, provides insights into some techniques essential for geoscientists and engineers.

Bridle says: ‘In this class we are concerned with calculating a time correction for seismic reflection surveys as used in mineral and hydrocarbon exploration. For calculating time corrections for seismic reflection surveys, we are not so much interested in an exact model to image the near surface. Rather, the objective is a time shift to correct near-surface travel times, in order to eliminate false time structures, thereby avoiding the possibility of dry wells.

EAGE Online Education Calendar

The class will introduce the complexities of the near surface. Then it will describe the theories, assumptions, and shortcomings of some methods in modelling the near surface.’

EAGE Self-Paced Courses are crafted by industry experts and thought leaders, ensuring that participants receive instruction from the best in the field. For example, the ‘Carbonate reservoir characterization’ course by Dr Laura Galluccio offers a comprehensive exploration of one of the most challenging aspects of reservoir evaluation through the complexities of carbonate reservoirs with real-world examples and case studies.

Our courses are designed to be interactive, incorporating quizzes and exercises that allow participants to reinforce their understanding of the material. This handson approach ensures that learners acquire theoretical knowledge and practical skills that are immediately applicable in their professional endeavours.

In summary EAGE Self-Paced Courses herald a new era in geoscience and engineering education, providing professionals with the tools they need to stay competitive in a rapidly evolving industry.

6 FIRST BREAK I VOLUME 42 I MARCH 2024 EAGE NEWS
* EXTENSIVE SELF PACED MATERIALS AND INTERACTIVE SESSIONS WITH THE INSTRUCTORS: CHECK SCHEDULE OF EACH COURSE FOR DATES AND TIMES OF LIVE SESSIONS START AT ANY TIME VELOCITIES, IMAGING, AND WAVEFORM INVERSION - THE EVOLUTION OF CHARACTERIZING THE EARTH’S SUBSURFACE, BY I.F. JONES (ONLINE EET) SELF PACED COURSE 6 CHAPTERS OF 1 HR START AT ANY TIME GEOSTATISTICAL RESERVOIR MODELING, BY D. GRANA SELF PACED COURSE 8 CHAPTERS OF 1 HR START AT ANY TIME CARBONATE RESERVOIR CHARACTERIZATION, BY L. GALLUCIO SELF PACED COURSE 8 CHAPTERS OF 1 HR START AT ANY TIME NEAR SURFACE MODELING FOR STATIC CORRECTIONS, BY R. BRIDLE SELF PACED COURSE 9 CHAPTERS OF 1 HR 29 FEB11 APR NAVIGATING CAREER CHALLENGES AND OPPORTUNITIES OF THE ENERGY TRANSITION, BY E. BLOEM, L. LEVATO & G. MICHAUD EXTENSIVE ONLINE COURSE 24 HRS (INCL. 6 WEBINARS OF 2.5 HRS EACH) 12-14 MAR ROCK PHYSICS FOR QUANTITATIVE SEISMIC RESERVOIR CHARACTERIZATION INTERACTIVE ONLINE SHORT COURSE 9 HRS 14 MAR DLP WEBINAR ON TUNNEL SEISMICS FOR MINERAL EXPLORATION –IS IT WORTH THE EFFORT? DISTINGUISHED LECTURER WEBINAR 20 MIN + Q&A 18-21 MAR BOREHOLE SEISMIC FUNDAMENTALS AND INTRODUCTION TO ADVANCED TECHNIQUES INTERACTIVE ONLINE SHORT COURSE 16 HRS
Experience the intersection of flexibility and education with our Self-Paced Courses: learn from anywhere, at your own schedule.

Geothermal energy prospects in Ukraine discussed at LC London meeting

With their first evening lecture of the year in January, the EAGE Local Chapter London looked beyond borders and asked Taras Popadynets and Yuliia Demchuk - two Board members from the NGO Geothermal Ukraine - to lead a webinar on ‘Harnessing geothermal energy from mature oil and gas fields in the western Ukraine’. Geothermal energy can indeed play a crucial role in enhancing Ukraine’s energy generation: the country could reduce its reliance on imported fossil fuels and strengthen its energy security.

Yuliia Demchuk shared a general overview of the geothermal potential in Ukraine, the history of geothermal energy exploration in the region and types of geothermal energy sources that are available. She then provided a description of the 18 most prospective regions for geothermal development and their potential electrical power output. Three of them in particular - the Transcarpathian and Pre-Carpathian depression (West Ukraine), the Black Sea basin and Steppe Crimea (South) and Dnipro-Donetsk basin (East) which currently focus on oil and gas-bearinghave significant geothermal potential.

In the Transcarpathian depression, the geothermal gradient is 3.57–8.4°С/100 m and heat flow varies from 61.4 mW/m2 to 111-135 mW/m2. The temperature of underground water varies from 20 up to 70 C at the depth of 1 km and more than >150°C at the depth of 3 km. According to geological and geophysical data, at depths of up to 6 km, the temperature of rocks in the Transcarpathia region reaches 230–275ºС (an anomaly with a temperature of 210ºС was recorded at a depth of 4 km). The total national geothermal potential is estimated at 438*106 kWh/year and it is thought that geothermal energy production equivalent to 8,4 Mto is technically feasible and ccould save around 10 bcm of natural gas.

Taras Popadynets continued the presentation with an overview of the main models of using geothermal energy and opportunities for the oil and gas industry to repurpose abandoned and idle oil and gas wells into geothermal ones. 121 hydrocarbon fields were discovered in the Western

part of Ukraine, the vast majority of which were in the 1960-1980s and are still mature. There are about 5000 wells ranging from fully abandoned and plugged to orphan and idle. The existing fund of such wells makes it possible to consider this region for repurposing these wells into geothermal ones. This approach has not yet been implemented in Ukraine, so it is critically important to investigate feasibility, well screening criteria, inspections and rig logistics as well as global geothermal innovations.

The presentation was followed by a lively Q&A session and a recording will be available on the EAGE YouTube channel for those who missed the meeting. EAGE LC London acknowledges Yuliia Demchuk and Taras Papadyniets for sharing their expertise with the audience; Celina Giersz (Stryde), Lisl Lewis and Carrie Holloway (SLB) for hosting and moderating.

EAGE Ukraine Professional Development Fund

In addition to a special registration fee waiver programme, through which Ukrainian geoscientists and engineers are granted free access to EAGE conferences, workshops and courses, EAGE members continue to support their Ukrainian colleagues through a dedicated EAGE Ukraine Professional Development Fund.

All members can contribute to this initiative and every euro donated goes towards facilitating Ukrainian students and academic community, as well as professionals involved in career development activities aimed at Ukrainian students, such as mentoring, to attend the EAGE Annual Conference and other EAGE events.

Members who wish to make a donation, as well as Ukrainian colleagues who would like to take advantage of this programme, can read more at eagestudentfund.org or send a message to info@eagestudentfund.org.

Join us in making a difference! Your support can empower the next generation of geoscientists and engineers.

FIRST BREAK I VOLUME 42 I MARCH 2024 7 EAGE NEWS

Winners of 2023 Vlastislav C

ervený student competition announced

The Local Chapter EAGE Czech Republic last year organised the eleventh annual competition for the best Master and Bachelor thesis in theoretical and applied geophysics. Year 2023 was not only the most competitive and largest ever competition, it was also the first year dedicated to the memory of Prof Vlastislav Červený from Prague who passed away in 2022.

The renamed competition attracted a record number of submissions: seven Master and eight Bachelor theses from Polish, Czech, Hungarian and Swiss universities. All submitted works were excellent and the committee formed by representatives of Charles University and sponsors (main sponsor Gas Storage CZ, and sponsors Seismik, G Impuls Praha, Geophysical Institute of the Czech Academy of Science and EAGE PACE programme) were challenged when selecting the winners.

The MSc thesis category was won by Timothée Delcourt of ETH Zurich (advisor Prof Andrew Jackson, co-supervisor Dr Andreas Fichtner) with a submission entitled ‘Is there no free lunch in low dimensional parameter estimation?’. The commission commended the exhaustive approach to the evaluation of Bayesian methods applied to minimisation of rough multimodal functions, the innovative development of the likelihood-free algorithms, and not the least, the exceptional quality of presentation of the results.

The Batchelor thesis category was won by Patrick Pfammatter of ETH Zurich (advisor Dr Cedric Schmelzbach, additional supervisor Tjeerd Kiers) with his thesis on ‘Seismic tomography of an alpine landslide using distributed acoustic sensing (DAS)’. The judges commented on the highly the practical application of large dataset processing and new methods developed for DAS processing.

Additionally two honorary awards were presented to Barbora Marešová of Faculty of Science, Charles University for a Batchelor thesis on ‘Geophysical prospection of Early Medieval settlements’ (advisor Jan Valenta) appreciating her field work combined with application of geophysics to archaeology and to Zbyněk Fojt of Faculty of Science of Masaryk University for his MSc thesis on ‘Landslides near Semanín fault between Ústí nad Orlicí and Semanín’ noting the combination of extensive field work combined with detailed analysis of inputs, data processing and practical aspect of the work.

The prize money for the winners was CZK 25,000 (approximately €1000) and CZK 15,000 (approximately €600) for Masters and Bachelor categories, respectively. Both winners also received vouchers for EAGE online learning courses. Additionally, the winners and honorary awardees were accorded EAGE membership for 2024.

The goal of the competition is to encourage scientists from Central Europe to study and apply geophysics. Criteria for evaluation of submitted thesis are innovativeness, presentation of the results and applicability to industry. For more details see www.eagelc.cz. The year 2024 will bring another competition to be a nnounced.

8 FIRST BREAK I VOLUME 42 I MARCH 2024 EAGE NEWS
˘
Happy winner MSc student Timothée Delcourt of ETH Zurich with diploma being awarded by Gas Storage CZ representative Simona Hladíková. Award ceremony at the Innogy Congress Centre of the main sponsor Gas Storage CZ, Prague, Czech Republic.

Kuwait workshop to discuss advances in carbonate reservoirs

Join us and contribute to carbonates knowledge.

Exploring and developing carbonate reservoirs is very challenging due to their heterogeneous nature, diagenesis and the variability in porosity and permeability.

The First EAGE Workshop on Advances

in Carbonate Reservoirs from Prospects to Development taking place in Kuwait City from 23-25 April 2024 will focus on maximising the recovery from the existing mature fields and ensure the production sustainability. The programme will feature oral and poster presentations, keynote speeches, and core display.

Keynote speeches will include various topics including reducing risk in production, surface mud-logging, carbonate reservoir recovery, and natural gas pro-

Special offer available for active members of student chapters

For those of you who are students, here is an exclusive offer you won’t want to miss. We are giving away 15 complimentary memberships for aspiring student leaders who establish or revitalise their EAGE Student Chapter. This initiative is designed to empower students and foster a deep-seated interest in the realm of geoscience and engineering which our community represents.

To take advantage of the 15 complimentary EAGE memberships offered by the EAGE Student Fund, the Student Chapter’s President must apply on https:// eage.org/students/establish-your-student-chapter/. Shortly after, a special code will be generated to be used by the rest of Students Chapter members on their own application.

If you are not part of an EAGE Student Chapter, don’t freit, as you can make the most of our first year complimentary

membership. This is exclusive for our first time EAGE Students up to the age of 29.

Some of the benefits of joining the EAGE Student Community:

Networking Opportunities: Connect with industry professionals, peers, and renowned experts at EAGE events, fostering invaluable connections for your future career.

Access to latest research and innovation: Stay informed about the latest developments in geoscience and engineering through exclusive access to EAGE’s extensive database of research papers, articles, and publications.

Professional Development: Hone your skills and gain a competitive edge in the industry by participating in workshops, training sessions, and conferences organised by EAGE.

duction. The core display will show the Albian Mauddud Formation from Greater Burgan area in Kuwait to demonstrate the vertical trends in depositional facies within the stratigraphic sequence.

Register before 10 March with the early bird rate and join the discussions on this increasingly intriguing topic in the energy resource arena.

to attend conferences, broaden your knowledge and enhance your professional network.

Global Exposure: Engage with a diverse, global community, gaining insights into different cultures, practices, and perspectives within the field.

Financial Support: Take advantage of scholarships, grants, and special discounts

Your geoscience journey awaits. Join EAGE and seize the opportunity to be part of a community that not only supports your academic and professional growth but also contributes to the collective advance of our geoscience and engineering disciplines.

FIRST BREAK I VOLUME 42 I MARCH 2024 9 EAGE NEWS 8 MAR EAGE ONLINE GEOQUIZ: REGISTRATION OPEN ONLINE 22 MAR LAURIE DAKE CHALLENGE 2024: SECOND SUBMISSION ONLINE 28 MAR EAGE STUDENT WEBINAR ON ENERGY TRANSITION ONLINE EAGE Student Calendar FOR MORE INFORMATION AND REGISTRATION PLEASE CHECK THE STUDENT SECTION AT WWW.EAGE.ORG.

EAGE unveils inaugural symposium on geosciences for new energies in America

The First EAGE Symposium and Exhibition on Geosciences for New Energies in America is set to take place in Mexico City during the second semester of 2024. This ground-breaking event will encompass dedicated sessions on key topics, including geothermal energy, CCS, water management (with a focus on water footprint), and the increasingly significant role of mineral exploration.

Participants can look forward to engaging in discussions, research presentations, and networking opportunities with leading experts and practitioners in the field. Moreover, we are excited to announce additional side event activities, such as short courses and an interesting field trip, which promise to enhance the overall symposium experience.

The symposium will also offer valuable exhibition opportunities for companies operating within the geosciences and renewable energy sectors. The exhibition space will serve as a hub for companies to demonstrate their

contributions to advancing the field and promoting sustainable energy solutions in the Americas.

This event represents a significant moment in the journey towards a sustainable and resilient energy future. We invite you to be a part of the experience. Save

the date and join us in Mexico City for an event intended to help shape the energy landscape for generations to come.

Kuala Lumpur workshop to continue conversation on subsurface issues in reservoir characterisation

Building on the success of its inaugural edition, EAGE is gearing up for the 2nd EAGE Workshop on Integrated Subsurface Characterisation and Modelling happening from 12-13 November 2024 in Kuala Lumpur, Malaysia.

The two-day workshop will focus on state-of-the-art subsurface characterisation and modelling along with innovative solutions from digital proliferations with an emphasis on geological science to improve recovery, find new opportunities, and also address CCUS excellence. The event will also cover the integration of core principles of geoscience and engineering analysis coupled with faster computing techniques to develop more predictive reservoir models through multi-disciplinary studies and case histories.

The workshop will be a great opportunity to hear and connect with key operators, host authorities, as well as service and industry analysts from the region. To exchange valuable and actionable insights, the technical programme will be built on key topics such as Reservoir characterisation, optimisation to add value; Geophysical solutions in subsurface reservoir characterisation; Innovative reservoir modelling; Geomodelling for carbon capture utilisation and storage (CCUS); and Improved recovery and uncertainty management. Abstract submissions are welcome until 31 May 2024.

10 FIRST BREAK I VOLUME 42 I MARCH 2024 EAGE NEWS
Sunset in Mexico City.

Relevance of East Mediterranean energy resources evident at Athens workshop

The recently concluded 4th Eastern Mediterranean Workshop (4-6 December 2023) was a dynamic showcase of innovation and collaboration in the energy sector. This is the report.

Over two days, participants attended a highly engaging technical programme of more than 30 technical oral and poster presentations that underscored the immense opportunities and urgency in the realms of gas discovery, renewable energy, and CCUS in the Eastern Mediterranean region.

Jason Robinson, director of business development at TGS and technical committee chair, noted that the technical and commercial quality of papers and their presentation impressed and conveyed the sense of opportunity and urgency for the discovery of gas and the development of renewables and CCUS and that the presence and level of activity of two IOCs and a robust Greek presence reinforced the commitment to the region’s energy future.

Aristofanis Stefatos, technical committee chair and CEO of Hellenic Hydrocarbons and Energy Resources Management (HEREMA), said: ‘During the workshop representatives from industry, academia, state authorities and research institutes, presented the latest progress on their work and reiterated a clear message that exploration efforts in the East Med continue at steady pace to provide the much-needed bridge fuel for the energy transition, close to the European markets. The technical programme was enriched by a number of interesting talks on technologies aligned with the energy transition, like CCS, geothermal, CPG and offshore wind, which made it clear that the geoscience and engineering community will continue to play a critical role in delivering the energy transition with success.’

The workshop fostered high levels of engagement and lively discussions across all topics, promoting knowledge exchange and key connections among professionals. Mark Hamilton, principal geoscientist in PGS and technical committee member, who also contributed to the technical programme with a keynote presentation on complex geology, commented: ‘The event

proved to be an excellent opportunity for in-person engagement with experts in the field, several of whom I had previously interacted with only in virtual settings. The workshop was productive, providing a platform for sharing experiences, understanding challenges, and being encouraged by successful case studies centered on the Eastern Mediterranean.’

The choice of Athens as the workshop’s backdrop facilitated not only valuable insights but also a topical field trip to the Revithoussa Liquified Natural Gas Terminal, managed and operated by DESFA (the national natural gas system

success stories, such as the one shared by Diogenes Angelidis, director general, Cyprus Hydrocarbons. His compelling keynote presentation described the accomplished and ongoing exploration successes in Cyprus, adding depth to the discourse.

Essential to paving the way for sustained achievements is the exchange of knowledge and cooperation among stakeholders, and the promotion of future collaborations. Behzad Alaei, co-founder and chief product officer, Earth Science Analytics, underscored the significance of utilising comprehensive data for making informed, data-driven decisions and

operator). While circumnavigating the island, workshop attendees could develop a deeper understanding of DESFA daily operations and logistics, a rare glimpse into a world not usually accessible. The facility provides increased operational flexibility in the transmission system and enhanced capability to meet peak gas demand. Its importance has been further highlighted by the recent energy crisis, a period in which it proved instrumental in securing gas supply and driving energy diversification efforts in Greece and across Southeast Europe as a whole.

The workshop showcased the enduring potential of energy in the Eastern Mediterranean, highlighted by impactful

employing transfer learning to facilitate the journey toward energy transition.

The workshop also drew inspiration from positive stories outside the Eastern Mediterranean. For example, Kostantinos Makrygiannis from KUFPEC, provided industry insights on the role of carbon capture and storage in Norway’s energy strategy. Overall, the event showcased the scientific strides and collaborative efforts propelling the Eastern Mediterranean towards a sustainable energy future.

Anticipation is already building to witness the outcomes of these discussions, which will be revealed at the upcoming 2025 edition of the EAGE Eastern Mediterranean Workshop.

FIRST BREAK I VOLUME 42 I MARCH 2024 11 EAGE NEWS
WORKSHOP REPORT
Delegates circumnavigating by boat the Revithoussa Island, where the Liquified Natural Gas Terminal is located.

Latest borehole geology meeting marks progress in discipline

Israa S. Abu-Mahfouz (King Fahd University of Petroleum and Minerals) and Mohammed Al-Fahmi (Saudi Aramco) report on the EAGE 5th Borehole Geology Workshop, held on 21-23 November 2023, in Dhahran.

Borehole geology, which has advanced rapidly in the past few decades, stands as a fundamental discipline, serving as the foundation for numerous global industries, including energy, mining, CCUS, and environmental sectors.

The workshop provided a platform for professionals in the field to explore and discuss the latest advancements in borehole geology. Spanning three days it covered a wide range of topics and sessions, including sedimentology, structural geology, reservoir architecture, well operations, data science, and unconventional reservoirs.

The workshop reflected on the incredible success of the previous four workshops held in 2015, 2017, 2019, and 2021 and was well attended by more than 55 geology, geophysics, and engineering professionals. This 5th edition delved deeper into the details of borehole geology, fostering best practices and identifying new avenues for collaboration and innovation. It particularly emphasised best practices and identified frontiers of geoscience and technology to improve transforming 1D borehole data to 3D earth digital models.

Throughout the workshop, participants who came from industry (Saudi

Aramco, Baker Hughes, Halliburton, SLB, Weatherford, ENI, NiMBUC Geoscience, and Eriksfiord) and academia (KFUPM) provided an environment of active engagement, where discussions and collaborations flourished, could lead to transformative advancements in borehole geology.

The workshop kicked off with an exciting geological field trip to the Dammam Dome exposed at King Fahd University of Petroleum and Minerals. Participants had the opportunity to explore the Lower and Middle members of the Rus Formation, examining fascinating geological features such as calcite geoids and fractured rocks. This provided valuable insights into the subsurface geology of the Dome, including the impact of regional doming and karstification. The trip also included a visit to another outcrop in Dhahran and allowed the examination of the Dammam Formation, which showcased its unique fossilised nature and the presence of gypsum within the strata.

The second half of the day featured a core workshop, where participants had the chance to analyse and discuss cores from the Jurassic Arab D reservoir. Divided into five groups, each group conducted a comprehensive logging and geological description exercise for their assigned core. Led by Abdulkareem Roudhan and co-chair M. Al-Fahmi, the groups engaged in stimulating discussions, sharing their findings and insights. This core workshop further enhanced participants’ understanding of borehole geology and enabled them to integrate multiple disciplines and study backgrounds.

Overall, the field trip and core workshop on the first day of the workshop provided participants with hands-on experiences and in-depth knowledge of geological features and processes. It set the stage for the following days of the workshop, where further technical sessions and discussions would take place,

on potential advancements in the field of borehole geology.

The second day of the workshop featured a diverse array of technical sessions, each offering unique insights and innovations in the field of borehole geology. The day began with a welcome note by co-chair I. Abu-Mahfouz. Professor Ruud Weijemars of KFUPM delivered an illuminating keynote on the interplay between geoscientific characterisation and geomechanical engineering. The day also included sessions on sedimentology, structural geology, reservoir architecture, well operations, data science and status of machine learning techniques applied to borehole imaging and other well data such as cuttings, acoustic and drilling data. Notable presentations involved discussions on fracture characterisation (Berto et al.), reservoir fracture detection (Al-Fahmi et al.), pore system characterization (Belayneh et al., Alroudhan), LWD imaging (Taher and Fouda, Otaibi et al., Elkhamry et al.), temperature gradients in carbonate reservoirs (Ciuperca et al.), and data science (Afifi and Anifowose, Shrivastava et al.). The day concluded with animated discussions among experts and attendees, exploring the implications of showcased advancements in borehole geology.

12 FIRST BREAK I VOLUME 42 I MARCH 2024 EAGE NEWS
WORKSHOP REPORT
Participants examined fascinating geological features such as calcite geoids and fractured rocks. Participants analysed and discussed cores from the Jurassic Arab D reservoir.

The final day of the workshop began with a welcome note by co-chair M. Al-Fahmi and a keynote address on borehole fluid characterisation by Dr Khaled R. Arouri of Saudi Aramco. The day included sessions on data science (Cozzi et al.), carbon capture utilisation and storage (CCUS) (Uhrin et al.), and geothermal energy (Abu-Mahfouz et al.). Presentations covered topics such as digital core modelling (Cozzi et al., Abdulmohsen et al., Santoso et al., Chinellato et al.), wellbore failure modes and automated interpretation in borehole geology (Bender et al.), and the use of machine learning in mapping subsurface channel features (Aljishi).

Aljishi mainly presented ML techniques to optimise the outcome of seismic data and to speed up interpretation workflows. The technical sessions provided valuable insights into progress in data science and their applications in borehole geology. The day concluded with a discussion led by the workshop’s co-chairs and attendees, on future directions for advancements in the field. Main takeaways from the workshop include that borehole geology is a fundamental discipline for numerous global industries, and new cutting-edge methodologies and technological applications across various topics and best practices can improve

transformation of 1D borehole data to 3D earth digital models.

In conclusion, the workshop provided a wealth of knowledge and insights into the latest developments in borehole geology. Participants had the opportunity to engage with experts in the field, explore various technical sessions, and gain a deeper understanding of sedimentology, reservoir architecture, well operations, data science, and unconventional reservoirs.

We extend our gratitude to the organizers, speakers, and attendees for their valuable contributions and participation in the workshop.

Geophysical Prospecting Special Issue targets mineral exploration modelling

and interpretation

A Call for Papers has been announced for an upcoming Geophysical Prospecting (GP) Special Issue on ‘Advances in geophysical modelling and interpretation for mineral exploration’.

Contributions are being invited that focus on advanced methods of modelling and interpretation of geophysical data for mineral resource exploration. Of particular interest are cutting-edge technologies and methodologies that support the study of intervals at depths of burial that are relevant to exploration (for shallow and deeper targets).

A key objective is to demonstrate the value of integration of various geophysical tools, including electrical (DC) resistivity and induced polarisation (IP) methods, electromagnetic induction, as well as gravity, magnetic, and seismic exploration methods. Such integration is often associated with achieving a more holistic and better understanding of subsurface geology. Papers that demonstrate improvements in high-resolution subsurface imaging beyond traditional exploration limits and provide

detailed insights into geological structures and properties would be particularly welcome. The exploration objective is to seek a more comprehensive understanding of subsurface conditions to minimise risks associated with drilling operations, ensuring safer and more efficient resource extraction.

The application of artificial intelligence (AI) and machine learning (ML) will also be of interest for its potential role in enhancing geophysical interpretation and integrating geophysical data. The Special Issue is also expected to include practical case studies demonstrating the real-world application of geophysics in mineral resource exploration, mining geophysics, and other relevant fields.

We encourage the submission of papers covering different topics, from pure, fundamental research to more applied demonstrations and integrated case studies, including: Modelling and inversion of electrical and electromagnetic geophysical data; Gravity and magnetic data interpretation; Seismic methods in subsurface exploration; Integrated geophysical investigation: modelling and joint inversion; Application of AI/ML in geophysical interpretation; and Case studies on mineral exploration and mining geophysics, etc.

Submissions

Submissions start on 1 March 2024 with a deadline of 30 September 2024. Final notifications of acceptance/rejection will follow starting on 1 October 2024. We intend to disseminate final decisions by December 2024 and publish selected articles shortly afterwards.

All manuscripts will be peer-reviewed in accordance with the journal’s established policies and procedures. The final selection of papers will be based on the peer review process as well as

FIRST BREAK I VOLUME 42 I MARCH 2024 13 EAGE NEWS

reviews by guest editors and the chief editor.

Manuscripts should be prepared according to the author guidelines detailed on the GP website and submitted using the online submission webpage https://wiley. atyponrex.com/journal/GPR taking care on the online submission form to select the drop-down menu for the Special Issue: ‘Advances in Geophysical Modeling and Interpretation for Mineral Exploration’. It is very important to clearly indicate in a cover letter that the manuscript is submitted to this Special Issue and notify the lead guest editor, Dr Arkoprovo Biswas (arkoprovo@gmail.com).

There are no publication fees, page limits, or charges for colour figures. Geophysical Prospecting also offers various options for open-access publication.

Lead guest editor for this Special Issue is Dr Arkoprovo Biswas (assistant professor, Department of Geology, Institute of Science, Banaras Hindu University, India) with guest associate editors: Prof Roman Pašteka (Department of Engineering Geology, Hydrogeology and Applied Geophysics, Faculty of Natural Sciences, Comenius University, Slovak Republic), Prof Michael S. Zhdanov (University of Utah, director of CEMI), Dr Anand Singh (Department of Earth Sciences, Indian Institute of Technology Bombay, India), Prof Yunus Levent Ekinci (Department of Archaeology, Faculty of Arts and Sciences, Bitlis Eren University, Turkey), and Prof Çağlayan Balkaya (Department of Geophysical Engineering, Süleyman Demirel University, Turkey).

EAGE and SUT to hold workshop on Asia Pacific windfarm development

The challenges of offshore wind far development in the Asia Pacific region will be the focus of the 1st EAGE/SUT Workshop on Integrated Site Characterisation for Offshore Wind in Asia Pacific on 14-15 August in Perth, Australia.

The event is part of the effort to increase the understanding between the geotechnical engineers and the geoscientists in site investigation for offshore wind farms launched by EAGE and SUT (the Society for Underwater Technology) via its interest group on Offshore Site Investigation and Geotechnics –OSIG.

The workshop promises a holistic approach, combining technical insights

with non-technical considerations, ensuring a well-rounded understanding of offshore wind projects. Join us on what should be an enlightening journey to unravel the complexities of site characterisation and lay the foundation for a sustainable offshore wind future.

Main topics to be covered include: Regulatory considerations; Site characterisation; Foundation construction; Design, Installation and monitoring; and Power cable construction, design, installation and monitoring. We welcome abstract submissions for these topics until 31 March 2024.

Geophysical Prospecting (GP) publishes primary research on the science of geophysics as it applies to the exploration, evaluation and extraction of earth resources. Drawing heavily on contributions from researchers in the oil and mineral exploration industries, the journal has a very practical slant. A new edition (Volume 72, Issue 3) will be published within March, featuring 20 articles.

Editor’s Choice articles:

• Performance of old and new masslumped triangular finite elements for wavefield modelling — Wim A. Mulder

• Time-lapse applications of the Marchenko method on the Troll field — Johno van IJsseldijk et al.

14 FIRST BREAK I VOLUME 42 I MARCH 2024 EAGE NEWS
CHECK OUT THE LATEST GP OUR JOURNALS THIS MONTH

Artificial intelligence Community has a programme for you in Oslo

Calling technology enthusiasts worldwide! Our EAGE Artificial Intelligence Technical Community is preparing something special for the upcoming Annual Conference in Oslo.

For a start, on Sunday 9 June and Monday 10 June there is the hackathon entitled ‘Coding to Net-Zero: AI for energy-efficient future’. It will challenge you to optimise existing energy industry workflows to be more effective while using less computational footprint.

AI Committee members Oleg Ovcharenko and Nicole Grobys explain the rationale: ‘Driving the energy transition is one of the major tasks of geoscience and engineering now. With the hackathon, we aim to provide a space where participants can re-think energy efficiency and deliver data-driven insights for energy transformation topics through application of AI’.

During the challenge, participants will have access to a curated set of machine learning tools, datasets and computation resources to help implement their ideas. In addition, they will get the opportunity to meet new people and learn new skills. The hackathon is not just for professionals or for students, but for all who have a passion about technology and sustainability. If you are up for the challenge, sign up as a team with your colleagues, or participate individually and form a team at the event. Winning solutions will receive great prizes and have the chance to present to a broader audience during the week.

Not sure this is something for you? The hackathon facilitators plan an online meeting about one month before the event to answer questions and start brainstorming about project ideas. That could also be a great moment to form or join teams, and to get to know your future teammates.

For all who would like to have a short break from heavy science but still want to learn something, how about the special session ‘Tips and tricks with ChatGPT for geoscientists and engineers’? The activity, led by Ashley Russell, will offer you the chance to familiarise yourself with large language models and other terminology, as well as with the minimum you need to know to use ChatGPT safely and effectively. You’ll also explore videos and demos of tricks you can take advantage of, such as creating structured data tables from unstructured text. ‘With this session,’ says Grobys, ‘we aimed to have

a lighter format for everybody without prior knowledge. It nicely compliments the deep dive workshop at the end of the week.’

Before you wave goodbye to Oslo, on Friday 14 June, the AI Community invites you to take part in a workshop on ‘Deep dive into GenAI and large language models (LLMs) for subsurface applications’. According to workshop convenors, Lukas Mosser and George Ghon, ‘Generative AI systems like ChatGPT have taken the world by storm. It is clear that there will be enormous potential for geoscience applications. The workshop aims to lift the veil on the technology and bring us closer to adoption’.

There will be a series of talks covering the basics of natural language processing (NLP), the transformer models architecture, as well as examples of where generative models have delivered promising results on tasks related to geosciences. The AI Community will also be introducing a toolkit to train LLMs on custom datasets and providing a hands-on lab session to show a path to building web applications. A panel discussion will sum up the learnings, discuss potential pitfalls and ethical dilemmas, and provide an outlook that balances opportunities and risks in modern AI applications. If you are a subsurface domain specialist or a generalist with a basic understanding of machine learning and data driven applications, you should add Friday 14 June to your agenda.

Check out more details and sign up at www.eageannual.org. Opting in for an All Access Pass registration, you can participate in the hackathon, together with a workshop, field trip or short course of choice, and save on your attendance.

Many thanks for your donation in advance!

FIRST BREAK I VOLUME 42 I MARCH 2024 15 EAGE NEWS
The EAGE Student Fund supports student activities that help students bridge the gap between university and professional environments. This is only possible with the support from the EAGE community. If you want to support the next generation of geoscientists and engineers, go to donate.eagestudentfund.org or simply scan the QR code.
DONATE TODAY!
Participants in the 2023 Hackathon in Vienna.

EAGE Oslo Annual Strategic Programme to

be more extensive than ever

Building on last year’s success in Vienna, the Strategic Programme for this year’s Annual Conference is more comprehensive than ever. Spread over four days, eight complimentary topics will bring together experts and thought leaders to address major current issues under the event’s overall theme of ‘Technology and talent for a secure and sustainable energy future’.

Alongside our enriching Strategic Programme discussions, we have witnessed a notable increase in abstract submissions, reaching 1,700. This marks a strong interest from the academic and professional community, guaranteeing a selection of high-quality papers that cover well-represented topics. This achievement is unique compared to last year in Vienna, ensuring that delegates will experience a conference of unparalleled quality. Following this significant increase in submissions, attendees can look forward to an exceptional technical and strategic programme.

Moreover, this year’s range of speakers and moderators in the Strategic Programme will also serve as a differential, with professionals with extensive overviews in engineering and geoscience. Their expertise and insight promise to elevate the discussions, moving beyond the theoretical to address the practical challenges and opportunities that lie ahead. This gathering of thought leaders, from industry experts to regulatory visionaries and academic pioneers, offers an unparalleled opportunity to

glean insights from the forefront of energy innovation and strategy.

This is what you can look forward to in the Strategic Programme:

NCS Leadership Interview: We will kick off with a focus on the Norwegian Continental Shelf (NCS), a leading energy hub. The discussion with Equinor CEO, Anders Opedal, will focus on how the region is pioneering new technologies in renewables and decarbonisation, shaping the future of energy.

Tackling energy poverty in the trilemma: The panel will review the global perspective on the energy transition and how to balance sustainable energy production, societal needs, and economic growth, especially in developing regions.

Exploration strategies in the energy transition: As the energy landscape evolves, this segment will delve into the diverse exploration strategies of leading companies, addressing how they are adapting and evolving in the face of external pressures and changing business models.

Transformation from O&G province to broader energy super basin: The North Sea’s transformation will be a key highlight, showcasing its shift from a traditional oil and gas basin to a leading region in renewables, CO2 storage, and hydrogen production.

The role of geoscience in transforming the global energy system: This session will explore the continuing role of geoscience in the global energy landscape offering insights into research and technology developments in this field.

The future of geoscience technology development: The focus here is on the latest technological innovations in geoscience discussing emerging sensor technologies, digitalisation, and sustainability, highlighting the importance of inter-disciplinary collaboration.

State of international exploration: This session will provide a comprehensive overview of the current state of international exploration with insights from leading industry experts.

Future-proofing energy: Empowering diverse talent in a tech-driven world (supported by the EAGE Women in Geoscience and Engineering Community): Reflecting the conference’s core theme, this discussion will spotlight the role of diverse talent in driving sustainable practices and technological innovations, underscoring the need for varied perspectives in technology and sustainability.

Attracting and retaining talent: New technologies and different areas of applications are triggering the interest of the young professionals for the energy industry. This session, jointly organised with the EAGE Young Professionals Community, will focus on the careers of professionals who are today working in new energy domains to inspire younger professionals and students to join the industry.

Stay tuned for more updates on the programme and additional details on www.eageannual.org.

16 FIRST BREAK I VOLUME 42 I MARCH 2024 EAGE NEWS
Panel session in Vienna. Leadership interview in Vienna with Berislav Gašo, EVP Energy at OMV.

Personal Record Interview

A geoscientist’s tale of the unexpected

Eric Andersen could never have anticipated he would end up in Malaysia as head of geoscience solutions with Petronas. Brought up in Calgary by parents originally from Denmark, geophysics wasn’t even his first interest. Once he changed course, a career followed, mainly focused on QI/seismic interpretation with Canadian service companies, before the unexpected move to SE Asia.

Émigré parents

I was born in Canada to parents who emigrated from Denmark. The thing about people who make drastic life changes is that they must effectively start from scratch. Nothing is given. Hard work and reassembling the pieces of your life provide opportunities.

Degree job challenge

Growing up in Calgary, I had no fixed plan for my future. I took odd jobs, made some money, and eventually ended up at the University of Alberta. I took classes that interested me, never really thinking about a career.

Finding a job with a BSc in Applied Mathematics was not easy. In my search at the university manpower office, I came across a position for a wireline engineer. The requirements were: an engineering degree, a Class 3 driver’s licence for operating large trucks, willingness to work in remote locations and some knowledge of explosives. It seemed interesting, so I applied. To my surprise, I got an interview. There was much conversation about the role, expectations and opportunities. I thought it was going quite well, until one of the interviewers asked me ‘If you could work anywhere in Canada, where would you like to work?’. My answer was Vancouver. He pointed out, ‘There is no oil patch in Vancouver’. The interview ended shortly after, with no job offer. A few months later, the same company called me for another interview. This time, I knew all the answers. ‘I love northern Canada, mosquitoes, living in camps… ’. I got the job.

It took me a couple years to realise I was not cut out for working heavy steel in freezing winters. I resigned, recalling that while doing my math degree, some others were studying something called geophysics and getting office jobs. So I returned to school, picked up the required geology classes and finished with a degree in geophysics.

Move to geoscience/QI

After graduation, I got a job as a QI geoscientist at a company called Veritas Seismic. Since the company was quite modest at the time, we got involved with everything from seismic acquisition to processing to QI/Interpretation. Calgary then was the hotbed of QI technology. Dan Hampson, Brian Russell, Bill Goodway, and Satinder Chopra provided technical insights that you could never get in a classroom. Jobs followed with Landmark Graphics, Boyd Petrosearch, Canadian Natural Resources and then Talisman global exploration team.

Career highlights

I have been very fortunate to work with many outstanding individuals. Dave Robson, John Boyd and Dave Grey would be the top of my list. I have always tried to emulate the best. For me, technical excellence, integrity, and innovation have been the guiding principles of my professional career.

Move to SE Asia

While I was with Talisman in Calgary a geophysical adviser opportunity opened up in Kuala Lumpur. It was a huge step to

shift to another country. But the desire to enhance my technical skillset and thinking back to my parent’s successful transition, the decision to move wasn’t so difficult.

Your current job

After Talisman, I was fortunate to jump to Petronas as the head of geoscience solutions (EGS). My official remit is to ‘Formulate, lead and drive the execution of geoscience solutions in line with overall exploration strategies and plans through successful deployment of effective integrated G&G technologies from basin to reservoir.’ With just under 300 people, EGS is the largest division within exploration including subject matter experts and technical specialists, from seismic acquisition to petroleum system analysis and development geoscience supporting the company’s global portfolio.’ The remit is the cumulation of my entire working experience. Looking back, none of this was by design. It was an evolution.

What next?

The industry is moving at incredible speed towards automation. Everyone is looking for fast answers at the expense of knowledge and understanding. They are forgetting the basics. Cloud computing, Big Data, AI/ML are not intuitive. They only provide building blocks that when properly integrated with fundamental, basic principles can produce extraordinary results. I am close to retirement from Petronas, but can see many building blocks I haven’t used, others I have yet to discover. Hopefully I will find new ways to put the pieces together, just like my parents.

FIRST BREAK I VOLUME 42 I MARCH 2024 17 PERSONAL RECORD INTERVIEW
REGISTER BY 15 MARCH AND SAVE UP TO €700! EAGEANNUAL.ORG Make sure you’re in the know EAGE MONTHLY UPDATE FIRST BREAK I VOLUME 42 I MARCH 2024 2024 OSLO | NORWAY 4-7 NOVEMBER 2024 ROTTERDAM, THE NETHERLANDS CALL FOR ABSTRACTS DEADLINE: 30 JUNE WWW.EAGEGET.ORG FEATURING: OFFSHORE WIND ENERGY HYDROGEN & ENERGY STORAGE CARBON CAPTURE & STORAGE GEOTHERMAL ENERGY 8-12 SEPTEMBER 2024 HELSINKI, FINLAND CONTRIBUTE TO THE TECHNICAL PROGRAMME DEADLINE: 25 APRIL EAGENSG.ORG Register & Save until 20 March! WWW.EAGEGEOTECH.ORG 8-10 APRIL 2024 THE HAGUE, THE NETHERLANDS UPCOMING DEADLINES 10 March Early Bird Fee First EAGE Workshop on Advances in Carbonate Reservoirs 31 March Early Bird Fee 6th APAC Meeting on Near Surface Geoscience and Engineering 31 March Call for Abstracts • 3rd EAGE Conference on Carbon Capture and Storage Potential • 1st EAGE/SUT Workshop on Integrated Site Characterization for Offshore Wind in Asia Pacific • 4th EAGE Workshop on Fiber Optic Sensing for Energy Applications • 4th EAGE Marine Acquisition Workshop • APGCE 2024 GEOPHYSICAL PROSPECTING CALL FOR PAPERS SUBMIT BY 1 APRIL FIND OUT MORE! Special Issue: Frontiers in Seismic Tomography and Imaging

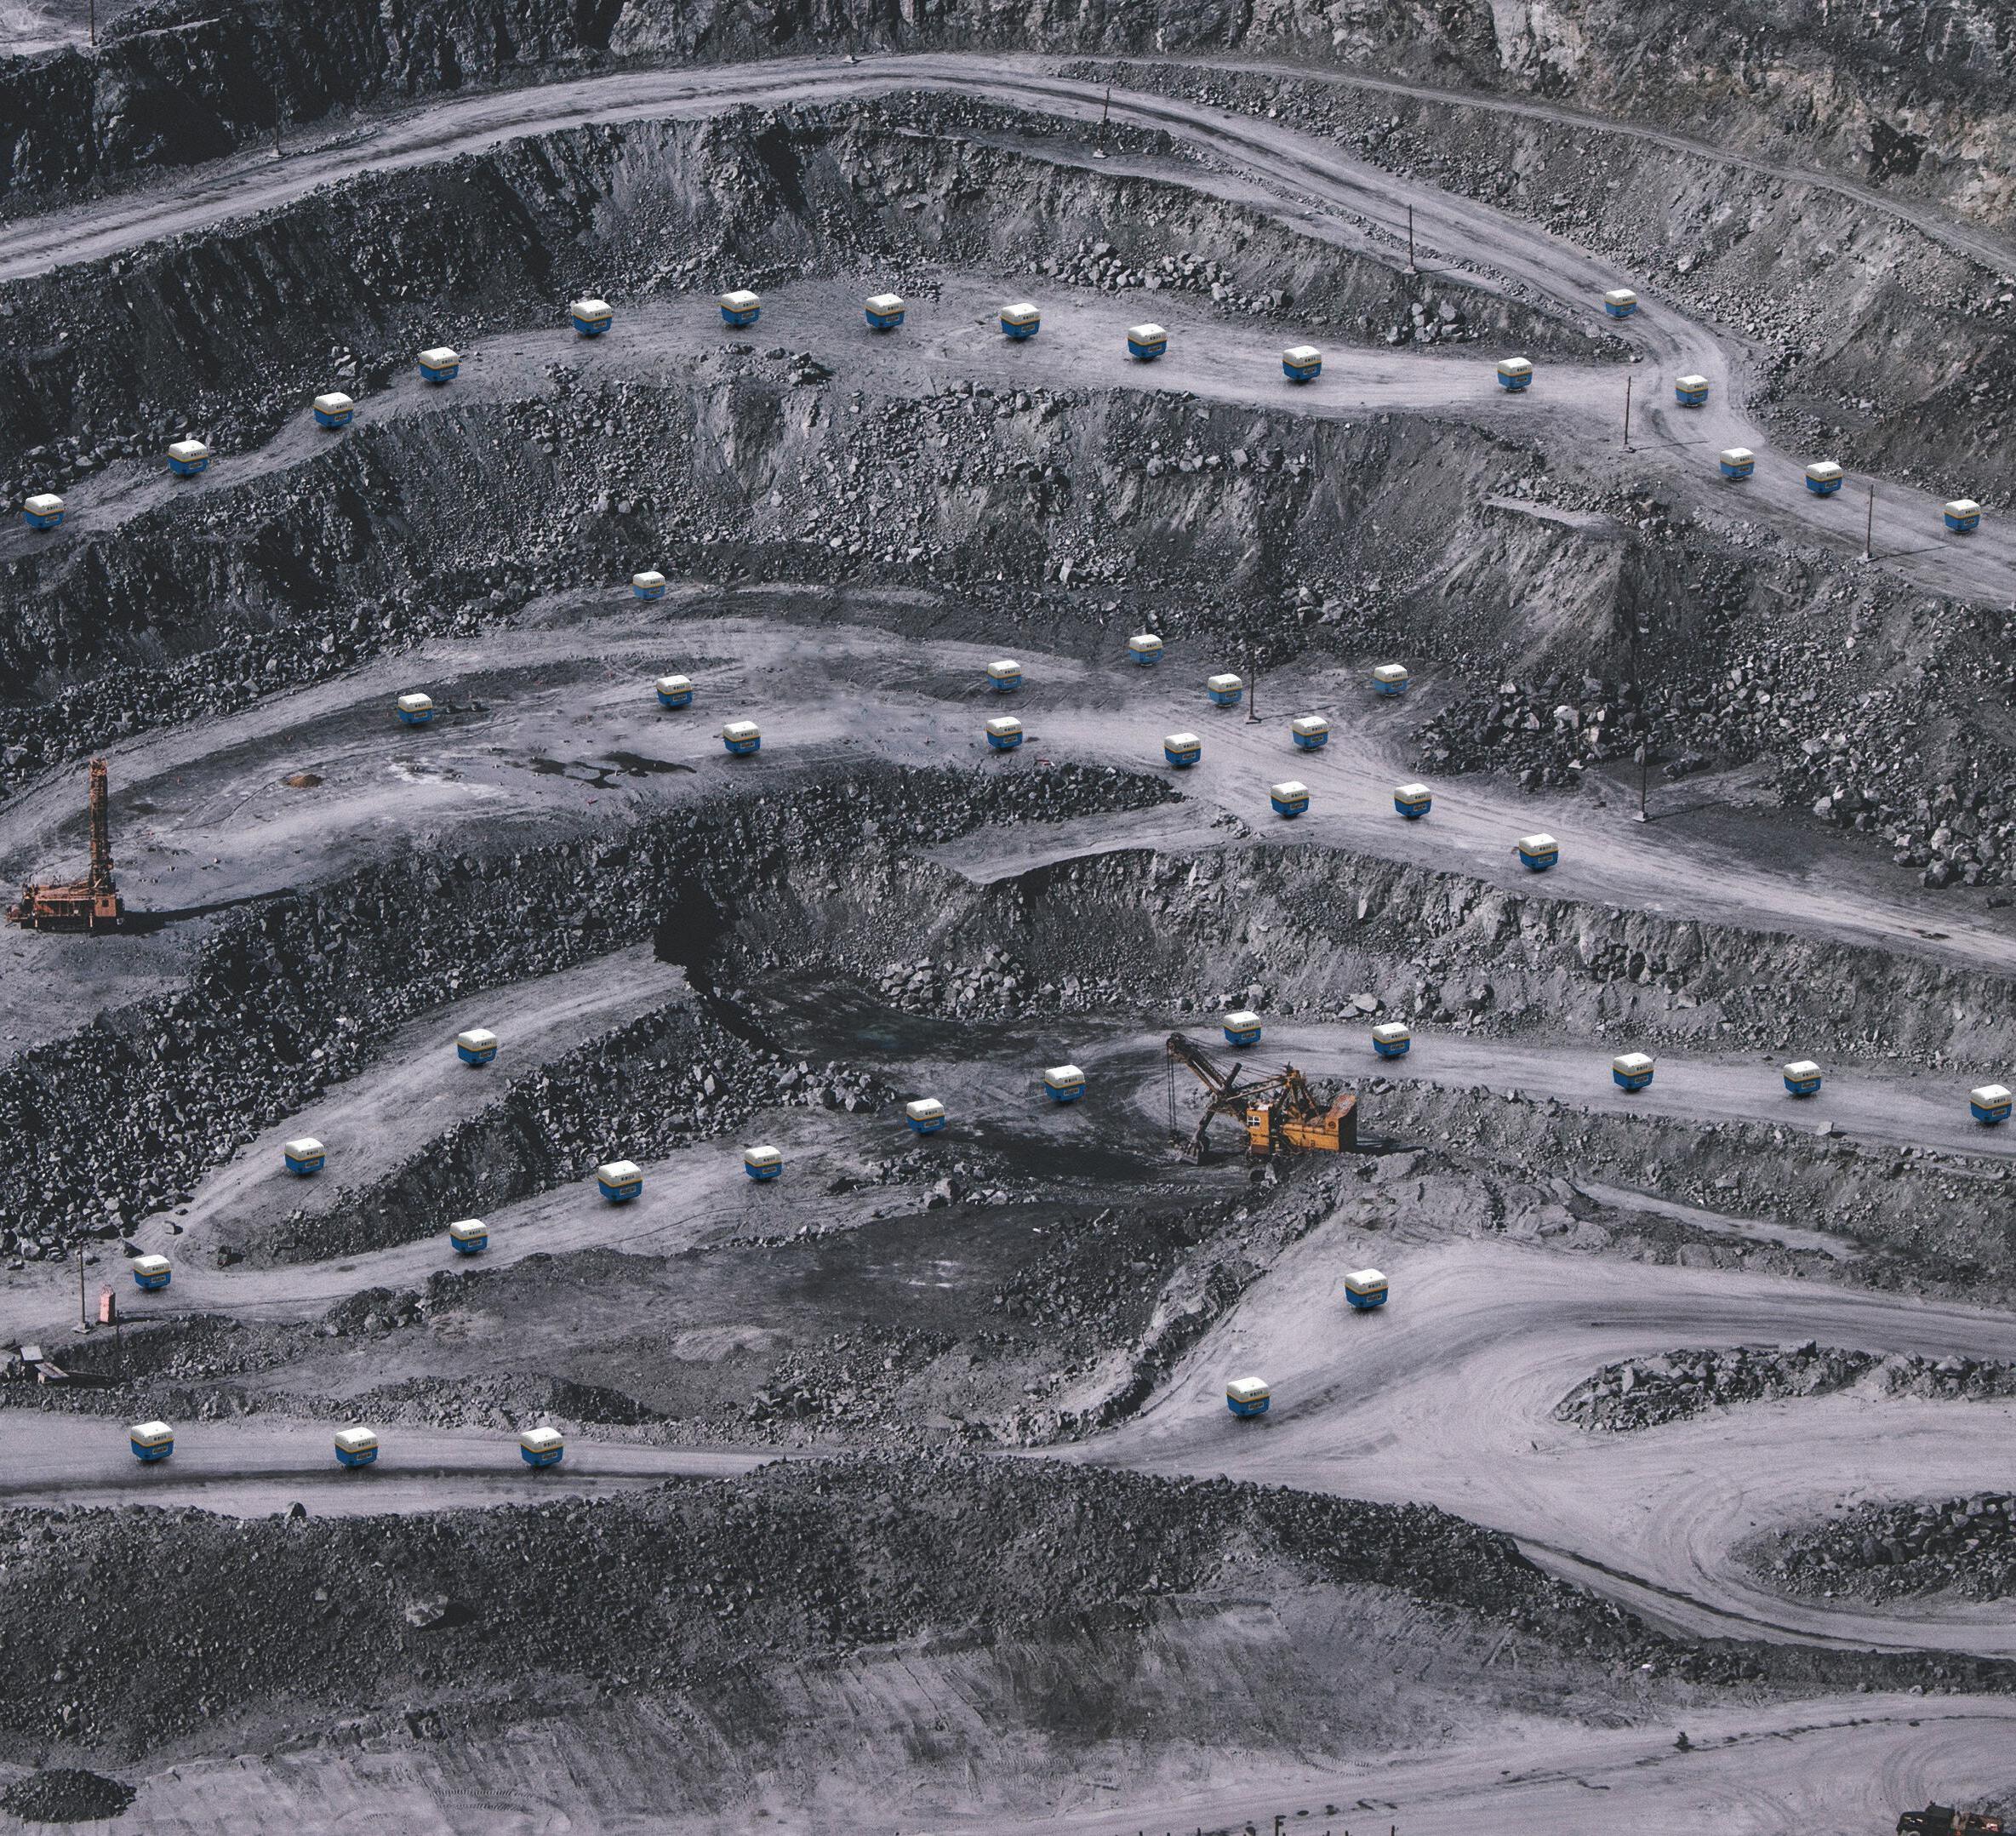
Cost Revolution in Mineral Exploration

Ambient noise surface wave tomography allows us to resolve the deep (800-1000 m) cover contact, as well as peek beneath. These sort of wide area, low resolution images can be obtained relatively cheaply : a recent survey over 5,000 km² cost <US $60/km²

about 1/3 the price of MT 1% cost of reflection seismics

Thanks to SISPROBE for providing the data.

CROSSTALK

BUSINESS • PEOPLE • TECHNOLOGY

Awarding credit where it is due

March is the month of the Hollywood Oscar awards, featuring actors in an over-long orgy of showbiz self-congratulation in a format which all seems rather dated and indeed every year experiences a steady decline in the TV ratings. Mercifully, no such over-the top extravagance accompanies the award ceremonies in our professional societies, arguably they could do with a little more pizzaz.

However, there is one glaring deficiency to which the geoscience societies (EAGE, SEG, AAPG) have to own up, namely the gender imbalance in the awards over the decades. Hopefully this has been unintentional and a reflection of how geoscientific research and industry was conducted in the past. The many societal forces at work that over time have disadvantaged women in the activities served by geoscience are beyond the scope of this discussion, as are the possible mitigating circumstances and solutions.

To be clear, this is not a name and shame exercise, but the facts are rather startling if you look at the winners of the most prestigious honours (apologies in advance if any names are missing). EAGE first. The top life achievement Desiderius Erasmus Award (established 1999) has never gone to a woman, next year’s 2024-25 president Valentina Socco is our only female winner of the Conrad Schlumberger (est. 1955), and we have only had two female honorary members since 1955. SEG’s top Maurice Ewing Medal (est. 1978) has been awarded once to a woman, Rosemary Knight, sometimes referred to as ‘mother of hydrogeophysics’. There has been just one honorary member since 1930, Sally Zinke, the society’s first female president, and only one woman has won the Virgil Kauffman (est. 1996). At AAPG this year, Kitty L. Milliken became the first woman to be awarded the society’s top honour (Sidney Powers Memorial Award, est.1945) and in the past three years two women have been awarded the Michael T. Halbouty Outstanding Leadership Award (est. 1972).

Predictably, none of these and many of the societies’ other awards bear the name of a woman. That at least has changed. Recently the EAGE had the opportunity to name a new innovation prize for young professionals after the American geologist Marie Tharp (1920-2006), posthumous recognition of the unheralded role she played in modern mapping of the world’s deep ocean seabed beginning in the 1940s, winning over sceptics of Plate Tectonics and Continental Drift theories.

‘Tharp persisted in a male-dominated scientific community.’

Just as remarkable an achievement was how Tharp persisted in a male-dominated scientific community to eventually earn international acclaim for her contribution to what she termed with all humility ‘a revolution in geological thinking, which in some ways compares to the Copernican revolution.’ In her highly recommended, autobiographical account published by the Woods Hole Oceanographic Institution in 1999, she writes, ‘I worked in the background for most of my career as a scientist, but I have absolutely no resentments. I thought I was lucky to have a job that was so interesting. Establishing the rift valley and the mid-ocean ridge that went all the way around the world for 40,000 miles – that was something important. You could only do that once. You can’t find anything bigger than that, at least on this planet.’

Even Tharp’s journey into geology is inspirational in the sense that it was the subject matter that persuaded her. Early on, she sometimes accompanied her father in the field. He worked for the government agriculture department collecting data for soil survey maps, so there was an early connection with the earth. Her mother was a teacher and they travelled as a family all over the US so much so that by the end of high school she had apparently attended 17 different establishments. Subsequently at Ohio University she recalled that teaching, nursing or being a secretary seemed to be her destiny, so duly graduated in education with majors in English and music plus four minors including some science, but with no enthusiasm for teaching.

20 FIRST BREAK I VOLUME 42 I MARCH 2024

The attack on Pearl Harbor in 1941 and America’s entry into the Second World War was the pivotal moment for her. The vacuum left by men off to war opened opportunities for suitably qualified women to work in the oil business. Tharp seized the moment, earned a Master’s degree in petroleum geology at the University of Michigan and found an oil job in Oklahoma. In keeping with the times, she was barred as a woman from field work and confined to working on maps and data collected by men. Dissatisfied, she obtained a further degree in math at night classes, and in 1948 shipped off to New York. Her initial target was the American Museum of Natural History. However, she formed the impression that the paleontological work involved would be tedious and hence applied for a research post at the University of Columbia based on her math background. There, she was interviewed by the legendary Maurice (‘Doc’) Ewing, founder in 1949 of the Lamont Geological Observatory (now the Lamont–Doherty Earth Observatory), who suggested map drafting (apparently unaware of her geology degree) and unknowingly assigned her a future place in the pantheon of 20th century cartographers.

‘Beautiful movies of big black cliffs in blue water …’

From these profiles, Tharp could study the bathymetry of the northern sections of the Mid-Atlantic Ridge and spot an aligned, v-shaped structure running continuously through the axis of the ridge. She believed it might be a rift valley formed by the oceanic surface being pulled apart. She later recalled that Heezen initially dubbed the idea as ‘girl talk’, as it would have supported the controversial Continental Drift theory, challenging the more accepted Expanding Earth hypothesis of the time. Soon a different project studying earthquake epicentres showed large numbers of earthquakes occurring along the rift helping to provide the incontrovertible evidence of the rift’s existence needed.

Almost immediately she was assisting, then collaborating, with Bruce Heezen, a new graduate arrival at Lamont. The partnership lasted until his death in 1977, an agonising few months before the definitive World Ocean Floor panorama was published. Theirs was a romantic as well as professional relationship, according to Hali Felt in the speculative 2012 book Soundings about Tharp and her importance.

Indisputably, the relationship was hardly equitable although Tharp never complained. The two researchers were assigned by Ewing to draft and plot ocean floor profiles of the North Atlantic. For years Heezen would collect bathymetric data onboard the research ship Vema, while Tharp stayed onshore to draw maps from the data and other sources because women were barred from working on research ships. It wasn’t until 1968 that she made her first trip offshore. When Heezen announced the first breakthrough on mapping of the Mid-Atlantic Ridge in 1957 and in some later presentations, there was no recognition of Tharp.

From 1952 she had first begun working with sounding profiles acquired from the Woodhole research vessel Atlantis, during 1946–1952, thanks to the availability of echo sounding technology developed during the war for submarine warfare by Ewing and J. (Joe) Lamar Worzel. She created approximately six profiles stretching west to east across the North Atlantic. She described the meticulous, painstaking work involved in those pre-computer days – ‘When each chief scientist completed his cruise … he debarked with a roll of sounding data. Hester Haring (Tharp’s co-worker), with her meticulous handwriting, using a crow quill pen and India ink on blue linen, maintained the Vema sounding records on standard 1:1,000,000 sheets for many years.’

Another idea helped to sway the argument, namely the production of a physiographic diagram of the ocean floor providing an imaginary view of a low-flying plane. According to Tharp, ‘it allowed us to capture the seafloor’s many textured variations, contrasting the smoothness of the abyssal plains, for example, with the ruggedness of the mountains along the ridges. But we also had an ulterior motive: Detailed contour maps of the ocean floor were classified by the US Navy, so the physiographic diagrams gave us a way to publish our data. In retrospect, our choice of map style turned out to be significant because it allowed a much wider audience to visualise the seafloor.’ A first physiographic map of the North Atlantic done in pen and ink was first published in 1957.

In 1959 Jacques Cousteau, the French deep ocean explorer who had initially been sceptical, towed a movie camera on a sled across the Atlantic Ocean near the seabed. He encountered the rift valley and produced, as Tharp put it later, ‘beautiful movies of big black cliffs in blue water’, which he showed at the first International Ocean Congress in New York.

As the years went by the geological community was increasingly convinced and technology, e.g., seismic and magnetic imaging, enhancing the data. There were hassles along the way.

In the 1960s Ewing and Heezen had a falling out. Tharp lost her job and from then on continued her work from home paid for by Heezen from US Navy contracts. Heezen had tenure so could not be fired, but for a period he was denied access to Lamont data and its vessel.

Tharp and Heezen were still able to apply the technique to all the oceans of the world with help from many sources. Their illustrations were vastly enhanced after a random letter from a girl in Switzerland claiming her Dad (Heinrich Beran) could paint much better than them. So it proved. By 1975 all the oceans had been mapped and coloured and then in 1977 the whole world in one picture was published. Tharp retired six years later. Recognition only came later, notably in 1997 when the Library of Congress’ Phillips Society named her as one of the outstanding cartographers of the 20th century.

FIRST BREAK I VOLUME 42 I MARCH 2024 21 CROSSTALK
who can be contacted at andrew@andrewmcbarnet.com.
Views expressed in Crosstalk are solely those of the author,

MORE TO EXPLORE

29% of the Earth’s surface is covered by land, we cover the rest. We explore and analyse what’s beneath the seabed. This provides the knowledge needed to make informed decisions for responsible use of the Earth’s resources. We’re explorers at heart. Explore more at shearwatergeo.com
Just

INDUSTRY NEWS

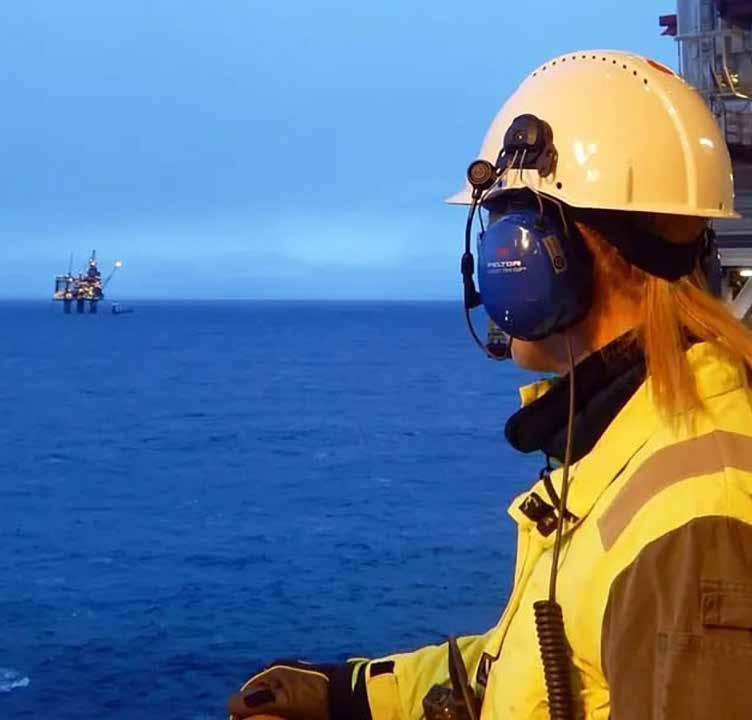
Norway offers 62 licences in APA 2023

Norway has offered 62 production licences on the Norwegian Continental Shelf in the Awards in Predefined Areas (APA) 2023 licensing round with a binding programme of seismic studies attached.

This year’s awards are an increase on last year’s 47 licences after Norway increased what was on offer by 92 blocks in the northwest of the Norwegian Sea and west of the Barents Sea.

Of the 62 production licences offered in APA 2023, 29 are located in the North Sea, 25 in the Norwegian Sea, and eight in the Barents Sea.

In total, 24 oil companies are offered parts in one or more of these licences. Sixteen companies are offered one or more operatorships.

Equinor are the biggest winners with interests in 39 licences and operatorships in 14, while Aker BP won interests in 27 licences and operatorships in 17. Energi has won 16 new production licences on the Norwegian Continental Shelf, four as operator. DNO won 14 exploration licenses, three as operator.

The announcement of APA 2023 was sent for public consultation with a deadline of 7 March 2023. The licensing round was announced 10 May, with an application deadline 23 August. By the deadline, the ministry had received applications from 25 companies.

Companies offered operatorships or parts of licenses are: Shell (1/1); Aker BP (27/17); Concedo AS (2/0); ConocoPhillips (3/2); DNO (14/3); Equinor

Energy (39/14); Harbour Energy (1/1); INPEX Idemitsu Norge (5/1); KUFPEC (2/0); Lime Petroleum (1/0); Longboat JAPEX (1/0); M Vest Energy (1/0); Neptune Energy (4/3); OKEA (3/1); OMV (Norge) (6/6); Pandion Energy (1/0); Petrolia NOCO (2/1); PGNiG Upstream Norway (10/1); Source Energy (3/0); Sval Energi (2/1); TotalEnergies (1/0); Vår Energi (16/4); Wellesley Petroleum (1/1); Wintershall Dea (13/5).

North Sea

On 1148 in the North Sea CS Wintershall will acquire 3D seismic data; on 1198 Aker BP will acquire and/or reprocess 3D seismic data. On 1199 Aker BP will acquire and reprocess modern 3D seismic data. On 1200 S Equinor will reprocess 3D seismic data. On 1201 Equinor will reprocess ocean bottom node studies. On 1202 S Equinor will acquire new EM data. On 1205 Conoco Phillips will acquire new EM data. On 1206 S Aker BP will acquire CSEM data, CSEM inversion and acquire ocean bottom node seismic. On 1207 Aker BP will reprocess 3D seismic data. On 1208 ConocoPhillips will acquire CSEM data, CSEM inversion and acquire modern reprocessed 3D seismic data. On 1209 DNO will reprocess 3D seismic and/ or acquire new 3D seismic data. On 1210 Wintershall Dea will acquire 3D seismic data. On 1211 in the Neptune Energy will acquire and/or reprocess 3D seismic data. On 1212 S Equinor will acquire and/or reprocess modern 3D seismic and G&G

studies. On 1213 S Neptune will acquire and/or reprocess modern 3D seismic data. On Aker BP 1215 will acquire modern 3D seismic data. On 1216 will acquire 3D seismic data.

Norwegian Sea

On 1217 INPEX Idemitsu will acquire and/or reprocess 3D seismic data. On 1218 Aker BP will reprocess 3D seismic data and carry out a EM feasibility study. On 1219 Neptune will acquire 3D seismic data. On 1220 PGNiG will reprocess 3D seismic data. On 1221 Petrolia will acquire and reprocess 3D data. On 1224 Vår Energi will reprocess 3D seismic or acquire modern 3D seismic data. On 1225 S Wintershall Dea will acquire and/or reprocess 3D seismic data. On 1229 Sval Energi will acquire modern 3D seismic and G&G studies. On

FIRST BREAK I VOLUME 42 I MARCH 2024 23
25
Shearwater wins India OBN contract
26
UK awards 33 oil and gas blocks
27 HIGHLIGHTS
STRYDE supplies nodes in Ukraine Illustration; Credit: Lone Stormoen/Equinor.

1230 Aker BP will acquire and reprocess 3D seismic data. On 1231 OMV will reprocess 3D seismic data. On 1232 Wintershall Dea will acquire 3D seismic data. On 1233 OMV will acquire and/or reprocess 3D seismic data. On 1234 Wintershall Dea will acquire and/or reprocess 3D seismic data. On 1235 Shell will acquire 3D modern seismic data.

Barents Sea

On 1236 Equinor will reprocess 3D seismic and carry out CSEM analysis. On 1237 Vår Energi will acquire 3D seismic data. On 1238 Equinor will acquire new EM data and G&G studies. On 1239 Equinor will acquire EM data. On 1240 Equinor will reprocess 3D seismic data.

On 1241 Vår Energi will acquire and reprocess 3D seismic data. On 1242 Aker BP will acquire and/or reprocess 3D seismic and carry out a EM feasibility study. On 1243 Aker BP will acquire and/or reprocess 3D seismic data and carry out an EM feasibility study.

Equinor won 18 production licences in the North Sea, 13 in the Norwegian Sea, and 8 in the Barents Sea.

‘We are familiar with the geology and confident that we will make new discoveries,’ said Jez Averty, Equinor’s senior vice-president for subsurface.

‘Continued active exploration is necessary in order to reduce the production decline that will occur on the NCS. Phasing in oil and gas from new discoveries

will secure long-term activity and contribute to energy security in the European and UK energy transition.

‘Equinor’s Snøhvit Future and Johan Castberg projects are underdevelopment in the north. We will now focus on exploration to uncover the potential for gas in the Barents Sea, working closely with Vår Energi and Aker BP to explore as much as possible with good rig utilisation,’ Averty added.

Per Øyvind Seljebotn, SVP exploration and reservoir development in Aker BP, said: ‘Our strategy is to have a portfolio of acreage that provides a good balance between exploration wells close to existing infrastructure, and wells that can lay the foundation for independent developments if we make discoveries.’

DUG plans to disrupt FWI market

DUG has launched a FWI technology that it claims will replace traditional processing and imaging workflows.

The company plans to disrupt the market with multi-parameter FWI Imaging, an innovative implementation of full waveform inversion (FWI) that delivers simultaneous model-building and full-wavefield, least-squares, depth imaging without the need for a conventional workflow.

‘Results are not just available much faster, but the novel approach delivers unsurpassed imaging directly from field data,’ said DUG in a statement. ‘Traditional seismic processing and imaging workflows contain a multitude of techniques such as deghosting, designature, demultiple and

regularisation – all designed to suppress or modify parts of the recorded wavefield that would be incorrectly migrated by conventional algorithms, such as Kirchhoff or reverse time migration. These preprocessing workflows can be complex, subjective, and time-consuming due to the serial nature in which they must be tested and applied. Projects can take many months or even years to complete.’

DUG chief geophysicist Tom Rayment explains, ‘MP-FWI Imaging uses the robust physics of FWI to simultaneously determine a number of earth parameters, including velocity and reflectivity.

‘The derived reflectivity volume benefits from significantly better subsurface

sampling since it is naturally formed from primaries, multiples and ghosts – which are all treated as useful signal.

‘The approach provides true-amplitude reflectivity images for both structural and quantitative interpretation without subjective and time-consuming preprocessing.’

DUG managing director Dr Matthew Lamont added, ‘We have successfully applied this technology all over the world, in an array of geological settings, using data from all types of acquisition, both modern and legacy. It has delivered fast, superior imaging on geophysically challenging datasets including subsalt and shallow-water. We believe this is the future of seismic processing and imaging.’

CGG reimages 3D data offshore Trinidad and Tobago

CGG has agreed with the government of Trinidad and Tobago to reimage vintage 3D seismic data.

The company will reimage data from blocks 25a, 25b, 26, and 27 offshore to the west of the Caribbean islands. Located in the deep waters of Trinidad and Tobago, the project has received ‘firm industry commitments’ and will deliver early products in late February 2024. The

agreement also includes the generation of well and geological products that will be delivered through CGG’s GeoWells platform.

CGG has committed to reimaging more than 5500 km2 of 3D seismic data in the complex eastern Columbus Basin, using its proprietary TL-FWI imaging technology, which it claims will deliver significantly improved seismic images

and provide a better understanding of the geological systems in this underexplored part of the basin.

Dechun Lin, EVP, Earth Data, CGG, said: ‘We will use our established leadership in geoscience solutions and cutting-edge imaging technology to support this Caribbean Island nation’s ability to effectively address its energy needs and goals.’

24 FIRST BREAK I VOLUME 42 I MARCH 2024 INDUSTRY NEWS

Shearwater wins large OBN survey offshore India

Shearwater GeoServices has won a contract from the Oil and Natural Gas Corporation (ONGC) for a landmark Ocean Bottom Node (OBN) survey off the coast of India.

The venture, spanning six months, showcases its Pearl node technology onboard the SW Tasman, a vessel reimagined for peak efficiency in executing advanced seismic source and dual ROV operations.

‘The fusion of the Pearl node with the SW Tasman not only elevates survey efficiency and quality but also paves the way for groundbreaking seismic data collection in deepwater territories once deemed unreachable,’ said Shearwater.

‘The ONGC survey stands as a testament to the industry’s faith in our forward-thinking technologies, particularly our pioneering Pearl node. Our dedication

to transcending traditional survey limits, coupled with our drive to innovate, positions us at the forefront of marine seismic exploration. We’re not just conducting surveys, we’re redefining what’s possible in deepwater exploration and complex environments, charting new courses that could very well reshape industry standards,’ said Irene Waage Basili, CEO of Shearwater.

TGS and SLB launch latest US Gulf of Mexico OBN survey

TGS and SLB have announced the Engagement 5 Ocean Bottom Node (OBN) multi-client acquisition in the US Gulf of Mexico.

Starting in Q1 2024, the initiation of the seventh program within the seismic joint venture involves the acquisition of 157 OCS blocks (3650 km2) through a long offset, sparse OBN survey. The

expansion of data coverage in the eastern region of Green Canyon will adjoin with prior phases, establishing a continuous coverage area spanning over 23,000 km2 from the Mississippi Canyon in the east to Garden Banks in the west.

During the recent Gulf of Mexico Lease Sale 261, blocks within the survey area attracted 16 winning bids and a total bid value of more than $40 million. The Engagement 5 dataset will support existing and new leaseholders as well as regional explorers with the most technically advanced subsurface imaging. This is achieved through the utilisation of long offset data combined with the application of elastic full-waveform inversion (eFWI). Initial data results will be available in H2 2024.

Kristian Johansen, CEO at TGS, said: ‘Engagement 5 represents a key milestone, enabling contiguous coverage between prior phases of an ongoing initiative that continues to deliver game-changing subsurface imaging for our clients.’

FIRST BREAK I VOLUME 42 I MARCH 2024 25 INDUSTRY NEWS TGS MC3D Seismic TGS MC2D Seismic License Applications Open Areas TGS Mar24.indd 1 07/02/2024 08:23
Source: TGS. SW Tasman Vessel. Source: Shearwater GeoServices.

UK hands out 24 licences in 33rd oil and gas round

Shell, Equinor, bp, Total and NEO are among the 17 separate companies who will carry out seismic studies after being offered a total of 24 licences in the second tranche of the UK 33rd Oil and Gas Licensing round.

These awards follow the 27 licences offered in the first allocation made in October last year.

The 74 blocks and part-blocks offered this time are all in the Central North Sea, Northern North Sea, and West of Shetland areas.

The remaining blocks, the majority in the Southern North Sea and East Irish Sea, will be offered when environmental evaluations, including Habitat Regulation Assessment, Appropriate Assessments, have been finalised by OPRED.

The 33rd Licensing Round opened in October 2022 with more than 900 blocks being made available. The application window closed in January 2023 with 115 bids from 76 companies.

Internal NSTA analysis shows that the average time between licensing and first production is now close to five years, which means that licences awarded now could be producing before the end of the decade.

PGS data covers 21 of 24 areas offered for award in Tranche 2 of the UK 33rd

Round. ‘Reliable data analysis supports assessments of licensing opportunities and enables an accelerated timeline from license award to production.’

Awards come with firm work commitments for seismic studies. On Block 15/13c and 15/18c in the Central North Sea Anasuria Hibiscus will obtain and reprocess seismic data. On 23/16d and 23/17 in the Central North Sea bp will obtain and reprocess seismic data. On 22/24f and 22/25e in the Central North Sea Deltic Energy will obtain seismic data. On 16/22b Deltic will obtain and reprocess seismic data. On 16/22b Eni Elgin/Franklin will obtain and reprocess seismic data. On 3/10c 3/14f 3/15f 3/19d 3/20c in the Central North Sea Equinor will obtain and reprocess seismic data. On 205/1b 205/2b 205/3 205/6 205/7 213/23 213/24a 213/28 213/29a West of Shetland Equinor will acquire seismic data contingent on drilling. On 29/16 29/17 29/18 29/19 29/21 29/22 29/23 29/27 29/28. Orcadian will obtain seismic data. On 21/1b 21/6a 21/7b in the Central North Sea Ping Petroleum will obtain and interpret seismic data. On 21/1b 21/6a 21/7b Shell will obtain and reprocess seismic data. On 213/15b 213/19 213/20 213/24b 213/25 213/29b

213/30a 214/11b 214/16 214/21 in the Northern North Sea TotalEnergies will obtain seismic data. On 22/12b and 29/7b Harvester Energy will obtain and reprocess seismic data. On 15/22b and 15/23b Neo Energy will reprocess seismic data. On 21/25c and 22/21d Neo Energy will obtain and reprocess seismic

data. On 15/27a and 15/28a Neo Energy will reprocess seismic data. On 211/11 and 211/16b in the Northern Sea Neo Energy will obtain seismic data. On 20/28 20/29 20/30a 21/26a North Sea Natural Resources will acquire seismic data contingent on desktop studies.

26 FIRST BREAK I VOLUME 42 I MARCH 2024 INDUSTRY NEWS Aviso_Semana Arpel.indd 1 02/02/2024 09:12 ADVERTISEMENT

PGS launches reprocessing project offshore Nigeria

PGS in partnership with NUPRC, has launched the first 3D Vision reprocessing offshore Nigeria, with final PSDM products expected Q3 2024.

Reprocessing now underway over OPL248 will result in the first 3D Vision product offshore Nigeria.

PGS is rejuvenating ~2000 km2 of 3D data in this area to provide high-quality imaging of Agbada Formation reservoir targets, using a broadband processing flow. Final pre-stack depth migration products will be available at the end of Q3 2024.

The Niger Delta Basin is dominated by up to 12 km of Late Cretaceous-to-Quaternery-aged clastics deposited in an upward-coarsening regressive deltaic sequence.

The main source rocks are Akata Formation marine shales and Lower Agbada Formation paralic shales. Proven reservoirs

in the basin are dominated by unconsolidated sandstones of the Agbada Formation deposited as stacked turbidite channel and fan complexes. The largest accumulations are trapped in roll-over anticlines in the hanging-walls of growth faults, but hydrocarbons may also be found in fault closures and subtle stratigraphic traps.

‘Through PSDM reprocessing, enhanced imaging of targets can be achieved, improving illumination of complex structures associated with the diapiric movement of the Akata Shale Formation,’ said PGS.

‘New modern broadband reprocessing produces seismic data rich in frequency content, with velocity model building enabling clearer imaging of structures, faults, and traps. AVO compliant pre-stack data also helps to reveal subtle depositional features, significantly de-risking exploration,’ the company added.

STRYDE supplies land nodes for Ukraine exploration projects

STRYDE has agreed a deal to provide Ukraine’s leading private energy operator, DTEK Oil&Gas with 30,000 STRYDE Nodes and its Nimble System to acquire 3D and 2D seismic surveys across the country.

Ivan Gafych, director of exploration and prospective development, DTEK Oil&Gas said: ‘Ukraine has one of the greatest hydrocarbon resource potentials in Europe. To unlock it, DTEK is constantly exploring and developing deep and ultradeep targets with a focus on combined and non-structural traps. With most of the large fields in Europe already depleted and an ever-growing energy demand, the key to future production growth is advanced technologies that can rapidly identify new hydrocarbon opportunities, such as seismic nodes’.

Yevgeniy Solodkyi, head of exploration department, DTEK Oil&Gas added: ‘Our seismic crew has already undergone STRYDE’s seismic system training at the company’s facility in Norway. With the system also prepared and ready for collection, we are geared up to start up operations in an impressive two weeks since contract signature.’

BRIEFS

bp has appointed Murray Auchincloss as chief executive officer. Auchincloss, who had been interim CEO since September 2023 after the resignation of Bernard Looney, will continue as a member of the bp board. His appointment was made after a ‘robust and competitive’ search process, carried out by the board over the past four months with support from international search advisers. This included consideration of external candidates. Helge Lund, bp chairman said: ’The board is in complete agreement that Murray was the outstanding candidate.’ Kate Thompson has been appointed as bp’s CFO and will join the company›s board with immediate effect.

Lebanon has announced its Third Offshore Licensing Round. Closing date for bids is 2 July 2024. Blocks on offer are: Blocks 1, 2, 3 and 4 in the northern half of the country’s maritime exclusive economic zone (EEZ) and Blocks 5, 6, 7, 8 and 10 in the southern half. Blocks 8 and 10 are still under negotiation since the Second Offshore Licensing Round.

Shell has agreed to sell its Nigerian onshore subsidiary The Shell Petroleum Development Company of Nigeria Limited (SPDC) to Renaissance, a consortium of five companies comprising four exploration and production companies based in Nigeria and an international energy group.

Chevron is putting its natural gas business in Canada’s Duvernay Shale for sale as it continues to streamline global operations after several big acquisitions. The assets, which produce about 40,000 barrels of oil and gas a day from about 235,000 acres in the Duvernay field in central Alberta, could fetch up to $900 million, according to the Houston-based advisory firm Energy Advisors Group.

Indonesia is reported to be seeking bids on 10 oil and gas blocks this year as the country seeks to increase its reserves amid sluggish output, according to an official in its energy ministry.

FIRST BREAK I VOLUME 42 I MARCH 2024 27 INDUSTRY NEWS
Amie Foster of Stryde and Yevgeniy Solodkyi of DTEK,shake on the deal.

ENERGY TRANSITION BRIEFS

The US Bureau of Ocean Energy Management has published its draft environmental review of wind energy areas offshore the US Central Atlantic region. BOEM’s Draft Environmental Assessment considers potential environmental consequences associated with issuing wind energy leases offshore Delaware, Maryland, and Virginia. The Draft EA also considers project easements and grants associated with each potential lease, including subsea cable corridors. boem.gov/renewable-energy/ state-activities/central-atlantic.

The British Geological Society has delivered its first major update of the national carbon dioxide storage database, CO2 Stored, adding more than 60 CO2 storage units located offshore UK. BGS and Heriot-Watt University have added 61 new entries and updated more than 210 CO2 storage units offshore UK.

Baker Hughes has announced several milestones to support the growth of the hydrogen economy including hydrogen manufacturing and testing facilities. The company has also teamed up with Green Energy Park, which operates ammonia and hydrogen terminals worldwide, to collaborate on green hydrogen value chain, including production, storage, transportation and utilisation of green hydrogen and ammonia-based fuels.

TotalEnergies has signed an agreement with European Energy to develop offshore wind projects in Denmark, Finland and Sweden. In Denmark TotalEnergies has acquired an 85% stake in the Jammerland Bugt offshore wind project (240 MW) and a 72.2% stake in the Lillebaelt South nearshore wind project (165 MW). Construction permits are expected in mid-2024, and start up by 2030. The partners will also develop a joint venture to operate largescale offshore wind projects in Sweden and Finland, and bid for the upcoming offshore wind tenders in Denmark.

The UK has cut greenhouse gas emission by 50% between 1990 and 2022. This compares to a 23% reduction in France and no change in the USA.

CGG to evaluate critical minerals in Mongolia

CGG has signed a deal to support the LiMongolia project, a joint initiative by the National Geological Survey of Mongolia (NGS) and the French geological survey, BRGM, to evaluate the regional prospectivity of Mongolia for critical minerals, particularly uranium and lithium.

The resulting geological insight will serve as a foundation for future strategic decision-making by local and global stakeholders, such as mining companies, international funding agencies and geological surveys.

As part of an initial six-month pilot project starting in H1, 2024, CGG’s mineral exploration geologists will apply their proprietary integrated source-to-sink evaluation workflows. Based on their expert interpretation of machine learning enhanced satellite imagery, they will produce a mineral systems-driven lithium prospectivity model of a salar-type basin

in central Mongolia. The continued development of technology-driven solutions to increase exploration efficiency will be a key focus and CGG said it will leverage ‘cutting-edge’ data science and AI tools to ensure that current and historic data is used to its full potential for enhanced exploration targeting.

CGG’s selection for this role follows on from the recent screening studies it conducted in South America relating to lithium salars and palaeosalars, as part of its suite of lithium-related Earth Data library products designed to support the energy transition.

Peter Whiting, EVP, Geoscience, CGG, said: ‘With its rich mining heritage and vast untapped mineral potential, Mongolia is a high-potential region for frontier exploration that will aid the search for critical minerals to support the energy transition.’

Sercel launches MetaBlue Land seismic solution

Sercel has launched MetaBlue Land, a data-driven solution for land and transition zone seismic surveys aimed at boosting productivity, improving safety, and ensuring high quality data acquisition on every type of onshore seismic project.

MetaBlue Land seamlessly connects every stage of a project, from planning through acquisition to data delivery, while monitoring survey progress in real time. It breaks down operational silos by allowing information-sharing between all the project stakeholders within a single ecosystem to enable better informed decisions.

MetaBlue Land brings together all the data collected by the various Sercel software and technologies used throughout a land survey, such as its MESA survey design and planning software and 528TM, WiNGNT, VE564TM, Nomad 65 Neo and 90 Neo and Vibrator Auto-Guidance acquisition solutions. MetaBlue Land is further enriched by data from Sercel’s services including Train and

Launch, Asset Optimisation, and Operational Excellence.

Daniel Boucard, Sercel CTO, said: ‘With MetaBlue Land, we are introducing the most comprehensive and advanced survey management solution to the land seismic acquisition market, with the aim of completely redefining project management to enable our customers to achieve optimum results.’

28 FIRST BREAK I VOLUME 42 I MARCH 2024 INDUSTRY NEWS
MetaBlue unites all Sercel software data.

EMGS wins survey offshore Brazil

EMGS has won an $11.7 million contract from Petrobras for a fully prefunded multi-client survey offshore Brazil.

The survey is expected to start late March or early April 2024.

EMGS CEO Bjørn Petter Lindhom, said: ‘We are delighted to return to Brazil for EMGS’ first acquisition project offshore Brazil in almost 10 years. As 2023 marked a year with little acquisition activity for EMGS, we are very pleased

and encouraged by a notable increase in the number of active and mature customer discussions for acquisition projects in 2024. Based on these early signals, we are optimistic that 2024 will be a good and active year for EMGS. In addition to this project offshore Brazil, we currently expect that there will be several acquisition projects on the Norwegian Continental Shelf this year.’

TGS expects to report slight drop in fourth quarter revenue

TGS expects IFRS revenues for Q4 2023 to be approximately $189 million, compared to $219 million in Q4 2022.

POC revenues are expected to be $205 million, compared to $227 million in Q4 2022.

Proprietary revenues are expected to be $88 million, up from $60 million in Q4 2022.

POC multi-client revenues are estimated at approximately $118 million, down from $167 million in Q4 2022, with early sales of $59 million, up from £31 million in Q4 2022, and late sales of $59 million, compared to $137 million in Q4 2022.

Full-year POC revenues are $968 million, a growth of 14% compared to pro-forma POC revenues (incl. Magseis) in 2022. POC multi-client revenues are expected to be $549 million, up 8% compared to 2022.

POC contract backlog is estimated at $545 million compared to $475 million on 30 September 2023 and $451 million on 31 December 2022. Cash balance on

31 December 2023 was approximately $200 million.

Kristian Johansen, CEO of TGS, said: ‘While we are pleased to deliver an annual revenue growth of 14% in 2023, we are disappointed with late sales in Q4. Delayed licensing rounds, supermajors focusing their exploration spending on drilling and new seismic data acquisition, as well as ongoing M&A processes among some of our key customers, partly explain why we did not see the normal year-end spending in Q4. On a positive note, we saw increased activity from independents, good order inflow and positive momentum in our Acquisition business, which continues to outperform our expectations. Further, the strong development in the Digital Energy Solutions business continued, with more than a doubling of revenues compared to Q4 2022. I’m increasingly optimistic for 2024, based on positive signals from our customers. Our contract backlog going into 2024 is 21% higher than a year earlier and the pipeline of further business opportunities looks promising.’

FIRST BREAK I VOLUME 42 I MARCH 2024 29 INDUSTRY NEWS PERMANENT MICORSEISMIC MONITORING Years Long Operational Lifetime @ 150°C ® BOOTH # 610 3C FIBER OPTIC DOWNHOLE WIRELESS DATA ACQUISITION www.GEOSPACE.com | sales@geospace.com FIBER TECH TALK 12 March | 2:00 pm | Theme 6 True Fiber Optic Point Receivers as Vector Sensors for Downhole Array Applications
contained, autonomous 3C for sustained monitoring
passive seismic phased array network
Self
Real-time,

TGS partners with GVERSE to integrate well data

TGS has announced a strategic partnership with GVERSE GeoGraphix to provide an

integrated solution that allows geoscientists to easily access and integrate TGS licensed well data within the GVERSE GeoGraphix software suite.

The partnership will enable geoscientists to quickly identify and integrate well data required for structure and stratigraphic analysis, mapping and geosteering projects, said TGS.

The well data provided by TGS within GVERSE GeoGraphix encompasses a comprehensive range of information, including well headers, formation tops, logs, as well as production and completion data.

Carl Neuhaus, vice-president of onshore products at TGS, said, ‘Our partnership with GVERSE GeoGraphix through LMKR represents a notable

stride in improving the accessibility and usability of crucial well data for geoscientists.’

Anthony Ford, GVERSE GeoGraphix vice-president of sales western hemisphere, said, ‘By integrating the capabilities of TGS Well Data and GVERSE GeoGraphix, we offer a comprehensive geoscience platform featuring cutting-edge mapping, geological, geophysical, and petrophysical interpretation, structural modelling, well and field planning, along with state-of-the-art 3D visualisation.’

TGS holds the industry’s largest well data library comprised of over 100 years of public and non-public sources. GVERSE GeoGraphix claims to be the world’s first geoscience software on Windows.

Scottish gas field fails subsurface storage test after seismic studies

A study exploring the potential of a decommissioned gas field in Scotland as a major hydrogen store has highlighted concerns over potential leaks and recommended that it shouldn’t be used.

Research led by Professor John Underhill at the University of Aberdeen and Malcolm Butler at the UK Onshore Geophysical Library (UKOGL) concluded that the Cousland gas field in Midlothian fails to meet the criteria for safe subsurface storage.

The site near Dalkeith in Midlothian, decommissioned in the 1960s, has been highlighted by other academic studies as a potential contender for large-scale hydrogen storage to help meet national net zero ambitions.

However, the study has found numerous barriers to its adoption for this purpose, including a lack of evidence of the nature of the subsurface sedimentary rocks and the structure of the field.

This has led to concerns over the potential for hydrogen to escape and present a risk to the local environment and surrounding communities. Professor Underhill, director of the University’s

Centre for Energy Transition, said: ‘Hydrogen has been proposed as a possible green energy vector in the transition, but it forms a small, nimble molecule and is very difficult to contain.

‘It can be stored safely in subsurface geological sites, but so far these have largely been limited to man-made hermetically sealed soluble caverns in halite (rock salt) deposits.

‘The absence of salt deposits onshore in Scotland is what has led to the proposal that former and now depleted hydrocarbon fields such as the Cousland gas field, could be used.

‘However no natural hydrogen has been discovered in any existing onshore or offshore fields in the UK, which raises the question of whether it was once there and leaked, and crucially if it would stay underground if it was injected into a subsurface site.

‘We used geological data available through the UK Onshore Geophysical Library (UKOGL) to critically evaluate the possibility and concluded that the Cousland field fails to meet the criteria for safe subsurface storage, is a poor site

for a hydrogen repository and should not be used for this purpose.’

Professor Underhill added that the study has made clear the need for independent evaluation of subsurface sites proposed for use in the energy transition.

‘In this particular case, it emphasises the storage challenges associated with porous media in general and in subsurface sites in onshore areas in particular.

Dr Butler, chair of UKOGL, said: ‘This study would not have been possible without access to the large volume of well data, seismic records and crucial unpublished historic reports and correspondence archived by UKOGL.

30 FIRST BREAK I VOLUME 42 I MARCH 2024 INDUSTRY NEWS

*

Sand fairways delineation by post-stack seismic inversion and seismic wave form classification integration, Sitra Area, north Western Desert, Egypt

Abstract

Abu Roash ‘C’ and ‘E’ oil and gas reservoirs are targets of the most exploration and development wells in Sitra concession, which is in the northern part of the Egyptian Western Desert.

Delineation of a fairway of reservoir quality Cretaceous Albian sandstone (Abu Roash C and E Sand) in Sitra Concession of the Abu El-Gharadig basin is one of the key challenges for the success of exploration and development wells. The integration between post stack seismic inversion and seismic wave form classification is important to identify the sand distributions and reservoir geometries. The aim of this work is illustrating the uses of such seismic interpretation techniques in revealing the structural and stratigraphic elements of two main reservoir units. The study of reservoir distributions is one of the main elements needed to be known for oil and gas exploration and exploitation, in addition to uncertainty analysis of volumes calculations.

In this work, seismic wave form classifications SWC and post stack seismic inversion techniques were carried out for the available seismic data and output on two surfaces: the first horizon corresponds to the top Abu Roash C and the second horizon corresponds to the top Abu Roash E, which are the main reservoirs in the area.

Introduction

The aim of this work is to delineate the sand distributions of Abu Roash C and E reservoirs. The structure features can be easily tracked from conventional seismic interpretation. Meanwhile the minor faults can be picked and tracked by extracting the seismic attributes (Abu El- Ata, Hafeez et al. 2023). The stratigraphic features mainly about the main directions of the sand fairways are difficult to be delineated by conventional seismic attributes. Such a stratigraphic element needs to apply quantitative and semi-quantitative seismic interpretation techniques.

A lot of studies have been carried out and published in this geological zone. However, all these studies demonstrate the main producing blocks and main reservoir without going into details for the reservoir distributions and unfortunately, sufficiently comprehensive studies to detect sand fairways in Sitra field have not been implemented so far (Abu El- Ata, Hafeez et al. 2023).

The scope of this work is applying a new strategy for the identification of the sand fairway by using seismic wave form classifications (SWC) and post stack seismic inversion to provide images for sand fairways.

FIRST BREAK I VOLUME 42 I MARCH 2024 31 TECHNICAL ARTICLE
Ahmed H. Hafeez1*, Ahmed S. Abu-El Ata2, Ashraf E. Ghonimi3, Amir M. Lala2 and Ali M. Bakr4.
1 Seismic Interpreter Badr Petroleum company (BAPETCO) | 2 Ain Shams University | 3 Zagazig University | 4 Rock Serve
Corresponding author, E-mail: A.hafeez@Bapetco.net
DOI: 10.3997/1365-2397.fb2024020
Figure 1 Locations of wells in blue and Seismic lines in black.

Post stack seismic inversion is mainly used for highlighting the physical characteristics of the subsurface rocks in terms of acoustic impedance. It represents quantities extracted or derived from the seismic data, that might be leading to better geological or geophysical interpretations of the available data.

In this work, seismic waveform classifications SWC and post stack seismic inversion techniques are carried out for the available seismic data and output on two surfaces: the first horizon corresponds to the top Abu Roash C and the second horizon corresponds to the top Abu Roash E, which are the main reservoirs in the area. These surfaces are picked on the Post Stack Time Migration (PSTM) of the available seismic data. For understanding of the physical characteristics of the subsurface rocks, it was essential to run the feasibility study on the available well logs. The key to success in building an accurate geological model is through integration of geophysical and geological data.

Geologic background

Sitra concession is located in the north Western Desert of Egypt and occupies the central western part of Abu El Gharadig (AG.)

rift basin, with an area of 322.4 km2, The AG Basin is bordered to the north by the Qattara High and to the south by the Sitra Platform. The basin has been affected by a Jurassic rifting phase, followed by the Cretaceous rifting phase, then a Tertiary inversion phase. The basin boundaries are defined by major E-W oriented composite fault zones, influenced by the NE ridges and cut by a series of left-stepping en-echelon WNW-ESE normal faults. They cover the time of deposition of the Abu Roash Formation (Late Cenomanian –Senonian) to the present day (Abu El- Ata, Hafeez et al. 2023).

The available data sets in this study comprise 30 2D seismic reflection sections; of which 14 have N-S direction and 6 W-E direction, in addition to 10 arbitrary NW-SE and W-E sections. These seismic data are tied to 5 wells; SIT 8-2, SIT C4-C1, SIT 1-1, SIT 3-1 and SITC1-1 Figure (1). The digital seismic data and well logs have been interpreted using Petrel Software of Schlumberger and HRS of Geo-view. Seismic data reveal the structures, while the available well logs (G-Ray, neutron, density and resistivity) have been used for calculating the reservoir physical parameters, mainly the densities and velocities. The

32 FIRST BREAK I VOLUME 42 I MARCH 2024 TECHNICAL ARTICLE
Figure 2 Seismic Signatures for SIT 1-1., 8-2, C1-1 and C4-C1, as correlated with the reservoir’s units.

lithostratigraphic column for Abu El Gharadig basin, as zoomed in for Abu Roash Formation (Abu El- Ata, Hafeez et al. 2023).

Abu Roash Formation package is bounded by two unconformity surfaces, as it underlays Khoman Chalk Formation (Maastrichtian age) and overlays Bahariya Formation (Cenomanian age). Abu Roash Formation on seismic sections shows a high frequency cycle which refers to carbonate and clastic layers. In a regional scale, there is thickening in all layers to the eastern direction. A conceptual stratigraphic model was constructed to resolve the main stratigraphic features. The two reservoir units within Abu Roash Formation were deposited in a shallow marine environment as there was more marine transgression dominated by tidal channels during the Turonian age Figure (3).

The Abu Roash Formation conformably overlies the Bahariya Formation and unconformably underlies the Khoman Formation. It is subdivided into seven informal members (A, B, C, D, E, F and G). Four Members are composed of clastic detrital rocks, i.e., A, C, E and G, and three (B, D and F) are mainly of carbonate nature (El Gezeery and O’Connor, 1975). Abu Roash Formation is composed of a repeated alternation of deltaic, coastal and shallow marine facies (Hewaidy et al., 2018).

Abu Roash ‘C’ Member, that deposited during the Turonian time, exhibits all the characteristics of shallow marine-tidal dominated estuaries, which are represented in tidal channels and tidal flat facies. However, Abu Roash E Member was deposited in a variety of depositional environments, including supra-tidal, tidal flats, tidal channels, carbonate inner ramp and tide-dominated deltaic facies. The sandstones of Abu Roash ‘E’ Member are also a hydrocarbon-producing rock unit in Abu Gharadig Field within the AG Basin (Hewaidy et al., 2018).

Seismic waveform classification (SWC)

Conventional seismic interpretation was carried out for the two surfaces of Abu Roash C and E Member and isochronous structures maps were produced Figure (5 and 7).

Pattern recognition has been used for the recent years in the interpretation and reservoir characterisation workflows, but with the advent of the technology it has transformed from purely visual inspection, to automated unsupervised and supervised classification. This can help in the identification of subtle patterns hence allowing Geoscientist to recognise the subsurface characteristics and exploit the seismic data. (Singh, 2004).

FIRST BREAK I VOLUME 42 I MARCH 2024 33 TECHNICAL ARTICLE
Figure 3 Abu Roash C TWT Structure Contour Map (C.I 50 m.s.) Abu El- Ata, Hafeez et al. 2023. Figure 4 Abu Roash C supervised seismic waveform classification map. Figure 5 Abu Roash E TWT structure contour map (C.I 50 m.s.) Abu El- Ata, Hafeez et al. 2023.
34 FIRST BREAK I VOLUME 42 I MARCH 2024 TECHNICAL ARTICLE
Figure 7 E-logs for, SIT C1-1, SIT 8-2 and SIT C4-C1at Abu Roash C Member. Figure 8 E-logs for SIT 3-1, SIT C1-1 and SIT 8-2 at Abu Roash E Member. Figure 9 VP-AI Relation for Abu Roash reservoirs at SIT C1-1, SIT 8-2 and SIT 3-1. Figure 6 Abu Roash E supervised seismic waveform classification Map.

A supervised approach with predefined waveforms has been taken from an external source, for instance from a synthetic modelling package where the reservoir parameters are known (Balz et al., 1999; Veeken 2007).

The first stage is mainly for defining the classes, according to the well findings. Accordingly, three classes are defined for Abu Roash C and E reservoirs Figure (4). The in-line and x-line numbers are the inputs for the similarity of the seismic wave form, as different at each reservoir and from well to other. This form may be considered as a tool to characterise the reservoirs.

The second stage is the classification step. The similarity (or probability) is calculated, as a measure for the degree of resemblance of the master set of traces (sub-cube), to every classified sub-cube. The highest probability range determines the class category for the sub-cube under examination.

The output of SWC process can be displayed on the map view, as in Figure (6 and 8) in three distinct colours matched with the defined classes. The orange colour refers to the probability of finding a thick sand, the yellow colour refers to the probability of finding a thin sand and the grey colour refers to the probability of finding very low N/G reservoir.

Well-based feasibility analysis

The knowledge of rock physics is very important and serves as the bridge, that links the elastic properties to the reservoir properties (Avseth, et al., 2005). Rock properties are those physical properties of a rock such as compressional wave (P-wave), shear wave (S-wave), velocity, bulk density, porosity, compressibility and their derived attributes, that will affect how the seismic waves physically travel through the rock (Dewar, 2001). Cross plotting the rock properties from well logs is a very convenient and efficient way of studying various rock properties or their attributes at the same time (Omudu & Ebeniro 2006). It shows quite decisively which the rock properties or their attributes will be helpful in discriminating both lithology and fluid content in a particular reservoir.

Well-based feasibility analysis was carried out for all available data Figure (8). Two main X-plots drawn for each well for better understanding of the physical properties of the rocks and show if it is possible to separate between sand and shale Figure (11 and 12). It is clear that, there is not much change in the sand density, as it ranges between 2.1 to2.4 g/cc. However, there are pronounced changes in the VP, as it ranges between 3100 and 4200 m/sec, which is related to the depths of the sand occurrence (Table 1).

Post-stack seismic inversion

The main use of seismic data is identifying the geometries of the subsurface reservoir, the geological structure and selecting locations for drilling, However, the 3D seismic data contain more information, as the seismic amplitude changing is related to the comparable variation of the contrast in impedance (density * velocity). So, it can be used to invert for the relative and absolute impedance of the rocks around the interfaces. As the impedance can be calculated from the wells, so it can be calibrated and extended through the entire seismic survey. This process is called seismic inversion, which is used for reducing the risk in the exploration and to fine tune the development operation, in addition to defining the geo-mechanical properties of the reservoir and to increase the recovery volume.

Impedance, as discussed by Veeken (2007), is an important tool, as it contains essential data from the logs and seismic data. Unlike the seismic data, which is an interface property, the acoustic impedance is a rock property that shows geologic layer closely related to lithology and reservoir characteristics, such as porosity and hydrocarbon saturation.

Impedance inversion was first discussed and reported in1979 by (Lindseth, 1979). It involves the estimation of physical properties of the earth model, using the seismic reflection data, which are usually constrained by well logging, particularly the sonic and density logs located within the seismic survey coverage, used to estimate the statistical wavelet phase and fre-

FIRST BREAK I VOLUME 42 I MARCH 2024 35 TECHNICAL ARTICLE
Well Name VP Cut-off (m/sec) Density Cut-off (g/cc) SIT1-1 No cut-offs value due to Bad hole condition SIT3-1 3100 -3700 2.2 – 2.3 SIT8-2 3500 -4200 2.2 – 2.4 SITC1-1 3200 -3700 2.1 – 2.3 SITC4-C1 3500 -4200 2.2 – 2.4
Figure 10 VP-Density relation for Abu Roash reservoirs at SIT C1-1, SIT 8-2 and SIT 3-1. Table 1 Applied cut-offs, to separate between the sand and shale for Abu Roash reservoirs.

quency. Once the wavelet is identified, the most common action is to remove the wavelet tuning and interference effects, which lead to the high-resolution display of the acoustic impedance volume, i.e. the product of primary seismic velocity times the bulk density.

Post-stack Inversion is the most common quantitative geophysical application in reservoir characterisation. But it has to be carefully constrained to minimise the problem of non-uniqueness. In model-based inversion, an initial model of the earth’s geology is designed and then perturbed, until the derived synthetic seismic section best fits the observed seismic data.

Russel (1991) defines the model-based inversion as an iterative modelling scheme in which the geological model is built and compared to the seismic data and the comparison is used iteratively to improve the model. The mathematical relationship for the model-based inversion method can be determined by the generalised linear inversion (GLI) method. The inversion requires the initial value of impedance. An initial model for the model-based inversion is generated using the acoustic impedance logs calculated at the well location Figure (11).

All techniques require the estimated seismic wavelets from the reflection data. Typically, a reflection coefficient series from a stratigraphic-control well, with the available sonic and density logs, should be available. Accurate wavelet estimation requires the accurate tie of the impedance log to the seismic data. Errors in the well tie can result in phase and/or frequency artifacts in the estimated wavelet. Since the quality and reliability of the inversion results depend strongly on the wavelet extraction, a careful consistent calibration of the seismic-to-well log data was always maintained within the target reservoir zone Figure (12).

The inversion algorithm modifies the impedance-log to minimise the misfit between the measured and synthetic seismic data. As it is to be expected with the impedance inversion, a good match between the seismic and synthetic data was achieved as shown Figure (13).

Post-stack inversion is used to transform the seismic reflection data into acoustic impedance as it uses the normal incidence reflections and requires only the near-offset stack data (rather than the full aperture stacked data) to obtain the physically and geologically reliable results (Lee, 2013).

36 FIRST BREAK I VOLUME 42 I MARCH 2024 TECHNICAL ARTICLE
Figure 11 Typical 2D stitched start earth model (initial guess), passing through Sit 8-2 well. Figure 12 Extracted statistical wavelets from the seismic data in between the top and base of Abu Roash Formation.

Hampson and Russell (1991) described three post stack inversion methods, grouped in three categories: model-based, coloured inversion and sparse-spike.

Appropriate processing parameters are required for the amplitude and phase preservation, with higher signal-to-noise ratios (Simm and Bacon, 2014). Filtered lower frequencies in the processed data should be compensated by incorporating the low

frequency models for inversion (Sams and Carter, 2017). The absence of higher and lower frequencies may result in ambiguities, when resolving the thin beds and estimating the local elastic properties (Zhang, et al. 2012 and Rosa, 2018).

Results and Interpretations

The SWC technique was carried out for the Abu Roash C, E and G, respectively, as there is large uncertainty in encountering the sand. However, other Cretaceous and Jurassic reservoirs have lower uncertainty for the sand presence. Generally, there is a good tie with the SWC maps with the regional conceptual model, as the sand thickness increasing in a westward direction.

The Abu Roash C SWC map shows a general NW-SE trend, which is most likely linked to the fluvial channel orientation as per the conceptual geological model. The Abu Roash E SWC maps shows no sand towards the western part of the area and increasing to the central and north western part.

Post-stacked seismic data were used to map the key seismic stratigraphic horizons for Abu Roash reservoirs, and to delineate the structural and stratigraphic features of relevance in the Sitra area. Seismic and well-log information from five distinct wells were also used to complete our inversion method. Well-log data comprised gamma-ray, resistivity, calliper, density and compressional sonic logs. Well-log data were used to tie the seismic to well information and to document the spatial variability of the main reservoir intervals (Abu Roach C and E).

The present 3D acoustic impedance inversion trials on the stacked–migrated seismic reflection volume of Sitra area were proven to be a useful quantitative technique for the subsurface

FIRST BREAK I VOLUME 42 I MARCH 2024 37 TECHNICAL ARTICLE
Figure 13 Post stack seismic inversion analysis of Abu Roash Formation, Sit 8-2 well. Figure 14 AI horizon slice at Abu Roash C Member. Figure 15 AI horizon slice at Abu Roash E Member.

interpretation, where the sandstone geometry and lateral variations were clearly imaged and reliably evaluated.

Horizons slices were extracted from the final post-stack AI resulted cube at Abu Roash C and E reservoirs Figure (14 and 15). The low AI is displayed in yellow, while the high AI is displayed in green. The resulted maps are similar to the resulted map from SWC and also aligned with the regional geologic conceptual model.

Summary and conclusions

In the most of the Western Desert, the structure features were resolved on the geometric attributes. However, the stratigraphic features were difficult to delineate. This is most likely caused by the sand thickness which does not exceed 15 m as continuous sand with a porosity range of 8-10 porosity unit. In addition, there is no sharp reflectivity between sand and shale.

In such a challenging area using the conventional seismic interpretation only will not be sufficient to resolve all geological features, as the conventional seismic interpretation helps to demonstrate the main structurural features and regional stratigraphic settings. However, integration between post stack seismic inversion and seismic waveform classification is important to delineate the detail structures and stratigraphic features and construct a robust subsurface geological model.

Combining all extracted structural and stratigraphic features for Abu Roash C and Abu Roash E reservoirs from different interpretation sources can help to construct a 3D geologic model and locate the new exploration, development and appraisal wells which target these reservoirs in proper locations.

Acknowledgements

We express our sincere thanks to Badr Petroleum Company (BAPETCO) for providing us with the requisite data and extending facilities to work with the software.

References

Abu El Ata, A.S., Hafeez, A.H. and Ghoneimi, A.E. [2023]. Geologic Causatives and Seismic Attributes Heterogeneities for Structural and Stratigraphic Interplays, Sitra Area, North Western Desert, Egypt. First Break, 41(6), June 2023, 41-51, http://dx.doi. org/10.2139/ssrn.4397828.

Avseth, P., Mukerji, T. and Mavko, G. [2005]. Quantitative Seismic Interpretation: Applying Rock Physics Tools to Reduce Interpretation Risk. Cambridge University Press, Cambridge, https://doi. org/10.1017/CBO9780511600074.

Balz, O., Pivot, F. and Veeken, P. [1999]. Reservoir characterization using neural networks controlled by petrophysical and seismic modelling. Extended Abstracts, 61th EAGE annual meeting, S015, 1-4.

Dewar, J. [2001]. Rock Physics for the Rest of Us – An Informal Discussion, Recorder official publication of the Canadian Society of Exploration Geophysics May 2001 Edition, 26(5).

EGPC, [1992]. Western Desert, oil and gas fields, a comprehensive overview. In: 11th Petroleum Exploration and Production Conference, Egyptian General Petroleum Corporation, Cairo. 1-431.

El Gezeery, NH. and O’ Connor T. [1975]. Cretaceous rock units in the Western Desert, Egypt. In: 13th annual meeting of geological society of Egypt. Geological Society, Cairo, p. 2.

Hampson, D. and Russell, B. [1991]. Comparison of post stack seismic inversion methods, SEG Technical Program Expanded Abstracts: 876-878. https://doi.org/10.1190/1.1888870.

Hewaidy, A.G., Elshahat, O.R. and Kamal, S. [2018]. Stratigraphy, facies analysis and depositional environments of the upper unit of Abu Roash “E” member in the Abu Gharadig field, Western Desert. Egypt. Journal of African Earth Science, 139, 26-37. https://doi. org/10.1016/j.jafrearsci.2017.11.028.

Lindseth, R.O. [1979]. Synthetic sonic logs – a process for stratigraphic interpretation: Geophysics, 44(1).

Omudu, M. and Ebeniro, J. [2006]. Cross-plotting of rock properties for fluid discrimination using well data in offshore Niger Delta. Nigerian Journal of Physics. 17. 10.4314/njphy.v17i1.37986.

Rosa, A.L.R. [2018]. The seismic signal and its meaning; In: The seismic signal and its meaning, Society of Exploration Geophysicists, https:// doi.org/10.1190/1.9781560803348.

Salama, H., Darwish, M., Wahdan, M. and El-Batal, A. [2017]. Identify re-development concepts to enhance Abu Roash “C” oil reservoir productivity Sitra Area, Abu Gharadig Basin, Western Desert, Egypt, Petroleum, 26, (235-267). https://doi.org/10.1016/j.ejpe.2016.04.003.

Salem, I., Ghazala, H. and El Diasty, W. [2015]. Prospect evaluation of BED 3 and Sitra oilfields, Abu Gharadig Basin, North Western Desert, Egypt. NRIAG, Journal of Astronomy and Geophysics, 4 https://doi.org/10.1016/j.nrjag.2015.09.002.

Sams, M. and Carter, D. [2017]. Stuck between a rock and a reflection: A tutorial on low-frequency models for seismic inversion. Interpretation 5. B17-B27. 10.1190/INT-2016-0150.1.

Shaarawy, O., in and Abdel Halim. M. EGPC, [1994]. Well evaluation conference of Egypt. Schlumberger.

Simm, R. and Bacon, M. [2012]. Seismic Amplitude: An Interpreter’s Handbook. 1-271. 10.1017/CBO9780511984501.

Singh, Sanjai Palo, Rahul, Patitapaban, Routray, Aurobinda, Mahadik [2023]. Fault detection in seismic data using graph convolutional network. The Journal of Supercomputing 79. 10.1007/s11227-02305173-8. DOI:10.1007/s11227- 023-05173-8.

Veeken, P.C.H. [2007]. Seismic Stratigraphy, Basin Analysis and Reservoir Characterization. In: Handbook of Geophysical Exploration, Seismic Exploration, Elsevier, Amsterdam, 37, 523.

Zhang, R., Sen, M,K., Phan, S. and Srinivasan, S. [2012]. Stochastic and deterministic seismic inversion methods for thin-bed resolution; J. Geophys. Eng 9(5) 611-618, https://doi.org/ 10.1088/17422132/9/5/611.

38 FIRST BREAK I VOLUME 42 I MARCH 2024 TECHNICAL ARTICLE

Mapping and detection of small-scale magnetic anomalies with shipborne vector magnetometer measurements. Case studies in the coastal shallow waters of the Bay of Brest and Iroise Sea (France)

Abstract

Marine magnetic surveys have traditionally been performed towing scalar magnetometers behind the vessel. We have investigated the possibility of replacing them by shipborne vector magnetometers. For this purpose, we have acquired two surveys in the shallow waters of the Bay of Brest and the Iroise Sea (NE Atlantic). Coincident shipborne vector and towed-scalar magnetometers have been deployed from two carriers: at the prow of the 8 m-long launch VH Goéland and on the mast of the 59 m-long hydrographic vessel BH2 Laplace. The shipborne vector sensor is significantly affected by noise related to the ship’s remanent and induced magnetisations than can reach thousands of nanoteslas (nT). We have mitigated these effects by acquiring figures of merit and computing compensation factors that removed over 95% of this noise. After low-pass filtering and offset corrections, we found that the resulting magnetic anomaly maps are fairly close to those obtained with the coincident towed-scalar data. We have resolved anomalies as small as 10 nT related to anthropogenic metal objects and 20 nT related to geological features interpreted as dolerite dikes. These results confirm that shipborne vector magnetometers could be a valid alternative to towed-scalar systems, especially in coastal shallow and busy waters.

Introduction

Marine magnetic surveys have been acquired traditionally with scalar magnetometers (i.e. measuring the total intensity of the ambient magnetic field) towed behind the carrying ship, at a distance from a few tens to hundreds of metres depending on its size. This separation is required because the ship itself is made of and/or contains a lot of steel that generates remanent and induced magnetic fields much stronger than those of the investigated targets and often greater than the magnetometer’s saturation level. This acquisition layout, however, causes problems itself: towing a sensor reduces the ship’s manoeuvrability which can be an issue when surveying small or busy coastal areas. Moreover, a minimal cruising speed must be maintained to ensure buoyancy and avoid crashes with the sea floor, especially in shallow waters. An alternative option is to directly mount the magnetometer on the ship and to compensate as effectively as possible the various ship-related effects. In the 1980s, Isezaki (1986) and colleagues developed the Shipboard Three Component Magnetometer (STCM) system (i.e a vector sensor that measures the magnetic intensity of the field along three axes). They were able to obtain magnetic data with an estimated error of 50 ± 25

1 Shom | 2 ITES

* Corresponding author, E-mail: gmarquis@unistra.fr

DOI: 10.3997/1365-2397.fb2024021

nanoteslas (nT) and a horizontal resolution between 3 and 5 km after filtering, sufficient for the study of large-scale magnetic anomalies found around mid-oceanic ridges (e.g. Korenaga 1995; Seama and Izesaki 1990). They reduced the magnetic field due to the ship under the assumption that it is linearly related to magnetic moments. König (2006) studied magnetic data acquired with vector sensors integrated on the mast of the R/V Polarstern. He performed least-squares inversion of data acquired on calibration loops to derive a model for the ship’s induced and remanent fields and succeeded in compensating it to an accuracy of about 20 nT at a horizontal resolution of about 150 m in quiet seas. Mercier de Lepinay et al. (2017) also documented the use of a vector magnetometer a speedboat to map the link between onshore and offshore volcanic structures in the Lesser Antilles. They compensated for the ship’s magnetic effects with algorithms used to process airborne magnetometry (e.g. Leliak 1961; Olsen et al. 2003; Munschy et al. 2007).

We present here the results of two experimental surveys acquired in the shallow waters (less than 50 m) of the French continental plateau (NE Atlantic). Vector magnetometers were deployed on two carriers: the 59 m-long hydrographic vessel

FIRST BREAK I VOLUME 42 I MARCH 2024 39 TECHNICAL ARTICLE

BH2 Laplace and one of its launches, the 8 m-long VH Goéland The challenge was to install the magnetometers so as to minimize the influence of the ship’s magnetic noise and help to optimise the signal-to-noise ratio (S/N) by careful processing of the magnetic data. We show that a simple compensation method, initially developed for airborne magnetic surveys (e.g. Leliak, 1961; Leach 1980), can be applied to shipborne magnetic surveys, even when targeting small-scale anomalies. The methodology is validated by comparison with standard towed scalar magnetic data.

Data acquisition

Shom’s nautical charts.

We acquired magnetic data during two surveys in 2021 and 2022 in the Bay of Brest and the Iroise Sea (France, Figure 1). We successively mounted a Sensys® vector magnetometer on a pole horizontally at the prow of VH Goéland and vertically on the mast of BH2 Laplace, respectively located about 1 and 17 m above the sea surface (Figure 2). The sensor orientation does not matter as only the intensity of the magnetic field rebuilt from three-axis measurements is here of interest. The magnetometer can measure

40 FIRST BREAK I VOLUME 42 I MARCH 2024 TECHNICAL ARTICLE
Figure 1 Location map of the surveys (top) highlighting the Aulne (green) and Pierres Noires (blue) zones. Vector magnetic data coverage in the Aulne area with VH Goéland (centre) and in the Pierres Noires area with the BH2 Laplace (bottom). The red star gives the location of Shom’s magnetic reference station (Oehler et al. 2019). Ship tracks are superimposed over

up to ±100 microteslas (μT). It is connected to a custom-made data acquisition system with GNSS synchronisation (Diefi Instruments, France). Vector magnetic data are sampled at 25 Hz and GNSS locations at 1Hz. A single file contains both the magnetic and navigation data. In addition, both ships towed a SeaSPY scalar magnetometer (Marine Magnetics Corp.), respectively 20 and 180 m behind their sterns and connected to its own acquisition system running at 1 Hz. We also collected roll, pitch and yaw data with INS systems sampled at 200 Hz.

Overall, about 380 line-km of data have been acquired over two main zones of interest: the Aulne Estuary and the Pierres Noires area (Figure 1). In addition to the survey lines, we acquired several figures of merit (FoM) at the beginning and at the end of each day for compensation purposes. These FoM are key to the successful processing of the vector magnetic data.

Vector data processing

Consider a measurement of a vector magnetic field on a moving ship in a regional field

. Following Leach (1980), one can find a compensation vector such that (1)

Alken et al. 2021) at the centre of the FoM. Note that this can pose difficulties if the actual local magnetic field shows some high lateral gradients. Areas with magnetic variations due to geology or the presence of anthropogenic objects with strong signatures (like shipwrecks) have therefore to be avoided if they are a priori known.

Figure 3 shows the time series of the raw magnetic data from a FoM recorded on VH Goéland. Note that this FoM was acquired in only about one minute. The offset is up to about 500 nT and a large number of rapid variations of amplitudes up to tens of nT are observed. Long-wavelength variations are related to changes in heading of the carrying vessel whilst shorter wavelengths are mainly due to changes in roll and pitch. The standard deviation between the norms of the raw field and the IGRF is about 200 nT. The inversion converges rapidly and the norms of the compensated field for the FoM is shown along with the norms of the IGRF. The standard deviation of the difference between the norms of the compensated field and the reference field drops to 7.5 nT, i.e. about 96% of the perturbations, mainly due to heading effects, has been compensated for. The same methodology has been followed for BH2 Laplace FoMs for the hydrographic vessel are slightly longer, about 5 to 10 minutes. The same variations as before are observed for the larger ship, with an apparent correlation between attitude and magnetic intensity. The amplitude of the ship’s heading effects is estimated to be about 1700 nT. It dramatically drops to about 35 nT after compensation, i.e. up to 98% of the perturbations has been compensated for.

to correct for the combined effects of the ship’s magnetic remanence and induction. This equation can be easily framed as an inverse problem with the objective function being simply the difference between the norms of the compensated field and the regional field. We can evaluate the quality of the calibration by taking the standard deviation of that difference over all the points of a FoM acquired over a very small area (often less than a square km) where one may consider the regional field to be constant. For our calculations, we use the International Geomagnetic Reference Field (IGRF,

We can now apply the inverted compensation vector to the whole area of interest. Compensation residuals are processed by removing a median value per profile, that also at least partially deals with tide issues. A low-pass filter is applied to mitigate residuals of high frequency variations due to pitch and roll, inefficiently corrected in the compensation. Data are then reduced to external variations of the Earth’s magnetic field using time series from Shom’s local reference station (Oehler et al. 2019). We add that the towed-scalar data have been processed following Shom’s standard processing workflow as described for example by Oehler and Lequentec-Lalancette (2019).

FIRST BREAK I VOLUME 42 I MARCH 2024 41 TECHNICAL ARTICLE
Figure 2 Top left: The two ships used for the experiment. The sensors were located near the prow of VH Goéland (bottom left) and on the mast of BH2 Laplace (right).

Results: VH Goéland, Aulne Estuary

We present first the results from a test with the smaller VH Goéland. Our objective was to evaluate the compensation processing on a data set acquired in an area difficult to access. We chose the Aulne Estuary, where we acquired 22 EW profiles with 25 m line spacing and 3 NS transverse profiles (Figure 1). As a reminder, towed-scalar data were acquired simultaneously for comparison.

The total magnetic intensity (TMI) map from the raw vector data are shown in Figure 4A. There is no useful geophysical information on the map which is clearly dominated by the effect of the ship’s direction causing alternating stripes with differences of several hundred nT. The TMI map obtained after compensation processing is shown in Figure 4B: the stripes have been at least partially removed, i.e. the compensation has successfully accounted for the most important carrier’s effects, and the TMI now varies over a range of a few tens of nT around the local IGRF. Small organised noise patterns are, however, still visible. They are residuals of the heading effects combined with tide variations. To highlight the magnetic anomalies, we have subtracted the local IGRF and the median of each profile from the compensated TMI. We also applied a 3rd-order low-pass Butterworth filter with 0.1Hz cutoff frequency to reduce the residual effects of roll and pitch.

The final result is shown on Figure 4C: three anomalies of amplitudes greater than 30 nT are now clearly visible on the compensated field map of the Aulne area. Their signatures are relatively similar to those obtained by scalar magnetometry (Figure 4D), validating the methodology. These anomalies are probably related to metal objects under the sea floor, and could never have been identified in the raw data.

To summarise this first test, we showed that compensation on the Aulne data reduces the noise from heading changes from several hundred to a few tens of nT, and that a low-pass filter can remove the residual noise. With this processing workflow we were able to detect anomalies down to about 10 nT.

Results : BH2 Laplace, Pierres Noires area

We now present results from a test survey in the so-called Pierres Noires area (Iroise Sea) that contains well-documented geological features and several shipwrecks. The bottom panel of Figure 1 shows the 45 EW profiles with 50 m line spacing, and the 5 crossing NS profiles acquired with the vector magnetometer installed on the mast of BH2 Laplace. We follow the same presentation as for the above first case.

The raw TMI map is shown in Figure 5A. Just as in the previous case, the ship’s cruising direction results in a similar striped pattern but with differences of several thousand nT. Here again, compensation attenuates the pattern and reduces the overall TMI range to a few hundred nT (Figure 5B). Two dipole-shaped anomalies with intensities up to 600 nT are easily identified. However, some residual noise remains. They are the magnetic signature of well-known shipwrecks: the 120 m-long Kléber battleship and the 100 m-long Kenilworth steamer (Shom 2022). Subtracting each profile’s median and applying a low-pass filter (here 0.05Hz cutoff) results in a sharper anomaly map and reveals small-scale anomalies above the background level: a dipole-shaped signature of about 50 nT in the NorthEast of the area (coordinates X=3000 m; Y=1000 m on Figure 5C and D) whose origin is still undetermined and elbow-shaped

Towed scalar sensor

Low noise level

Good precision and resolution

No calibration

Positioning by layback correction/adjustment

Measurements near the sea surface

No filtering

Shipborne vector sensor

Higher noise level

Lower precision and resolution

Need of calibration loop

GNSS positioning

Measurements farther to sources

Low-pass filtering

Constraining to set up (Relatively) Easy to set up

Table 1 Strengths and weaknesses of towed-scalar and shipborne vector methods.

42 FIRST BREAK I VOLUME 42 I MARCH 2024 TECHNICAL ARTICLE
Figure 3 Time series of raw and compensated data, along with ship attitude during a figure of merit of VH Goéland. Intensities of the magnetic data are given in nT, heading, rolling and pitch angles are given in degrees.

lineaments of about 20 nT interpreted as the track of dolerite dykes (Oehler and Lequentec-Lalancette 2019).

For sake of comparison, we show the anomaly map from towed-scalar magnetometer data (Figure 5D). We do not expect the values from both sensors to be exactly the same, as here we used the local IGRF to compensate the vector data. The anomaly maps are, however, quite similar, confirming the value of mastborne vector magnetometer data, as long as a proper processing workflow is applied.

Discussion

Our experiment provides elements of comparison between towed-scalar and shipborne vector magnetic measurements over shallow waters on small- to medium-sized ships. The pros and cons of each approach are synthesised in Table 1.

The relative coherence between the anomaly maps from both methods shows that the shipborne vector magnetometer is a valid option even where the objective of the survey is to characterise

small-scale anomalies. The compensation of the vector measurements efficiently corrects for the ship’s induced and remanent magnetisations of several hundreds of nT. We are confident that this approach will also be valuable for bigger ships, provided that the magnetometer’s location is appropriate and as far as possible from the largest steel masses, i.e. fixed to a mast or to a boom (see also below). The ship’s roll- and pitch-related noises are only partially taken into account by the compensation. This residual noise must be low-pass filtered, which has however only a minor effect on the lateral resolution of the data. The sensitivity threshold (i.e. the smallest anomaly that can be resolved) of the shipborne vector data is more affected by the processing than that of the scalar data. For the cases presented here, it is about 10 nT at a horizontal resolution of about 15 m for VH Goéland and about 20 nT at 80 m for BH2 Laplace, smaller values than those published earlier (e.g. Korenaga 1995; Seama and Izesaki 1990, König 2006).

As stated above, choosing a proper sensor location is crucial for success. For the second case discussed here, we integrated the

FIRST BREAK I VOLUME 42 I MARCH 2024 43 TECHNICAL ARTICLE
Figure 4 Magnetic maps of the Aulne area. A: Raw TMI, B: TMI after compensation, C: Magnetic anomaly after median removal and low-pass filtering, D: Magnetic anomaly from processed scalar magnetometer data. Field intensities in nT, interpolation using a 10 m grid spacing.

magnetometer into the mast of BH2 Laplace, about 17 m above the sea surface. As the water depth around Pierres Noires is about 40 m, the mast-hosted sensor is obviously at a disadvantage compared to the towed-scalar sensor. It is farther above the subseafloor magnetic sources and considering potential field theory, about 44% of the anomalous field is therefore lost. We, however, show that magnetic anomalies, even relatively weak ones, are quite similarly mapped by both systems, validating the vector method for geophysical applications. We add that over deep water, this elevation difference between the mast-hosted and towed sensors becomes negligible, However, it is no longer a logistical issue to tow the magnetometer.

The lateral accuracy of towed-scalar magnetic data is often deteriorated by positioning issues due to hypotheses during layback corrections. Shipborne magnetometers, however, benefit from the high quality of the ship GNSS positioning and INS data, in principle reducing this source of errors.

The only additional operational constraint when acquiring shipborne magnetometer data is the need for figures of merit. For these experiments, several FoMs were acquired, at the beginning and at the end of each day. This was mostly done for research purposes to understand the impact of each FoM’s location, shape and duration on the compensation process. For BH2 Laplace, a

FoM can be acquired in less than 15 minutes and for VH Goéland in less than 2 minutes. These extra manoeuvres are therefore a marginal operation, when reported to the duration of a marine survey. If possible, FoMs have to be preprogrammed to be acquired in a quiet magnetic area to avoid strong lateral gradients due to, for example, local geology or metal objects on or above the seafloor.

Conclusions

Shipborne vector magnetometers can be in some cases a valid alternative to standard towed-scalar systems. However, they require the acquisition of figures of merit to calculate proper compensation parameters and require subsequent filtering. We illustrate the performance of shipborne vector systems over two survey areas on a small- and medium-sized vessel respectively. In both cases, the resulting magnetic anomaly maps were very close to those produced using coincident scalar data, even for smallscale or low-intensity signals. Shipborne vector magnetometers are especially interesting for surveys in hard-to-navigate areas as they eliminate the need for towing a sensor.

Acknowledgements

This study was carried out as part of the research contract MAGIDRO between Shom and ITES (UMR 7063 — University of Stras-

44 FIRST BREAK I VOLUME 42 I MARCH 2024 TECHNICAL ARTICLE
Figure 5 Same as for Figure 4 but with data from the Pierres Noires area acquired on a larger vessel. The grids were interpolated with a 25 m spacing.

bourg, CNRS, ENGEES). MAGIDRO is funded by the Defence Innovation Agency (DIA), French Ministry for Armed Forces, through the Defence Technologies Project APOGé led by Shom. We thank the crew of the BH2 Laplace and Shom’s hydrography group.

References

Alken, P., Thébault, E. and Beggan, C. et al. [2021]. Evaluation of candidate models for the 13th generation International Geomagnetic Reference Field. Earth Planets and Space, 73, 48.

Isezaki, N. [1986]. A new shipboard three-component magnetometer. Geophysics, 51, 1992-1998.

König, M. [2006]. Processing of shipborne magnetometer data and revision of the timing and geometry of the Mesozoic break-up of Gondwana. Reports on Polar and Marine Research, 525.

Korenaga, J. [1995]. Comprehensive analysis of marine vector anomalies. Journal of Geophysical Research, 100, 365-378.

Leach, B.W. [1980]. Aeromagnetic compensation as a linear regression problem. In Information linkage between Applied Mathematics and Industry II, Academic Press, London, 139-161.

Leliak, P. [1961]. Identification and evaluation of magnetic-field sources of magnetic airborne detector equipped aircraft. IRE Transactions on Aerospace and Navigational Electronics, ANE-8, 95-105.

Marine Magnetics Corp. [2007]. SeaSPY Overhauser Magnetometer Technical Application Guide. Downloaded from marinemagnetics. com/custom/uploads/2015/10/seaspy-technical-application-guide. pdf, on 07/03/2023.

Mercier de Lepinay, J., Munschy, M. and Géraud, Y. et al. [2017]. Magnetic mapping for structural geology and geothermal exploration in Guadeloupe, Lesser Antilles. European Geosciences Union Mtg., Vienna, Austria.

Munschy, M., Boulanger, D., Ulrich, P. and Bouiflane, M. [2007]. Magnetic mapping for the detection and characterization of UXO: Use of multi-sensor fluxgate 3-axis magnetometers and methods of interpretation. Journal of Applied Geophysics, 61, 168-183.

Oehler, J-F. and Lequentrec-Lalancette, M-F. [2019]. The contribution of marine magnetics in the Gulf of Saint-Malo (Brittany, France) to the understanding of the geology of the North Armorican Cadomian belt. Comptes Rendus Geoscience, 351(1),1-9.

Oehler, J-F., Boivin, J-P., Lucas, S., Rouxel, D., Salaun, C. and Lesur, V. [2019]. A new geomagnetic reference station in Brest (France) dedicated to marine applications. Geophysical Research Abstracts, 21, EGU2019-2240.

Olsen, N., Tøffner-Clausen, L., Sabaka, T., Brauer, P., Merayo, J., Jørgensen, J., Léger, J., Nielsen, O., Primdahl, F. and Risbo, T. [2003]. Calibration of the Ørsted vector magnetometer. Earth Planets and Space, 55, 11-18.

Seama, N. and Izesaki, N. [1990]. Sea-floor magnetization in the eastern part of the Japan Basin and its tectonic implications, Tectonophysics, 181, 285-297.

Shom [2022]. Wrecks and obstructions. Available from https://diffusion. shom.fr/donnees/base-de-donnees-maritimes-et-littorales/epaves. html.

FIRST BREAK I VOLUME 42 I MARCH 2024 45 TECHNICAL ARTICLE
GO TO SEISMICINVERSION.ORG 14-16 OCTOBER 2024 I NAPLES I ITALY CONTRIBUTIONS WELCOMED! SI24 V2H.indd 1 19/12/2023 07:48 ADVERTISEMENT

Special Topic

RESERVOIR MONITORING

Innovation in reservoir characterisation is crucial as energy companies optimise existing fields and explore new fields during the energy transition. This work has taken on an added importance given the need for countries to build security of energy supply in an uncertain world. Meanwhile characterisation of empty reservoirs to assess their suitability for carbon capture utilisation and storage is becoming at least as important.

Ocean bottom nodes are becoming ever more important along with P wave and S wave, time-lapse gravimetry and seabed deformation measurements.

Tom Davis looks back at historical projects to demonstrate what effective CCS monitoring looks like.

David Kessler et al demonstrate the advantages of Full Elastic imaging using the OBN dataset acquired by Woodside Energy in 2019 to better image the sub-salt field.

D. Lecerf et al demonstrate the benefit of including multi-client data to monitor production on a gas reservoir in the Norwegian Sea.

Martha Lien assesses the effectiveness of time-lapse gravimetry and seabed deformation measurements in contributing to conformance, containment, and contingency for the Morecambe carbon storage project.

Michael Mondanos et al present a Measurement, Monitoring and Verification (MMV) framework for CCUS.

Stefan Carpentier et al present a time-lapse pilot study for SMC and GL employing EMI in a managed peatland in the central peat-rich delta plain of the Netherlands, near the city of Gouda.

Killian Ikwuakor demonstrates that the impedance-velocity linear relationships for P-wave and S-wave could become important tools for predictive and quantitative reservoir characterisation in well logs and seismic data.

It

You

46 FIRST BREAK I VOLUME 42 I MARCH 2024
First Break Special Topics are covered by a mix of original articles dealing with case studies and the latest technology. Contributions to a Special Topic in First Break can be sent directly to the editorial office (firstbreak@eage.org). Submissions will be considered for publication by the editor.
Submit an article
Technical
Technical
is also possible to submit a
Article to First Break.
Articles are subject to a peer review process and should be submitted via EAGE’s ScholarOne website: http://mc.manuscriptcentral.com/fb
can
First Break author
find the
guidelines online at www.firstbreak.org/guidelines.
January Land Seismic February Digitalization / Machine Learning March Reservoir Monitoring April Underground Storage and Passive Seismic May Global Exploration June Technology and Talent for a Secure and Sustainable Energy Future July Modelling / Interpretation August Near Surface Geo & Mining September Reservoir Engineering & Geoscience October Energy Transition November Marine Acquisition December Data Management and Processing More Special Topics may be added during the course of the year.
Special Topic overview

Monitoring CCS Projects: What is it going to take?

Tom Davis1* looks back at historical projects to demonstrate what effective CCS monitoring looks like.

Introduction

A question on the minds of people involved with carbon, capture and storage (CCS) projects today is ‘What is it going to take to satisfy the monitoring requirements of these projects?’ No clear answers have come forward so perhaps a look back would be of value. The Reservoir Characterisation Project (RCP) at Colorado School of Mines monitored a number of CO2 enhanced oil recovery (EOR) projects over the course of 20 years of research. Each project had unique objectives generally tied to ‘Can we see the CO2?’ The answer in each case was ‘yes’ while providing economic value along the way.

Time-lapse (4D), multi-component seismic data enables the monitoring of CO2 injection in the subsurface. Multi-component seismic monitoring provides for the recording of compressional (P) waves as well as shear (S) waves. Shear waves split in anisotropic media into fast and slow shear waves that travel the same path. These orthogonally polarised shear waves travel through the anisotropic medium at different velocities and exhibit different amplitude and frequency characteristics. These attributes facilitate monitoring of CO2 in the subsurface because of the sensitivity of these shear waves to pressure and thus changes in effective stress.

Compressional wave monitoring primarily detects saturation change while S-wave monitoring detects pressure change. Both saturation and pressure changes occur during CO2 injection into subsurface reservoirs. Saturation changes occur between different phases of fluids. S-waves can monitor the pressure front associated with high volume injection of CO2 into a reservoir. Our experience in multi-component seismic monitoring indicates that S-wave monitoring gives a more accurate indication of the position of the CO2 flood bank than monitoring with P-waves alone. If you can monitor the pressure you can monitor where the CO2 is and where it is going. The formation of the CO2 flood bank affects the effective stress of the medium and the velocity of S-waves especially in stress-sensitive reservoirs. Most, if not all, reservoirs are stress sensitive.

RCP’s CO2 monitoring projects

Several CO2 monitoring projects were undertaken by RCP over the timespan from 1995 to 2014. A number have been published as individual studies and have been presented at conference meetings over the years. A few of the references are included

1 Colorado School of Mines

* Corresponding author, E-mail: tdavis@mines.edu

DOI: 10.3997/1365-2397.fb2024022

herein that pertain to the specific studies mentioned in this paper. They include: Davis (2022), Davis (2005), Benson and Davis (2006), Zerpa and Davis (2012), Davis (2015) and Davis et al. (2019). The common theme to all these studies is the added-value achieved by multi-component seismic monitoring and the evolution of acquisition, processing and interpretation of multi-component seismic data during that timespan. Another important commonality that emerged was the need for integration of the disciplines to be able to add value to monitoring efforts undertaken.

Vacuum field

Starting in 1995, we conducted the first multi-component CO2 monitoring project in Vacuum Field, New Mexico. Full wavefield (9-C) recording involves three source components and three component receivers. P and S-vibrators imparted three components of source at each source point involving vertical ground motion and two directions of orthogonal horizontal displacement. Strings of multiple, three-component (3-C) receivers recorded the ground motions from each source point. During processing, a rotation algorithm separated the split shear waves. Differencing the travel times of the split shear waves and their amplitude and frequency content can give a measure of anisotropy. Time measurements provide a robust measure of anisotropy for thick reservoirs but for thin beds or high-resolution monitoring then amplitudes and frequencies are used.

The project started with a ‘huff and puff’ operation involving a single well injection into the 300 m-thick San Andres carbonate reservoir at 1360 m depth. It was the first project that showed the value of azimuthal shear wave monitoring to see the CO2 in the carbonate reservoir. P-wave seismic did not show a CO2 response whereas S-wave azimuthal anisotropy did. A 12% change in velocity anisotropy occurred as measured from interval transit times of split shear waves through the reservoir. Monitoring took place over a two-month period involving two surveys, one before the single well injection of 50 million standard cubic feet, and a monitor survey eight weeks later. Later a six-well injection programme was monitored over a period of a year involving 1 BCF of injected CO2 into the six wells. Similarly, shear wave velocity anisotropy change was the most definitive technology for CO2 monitoring (Figure 1).

Differencing of the individual shear wave volumes between the baseline and monitor surveys enabled us to resolve zones of

FIRST BREAK I VOLUME 42 I MARCH 2024 47 SPECIAL TOPIC: RESERVOIR MONITORING

CO2 flow within the reservoir. The S2, or slow shear volume, was most sensitive to pressure change. Both the vertical and horizontal movement of CO2 can be observed through shear wave monitoring. The increased brightness on the S2 difference plot is indicative of flow zones in the San Andres reservoir (Figure 2). One might note that differences occur even at the very bottom of the plot. One could assume that this is induced from the anisotropic zone(s) above, but it was later found to be related to the residual oil zone (ROZ). One of the advantages to CO2 flooding is the mobilisation of oil in the ROZ. The ability to detect CO2 in thin zones shows the resolving power of shear waves to detect and monitor CO2 in the subsurface.

Weyburn field

After the success at Vacuum, we moved to Weyburn Field in Saskatchewan, Canada. Again the focus was could we see the

CO2 in a thin (30 m) fractured carbonate reservoir at 1450 m. There we obtained both a P-wave and S-wave response to CO2 injection but they ultimately were quite different. Upon injection, the CO2 is in liquid form but behaves as a gas further away from the wellbore due to the drop in pressure. CO2 under miscible conditions of pressure and temperature mixes with oil and sometimes water and undergoes a volume expansion. The mixing zone of CO2 gas, oil and water is much harder to see with P-wave data alone.

At Weyburn Field we were able to monitor the CO2 floodfront moving away from horizontal injectors. Open fracture zones cause off-trend frontal advancement and limit the contact with the matrix. If the fractures are confined to zone, they can facilitate the injection of large volumes of CO2 but if they are connected to other wells or to other zones they can be extremely problematic. The enhanced resolution of shear

48 FIRST BREAK I VOLUME 42 I MARCH 2024 SPECIAL TOPIC: RESERVOIR MONITORING
Figure 1 Shear wave azimuthal anisotropy difference maps between baseline and monitor surveys. Figure 1a involves a single well injection in CVU 97. Figure 1b involves a six-well injection programme for a period of one year. Figure 2 The S2 slice through the injection wells 91 and 200 during Phase II shows CO2 override in the Lower San Andres as observed from the S2 difference slice anomalies. Bypassing contact with the formation can prove costly and lower the efficiency of an EOR process.

waves enabled us to see whether CO2 was staying within the zone.

We predicted a 10% change in acoustic impedance at Weyburn Field due to brine being replaced by CO2. This represents the change from pure phase CO2 replacing brine in the reservoir. The observed change shows a 6 to 8% negative P-Impedance change (Figure 3) and a less detectable change away from the horizontal injectors where the CO2 forms a miscible flood bank. Time-lapse differencing of split shear waves from the reservoir zone at Weyburn indicates up to a 40% change in amplitude as shown in Figure 4. This change is well beyond the noise threshold limit and is due to the pressure change associated with the formation of the miscible flood bank.

The S2 polarised shear wave is the most sensitive to pressure change as shown in Figure 5. This polarisation is

orthogonal to the dominant fracture direction in the media. The time-lapse effect is caused by pressuring up the reservoir from 8 MPa to 16 MPa by CO2 injection over a two-year time period by the injection of approximately 12 BCF in the four-pattern area. Approximately 4 BCF were injected in the northeast, southeast and southwest patterns during that time-period. Notice that the southwest pattern showed no response. That is because the CO2 from that pattern was moving out of the reservoir into the underlying Frobisher Formation. ‘Holes’ in the Midale Formation proved very costly to this project. Reservoir characterisation is necessary prior to rolling out an EOR project or any CCS project for that matter. Weyburn is now the largest CO2 sequestration project in the world and has been underway since 2000. Today, more than 2 million tonnes of CO2 are sequestered at Weyburn Field each year.

FIRST BREAK I VOLUME 42 I MARCH 2024 49 SPECIAL TOPIC: RESERVOIR MONITORING
Figure 3 Weyburn Field, RCP 9 square km study area, showing acoustic impedance changes in a 30 m-thick reservoir at 1450 m depth after 1 year of injection of approximately 6 Bcf of CO2 in four twin-leg horizontal wells. Figure 4 Shear wave velocity anisotropy after 2 years of injection. Notice the strong off-trend anomalies related to fracture zones. Shear wave anisotropy was determined from the amplitude ratios of fast and slow shear waves at the reservoir interval. Negative percentage anisotropy implies that the dominant fracture direction in the reservoir is 90 degrees from the expected direction paralleling the horizontal wells.

West Pearl Queen field

The West Pearl Queen Field is a depleted oilfield immediately south of Vacuum Field, New Mexico. The Queen Formation is a thin (6 m) sandstone targeted for injection at 1364 m depth. Thin sandstones like the Queen Sandstone can be good targets for CO2 injection but the abrupt reservoir property changes within the Queen offers challenges for CO2 storage/sequestration. Monitoring the CO2 injection within the Permian Queen Sandstone resulted in a detectable anomaly on the slow shear seismic data (Figure 6). The Queen Sandstone reservoir involves secondary porosity formed by dissolution of carbonate cements. The low aspect ratio pore structure makes the rock stress sensitive. Injection of 50 million standard cubic feet caused a pressure differential between the baseline and monitor surveys shot six months apart. The CO2 moved eastward from the injection well

and was distinguishable on the shear data, whereas it was not observed on the P-wave data.

Postle field

At Postle Field, Oklahoma, the Pennsylvanian Morrow Sandstone reservoir is a very elusive target because the acoustic impedance of the sandstone is the same as that of the surrounding shale for P-waves. Introduction of CO2 into the Morrow makes this reservoir visible. The S-wave signature of the sandstone is especially noteworthy as it generally has a high S-wave impedance because of the rigidity of the sandstones versus the shales. Nevertheless, when CO2 is injected into the reservoir the fluid saturation change with the P-wave causes an immediate lowering of the P-Impedance due to the high porosity of the sandstone. There is no influence of saturation change on the S-wave as shown in the rock physics study of the Morrow Sandstone (Figure 7). Further injection hardly causes any additional response on the P-wave data (Figure 8). Increased pressure causes an almost linear response of S-Impedance change with pressure (Figure 9).

Time-lapse multi-component seismic monitoring was conducted during the start-up of the CO2 flooding of the Pennsylvanian Morrow Sandstone reservoir at Postle Field. The location of injection wells is shown in Figure 10. Injection volumes over an eight-month period are illustrated by the size of the bubble at each injection well. The Morrow Sandstone is a valley-fill reservoir and is quite heterogeneous in nature, consisting of fluvial braided stream sandstones. A vertical well, five-spot injection program was conducted in the field. Time-lapse surveys encompassing 6 square miles were acquired prior to the flood start-up and 8 months later.

Reservoir simulation involved creating a reservoir model built from the well information and then populated geostatistically into the inter-well space. A history match of the well production was performed and a simulation of pressure conducted over the time-period of the seismic monitoring. The pressure simulation is then compared to the observed time-lapse P and

50 FIRST BREAK I VOLUME 42 I MARCH 2024 SPECIAL TOPIC: RESERVOIR MONITORING
Figure 5 S-wave amplitude changes from S-wave data, Weyburn Field after two years of CO2 injection caused by fluid pressure associated with the formation of the CO2 flood bank. A noise threshold has been applied as the changes shown are only those that exceed a one standard deviation cut-off. Note that the map needs to be rotated counterclockwise 45 degrees to match the actual field geometry setting. Figure 6 West Pearl Queen exhibiting the sensitivity of S2 for monitoring pressure change associated with the injection of CO2 in the depleted Queen sandstone reservoir. Note the brighter reflector on the monitor survey east of the injector well. Cross-well surveys verified the CO2 moved eastward from the injection well where the brightening occurs on the shear wave data.

S-impedance change displays (Figures 11 and 12). Note that the S-impedance change map ties better to the simulation map than

high porosity

as a function of saturation and pressure change. Note that a small percentage of CO2 on initial injection causes the largest change in acoustic impedance after-which larger percentages create little change.

does the P-Impedance change map. This should be no surprise given what the rock physics information is showing.

FIRST BREAK I VOLUME 42 I MARCH 2024 51 SPECIAL TOPIC: RESERVOIR MONITORING
Figure 7 Seismic velocities as measured on a high porosity core under different saturation and pressure conditions. Figure 8 Acoustic impedance change as documented from core measurements Figure 9 Rock physics measures of S-impedance change as a function of saturation and pressure change.
52 FIRST BREAK I VOLUME 42 I MARCH 2024 SPECIAL TOPIC: RESERVOIR MONITORING
Figure 10 CO2 injection in the Hovey Morrow Unit of Postle Field. Figure 11 Simulation of pressure change and the time-lapse P-wave response. Figure 12 Simulation pressure change and time-lapse seismic S-wave impedance change. The injection pattern is a 5-spot injection pattern with the CO2 injector in the middle of the pattern.

By comparing the S-Impedance change map and the pressure simulation one can change the permeability structure in the reservoir model to fit the S-wave seismic response and an improved history match attained. Pressure monitoring is essential to achieving a simulation-seismic history match.

Delhi field

Delhi Field is located in northeastern Louisiana. The reservoir is an unconformity trap at 909 m depth involving the Tuscaloosa and Paluxy Sandstones. High porosity, high permeability Cretaceous sandstones enable the injection of high volumes of CO2. Today, Louisiana is the focus for future CCS storage projects because of the presence of older fields like Delhi with infrastructure already in place.

Multi-component seismic monitoring at Delhi involved excellent quality converted or C-wave recording from dynamite sources. CO2 injection occurred in lines of injectors parallel to

the updip unconformity pinch-out. The P-wave data shows a response due to pure phase CO2 injection pooling around the injection wells (Figure 13). It is much less detectable when it forms a CO2 bank away from the injectors. The S-wave data shows the pressure build-up between the lines of injectors (Figure 14). It also showed overburden deformation above some of the high- volume injectors that had to be dialled back.

Economic value

The economic value of seismic monitoring can be associated with each project undertaken. At Vacuum Field barriers to fluid migration were recognised related to sealing faults and anhydrite plugging within the dolomite reservoir. This recognition assisted in the planning of the location of new injectors to optimise the flood management. Monitoring also showed fluid movement into the high permeability zones in the reservoir as the whole formation was open to injection. Subsequently, short-radius

FIRST BREAK I VOLUME 42 I MARCH 2024 53 SPECIAL TOPIC: RESERVOIR MONITORING
Figure 13 The P-wave monitoring survey showed CO2 pooling around the injection wells. Figure 14 Shear wave anisotropy showed the updip unconformity trap as well as the high permeability reservoir architecture. Strain estimates as made from time-lapse time-shifts above the reservoir during CO2 injection showed the pressure front building between the lines of CO2 injectors.

horizontal wells were drilled to increase sweep efficiency within the reservoir. Vacuum also provided the first observation of oil mobilisation from the residual oil zone.

At Weyburn Field, the recognition that ‘holes’ occurred in the reservoir that led to CO2 escape into the underlying Frobisher Formation. Off-trend fractured zones led to inefficient flood movement in the field and the gassing out of some producing wells. As a result, the project roll- out was slowed down until the CO2 stream could be processed, additional horizontal wells were drilled orthogonal to the northeast-southwest existing trend and some vertical wells were converted to CO2 injectors.

At West Queen Pearl Field, the Queen Sandstone was thought to be a ‘blanket’ sandstone. It was too heterogeneous to be further considered for CO2 storage. At Postle Field, the fluvial sandstone showed high permeability zones at a spacing less than the 40-acre five spot flood program set out for flood conformance. Additional injection wells were drilled to increase reservoir conformance.

At Delhi Field pressure monitoring with multi-component time-lapse seismic data helped to ensure safety by noticing areas of high pressure build-up in this relatively shallow reservoir. Injection well pressures were reduced to lower the chances of exceeding the fracture gradient in the reservoir and compromising the seal integrity of the overlying cap-rock. In addition, down-dip water injectors were drilled to contain the CO2 from moving downdip into the water leg in the reservoir.

Conclusions

Observations from multi-component seismic monitoring projects conducted by RCP showed the value of full-wavefield seismic to show CO2 movement in a variety of reservoirs ranging from carbonates to sandstones of different porosities

and permeabilities. In all cases the CO2 was best monitored through S-wave data rather than using conventional P-wave data. Shear waves showed an increased sensitivity to pressure in the subsurface and provided the opportunity to track the CO2 plume. Using pressure as a basis for monitoring is a means of telling where the CO2 is going.

From a safety point of view, monitoring pressure in the subsurface is critical for the success of CCS projects. Monitoring needs to occur within not just the reservoir but above, within and below. The time-lapse time-shifts from S-wave data can be used to observe thief zones as well as overburden and underburden deformation. This observation is critical to assuring safe rates of injection and applying proactive reservoir management.

References

Benson, R.D. and Davis, T. L. [2006]. Monitoring of a sequestration pilot, West Pearl Queen Field, USA: EAGE Extended Abstract F046.

Davis, T. L. [2005]. 4-D seismic monitoring of a fractured reservoir, Weyburn Field, Saskatchewan: Mountain Geologist, 42(2), 45-52.

Davis, T.L. [2015]. Time-lapse multi-component seismic monitoring, Delhi Field, Louisiana: First Break, 33(2), 49-54.

Davis, T.L. [2022]. Shear wave seismic monitoring of a carbonate reservoir: First Break, 40(2), 57-63.

Davis, T.L., Wehner, S. and Richards, T. [2019]. Case studies of the value of 4-D, multi-component seismic monitoring in CO2 Enhanced Recovery and Geosequestration: Geophysics and Geosequestration, edited by Thomas L. Davis, Martin Landro and Malcolm Wilson, and published by Cambridge University Press, 235-256.

Zerpa, N.A. and Davis, T. L. [2012]. Integrated time-lapse monitoring of a Morrow reservoir using multi-component seismic and flow simulation, Postle Field, Oklahoma: First Break, 30(9), 77-83.

54 FIRST BREAK I VOLUME 42 I MARCH 2024 SPECIAL TOPIC: RESERVOIR MONITORING
POWERED BY EAGE’S ONLINE EDUCATION PLATFORM LIFELONG LEARNING OPPORTUNITIES IN VARIOUS ONLINE FORMATS FREE LEARNING E-Lectures, Distinguished Lecturer Webinars, Student E-Lectures EAGE COURSES Extensive, Self-Paced, Interactive, EAGE Education Tours PARTNER COURSES Online courses provided by EAGE partners Explore all the courses in our catalogue! Learning Geoscience 171x99.indd 1 09/08/2022 09:07 ADVERTISEMENT

Full elastic imaging – Shenzi Field, deep-water Gulf of Mexico

Allon Bartana1, Jeff Codd1 and David Kessler1*, Joakim Blanch2, Drew Eddy 2, Ramses Meza2, Varendra Rambaran2 and J. P. Blangy 2 and Yi Huang 3 demonstrate the advantages of full elastic imaging using the OBN dataset acquired by Woodside Energy in 2019 to better image the sub-salt field.

Summary

Over the years Shenzi field in deep-water Gulf of Mexico became a test bed for evaluation of new seismic acquisition and processing technologies. These include 3D narrow azimuth streamer data, 3D-rich azimuth streamer data, and recently 3D OBN data (Mifflin et al, 2021). On the processing side, many types of processing techniques were used to image the various data types recorded over Shenzi field, from 3D ray-based Kirchhoff summation PSDM to Acoustic RTM PSDM and Acoustic FWI imaging. In the work presented here we demonstrate the advantages of Full Elastic imaging using the OBN dataset acquired by Woodside Energy in 2019 to better image the sub-salt field.

Introduction

In the past, computer capacity and cost led to the use of various approximations in the implementation of geophysical applications. These included use of ray-based velocity estimation (Stork 1992, Kosloff et al., 1996) and prestack depth migration (PSDM) algorithms (Gray et al., 2006), as well as the use of the acoustic assumptions as the basis for both velocity estimation and PSDM. With today’s computing strength and cost, these limitations can be removed. In the last decade the industry has moved to wave equation applications for velocity estimation by means of full waveform inversion (FWI) (Tarantola 2005, Vigh et al., 2016) and two-way wave equation reverse time migration (RTM) (Baysal et al., 1983) as the leading method for application of PSDM. We can now progress further and move from using acoustic approximations to the use of full Elastic applications for both velocity estimation and PSDM.

Seismic imaging applications based on acoustic approximations have been in use for the past 40 years as an industry standard. This assumption considers the earth a fluid which supports propagation of P waves only and is justified on the basis that acoustic and elastic media produce the same travel times for pure P wave propagation. However, even for marine acquisition where only P waves are recorded, some of the reflected events propagate as S waves (through P-S mode conversions) along part of the propagation path in the subsurface. These shear waves supply important information about the subsurface geology and can

1 SeismicCity | 2 Woodside Energy | 3 TGS

* Corresponding author, E-mail: dkessler@seismiccity.com

DOI: 10.3997/1365-2397.fb2024023

help resolve subsurface rock properties as well as in-situ stress. In addition, anisotropy is only approximated with acoustic imaging, a fact which causes artifacts from slowly propagating quasi-shear waves. Today we are able to use the full elastic wave equation as the basis for PSDM and velocity estimation in an economic way. This is done without any approximations, enabling the use of both P and S waves in imaging (i.e., the full wavefield).

Another recent industry change in the application of depth imaging is to introduce FWI imaging (FWII), wherein the final image is directly constructed from the velocity model by calculation of reflectivity (Mifflin et al., 2021). The prevailing industry direction is to use FWI imaging resulting from the use of full Elastic implementation of FWI. Another option, which we advocate for here, is to use the full Elastic wave equation as the basis for implementation of PSDM. Using RTM as the underlying algorithm, this results in Elastic reverse time migration (ERTM).

In this work we present the application of ERTM using a proprietary OBN survey recorded over the Shenzi field in deep-water Gulf of Mexico. Over the years, many geophysical applications and various acquisition setups were used to better image the Shenzi field (Howard 2007, Mifflin et al., 2021). This includes narrow azimuth, rich azimuth and OBN acquisitions as well as Acoustic RTM PSDM (ARTM) and Acoustic FWI imaging (FWII). Application of ERTM using Shenzi OBN data can now be evaluated and compared to acoustic-based imaging (both ARTM and FWII) performed using the same OBN data over the field.

Elastic RTM

Until recently, most seismic data processing has been carried out under the acoustic assumption. Accordingly, the layers of the earth are considered as fluids without resistance to shear tractions. Although obviously this description does not represent the earth’s response properly, it correctly predicts the arrival time of the primary P waves and gives an estimate of the amplitude decay due to geometrical spreading. Consequently, despite using the ‘wrong’ physics, seismic data imaging based on acoustic approximation has been very successful.

A physical model which better matches the response of the earth is an anisotropic anelastic (or visco-elastic) solid material

FIRST BREAK I VOLUME 42 I MARCH 2024 55 SPECIAL TOPIC: RESERVOIR MONITORING

(Samec and Blangy, 1992). The model correctly predicts the generation of shear waves in addition to the P waves, and accounts for the attenuation as well as the phase distortion of waves during propagation. Operating under the elastic assumption enables us to extract more useful information from the seismic data. The amplitudes of the reflected arrivals are closer to the amplitudes of real data and therefore can be used to improve FWI applications and generate better data for AVO analysis.

The shear waves and converted waves arrivals which seldom have been used in seismic imaging contain additional information on the subsurface material properties. In addition to the currently used P wave imaging, imaging can be carried out using pure shear arrivals or converted wave arrivals. Using ERTM, three types of waves are present, namely qP waves, qSv and qSh waves’ which usually travel in different paths (Aki and Richards, 1980, Ben-Menahem and Singh, 1981). In marine environments the source is P, so most of the converted waves are qSv. As the subsurface is illuminated by both qP and qSv waves, in areas of poor illumination by one type of wave, there may be compensation by good illumination from the other type. In addition, shear waves travel with a velocity which is different from that of P wave velocity, and thus determining S wave velocity helps resolve subsurface material properties. Furthermore, Shear waves in general are more sensitive to anisotropy, and a combined use of P and S waves enables tightening of the resolution of anisotropic parameters.

When a propagating P wave encounters a material interface, it creates four new waves, namely reflected and transmitted P waves and reflected and transmitted converted S waves (see Figure 10, Langton et al., 2019). Similarly, a propagating S wave will create transmitted and reflected S waves and reflected and transmitted converted P waves. The degree of conversion depends on the layer interface and angle of incidence. An interface across which the velocity changes abruptly will create a high degree of conversion. Conversely, an interface across which the velocity change is spread more diffusely over an area will create converted waves. Converted waves are present in all reflected seismic data but seldom used to their full potential in seismic imaging. In marine streamer acquisition the wave originating from the source and the reflected waves recorded by the hydrophones are both P waves, since shear waves do not propagate in a fluid. However, many mode conversions occur in the subsurface, and part of these conversions will be recorded as P waves at the surface. In marine OBN acquisition both P and S waves are recorded by the

hydrophones and geophones of the nodes. In the case here we used as input the P-Z summed data (Pacal et al., 2015). Using ERTM however, the horizontal components which contain mainly S waves can be used as well.

Elastic RTM migration is based on the same principle as acoustic RTM except that three displacement components are propagated instead of the pressure field. Unlike conventional RTM there are several options to create migrated images. Extracting P and S wave amplitudes from the displacement components, PP, PS, SS, and SP images can be created (Duan and Sava, 2010).

The advantages of elastic imaging were demonstrated for both Gulf of Mexico marine salt environment (Jing et al., 2017) as well as onshore US Permian basin (Langton et al., 2019). This can be extended to many other geological settings, both using marine and land seismic data. Converted shear waves are normally slower than the compressional waves and will appear on migrated PSDM gathers as ‘slow events’ that are commonly mistaken for multiples. Use of elastic PSDM enables us to correctly migrate both the faster propagating P waves as well as the slower propagating S waves. Use of both the P and S waves will result in a more detailed PSDM image as well as increased resolution of the migrated PSDM data.

The ERTM algorithm is based on direct solution of the equations of dynamic elasticity. The equation of conservation of linear momentum:

(1)

where is density, is the second time derivative of the displacement component and . represents the 6 stress components. The stresses are related to the strains through Hook’s law:

(2)

where are the strains and are the 81 elastic coefficients, of which 21 are independent. With 21 elastic coefficients any type of anisotropy can be modelled. The stress-displacement relation reads:

(3)

(Aki and Richards, 1980, Ben-Menahem and Singh, 1981). Although the advantage of fully elastic data processing is

56 FIRST BREAK I VOLUME 42 I MARCH 2024 SPECIAL TOPIC: RESERVOIR MONITORING
Figure 1 P wave velocity model used as the basis for construction of the S wave velocity and density models.

obvious, there are challenges in its implementation. Elastic forward modelling and ERTM are based on the numerical solution of the equation of dynamic elasticity. There are practical difficulties in implementing elastic solution schemes. A large number of spatial variables are required (three displacements, three particle velocities, three accelerations, 6 stress components, 21 elastic constants, and density). However, using optimised numerical schemes (Bartana et al., 2015) both algorithmic and optimisation challenges can be solved, enabling the routine use of ERTM in production environment.

To apply ERTM PSDM, we need to invoke an Elastic model. This requires the addition of the Elastic S velocity along the axis of symmetry, density, and Thomsen’s anisotropy parameter gamma to the parameterisation of the Acoustic model used for ARTM (P velocity along the axis of symmetry, Thomsen’s anisotropic parameters delta and epsilon, as well as dip and azimuth). The density field is related to changes in amplitude only. The S velocity field determines the speed that the converted waves are travelling and therefore affecting the overall wave propagation time. In the work presented here we used a TTI anisotropic Elastic model. This was constructed by use of an Acoustic TTI model previously constructed for application of Acoustic imaging as the base model. Well data were used for calculation of the S velocity and empirical formulas for construction of the density model (Figure 1).

For the calculation of the S velocity model, logs from 40 wells were used. The P velocity from the acoustic model was extracted at the well locations and used for calculation of S velocity using various empirical relations. The resulting S velocity functions

were then compared to the S velocity logs. The Castagna formulation (Castagna et al., 1985), as fitted to the Shale formation, resulted in a very good match between the calculated S velocity and the well logs, so it was used to create the S velocity model. For calculation of the density field, Gardner’s equation was used (Gardner et al., 1974). The resulting Elastic model consisted of P velocity ranging between 4859 ft/s to 18,871 ft/s, S velocity ranging between zero (in the water column) and 11,608 ft/s, and density field ranging between 1.0 g/cm3 and 2.696 g/cm3. The density in the salt body was about 2.5 g/cm3

Elastic wave propagation in the Shenzi field area

In the case of marine seismic data acquisition, the source located in the water layer generates a P wave front. Converted waves are generated at the sea floor (the transition from water to the solid earth). In a streamer survey, the receivers are located in the water layer and will record P waves arrivals only. In an OBN survey, the nodes are located at the water bottom and will record both P waves and S waves. The hydrophone and the vertical component records P waves, and the S waves are recorded mainly by the horizontal components. In both of the streamer and OBN cases, mode-converted wavefronts are generated in the sub-surface. Even though the recorded wavefield consists of P waves, some of the down-going and up-going waves are at least partially propagating as S waves. ERTM calculates any possible wave path including all of the mode conversions.

To analyse the amount of mode converted data in the Shenzi field area, we review wave propagation snapshots generated using the Elastic model applied for the ERTM. The P and S

FIRST BREAK I VOLUME 42 I MARCH 2024 57 SPECIAL TOPIC: RESERVOIR MONITORING
Figure 2 P wavefield at 1.5 seconds of propagation. The arrow marked 1 points to the P wave direct arrival. Figure 3 S wavefield at 1.5 seconds of propagation. The arrow marked 1 points to the P to S conversion occurring at the sea floor.

wave propagation snapshots are shown in Figures 2-9. Using a P source located at the surface, Figures 2 and 3 show the P and S wavefields after 1.5 seconds of propagation. The P wavefield display shows that only a P wave is propagating in the water layer and a P wave is reflecting from the water bottom interface. The S wave display shows that a converted S wave is generated at the water bottom resulting from the P wavefront that is impeding on the interface between water and the solid earth. Figures 4 and 5 show the P and S wavefields at 2.5 seconds of propagation. The P wavefield display shows the P wave front reaching the top salt and starting to propagate with the faster salt velocity. The P wave reflected upward from the top salt is shown as well. The S wavefield display shows three main wavefronts: (i) the slower downward propagating S wavefront that was generated at the water bottom, (ii) the S wavefront that is generated at the

Figure 4 P wavefield at 2.5 seconds of propagation.

Arrow 1 points to the P wave direct arrival traveling with faster salt velocity inside the salt body.

Figure 5 S wavefield at 2.5 seconds of propagation.

Arrow 1 shows the P to S conversion direct wave generated at the sea floor. Arrow 2 shows the P to S conversion generated at the top salt. Arrow 3 shows the P to S conversion at the top salt. This S wave front is travelling in the salt with the salt S velocity.

Figure 6 P wavefield at 3.5 seconds of propagation.

Arrow 1 marks the direct P wave front propagating below the salt body.

sediment to salt interface from the downward propagating P wave and (iii) the upward propagating reflected S wave, generated at the top salt interface. At this propagation time, the S wavefronts are detected inside the salt body as well as in the sedimentary section between the top salt and water bottom. Figures 6 and 7 show the P and S wavefields at 3.5 seconds of propagation. The P wave display shows the P wavefront emerging from the salt body and reaching the producing field around the salt stalk. The S wave display shows a series of P-S converted waves generated at the base of salt interface as well as complex path P-S head waves connecting the P wave propagating at the water layer to the S waves propagating inside the salt body. Careful analysis of the wavefronts shown in Figure 7 reveals several S wavefronts that are propagating in a direction perpendicular to the dips of the reservoir sands around the salt stalk. These downward propagating

58 FIRST BREAK I VOLUME 42 I MARCH 2024 SPECIAL TOPIC: RESERVOIR MONITORING

S waves will trigger both P and S waves reflecting back from the sub-salt layers that are the reservoir sand layers. Figures 8 and 9 show the P and S wavefields at 4.5 seconds of propagation. The P wave display shows the downward propagating P wavefronts propagating along the deeper salt body and the sub-salt sedimentary section. The S wave display shows additional downward propagating S wavefronts propagating inside the tabular salt body as well as the salt diapir and at the sub-salt sedimentary section. Analysis of the wavefronts shown in Figure 9 shows the large amount of converted wave energy that is propagating in the subsalt section. The wavefield recorded by the ocean bottom nodes consists of both P waves (hydrophone) and S waves (horizontal components). Both can be used as input to ERTM. In the work here we used only the P wavefield and vertical components as input after P-Z summation. The ERTM results are shown in the

next section. In the results shown, waves converted in the subsalt section and recorded as P waves can be used to improve the imaging of the sub-salt section by means of ERTM.

Elastic imaging results

Using the Shenzi pre-processed OBN dataset and the TTI anisotropic Elastic model, ERTM was applied. Using reciprocity, 3576 common receiver gathers were migrated. Post migration, the migrated shots were stacked to produce the imaged PSDM stack volume. For analysis of the results, we compare the ERTM stack to two stacked images produced using the Acoustic wave equation. The first comparison is with ARTM. In this comparison we compare the raw ERTM stack to the raw ARTM stack. The application of ERTM was done using maximum frequency of 20 Hz and is compared to

Figure 7 S wavefield at 3.5 seconds of propagation. Arrow 1 shows the P to S conversion occurring at the top salt. Arrow 2 is a complex P to S conversion of the head wave travelling above the salt. Arrow 3 is the P to S conversion at the top salt. Arrow 4 is P to S conversion at the base of salt. This wavefront will travel in the subsalt section before the ‘direct’ P to converted wave occurring at the top salt.

Figure 8 P wavefield at 4.5 seconds of propagation. Arrows 1 and 2 point to the direct P wave. Arrow 1 is the direct P wave front traveling in the sub-salt sedimentary section. Arrow 2 is the direct P wave front travelling in the deeper salt body.

Figure 9 S wavefield at 4.5 seconds of propagation. Arrow 1 is the ‘direct arrival’ P to S conversion at the top salt. The wavefront will reflect back from the subsalt sands that are part of Shenzi field. Arrow 2 is S wavefront converted from the P wavefront to S.

FIRST BREAK I VOLUME 42 I MARCH 2024 59 SPECIAL TOPIC: RESERVOIR MONITORING

previously done 30 Hz ARTM. Figure 10 shows ARTM and ERTM imaging beneath salt. Eocene and Cretaceous age formations are marked by 1 and Upper Miocene age events are marked by 2.

The Shenzi OBN dataset was also imaged using full waveform inversion imaging (FWII). In the past few years, FWII has been added as a tool to create a migrated image directly from the resulting velocity model. In most cases this is done using Acoustic FWI application. As an FWI image consists of calculation of reflectivity directly from the velocity model, an image with less noise can be generated. However, if the inversion procedure does not include a full Elastic formulation, the image will lack contributions from both P waves and S waves. This is demonstrated in the data comparisons below. Since post processing was added to generate the FWII stack, we applied

(V.E.) is 1:2.6. The annotation marked by 1 and 2 show areas of difference. In the area marked by 1, the ERTM includes sub-salt steep dip events that are not imaged by ARTM. In the area marked by 2, the ERTM provides a more complete image showing sub-salt faults separating two different geological units with different dips. The ARTM image in this area is lacking these details.

noise reduction filtering to the raw ERTM stack volume before comparing to the FWII volume. In the next sections we compare the Elastic imaging results to Acoustic imaging by reviewing of key geological features that are important to well placement.

Sub-salt imaging

For many sub-salt exploration targets, the processing objective is to image the edge of the trap, which for Shenzi is the truncation of the sedimentary section against the salt flank. Using various Acoustic imaging techniques and various types of seismic data (i.e., Streamer and OBN), this task is known to be difficult. The reason is that in many cases the P wave reflections travelling upwards reach the salt flank past the critical angle and therefore do not reflect off this interface, are not transmitted to the surface or ocean bottom receivers, and therefore fail to

60 FIRST BREAK I VOLUME 42 I MARCH 2024 SPECIAL TOPIC: RESERVOIR MONITORING
Figure 10 Left: 30 Hz Raw Acoustic RTM PSDM. Right: 20 Hz Raw Elastic RTM PSDM. Vertical exaggeration Figure 11 Left: Acoustic FWI imaging. Right: 20 Hz Elastic RTM with post processing applied. V.E. is 1:2.25. The sub-salt event marked by 1 is imaged by the ERTM compared to a ‘no illumination’ area shown in the FWI image. Figure 12 Left: 30 Hz Raw Acoustic RTM. Right: 30 Hz Raw Elastic RTM. V.E. is 1:2.25. The steep dip subsalt event marked by 1 is well imaged by the ERTM compared to a ‘no illumination’ area in the ARTM image.

image the area in close proximity to the salt flank. However, in many cases seismic mode conversion occurs when the P waves reaching the salt body are converted to S waves that propagate upwards inside the salt body. These S waves will then convert back to P waves at the top of salt and will be recorded at the surface as P waves. Using ERTM, these waves are included in the constructed image as mode converted wave propagation is included in the migration process. The result is clearer imaging of the truncation of the sub-salt sedimentary section events against the salt flank. Three imaging examples demonstrating the ability of ERTM to image the up-dip section of sub-salt events are shown. Figure 11 shows imaging of a series of low dip sub-salt events between base of salt and Middle Miocene. Figure 12 shows imaging of a steep dip event truncating against

the salt body. These are Middle and Lower Miocene age formations. Figure 13 shows imaging of steep dip events in both sides of a sub-salt basin. The events marked by 1 are Oligocene, Eocene and Cretaceous age formations. The events marked by 2 are Lower Miocene age formations.

Imaging of sub-salt faults and unconformities

A common deficiency of PSDM imaging is the ability to image faults, in deeper basins or below salt. This can result in erroneous interpretation and oversimplified maps of sub-salt structures. When using ERTM however, the full recorded wavefield is accounted for during imaging (i.e. utilising all P waves and S waves and their mode conversions). This allows for additional details to be imaged in the sub-salt section. This is demonstrated

Figure 13 Left: Acoustic FWI imaging. Right: 20 Hz

Elastic RTM with limited post processing applied. V.E. is 1:2.3. Steep dip sub-salt events marked by 1 and 2 are well imaged by ERTM.

Figure 14 Left: 30 Hz Raw Acoustic RTM. Right: 20 Hz

Raw Elastic RTM. V.E. is 1:1.6. The area marked by 1 shows a major thrust cutting the structure, just East of the crest.

Figure 15 Left: Acoustic FWI imaging. Right: 20 Hz

Elastic RTM with post processing applied. V.E. is 1:1.6. The FWI image does not include the thrust fault, which is clearly imaged using ERTM.

FIRST BREAK I VOLUME 42 I MARCH 2024 61 SPECIAL TOPIC: RESERVOIR MONITORING

in the two sections shown in Figures 14 and 15 where clear faults are imaged by ERTM in Middle Miocene, Oligocene, Eocene and Cretaceous formations.

The seismic image of Figure 14 displays a prominent anticline near the Shenzi field. The ARTM image includes a poorly imaged area marked with the number 1. A potential variation on the interpretation of this section could be one continuous (un-faulted) anticlinal structure, with a very steep, nearly vertical Easterly limb. However, on the ERTM image, a major thrust fault is clearly imaged, with a better focused salt core below, and what could be interpreted as a fault plane reflection. Furthermore, the interpretation of the ERTM section indicates that the stratigraphy is likely to be offset across the fault.

FWI imaging in this area is examined as well (Figure 15). As the FWI image results from a velocity model, it actually provides a simplistic representation of the geology. Examination of the FWI image from ARTM shown in Figure 15 suggests a continuous structure with a very steep eastern limb. Interpretation of this image will result in a simplistic interpretation of the geology. On the other hand, the ERTM image includes the thrust fault (marked by 1), and the interpretation of this image will result in a faulted trap.

The area shown in Figure 16 includes an unconformity in the sub-salt section. The events marked by the black box are from Upper Miocene to Cretaceous age formations. The FWI image (on the left) shows a typical ‘illumination hole’ common in imaging done using Acoustic approximations. The ERTM image (on the right) includes a clear image of the main faults (marked by 1) separating the two geological units with very

Figure 16 Left: Acoustic FWI imaging. Right: 20 Hz Elastic RTM with post processing applied. V.E. is 1:2.0. The sub-salt fault zone marked with the letter 1 is imaged using the ERTM, while the FWI image includes a ‘poor illumination’ zone.

Figure 17 Left: Acoustic FWI imaging. Right: 20 Hz Elastic RTM with post processing applied. V.E. is 1:2.0. Sub-salt faults imaged by ERTM are marked by 1, 2 and 3. Fault 1 is imaged by the ERTM but not by the Acoustic FWII. Fault 2 is imaged by FWI in the deeper part and better by the ERTM in the shallower part. Fault 3 is imaged by the ERTM but not by the Acoustic FWII.

different local dips. The reflection from the sub-salt faults was propagating in the salt as converted wave and therefore can be imaged using ERTM.

The area shown in Figure 17 includes a compartmentalised thrusted structure. The events marked by the black box are from Upper Miocene to Cretaceous age formations. The FWI image produced by the Acoustic wave equation suggests a continuous structure. The ERTM image shows on the other hand, several faults cutting the structure. Once again, imaging of geological details that are part of deeper section or sub-salt structures will lead to a more correct interpretation of the sub-salt structure and will result in a better field development plan, with wells placed to target the various compartments of the sub-salt structure.

Summary

Every decade has seen a step change in industrial application of PSDM algorithms for seismic imaging of complex areas. In the 1990s ray-based 3D Kirchhoff summation algorithms became the main application used by the industry. In the 2000s, wave equation-based algorithms became operational, based on the solution of the one-way wave equation. In the 2010s, reverse time migration took over as the leading PSDM application. Based on the solution of the two-way wave equation, RTM enabled reliable imaging of complex geological structures. However, most of the industrial RTM applications are based on the solution of the Acoustic wave equation, which is a fundamental approximation of the full Elastic wave equation. With the availability of stronger computational platforms, we can today move a step forward with the full Elastic implementation of the wave equation. The term

62 FIRST BREAK I VOLUME 42 I MARCH 2024 SPECIAL TOPIC: RESERVOIR MONITORING

‘full’ means that the equation of dynamic elasticity are directly used, without the need to include any approximations or short cuts.

In the work shown here, ERTM was tested using OBN data recorded over the Shenzi field area in deep-water Gulf of Mexico. Examination of the results shows that seismic imaging can be improved in places by moving from Acoustic approximations to use PSDM based on the full Elastic wave equation. Different depth imaging methods have their strengths and weaknesses ranging from computational cost and ability to resolve different features of the subsurface. Using the full Elastic wave equation, the entire wavefield is used to construct the migrated image. We compared here ERTM to ARTM as well as ERTM to Acoustic FWI imaging done using acoustic approximations. ERTM has been shown to be able to image geological features that the other methods do not, as well as other methods showing a few features not imaged by the ERTM. This suggests that a combination of depth imaging methods can lead to optimal depth imaging.

We foresee the industry moving to develop and use FWI algorithms based on the solution of the full Elastic wave equation for both velocity estimation and imaging. Having Elastic FWI will enable us to construct the S wave velocity directly from the seismic data. In the area of depth imaging we demonstrated that ERTM PSDM is a depth imaging tool that should be part of a depth imaging applications set used in commercial projects.

Acknowledgments

We thank Woodside Energy for its collaboration in the construction of the Elastic model and application of ERTM. We thank Woodside Energy and Repsol for the permission to publish this work.

References

Aki, K. and Richards, P.G. [1980]. Quantitative Seismology: Theory and Methods. WH Freeman and Co.

Bartana, A., Kosloff, D., Warnell, B., Connor, C., Codd, J., Kessler, D., Micikevicius, P., Mckercher, T., Wang, P. and Holzhaur, P. [2015]. GPU implementation of minimal dispersion recursive operators for revrese time migration. SEG annual meeting.

Baysal, E., Kosloff, D. and Sherwood, J. [1983]. Reverse Time Migration. Geophysics, 48, 1514-1524.

Ben-Menahem, A. and Singh, S.J. [1981]. Seismic Waves and Sources Springer Link.

Castagna, J.P., Batzle, M.L. and Eastwood, R.L. [1985]. Relationships between compressional-wave and shear-wave velocities in clastic silicate rocks: Geophysics, 50, 571-581.

Duan, Y. and Sava, P. [2010]. Imaging condition for elastic RTM, CWP809 report, Center for Wave Phenomena. Colorado School of Mines.

Gardner, G.H.F. Gardner, L.W. and Gregory, A.R. [1974]. Formation velocity and density -- the diagnostic basics for stratigraphic traps. Geophysics, 39, 770-780.

Gray, S., Trad, D., Biondo, B. and Larry, L. [2006]. Towards Wave-equation imaging and velocity estimation. CSEG Recorder vol 31.

Howard, M. [2007]. Marine seismic surveys with enhanced azimuth coverage: Lessons in survey design and acquisition: The Leading Edge, 26, 480-493.

Kosloff, D., Sherwood, J., Korem, Z., Machet, E. and Falkovitz, Y. [1996]. Velocity and interface depth determination by tomography of depth migrated gathers. Geophysics, 61, 1511-1523.

Langton, D., Biholar, A., Shaw, K., Adams, S., Bradshaw, M., Codd, J., Tan, X., Bartana, A. and Kessler, D. [2019]. Elastic imaging and its benefits – Permian Basin example. First Break, 69-77.

Jing, C., Singh, V., Custodio, D., Cha, Y. and Ross, W. [2017]. Benefits and applications of elastic reverse time migration in salt related imaging. SEG Annual Meeting, Expanded Abstracts.

Mifflin, C., Eddy, D., Wray, B., Zheng, L., Chazalnoel, N. and Huang, R. [2021]. Shenzi OBN: An imaging step change, The Leading Edge, 348-356.

Pacal, E., Stewart, R., Baysa,l E. and Yilmaz, O. [2015]. Seismic imaging with Ocean-bottom nodes (OBN): Mirror migration technique. SEG Annual Meeting, Expanded Abstracts.

Samec, P. and Blangy, J.P. [1992]. Viscoelastic attenuation, anisotropy, and AVO, Geophysics, 57, 441-450 https://doi.org/10.1190/1.1443258.

Stork, C. [1992]. Reflection tomography for the post-migrated domain Geophysics, 57, 680-692.

Tarantola, A. [2005]. Inverse problem theory and methods for model parameter estimation, SIAM.

Vigh, D., Kun, Xin Cheng, J., Dong, S. and Winston, L. [2016]. Earth-model building from shallow to deep with full-waveform inversion. The Leading Edge 2016, 35, 1025-1030.

FIRST BREAK I VOLUME 42 I MARCH 2024 63 SPECIAL TOPIC: RESERVOIR MONITORING
ONLINE LEARNING EDUCATION PACKAGES Education Packages 171x56.indd 1 09/02/2024 14:48 ADVERTISEMENT

Arabian Geologist Magazine

Seeks practical, readable articles that will appeal to technical professionals, non-technical, academics, decision makers, and government representatives alike. �e magazine aims to deliver scientific articles, Information, Events, and News to Arabian and International readers. If you are a writer passionate about Geosciences who wishes to share your innovative story, experiences, new scientific techniques and technologies with the world, then our Magazine is chance to get published and to inspire, educate and knowledge. If possible, articles should be in Arabic, but submissions in the English language are accepted.

Since 1977, Arabian Geologist Magazine has been passionate about providing Geosciences knowledge around the Middle East and world. �e magazine was a periodical formerly published in print Published by the Arab Geologists Association. Due to popular demand, issues of magazine are now available in print and downloadable digital format.

Sponsorship and advertising

Sponsorship Opportunities and Advertising Spaces are currently available. Expand your brand to a truly local and global audience. Advertising space and Sponsorship levels are available to fit any marketing campaign.

Companies, Geological organization, and Universities can submit technical and non-technical articles

CALL FOR ARTICLES
Author guidelines: www.arab-geologist.com Further details and submissions via: geoarabia_magazine@arab-geologist.com; Info@arab-geologist.com
See details on the topics and guidelines at www.arab-geologist.com

Opportunistic 4D using a regional non-repeated 4D monitor, an Ærfugl case study

D. Lecerf1*, S. Marinets1, S. de Pierrepont1, V. Zhelanov1, A. Tantsereva1, J. Oukili1, R. Milne2 and A. Stav2 demonstrate the benefits of including multi-client data to monitor production on a gas reservoir in the Norwegian Sea.

Introduction

It is not common practice to use multi-client datasets for a 4D monitoring project, as the 4D adage of ‘repeating the acquisition geometry’ is generally not satisfied.

Standard 4D time-lapse acquisitions require extra planning, specialised navigation equipment and strict repeatability constraints for sources and receivers. Multi-client surveys on the other hand are configured to cover extensive areas efficiently with relaxed positioning requirements. Combining both types of seismic surveys for a 4D project constitutes a technical challenge associated with uncertainties related to non-repeatability of the source and receiver positions.

In this case study, a multi-client dataset has been used opportunistically for monitoring the production of a gas field in the Norwegian Sea.

The Ærfugl field is approximately 60 km long and 2-3 km wide, with a stratigraphic pinch-out to the east (Figure 1). The field comprises a Cretaceous Lysing Formation reservoir of a partly confined turbidite system (Fugelli and Olsen, 2005; Hansen et al. 2021). A test producer P1 drilled in 2013 proved the presence of gas before the start-up of the first regular producer in 2020. In total, six wells were set on production in the period between 2019 to 2021. Prior to the 2022 multi-client survey, two conventional 4D surveys were acquired, in 2005 and 2017 respectively. Only minor

water flooding effects were interpreted on the 2017 data. However, as most of the production started after 2017, more 4D effects were expected by using the multi-client 2022 dataset as monitor two.

Despite the different geophysical objectives, the planned timing of the multi-client 2022 data acquisition was optimal for being integrated into this 4D reservoir production monitoring program where major production variabilities have been observed at the various wells after 2020. While the legacy 4D surveys (2005-2017) were optimised in terms of dual source and streamer geometry repeatability, the ‘4D opportunistic’ multi-client dataset was acquired with larger sail-line spacing and wide-tow triple source. The sail-line azimuth of the multi-client dataset was the only navigation feature in common with the baseline surveys, but no effort was made to match the shooting direction.

To understand and mitigate the risks related to such a non-repeated datasets, the project was executed in three phases, each dependent on the success of the previous stage:

1. Analysis of geometrical repeatability and 4D imaging risk assessment.

2. Multi-vintage 4D imaging on a subset of the full area, shared by the three datasets.

3. Extension of the area of interest covering the two last surveys (2017 and 2022).

1 PGS |

2 Aker BP

* Corresponding author, E-mail: Didier.Lecerf@pgs.com

DOI: 10.3997/1365-2397.fb2024024

FIRST BREAK I VOLUME 42 I MARCH 2024 65 SPECIAL TOPIC: RESERVOIR MONITORING
Figure 1 Top Lysing depth map onlapping the base reservoir depth surface. The attribute map is minimum amplitude extracted from an AVO fluid volume where warm colours indicate gas presence. Wells are shown in white, annotated with fluid contact information. (Hjellbakk et al. 2023).

Geometrical repeatability assessment

A repeatability study was carried out using only shot/receiver coordinates. Different 4D binning strategies were evaluated by analysing attribute maps. The most useful attributes for understanding geometrical differences were the sum of the source and receiver distances (dSdR) and the fold of coverage. Despite having the same acquisition azimuth for the three surveys involved, the 2022 survey was unfortunately acquired in the opposite direction for most of the area. Only a very small part was covered with data where the baseline and both monitor surveys were acquired in the same direction. This required that all the following 4D binning work utilised reciprocity of source and receivers. Although dSdR values were unconventionally high, up to 500 m for near offsets, it was decided to proceed with phase 2 and process a small area through a full 4D sequence.

Acquisition geometries of the three vintages

The baseline dataset was acquired in 2005. Conventional shallow hydrophone streamers were used for this acquisition. The first monitor survey was acquired in 2017, using deep towed multisen-

sor streamers. That survey was designed as a dedicated 4D acquisition aiming to repeat the baseline shot/receiver coordinates and using the identical dual source specifications.

In the summer of 2022, PGS acquired a multi-client program in the Norwegian Sea. The project was extended to the NorthEast to cover the Ærfugl field and to use the new dataset for 4D time-lapse purposes. The acquisition azimuth was altered by six degrees compared to the optimal 3D survey design to match the azimuth of the baseline survey. All other parameters were kept the same as for the multi-client acquisition. The 2022 acquisition is very different from the other two surveys as it features wide-tow triple source, deep-towed multi-sensor streamer technology, denser trace coverage, a larger streamer spread and shorter inline near offsets. Figure 2 describes the different acquisition designs involved. Figure 3 shows how well repeated the shot and receiver locations were in 2017. In this example two additional outer cables offer increased redundancy because the inner cables from the monitor dataset overlay the baseline exactly. On the other hand, it’s very difficult to find anything in common between 2005 and 2022 shot/receiver positions.

66 FIRST BREAK I VOLUME 42 I MARCH 2024 SPECIAL TOPIC: RESERVOIR MONITORING
Figure 2 Acquisition survey design scheme for the three surveys Figure 3 Source and receiver positions. 2005 (black) vs 2017 (red) repeated dual sources (A), dual sources 2005 (black) vs wide-towed triple sources 2022 (purple), non-repeated (B). (C) and (D) display the repeatability of the streamer geometry. The 2022 multi-client dataset was acquired mostly in the opposite direction.

Seismic sources for the 2005 and 2017 acquisitions were the same: two sources, 5085 cu.in. each, 6 m depth with 37.5 m source separation. The 2022 survey was, however, acquired with three sources, with a volume of 3280 cu.in. each, 7 m depth and source separation of 125 m (250 m total). The source set-up discrepancy was one of the 4D challenges for this reservoir monitoring project.

4D processing key steps

Several case studies of opportunistic 4D projects using a non-repeated dataset can be found in the literature. These were mostly conducted for reservoirs with a strong 4D signal. For example, on the Sleipner carbon capture and storage project, eclectic acquisitions have been used for monitoring the CO2 plume (Wierzchowska et al. 2021). More challenging examples include ocean bottom node vs streamer acquisition 4D projects (Detomo et al. 2012). In the Ærfugl case the 4D signal was expected to be very weak small amplitude difference and time-shifts less than 1 ms.

For this opportunistic 4D project, special care has been taken during the processing of the signal calibration, receiver deghosting, demultiple and denoise. All three datasets were reprocessed together from raw data to ensure the best repeatability in terms of processing sequences and algorithms.

Multiple attenuation

In addition to the 4D noise related to the acquisition geometry discrepancy, one of the 4D processing challenges was to reduce the impact of the multiples. The reservoir target reflection is practically invisible before demultiple/denoise (Figure 4) and the 4D signal was only observable post-migration (on a full stack).

Although the data are not located in very shallow water, multiples present a significant challenge. The water bottom two-way travel time is around 500 ms and the seabed is relatively hard, generating strong multiple reflections. The water bottom is highly rugose in some areas, which generates complex diffracted multiples. Various multiple models were generated for each vintage and the adaptive subtraction parametrisation was directly validated using 4D difference optimisation.

Spatial X-shift corrections

The uncertainties of acquisition positioning were investigated to optimise the multi-vintage 4D response. The process, called ‘X-shifts’ correction, uses spatial warping technology for computing relative image shifting between the vintages. The procedure is performed iteratively in the pre- and post-migration domain. The application to the data is made by moving in the crossline direction source and receiver coordinates prior to 4D binning. The spatial corrections are usually relative in conventional repeated 4D acquisition and the correction is applied using a reference survey.

In our case, the system provides several collocated measurements with similar and opposite acquisition directions. Consequently, it was possible to retrieve the X-shift corrections corresponding to each individual survey, without the need of survey reference. Therefore, the applied X-shifts minimises all image differences globally. The extracted spatial correction values were in the order of metres along the sail line (crossline direction).

4D binning

To compensate for the lack of repeatability for the second monitor survey, a pairwise 4D binning approach was chosen to give the optimum repeatability result for this multi-vintage 4D project (Brain et al., 2013). Different grids and different 4D binning strategies were tested. An expanded binning strategy on a 18.75 x 12.5 m grid was chosen keeping multiple traces per bin. The expanded 4D binning process allows seismic traces standing in adjacent bins to be paired in a 4D context. It was essential to preserve a maximum number of traces belonging to each survey to optimise the constructive interference in the migration stack process and reduce the 4D noise. The maximum dSdR at near offsets for the repeated surveys was 100 m, whereas for the non-repeated pairs the maximum dSdR approaches 500 m, which is relatively unconstrained.

Multi-vintage matching

The combination of dual source and triple source design, as well as various cable systems, geometries and depths provided a real challenge for calibrating the seismic signal in a 4D sense. The built-in broadband signal of both multi-sensor monitors has

FIRST BREAK I VOLUME 42 I MARCH 2024 67 SPECIAL TOPIC: RESERVOIR MONITORING
Figure 4 3D QC full angle stack. Monitor dataset 2022. Before demultiple (top), after demultiple (bottom). An arrow indicates a reservoir reflection.

been preserved by using wavefield separation and a re-datuming process. A deghosting operator was applied to the baseline dataset (2005) to extend the signal bandwidth, as closely as possible, to the two monitor datasets. To optimise the 4D broadband signal calibration, a multi-vintage matching algorithm was applied using individual signal-to-noise estimation (one operator per vintage). The multi-vintage matching process allowed us to better compute the signal-to-noise for each frequency and define a common ‘signal only’ spectrum used as the target. The matching process was effective for attenuating the residual ghost effect on the 2005 data and optimising various 4D seismic differences.

4D noise removal

Due to the geological setting, the data in this area are particularly noisy at the Lysing formation. The reservoir target reflection is very weak and there is little reflectivity around it, giving a low signal-to-noise ratio. Both the 4D and 3D noise represent a significant processing challenge. Application of a harsh denoise filter at the pre-migration stage was required. Another 4D denoise technique, called co-denoise, was beneficial in this case. The procedure uses combined datasets to design and apply frequency-domain predictive filters to attenuate random noise and preserve the 4D signal. The noise, which is coherent only on one dataset, will appear randomly in the combined version and then can be attenuated by the denoise procedure. Figure 5 shows the effective 4D denoise process which allows the recovery of the 4D signal at the reservoir level. The comparison before/after images includes all denoise processes in the post-imaging sequence.

4D observations and interpretation

Attribute extractions at target horizons are useful in 4D interpretation as they exhibit higher signal-to-noise ratios and can track time-lapse seismic changes. Normalised Root-Mean-Square (NRMS) of the seismic difference between baseline and monitor surveys is commonly used to quantify repeatability quality. 4D reservoir changes were assessed using the sum of positive amplitudes (SPA) and sum of negative amplitudes (SNA) of the 4D difference to track hardening and softening respectively.

The final results from the repeated 2005 versus 2017 datasets gave NRMS values in the target interval of 10%. NRMS values for non-repeated pairs, involving 2022 dataset, were 13% for 2017 versus 2022 and 15% for 2005 versus 2022. Overall, the level of 4D noise is higher on the non-repeated datasets, which was expected as repeating the source/receiver coordinates and source set-up will always give a lower 4D noise level. The level of 4D noise on the non-repeated datasets was, however, low enough to reveal an interpretable 4D signal. Another observation is that the 2022 dataset has a two percentage points better match against the 2017 than against the 2005 dataset. This might be explained by the fact that in the 2017 acquisition, deep-tow multi-sensor streamers were utilised, as was the case for 2022. In contrast single-hydrophone shallow cables were used in 2005.

The SPA attribute represents acoustic hardening effects related to gas production. Figure 6 shows that SPA maps are consistent for different vintage pairs, which gives reasonable confidence in the quality of the signal. The hardening patches which are visible on the 2017-2005 map, are present in different areas, but adjacent on the 2022-2017 map. Meanwhile, the SPA map from 2022-2005 combines the areas of hardening from both other vintage pairs. This is a scenario which would arise from a continual production of gas.

The final 4D products show both hardening and softening effects (respectively blue and red in Figure 7). The hardening is interpreted as a combination of pressure decline and water replacing gas. This agrees with the modelled 4D response (Figure 7A), where a weak hardening effect, due to pressure decline, can be seen at the well level, combined with a stronger hardening down-flank, related to water movement. The softening effects are interpreted as an increase in gas saturation below the initial gas-water contact. The increase in gas saturation could come from gas out of solution in the aquifer or local gas expansion as the pressure in the reservoir is decreasing. The 4D effects are close to the noise level in the data, but the availability of multiple monitors enables the interpreter to link the 4D effects between the different production periods and build confidence in the visible signal.

68 FIRST BREAK I VOLUME 42 I MARCH 2024 SPECIAL TOPIC: RESERVOIR MONITORING
Figure 5 Effect of the 4D denoise processes, left before and right after 4D denoise.

Discussion

This project evaluates if the acquisition repeatability constraints for 4D studies can be relaxed with the use of up-to-date 4D imaging technologies. It is challenging to answer this question positively as we can observe an increase of 4D noise levels when non-repeated acquisitions are involved. However, opportunistic 4D datasets can be beneficial if the acquisition time-lapse corresponds to critical reservoir production changes. The 4D imaging workflow requires that customised processes are designed, and special care is taken. In this example, there are several factors which have contributed to the success of the 4D project.

Firstly, it is essential that the communication between geophysicists, from the imaging provider and the field operator, takes place in a continuous way during the project. 4D objectives and well production information has been shared from the beginning and no blind tests have been performed. Continued discussion, between both parties, on the interpretation of the 4D results enables the tailoring of the 4D processes throughout

the sequences. For example, the level of the 4D noise to be considered during the denoise processes was constantly validated according to the remaining 4D signal understanding. Another key 4D process investigated and discussed was the final local matching for compensating the variation in acquisition geometry and source type. Such radical cross-equalisation should be avoided in a conventional 4D sequence, nevertheless the use of slowly spatially variable operator was beneficial when the 2022 multi-client dataset was involved in the final 4D difference. Again, interactions between interpreters and geophysicists were key for defining the optimum parametrisation.

Secondly, multi-vintage studies (more than two) allow us to link the 4D effects between the different production periods. Considering that the noise has no spatial consistency in the time-lapse domain, it is simpler to understand and validate complementary 4D effects using the relationship between the production periods baseline versus monitor 1 and the monitor 1 versus monitor 2. If the production starts before monitor 1, the

FIRST BREAK I VOLUME 42 I MARCH 2024 69 SPECIAL TOPIC: RESERVOIR MONITORING
Figure 6 4D attribute maps of the sum of positive amplitude (SPA) of the 4D difference for different pair vintages. SPA can be interpreted as hardening effect such as water replacing gas. Figure 7 Crossline section, A) the feasibility 4D model 2022-2005 B) 2005 3D stack C) 4D difference 2017-2005 D) 4D difference 2022-2017 E) 4D difference 2022-2005.

evolution of certain 4D signals can be predicted and interpreted even if the level of 4D noise is higher in one of the survey pairs. Then the 4D denoise processes can be calibrated for a 4D signal corresponding to a late production (after monitor 1).

In summary, adding more datasets in 4D projects can be helpful for understanding the observed reservoir production even if the extra dataset is not acquired in an ideal 4D-friendly way. However, repeating the acquisition is still an important requisite for increasing the 4D signal-to-noise and the reliability of the 4D interpretation.

Conclusions

This case study shows that multi-client datasets can be used in an opportunistic way for a better understanding of reservoir production in a time-lapse project. In this case, it was possible to retrieve an interpretable 4D signal even if the multi-client acquisition was only repeating the sail-line azimuth direction. Customised processes and special care must be considered for such projects for handling inherent discrepancy in the 4D signal-to-noise. Furthermore, continuous communication between geophysicists and 4D interpreters is key for validating every processing/imaging step. In the light of the initial 4D results of the study, it was decided to extend the area of interest from 500 km2 to 1000 km2 to cover the full extent of Ærfugl field.

Acknowledgements

The authors of the paper would like to thank Aker BP and licence

Wintershall Dea Norge AS and PGS for permission to publish this work.

References

Brain, J., Ligtendag, M. and Pi Alperin, J. [2013]. A simple method to optimize repeatability for multi-vintage 4D projects. 75th Conference & Exhibition, EAGE, Extended Abstracts, Th 11 04.

Detomo, R., Jr., Quadt, E., Pirmez, C., Mbah, R. and Olotu, S. [2012]. Ocean Bottom Node Seismic: Learnings from Bonga, Deepwater Offshore Nigeria. SEG Technical Program Expanded Abstracts 2012.

Fugelli, E.M.G., and Olsen T.R. [2005]. Screening for deep-marine reservoirs in frontier basins: Part 1 — Examples from offshore mid-Norway. AAPG Bulletin, 89(7) (July 2005), 853882.

Hjellbakk, A., Stav, A., Ciccarelli, J., Mirza D. and Milner, P.S. [2023]. The Ærfugl Gas Field: Impact of reservoir zonation and compartmentalisation on water production. 84th EAGE Annual Conference & Exhibition, Jun 2023, Volume 2023, 1-5.

Hansen, L.A.S., Hodgson, D.M., Pontén, A., Thrana, C. and Latre, A.O. [2021]. Mixed axial and transverse deep-water systems: The Cretaceous post-rift Lysing Formation, offshore. Norway. Basin Research, 33(4), 2229-2251.

Wierzchowska M., Alnes H., Oukili J., Otterbein C., [2021]. Broadband processing improves 4D repeatability and resolution at the Sleipner CO2 storage project, North Sea. 82nd EAGE Annual Conference &

70 FIRST BREAK I VOLUME 42 I MARCH 2024 SPECIAL TOPIC: RESERVOIR MONITORING
WWW.PRESALTRESERVOIR2024.ORG 17-19 SEPTEMBER 2024 RIO DE JANEIRO, BRAZIL CALL FOR ABSTRACTS OPEN! PSB24 V2H.indd 1 30/01/2024 09:51 ADVERTISEMENT

Monitoring CO2 storage in the Morecambe depleted gas reservoirs through seafloor deformation and time-lapse gravimetry measurements

Filipe Borges2, Helen Basford1, Tom Calder1, Martha Lien2*, Siri C. Vassvåg2 and Chris Ward1 assess the effectiveness of time-lapse gravimetry and seabed deformation measurements in contributing to conformance, containment, and contingency for the Morecambe carbon storage project.

Introduction

In 2023, carbon storage licence CS010 was awarded to Spirit Energy to enable the Morecambe gas fields, in the UK Continental Shelf (UKCS), to be appraised for repurposing into high-capacity Carbon Capture and Storage (CCS) sites. Regulations for geological storage of CO2 require confirmation that the storage site can be monitored over the project life and that the selected appropriate monitoring tools should ‘detect the presence, location, and migration paths of CO2 in the subsurface and at surface.’ (European Union, 2009; Schütz and Omar, 2023).

The current concept of the carbon storage plan for the Morecambe fields is to inject CO2 in the gas phase. Over time the CO2 is expected to mix with residual gas and slowly dissolve into the underlying brine. The presence of depleted natural gas limits the seismic acoustic response of injected CO2, restricting the effectiveness of 4D seismic as a method for monitoring. Additionally, seismic operations with active sources in the Morecambe fields are strongly constrained by offshore infrastructure, including a planned windfarm above a part of the storage site (Figure 1).

The large expected changes in fluid density caused by CO2 injection in a depleted gas field and the relatively shallow reservoirs suggest that seafloor gravimetry would be an effective monitoring technology for Morecambe fields. Furthermore, the field-wide re-pressurisation due to the injection has the potential to cause seabed uplift. If accurately measured over the field, uplift can be used to calibrate geomechanical models and ensure longterm performance and conformance of underground CO2 storage.

In this work, we assess the effectiveness of time-lapse gravimetry and seabed deformation measurements in contributing to conformance, containment, and contingency for the Morecambe carbon storage project. The evaluation utilises dynamic flow simulations of CO2 injection and forward-modelling of gravity and seabed displacement. The results show that time-lapse gravimetry monitoring can measure not only the advance of the underground CO2 plume but also eventual deviations from the baseline scenario, therefore providing key information for conformance and monitoring in this project.

The Morecambe fields

The Morecambe gas fields (North Morecambe and South Morecambe) are located in Morecambe Bay in the UKCS and represent a significant natural gas production asset in the UK. South Morecambe alone has produced more than 5 Tcf of gas since 1985 (Inglis et al., 2023). The reservoir, a Triassic Sherwood Sandstone, is located 700-1100 m below mudline at very shallow water depths (ca. 30 m). It is overlain by multiple seals within the Triassic Mercia Mudstone Group, with alternating layers of halite and mudstones (Figure 2). After almost four decades of gas

FIRST BREAK I VOLUME 42 I MARCH 2024 71 SPECIAL TOPIC: RESERVOIR MONITORING 1 Spirit Energy | 2 Reach Subsea * Corresponding author, E-mail: martha.lien@reachsubsea.com DOI: 10.3997/1365-2397.fb2024025
Figure 1 Map of existing and planned infrastructure in the Morecambe area, including a future windfarm. The Morecambe CCS licence (CS010) is highlighted in blue.

production, the Morecambe fields are now significantly depleted, with reservoir pressures anticipated to be around 10 bar when CO2 injection starts.

Seafloor gravimetry and vertical deformation monitoring: a retrospective

view

In the monitoring method considered in this work, seabed gravity and vertical seabed deformation are measured simultaneously using a relatively small vessel equipped with a remotely operated vehicle (ROV), offering flexible survey design and efficient operation, unconstrained by most offshore infrastructure. To ensure time-lapse repeatability, measurements are performed at a set of locations defined by pre-defined concrete pads.

The first survey utilising this technology for hydrocarbon production monitoring was performed in 1998 at the Troll gas field in Norway (Eiken et al., 2008). The motivation was to cover the gap between the information acquired from well measurements (well pressures, flow rates) and the fluid

Morecambe and 15 years of injection

North Morecambe. The lines in

on the rightmost plot represent the contour levels of the gravity signal, with the line in yellow indicating the accuracy level of 1 µGal.

dynamics across the field – particularly the aquifer connected to the production zone. Time-lapse gravity changes are an of fluid mass changes in the subsurface. Analogously, vertical seabed displacement is also an observable of reservoir deformation, caused by either pressure depletion or fluid injection. Hence, mapping the seabed movement can provide valuable information on key reservoir properties such as rock compressibility and the evolution of pore pressure (Ruiz et al., 2020).

Time-lapse gravimetry and vertical deformation monitoring have become a key reservoir monitoring tool for many gas reservoirs. For many large gas fields in Norway, this technology is preferred over 4D seismic (Solbu et al., 2023, Ruiz et al. 2020). In addition to all major Norwegian gas fields, the technology has also been applied at the two carbon storage sites on the Norwegian continental shelf: Sleipner (Alnes et al., 2011) and Snøhvit (Ruiz et al., 2020). However, both these storage sites are initially brine-filled aquifers and, to date, 4D gravimetry has not been applied for monitoring CO2 storage in depleted gas reservoirs.

72 FIRST BREAK I VOLUME 42 I MARCH 2024 SPECIAL TOPIC: RESERVOIR MONITORING
Figure 2 Cross section through the North and South Morecambe storage sites. From Inglis et al. (2023). Figure 3 Map views of mass change per area (left) and modelled time-lapse gravity change (right) between the 20 th and the 21st years of CO2 injection. This represents 20 years of injection into South into red

The accuracy in time-lapse gravimetry changes assumed in this work is circa 1 μGal, corresponding to the state of the art in terms of available technologies (Solbu et al., 2023). This is one-billionth of the average gravity field at the Earth’s surface, and two orders of magnitude better than what is obtained from shipborne instruments. The state-of-the-art accuracy for monitoring vertical deformation of the seabed using this technology is 2 mm.

Modelling and results

The gravity modelling for the Morecambe fields uses a dynamic simulation model describing CO2 injection in multiple wells, with a total rate of 7 Mtpa (South Morecambe) and 9 Mtpa (North Morecambe). The model is based on a compositional representation of the fluids in the pore space. To model time-lapse gravity changes, the mass changes at the grid cells are used to forward-model the expected response on the seafloor by using Newton’s law.

positive gravity response caused mainly by the CO2 mixing with the residual methane in the pore space. The time-lapse gravity signal in the North Morecambe area is stronger and more spatially localised, when compared to South Morecambe. This is due to the greater injected CO2 mass and smaller pore volume in North Morecambe, as the mass change map shows. The magnitude of the time-lapse gravity in both storage sites is well above the accuracy of 1 µGal. Note that the gravity change map delineates the movement of the CO2 plume underground.

To assess the feasibility of detecting the highly unlikely scenario of a possible CO2 movement out of the storage site, a scenario modelling CO2 migration to shallow, brine-saturated layers was performed. Pooling of CO2 at 500 m depth within a hypothetical permeable interval in the Blackpool Mudstone (Figure 2) represents a scenario of secondary containment within the storage complex. Identifying the occurrence of such secondary containment would help to improve storage

100 kton of CO2 to a layer at 500 m depth. The

1 µGal.

FIRST BREAK I VOLUME 42 I MARCH 2024 73 SPECIAL TOPIC: RESERVOIR MONITORING
Figure 3 shows the mass change and the total gravity change for a single year of injection. We observe a significant Figure 4 Map views of mass change per area (left) and modelled time-lapse gravity change (right) between the 20 th and the 21st years of CO2 injection (this represents 20 years of injection into South Morecambe and 15 years of injection into North Morecambe), including the migration of lines in red on the rightmost plot represent the contour levels of the gravity signal, with the line in yellow indicating the uncertainty level of Figure 5 Map views of seabed displacement for the baseline scenario (left) and the effect of a scenario of pressurisation of a shallow layer (right). The lines in red represent the contour levels of seabed displacement. A positive polarity indicates seabed uplift.

management in terms of mass balance and seal capacity as well as risk management.

The scenario for migration out of the storage site, such as via a well or fault, was modelled for the South Morecambe area, initiating in the 20th year after injection begins, when reservoir pressure exceeds hydrostatic pressure. A total of 100 kilotons of CO2 is assumed to have migrated. Figure 4 shows the resulting modelled mass change and gravity signal. In contrast to the situation in the targeted reservoir, where CO2 and methane mix, in the shallow layer the CO2 replaces a denser fluid (brine), and therefore the time-lapse gravity will be negative due to a reduced fluid density. Note the opposite sign of the two signals, in addition to the smaller lateral extent of the signal from the confined, shallower secondary plume. This gravity signal of the shallower layer has an intensity of 3-4 µGal and extends for 1-2 km, placing it well within the detectability threshold of the available technology.

In addition to gravity changes, the seabed displacement due to reservoir pressurisation was also modelled, using Van Opstal’s nucleus-of-strain model (Van Opstal, 1974). Figure 5 shows the results of the expected uplift, for both the base scenario and the shallow migration scenario. For the latter, a 0.5 bar increase in pore pressure was assumed for the shallow layer. As with the gravimetry signal, the estimated seabed displacement caused by CO2 injection is well within the threshold of detectability (2-3 mm). The effect of a 0.5 bar pressurisation of a shallow layer is slightly above one millimeter, and it seems unlikely to be detected from uplift measurements alone. However, the modelled seabed uplift scales linearly with the pressure increase in the shallow layer: a 2-bar increase would produce an uplift of about half a centimetre, which is detectable with the stateof-the-art monitoring solution that we consider here (Solbu et al., 2023). As a reference, the modelled subsidence caused by field depletion during production is 30-40 cm, while the uplift expected during the lifetime of the carbon storage project (30 years of injection) is circa 25 cm.

Sensitivity analysis – detection of CO2 migration to a shallow layer

There are a variety of scenarios that could be considered as potential conformance deviations. This poses a challenge in terms of modelling their effects and understanding our potential to identify them. To address this complexity, a sensitivity analysis was performed. The goal of the analysis is to assess the thresholds for identifying the smallest CO2 mass and the slightest increments in pressure within a shallow layer that could be reliably detected. By establishing these minimum detectable limits, we gain insights into the effectiveness of monitoring strategies for this carbon storage project. For this analysis, we assume that an eventual migration of CO2 to a shallow permeable formation would fill this layer following a radial pattern, where the less dense CO2 would occupy the upper parts of the layer due to buoyancy, and the pressure increase would extend longer than the saturation change. These are simplifying assumptions, but they have been observed in similar situations of gas migration to shallow layers (Langseth et al., 2012; Landrø et al., 2019).

a shallow layer by 1 bar, for different layer depths and pressurisation radii. The uncertainty level of the technological solution considered in this work is 2 mm. The black dot represents the depth of the layer selected for modelling. The thick black arrows illustrate that the expected seabed uplift increases when the radius of the pressurised zone increases, and it is stronger for shallower layers.

Figure 6 shows the modelled time-lapse gravity signal for the migration of CO2 to a shallow layer, as a function of the migrated mass and the depth of the layer. The hypothesis is that a volume of CO2 equivalent to 40% of the pore space migrates to the shallow layer. Part of this volume (30%) displaces the brine originally in place, and the rest (10%) is dissolved in the brine, representing the different trapping mechanisms for CO2 (Podbojec et al., 2016). The values shown on the plot represent the maximum gravity signal, observed by a measurement above the centre of the CO2 plume. Due to the shallow depths, the contrast between the densities of CO2 and water, and the high accuracy of the gravity measurements, the migration of as low as 30-50 kton of CO2 could potentially be identified in time-lapse gravity measurements.

Figure 7 presents a similar analysis but for of a shallow layer. Because the pressure increase is not directly related to the amount of migrated CO2, the results are plotted as a function of ‘pressurized radius’, which represents the radial distance from the migration path, in an analogy to the effective radius in a radial flow from/to a well. In the model used for this analysis, the seabed deformation is proportional to the variation in pore volume of the pressurised zone, which in turn is proportional to the change in pore pressure. Therefore, the resulting uplift scales

74 FIRST BREAK I VOLUME 42 I MARCH 2024 SPECIAL TOPIC: RESERVOIR MONITORING
Figure 6 Time-lapse gravity signal (in µGal) for CO2 migration to a shallow layer, for different layer depths and amounts of CO2. The red line at 1 μGal indicates the uncertainty level of the technological solution considered in this work, below which a gravity signal would likely not be detected. Figure 7 Vertical seabed displacement (in mm) caused by pressurisation of

directly with pressure change, and the sensitivity is presented in units of millimeters per bar. As in the plot for gravity (Figure 6), the value represents the seabed displacement measured above the centre of the ‘pressure plume’. The results suggest that a shallow pore pressure increase as low as a few bar could also be identified by measuring seabed displacement with the state-of-the-art accuracy of 2 mm.

Conclusions

Modelling results show that time-lapse gravimetry and seafloor deformation monitoring would be effective tools as part of an overall monitoring plan to enable mapping of the CO2 saturation front within the proposed Morecambe depleted gas storage sites.

Highly significant gravity signals are expected after periods as short as a few months and will be detectable within realistic time intervals needed for monitoring a carbon storage complex. It is anticipated that integration with pre-injection, high-resolution 3D seismic data will provide the spatial resolution to enable accurate CO2 plume monitoring from the gravity signal difference between the expected and modelled responses.

Additionally, dedicated modelling shows that time-lapse gravimetry can monitor if there is a migration of small amounts of CO2 out of the storage site into secondary stores within the storage complex, in a timely manner. The early detection of small deviations from the baseline scenario will facilitate investigation of the causes (e.g. acquisition of additional data, targeted at the issue in question) and allow mitigations to be implemented from the corrective measures plan.

With a competitive cost and the capability of operating in highly obstructed areas, time-lapse gravimetry is valuable for mapping the mass changes within the reservoir and stands out as a solution that, together with other surface and borehole monitoring methods, will contribute to support conformance, containment, and contingency in carbon storage projects.

References

Alnes, H., Eiken, O., Nooner, S., Sasagawa, G., Stenvold, T. and Zumberge, M. [2011]. Results from Sleipner gravity monitoring: Updated density and temperature distribution of the CO2 plume. Energy Procedia, 4, 5504-5511.

Eiken, O., Stenvold, T., Zumberge, M., Alnes, H. and Sasagawa, G. [2008]. Gravimetric monitoring of gas production from the Troll field. Geophysics, 73(6), WA149-WA154.

European Union. Directive 2009/28/EC of the European Parliament and of the Council of 23 April 2009 on the promotion of the use of energy from renewable sources and amending and subsequently repealing Directives 2001/77/EC and 2003/30/EC. Official Journal of the European Union, 5, 2009.

Inglis, C., Calder, T. and Ward, C. [2023] June. An Evaluation of the South Morecambe Depleted Gas Field as a Carbon Dioxide Storage Site. In 84th EAGE Annual Conference & Exhibition (Vol. 2023, 1, 1-5). European Association of Geoscientists & Engineers.

Landrø, M., Wehner, D., Vedvik, N., Ringrose, P., Løhre, N. L. and Berteussen, K. [2019]. Gas flow through shallow sediments — A case study using passive and active seismic field data. International Journal of Greenhouse Gas Control, 87, 121-133.

Langseth, E. and Landrø, M. [2012]. Time-lapse 2D interpretation of gas migration in shallow sand layers–Compared to reservoir simulation. International Journal of Greenhouse Gas Control, 10, 389-396.

Podbojec, M. and Cvetković, M. [2016]. Preliminary estimate of CO2 storage capacity by petrophysical modelling in Upper Miocene Poljana Sandstones in the western part of the Sava Depression. Rudarsko-geološko-naftni zbornik, 31(1), 31-43.

Ruiz, H., Seregin, A., Skogly, O. P., Libak, A. and Lien, M. [2020, December]. Accurate Measurement of Seabed Subsidence at the Ormen Lange Field. In EAGE 2020 Annual Conference & Exhibition Online (Vol. 2020, 1, 1-5). European Association of Geoscientists & Engineers.

Ruiz, H., Lien, M., Vatshelle, M., Alnes, H., Haverl, M. and Sørensen, H. [2022]. Monitoring the Snøhvit gas field using seabed gravimetry and subsidence. First Break, 40(3), 93-96.

Schütz, S. E. and Omar, A. [2023]. Report on regulations and technological capabilities for monitoring CO2 storage sites.

Solbu, Ø. H., Nyvoll, A., Alnes, H., Vassvåg, S. C., Lien, M. and Ruiz, H. [2023]. Time-Lapse Gravity and Subsidence Applied in History Matching of a Gas-Condensate Field. First Break, 41(9), 69-74.

Van Opstal, G.H.C. [1974]. The effect of base-rock rigidity on subsidence due to reservoir compaction. Proc. 3rd Congr. Int. Soc. Rock Mech, 2, 1102-1111.

FIRST BREAK I VOLUME 42 I MARCH 2024 75 SPECIAL TOPIC: RESERVOIR MONITORING
As an EAGE member, you have free online access to a journal of your own choice. But did you know that it is also possible to subscribe to other EAGE scientific journals for an additional fee? Benefit from an additional journal subscription! FOR MORE INFORMATION PLEASE VISIT EAGE.ORG/MEMBERSHIP ABSTRACT SUBMISSION LAST CALL! DEADLINE: 15 JANUARY 2024 OSLO NORWAY 2024 SUBMIT NOW! WWW.EAGEANNUAL.ORG Machine learning for petrophysical modelling SPECIAL TOPIC Land Seismic Petroleum Geoscience Geoenergy Journal Scientific journals 171x60.indd 1 13/02/2024 08:09 ADVERTISEMENT
BOOK YOUR SPOT BY REGISTERING TODAY! REGULAR REGISTRATION ENDS ON 20 MARCH 2024 WWW.EAGEGEOTECH.ORG DISTRIBUTED FIBRE OPTIC SENSING WORKSHOP MAIN SPONSOR 4th EAGE Workshop on Practical Reservoir Monitoring 4th EAGE Workshop on Distributed Fibre Optic Sensing Combining Multiple Technical Streams for One Amazing Multidisciplinary Programme! 8-10 APRIL 2024 I THE HAGUE, THE NETHERLANDS

A distributed fibre-optic sensing monitoring platform for CCUS

Michael Mondanos1*, Pierpaolo Marchesini1, Anna Stork1, Carlos Maldaner1, Garth Naldrett1 and Thomas Coleman1, present a measurement, monitoring and verification (MMV) framework for CCUS.

Introduction

Carbon Capture, Utilisation and Storage (CCUS) is expected to play a crucial role in reducing CO2 emissions and meeting global climate targets. Leading organisations including the International Energy Agency (IEA), International Renewable Energy Agency (IRENA), and Intergovernmental Panel on Climate Change (IPCC) have all produced long-term energy outlooks that rely on a rapid expansion of CCUS in order to limit global temperature rise to 1.5°C.

Carbon Capture and Storage (CCS) technology offers an opportunity to prevent CO2 emissions to the atmosphere by capturing and injecting it underground in depleted oil and gas fields, coalbeds, or saline geological formations where it is securely stored (Figure 1). There are three main requirements for a geological formation to be suitable for CO2 storage: high-volume capacity, good injectivity, and CO2 containment provided by overlying caprock formations.

To reach a 1 Gt CO2/year of global capture capacity by 2030, in line with the net-zero emissions scenario, would require on average 160 Mt CO2/year of capture capacity and 140 Mt CO2/year of storage capacity to start the planning

stage each year until 2026 (IEA Net Zero Roadmap). Regulatory frameworks governing geological CO2 storage are being developed worldwide and the rapid acceleration in the number of large-scale CCS projects will require additional policy support for site-specific technologies. This includes measures to encourage investment in key enabling infrastructure such as CO2 storage facilities, demonstration and commercialisation of emerging technologies, and creation of a larger global market for low-emission products.

A series of monitoring requirements exists during CO2 injection operations. These requirements focus on mitigating risks arising from the injection of large volumes of CO2 under high pressure in deep reservoirs. The evaluation of storage performance and containment is captured under a Measurement, Monitoring and Verification (MMV) framework.

The main risks identified and illustrated in Figure 2 are:

• Migration of CO2 along faults and fractures.

• Migration of CO2 plume outside of the storage reservoir.

• Induced seismicity.

• Interactions with, or impacts on, other natural resources such as drinking water or hydrocarbons.

1 Silixa

* Corresponding author, E-mail: michael.mondanos@silixa.com

DOI: 10.3997/1365-2397.fb2024026

FIRST BREAK I VOLUME 42 I MARCH 2024 77 SPECIAL TOPIC: RESERVOIR MONITORING
Figure 1 Illustration of permanent storage options for CO2 in depleted oil and gas fields or in deep saline geological formations.

Identifying potential risks during site characterisation, baseline, or subsequent monitoring operations allows targeted actions to mitigate the impact of identified risks or to prevent their occurrence. During CO2 injection operations and after site closure, the stored CO2 and the decommissioned injection infrastructure should be monitored for the following reasons:

• Conformance monitoring: to ensure the CO2 plume distribution and migration is tracked and understood.

• Containment monitoring: to ensure that injected CO2 remains within the storage formation.

• Contingency monitoring: to ensure that the contingency measures to stop movement of CO2 out of the storage formation are performing according to their design and requirements.

Distributed fire-optic sensing

Distributed fibre-optic sensing (DFOS) based survey methods focus on near surface and subsurface monitoring. These methods can greatly enhance the spatial and temporal resolution of the data acquired over the full lifecycle of a project, while reducing overall monitoring costs, improving data quality, and increasing asset longevity when compared to standard solutions which use point sensors such as geophones or downhole temperature and pressure gauges. Monitoring can also be carried out utilising permanent fibre-optic cables typically installed behind casing which limits the risk and cost of intervention while also providing spatio-temporally continuous sensory capability which is not feasible using alternative permanent sensors.

DFOS solutions can be used to characterise site specific temperature, strain and seismic baselines, and enable monitoring of the injection and post-injection activities due to the long-life expectancy of the optical fibres in the downhole cable. Applications include CO2 plume distribution monitoring based on time-lapse vertical seismic profiling (VSP) surveys (e.g., Pevzner et al. 2021; White et al., 2019); microseismic monitoring for natural baseline and induced seismic activity (e.g., Stork et al., 2022); and temperature and acoustic monitoring for well integrity applications (e.g., Ricard, 2020). The system can run autonomously and continuously, and it is compatible with permanent seismic sources located at fixed positions (Isaenkov et al., 2021). Additionally, as the optical fibre is the sensor, there is minimum maintenance requirement and low risk for failure.

Permanent CO2 storage monitoring system

The development of a permanent and proven distributed sensing-based monitoring system, the Carina Carbon Secure system, provides a solution that reduces CCS monitoring costs throughout the lifetime of a project. With minimal environmental impact, the system provides a reliable autonomous and continuous or on-demand monitoring solution for both offshore and on land projects. It ensures CO2 injection safety and long-term MMV capabilities for efficient management of the storage reservoir. Apart from the numerous operational benefits, the system also has the potential to facilitate faster CCS adoption by the industry and society. An illustration of an onshore CCS monitoring system is given in Figure 3.

Fibre-optic cables are permanently deployed in boreholes to provide on-demand surveys and long-term monitoring capabilities. High-quality distributed acoustic sensing (DAS) data, with up to 20 dB noise floor improvement over standard DAS data are provided by the engineered Constellation fibre. The unique fidelity of this system provides the capability to acquire repeatable active seismic data and record small microseismic events with improved signal-to- noise ratio (SNR). Continuous and real-time microseismic monitoring delivers a detailed picture of seismicity than traditional technologies to mitigate potential seismic hazards. Given the system’s extreme sensitivity, active seismic surveys can be efficiently conducted with smaller seismic sources or fewer stacks providing early warning of potential CO2 leakage pathways. Wellbore integrity and plume breakthrough can also be monitored with Distributed Temperature Sensing (DTS), DAS configured with a high sampling frequency and Distributed Strain Sensing (DSS) systems on the same fibre-optic cable.

Real-time data processing conducted using an edge processing platform maximises the on-site processing capabilities and operational flexibility. The approach allows for remote and efficient QC/QA, data analysis, and multi-physics data integration and avoids high bandwidth requirements for offsite data transmission. The DAS, DTS and DSS interrogators can run continuously or be activated at specific times to perform on-demand surveys. When acquisition is performed without supervision, a log of performance metrics (Key Performance Indicators, KPIs) is kept and displayed. Advanced functionality includes alarms and notifications if necessary.

78 FIRST BREAK I VOLUME 42 I MARCH 2024 SPECIAL TOPIC: RESERVOIR MONITORING
Figure 2 Risks arising from the injection of CO2

Data bandwith, resolution, and processing requirements are determined by the applications deployed for the specific site. The processing modules are grouped in nodes to process data received from the relevant interrogator units. If a unit is used for multiple operations, then it must be configured to accommodate different set up parameters under a scheduler operation. Potentially, there may be different acquisition settings for a single interrogator depending on the applications.

One of the first DFOS autonomous systems for CO2 storage monitoring was implemented at the CO2CRC Otway Project in Australia, and the preliminary results have been published by Isaenkov et al. (2021). This monitoring system includes fibre-optic cables deployed in multiple boreholes extending across the injection interval and also trenched on surface. Combined with permanent Surface Orbital Vibrator (SOV) seismic sources, the DFOS system has provided near-continuous monitoring of injected CO2. Isaenkov et al. (2021) highlighted that the ‘monitoring system allows acquisition of seismic vintages every two days in an automated manner. The permanent installation requires no human effort on-site and thus drastically reduces the monitoring cost’. The system has operated continuously for months at a time over several years. The best measurement performance has been achieved with cables cemented behind casing, but other installations with the fibre-optic cables on tubing and suspended have shown near comparable performance. The introduction of the optical fibre monitoring system has been estimated to have a 75% cost saving, and a substantial reduction of CO2 emissions, over traditional monitoring technologies.

A significant number of offshore CO2 storage projects are under development, and it is expected that the number of these projects will grow rapidly in the coming years (Global CCS Institute, 2023). In addition to the cost and emissions reduction, a further benefit of permanent monitoring is the reduced personnel required on site. While several offshore production platforms have DFOS monitoring systems installed, the monitoring of subsea wells has only recently become feasible. By using an engineered fibre with high optical scattering in the subsea well the interrogator unit can be located onshore, or on a host Floating

Production Storage and Offloading (FPSO) or platform and connected to the subsea well via standard umbilicals. Operating through standard single mode fibres and remotely operated vehicle (ROV) wet mate connectors in the umbilical, few modifications and no customisation is required to standard equipment. Reliability is also ensured by using qualified, field-proven technologies. As the interrogator is located on the host facility it reduces installation costs, simplifies data transfer, allows system upgrades over the installed life, improves reliability, and reduces power and communication interface requirements within the subsea production system.

Such offshore monitoring systems have been successfully installed in several deepwater wells in the Gulf of Mexico, as well as the North Sea. In February 2023, bp presented the results of its first deepwater DAS 3D seismic acquisition, showing a significant enhancement in frequency content and resolution at the target and better ties to the well log, compared to the surface seismic (Soulas et al., 2022). In the context of CO2 injection this improvement would allow for higher resolution timelapse imaging of the CO2 plume.

Edge processing monitoring platform

In general settings, a permanent real-time monitoring system for CCS consists of a network of optical fibre cables installed in the injection and monitoring wells and a processing platform where operations are performed onsite at the edge of the system, and results can be accessed remotely and transferred over the network (Edge-based architecture). Figure 4 shows the system architecture with two monitoring and one injection well and also a mesh of fibre cables installed in the near surface.

An extensive geophysical monitoring programme is necessary to demonstrate plume containment and conformance. High survey costs and increased temporal resolution requirements are driving the development of continuous or on-demand reservoir monitoring techniques that allow for cost-effective, autonomous, and remotely managed operations. The large data volume produced requires on-site processing capabilities to minimise data volumes transfer to off-site locations.

FIRST BREAK I VOLUME 42 I MARCH 2024 79 SPECIAL TOPIC: RESERVOIR MONITORING
Figure 3 Integrated and autonomous fibre-optic distributed sensing monitoring system for CCS projects.

The autonomous monitoring system produces microseismic event catalogues, flow profiles, and wellbore integrity analyses in real-time using an Edge processing architecture to avoid high bandwidth requirements for offsite data transmission and limiting raw acoustic data storage requirements. Combined with geomechanical deformation, wellbore integrity and leaks, thermal response, and cross-well applications enabled, a permanent reservoir monitoring programme to be employed. Seismic shot extraction and pre-processing of active survey data can also be performed in the Edge system on-demand. The processed data and results are made available on a cloud server, can be accessed on cloud services, or transferred offsite while the user can remotely operate the equipment and schedule the monitoring scheme.

The monitoring system can be enhanced with permanent seismic sources and DFOS receivers within an architecture based on Edge processing maximising the in-situ processing power and operational flexibility. It allows remote and efficient QC/QA, data analysis, and multi-physics data integration. The approach is attractive to operators due to cost-effective deployments, less time-consuming operations, superior spatial coverage, enhanced data quality compared to conventional technology, and it represents the next step towards affordable and truly continuous reservoir monitoring for CCS.

Plume monitoring

Tracking the CO2 plume over time is important task in any CCS MMV program. Changes in the seismic response to a CO2 plume can be monitored and assessed by time-lapse seismic surveys. Images of the subsurface are generated through either 3D VSP, multiple 3D surface, or 2D cross-well surveys to track and quantify the migration of plume over time. Distributed fibre-optic sensing methods provide denser spatial coverage compared to standard methods, decreased acquisition costs without com-

promising on data quality, and enhanced data repeatability to allow imaging of CO2 plume distribution and saturation around injection and monitoring wells.

Pevzner et al. (2021) show how a small volume CO2 injection (15 kT) can be monitored with time-lapse DAS VSP surveys using permanently installed surface orbital vibrators (SOV) and fibre-optic cable cemented behind the casing. Having both source and receivers permanently installed enables us to perform VSP surveys more frequently with low costs providing early detection of CO2 plume, tracking the rapid distribution changes and monitoring potential leakages out of the target reservoir. Other recent examples of SOV DAS-VSP surveys have provided comparable results to conventional timelapse seismic with vibroseis and geophones (Correa et al., 2018; Yavuz et al., 2021).

The CO2 plume evolution over time at the CO2CRC Otway project after several injection stages from March 2017 to March 2021 is shown Figure 5 (Glubokovskikh et al. 2022). The plume boundaries were generated by picking the P-wave first arrivals. A fluid-induced microseismic event at reservoir depth is also shown relatively close to the plumes.

In Pevzner et al. (2022), the simultaneous analysis of travel time shifts and amplitude variations in DAS-VSP settings allows not only to delineate the presence of the CO2 plume at early stages but also to formulate observations on its characteristics as it is forming. Thanks to its relatively low cost, 4D VSP with DAS is an attractive proposition for frequent seismic monitoring around monitoring and injection wells.

Wellbore integrity

CCS MMV programs required demonstration of wellbore integrity by proving that any CO2 is escaping to shallow geological formations. DTS and DAS can provide the dataset required to prove

80 FIRST BREAK I VOLUME 42 I MARCH 2024 SPECIAL TOPIC: RESERVOIR MONITORING
Figure 4 Edge-based architecture for remote, automated, and real-time systems for CCS projects.

integrity of the injection system. The temperature difference between the injected CO2 and the reservoir temperature serves as a tracer to indicate locations of (either intended or accidental) CO2 flow along the wellbore (Figure 6a). Temperature data from DTS systems can also be collected continuously to monitor the status of cement location and quality during cementation of the casing (Figure 6b). The dense receiver coverage provided by fibre-optic cables allows capturing temperature anomalies with sub-metre resolution (down to 25 cm).

In addition to DTS, the flow of high-pressure fluids through well perforations has a well-defined acoustic signature that can be captured using high-frequency DAS surveys. Acoustic data can be monitored with high-resolution for the onset and evolution of such flow signals. The location of potential leakage is easily identifiable in the acoustic data, and the flow can be parameterised by the power distribution of the frequency spectrum. The information can be coupled with DTS information to refine and characterise any leakage signature (Figure 7).

Reservoir deformation due to the pressure build up can also be assessed using DAS and DSS methods to inform about wellbore integrity and minimise the risks associated with casing failure during and post injection.

By detecting anomalies or unexpected increases in regions of the wellbore with DTS, DAS, and DSS, it is possible to identify and locate leaks within the borehole with high-resolution and in real time. If readings occur outside the expected range, alarms are sent to the operators to assess the data and take any required actions.

Microseismic monitoring

Induced seismicity can occur due to an increase in stress on pre-existing faults or because of lubrication of faults due to increases in pore pressure. Reactivation of faults could result in leakage pathways for CO2 and lead to potential migration of CO2 and native fluids to the shallow subsurface.

Microseismic monitoring as a tool for fracture network characterisation and imaging developed with the rise in hydraulic

FIRST BREAK I VOLUME 42 I MARCH 2024 81 SPECIAL TOPIC: RESERVOIR MONITORING
Figure 5 Evolution thought injection stages of CO2 plume boundaries delineated from P-wave travel time (modified from Glubokovskikh et al., 2022). Figure 6 a) Example of DTS temperature profile indicating fluid zonation. b) Thermal monitoring during casing cementation.

fracturing for unconventional oil and gas production (Maxwell, 2010). The application of DAS for microseismic monitoring has matured rapidly with improved data quality and acceptance of the technology as an important geophysical tool (e.g. Boitz and Shapiro, 2024; Staněk et al, 2022; Stork et al., 2020; Tuinstra et al., 2023). Real-time continuous microseismic monitoring is required to monitor caprock integrity and induced seismicity

risk for CCS projects, requiring efficient processing of large datasets.

Such a continuous DAS monitoring system has been successfully trialled on major CCS projects, for example at Quest CCS (Vera Rodriguez et al., 2023) with event detection results available in real time. Ideally, the inclusion of engineered fibre provides enhanced detection capabilities with high SNR data.

82 FIRST BREAK I VOLUME 42 I MARCH 2024 SPECIAL TOPIC: RESERVOIR MONITORING
Figure 7 Tubular failure identified by acoustic (left) and temperature (right) anomalies. Figure 8 Strain-rate seismogram for weak microseismic events with Mw −2. DAS array has sufficient sensitivity to pick the first P- and S-wave arrivals in all five boreholes. The relative location of the wells is shown in Figure 6 (from Glubokovskikh et al., 2022).

At the CO2CRC Otway site the installation of Constellation engineered fibre in the boreholes has facilitated the detection of small clusters of microseismicity associated with CO2 injection at the site (Figure 5 and Figure 8; Glubokovskikh et al., 2022). These authors report that the borehole DAS monitoring system has sufficient sensitivity to detect and locate events with moment magnitudes, Mw, greater than −2 up to 1500 m away. An example recording of an Mw~-2 event is shown in Figure 8. This highly sensitive system facilitates a verification of the geomechanical response of the site to CO2 injection and an improved understanding of any seismic hazards or caprock integrity risks. Surface cable deployments are also possible where wide area coverage is required (Stork et al., 2022).

Closing remarks

The mitigation of risks involved with CO2 storage underground is possible with detailed site characteristion and advanced monitoring before, during, and after the injection period. Fibre-optic distributed sensing enables on-demand or continuous, multi-physics-based survey methods which reduce risk through closure of spatial and temporal geophysical and geomechanical information gaps. Cost is mitigated when compared to either standard intervention tools or arrays of discrete, permanent sensors through leveraging a single system for numerous monitoring applications, by limiting wellbore intervention and site mobilisations, and increasing system longevity. The fibre-optic distributed sensing monitoring system has been developed and tested over several years and it is currently being applied to numerous projects commercially.

Acknowledgements

We would like to thank Prof. Roman Pevzner, Curtin University, for permission to use Figure 5 and Figure 8.

References

Boitz, N. and Shapiro, S. [2024]. Detection of microseismic events in continuous DAS data using convolutional neural networks. The Leading Edge, 43, 16–22.

Correa, J., Tertyshnikov, K., Wood, T., Yavuz, S., Freifeld, B. and Pevzner, R. [2018]. October. Time-lapse VSP with permanent seismic sources and distributed acoustic sensors: CO2CRC Stage 3 equipment trials In 14th Greenhouse Gas Control Technologies Conference Melbourne (pp. 21-26).

Correa, J.C. et al [2020]. Fibre-optics Sensing and Permanent Sources for Seismic Monitoring of a Large-scale CCUS site in Decatur, Illinois: Preliminary Results and Lessons Learnt, EAGE Workshop on Fibre Optic Sensing for Energy Applications in Asia Pacific.

Global CCS Institute [2023]. Global Status of CCS – Scaling Up Through 2030

Glubokovskikh, S., Shashkin, P., Shapiro, S., Gurevich, B. and Pevzner, R. [2023]. Multiwell Fiber Optic Sensing Reveals Effects of CO2 Flow on Triggered Seismicity, Seismol. Res. Lett. 94, 2215–2230, doi: 10.1785/0220230025.

Isaenkov, R., et al. [2021]. An automated system for continuous monitoring of CO2 geosequestration using multi-well offset VSP with permanent seismic sources and receivers: Stage 3 of the CO2CRC Otway Project International Journal of Greenhouse Gas Control, 108, p.103317.

Maxwell, S. C. [2010]. Microseismic: Growth born from success. The Leading Edge, 29, 338–343.

Pevzner, R., et al. [2021]. Seismic monitoring of a small CO2 injection using a multi-well DAS array: Operations and initial results of Stage 3 of the CO2CRC Otway project. International Journal of Greenhouse Gas Control, 110, p.103437.

Nation Energy Technology Laboratory (NETL), Safe geologic storage of captured carbon dioxide: two decades of DOE’s carbon storage R&D program in Review, 13 April 2020.

Net Zero Roadmap, A Global Pathway to keep the 1.5 °C Goal in Reach, International Energy Agency.

Pevzner, R., Isaenkov, R., Yavuz, S., Yurikov, A., Tertyshnikov, K., Shashkin, P., Gurevich, B., Correa, J., Glubokovskikh, S., Wood, T. and Freifeld, B. [2021]. Seismic monitoring of a small CO2 injection using a multi-well DAS array: Operations and initial results of Stage 3 of the CO2CRC Otway project. International Journal of Greenhouse Gas Control, 110, p.103437.

Pevzner, R., Glubokovskikh, S., Isaenkov, R., Shashkin, P., Tertyshnikov, K., Yavuz, S., Gurevich, B., Correa, J., Wood, T. and Freifeld, B. [2022]. Monitoring subsurface changes by tracking direct-wave amplitudes and traveltimes in continuous distributed acoustic sensor VSP data. Geophysics, 87(1), A1-A6.

Ricard, L.P. [2020]. Using distributed temperature sensing to inform the quality of cementing operations. Paper presented at the SPE Asia Pacific Oil & Gas Conference and Exhibition, Virtual, November 2020.

Staněk, F., Jin, G. and Simmons, J. [2022]. Fracture imaging using DAS-recorded microseismic events. Frontiers in Earth Science, 10, 907749.

Stork A.L., Baird, A.F., Horne, S.A., Naldrett, G., Lapins, S., Kendall, J-M., Wookey, J., Verdon, J.P., Clarke, A. and Williams, A. [2020]. Application of machine learning to microseismic event detection in Distributed Acoustic Sensing (DAS) data: Geophysics, 85, KS149KS160. DOI: 10.1190/geo2019-0774.1.

Stork, A., et al. [2022]. Monitoring CO2 injection with passive and active seismic surveys: Case study from the Hellisheiði geothermal field, Iceland. Proceedings of the 16th Greenhouse Gas Control Technologies Conference (GHGT-16) 23-24 Oct 2022.

Tuinstra, K., Grigoli, F., Lanza, F., Rinaldi, A. P., Fichtner, A., and Wiemer, S. [2023]. Locating clustered seismicity using Distance Geometry Solvers: applications for sparse and single-borehole DAS networks arXiv preprint arXiv:2309.16317.

Vera Rodriguez, I. et al. [2023]. Continuous, Long-term DAS Microseismic Monitoring Trial in the Shell QUEST CCS Site in Alberta, Canada Carbon Capture Canada CCUS Convention, 10-12 September 2023.

White, D. et al. [2019]. Seven years of 4D seismic monitoring at the Aquistore CO2 Storage Site, Saskatchewan, Canada, SEG Int Exposition & 89th Annual Meeting, 4918-4922, doi:10.1190/segam2019-3216776.1.

FIRST BREAK I VOLUME 42 I MARCH 2024 83 SPECIAL TOPIC: RESERVOIR MONITORING

30th

E u r o p e a n M e e t i n g o f E n v i r o n m e n t a l a n d E n g i n e e r i n g G e o p h y s i c s

5th

C o n f e r e n c e o n Ge o p h y s i c s f o r M i n e r a l E x p lo r a t i o n a n d M i n i n g

4th

C o n f e r en c e o n A i r b o r n e , D r o n e a n d R o b o t i c Ge o p h y s i c s CALLING ALL RESEARCHERS! SUBMIT YOUR PAPER FOR A CHANCE TO JOIN THE TECHNICAL PROGRAMME 8-12 SEPTEMBER 2024 I HELSINKI, FINLAND WWW.EAGENSG.ORG #NSG2024

A novel geophysical method to monitor ultra-shallow reservoirs: mapping of soil moisture content in subsiding peatlands to forecast drought effects and CO2 emissions

Stefan Carpentier1*, Sjef Meekes1, Arnoud Frumau2, Manon Verberne1,3, Thibault Candela1 and Kay Koster1 present a time-lapse pilot study for SMC and GL employing EMI in a managed peatland in the central peat-rich delta plain of the Netherlands, near the city of Gouda.

Abstract

Managed peatland deterioration by microbial oxidation is a worldwide process that leads to the gradual disappearance of these highly organic and fertile soils. Peat oxidation is often the result of aerated top soils by artificially kept low groundwater levels, which enhances aerobic microbial breakdown of organic carbon. This process leads to both subsidence and large quantities of CO2 emissions. Furthermore, artificially drained peatlands are vulnerable to salinisation when proximal to coastlines, and fires when situated in dry and warm climatic zones.

The decrease of the soil moisture content (SMC) and groundwater level (GL) during drought episodes can cause both subsidence and accelerated CO2 emissions, both of which are big issues in the Netherlands. Severe drought results in salinisation of groundwater and greenhouse gas emissions by oxidising peat, and therefore is a societal burden to the Netherlands and worldwide. Furthermore, in coastal lowlands drought accelerates subsidence, leading to relative sea-level rise.

Both SMC and GL are proven to be mappable using geophysical methods. Multi-coil offset Electro-Magnetic Induction (EMI) has high potential to map peat properties for managed peatlands from apparent electrical conductivity (ECa). Studies show that by using EMI, it is possible to obtain ECa for different depth intervals, which are used to estimate soil organic carbon. Furthermore, EMI has a long application history of non-invasive SMC mapping, although obtained ECa also depends on other factors, such as variations in soil composition, density, and pore water conductivity (σw).

TNO and SoilMasters, an expert EM company, employ a mobile electromagnetic mapping system to recover the soil moisture content, a crucial ingredient in these issues. These innovative Electro Magnetic Induction (EMI) measurements of the soil moisture content are used in combination with geodetic and CO2 measurements to forecast subsidence and CO2 emissions.

We present a time-lapse pilot study for SMC and GL employing EMI in a managed peatland in the central peat-rich delta plain of the Netherlands, near the city of Gouda. Furthermore, we use

1 TNO Geological Survey of the Netherlands

|

soil moisture probe and GL measurements at fixed point locations to confront the obtained ECa. We also link the obtained calibrated soil moisture maps to observed subsidence, and CO2 NEE (Net Ecosystem Exchange) flux. The resulting highly correlated measurements and observations can be well explained by precipitation and drought patterns. This makes our findings good proxies for spatio-temporal prediction of subsidence and CO2 emissions for dry and wet spells by monitoring measurements of EMI.

Introduction

Recently, elongated periods of drought in the Netherlands, particular challenges for vegetation on higher sandy soils. The peat areas in the western Netherlands also suffer from drought and low groundwater tables, which leads to peat oxidation and consequently to accelerated CO2 emissions and subsidence (Boonman et al., 2022). Also, sea- and river-dykes that are less cohesive start to leak saline and fresh water in undesired locations via quells and ‘piping’. Additionally, urban infrastructure faces problems like sink holes and wash-outs due to the drought. Recent examples of structure collapses include quay collapses in the city of Amsterdam and observed peat subsidence and CO2 emissions at the city of Gouda. Waterboards, agricultural areas, cities, building/construction companies and home-owners all require stable ground without subsidence, instability and salinisation problems.

The Netherlands has substantial acreage of peatlands as seen in Figure 1a. In northwestern Europe, peatlands are expected to become more susceptible to deterioration as climate models predict increased periods of extreme droughts (Figure 1b). For example, the managed peat areas in the Netherlands endured a rainfall deficit of 250 to 350 mm in the drought of spring and summer 2018, causing local phreatic groundwater levels to drop 150 to 200 mm below the average lowest phreatic groundwater level of the summer of 2017 (Sluijter et al., 2018). This increases the depth at which aerobic microbial organisms potentially could peat, and consequently increases CO2 emissions and subsidence during periods of drought (Figure 2a).

2 TNO Environmental Modelling Sensing and Analysis

|

3 Utrecht University

* Corresponding author, E-mail: stefan.carpentier@tno.nl

DOI: 10.3997/1365-2397.fb2024027

FIRST BREAK I VOLUME 42 I MARCH 2024 85 SPECIAL TOPIC: RESERVOIR MONITORING

Peat oxidation is dependent on several soil properties, such as soil moisture content (SMC) and temperature. Atmospheric-controlled high soil temperature is the main driving force of oxidation processes at the top of peat soil layers. Whereas in the lower part of the unsaturated zone soil moisture is an important driver of oxidation, as soil temperature tends to decrease with increasing depth (Kechavarzi et al., 2010). Furthermore, changing elevation of the phreatic groundwater level (GL) controls the vertical interval of the oxidation prone unsaturated zone, making this an essential property for understanding local peat oxidation and consequently subsidence and salinisation (Figure 2b).

Key factors controlling the negative effect of drought on CO2 emissions, subsidence and salinisation are (1) the soil moisture content (SMC) and (2) the groundwater table, also known as groundwater level (GL) or phreatic water level (FL). The Dutch national groundwater table modelling system accurately captures the fluctuations in groundwater level in dry periods. However, the understanding of soil moisture content in the layers above the groundwater table is less comprehensive, particularly regarding the spatial distribution of soil moisture. Consequently the forecasting of subsidence and CO2 emissions is difficult. We introduce cross-domain technology to address this issue by using an Electro-Magnetic Induction (EMI) mapping system supported by InSAR, GPS, in-situ probes, CO2 flux data and improved prior shallow geological models. Shallow EMI is a high-resolution version of this for ultra-shallow application (Altdorff et al., 2016). InSAR derived displacement estimates result in a millimetre-scale resolution of surface movement timelapse measurements. The combination of land-based and airborne EMI with InSAR enables the surveying of huge patches of land in short time.

The aim of this project is to monitor ultra-shallow Dutch reservoirs by time-lapse EMI mapping of groundwater level and soil moisture content at a pilot peat area in western Netherlands and to couple these new geophysical measurements into predictive models in order to forecast and possibly mitigate CO2 emissions and subsidence.

Key takeaway points in this study are:

• Severe drought results in salinisation of groundwater and greenhouse gas emissions by oxidising peat, and therefore is a societal burden.

• Drought accelerates subsidence, leading to relative sea-level rise.

• Peat areas in the western Netherlands suffer from drought and low groundwater tables, leading to peat oxidation CO2 emissions and subsidence.

• Urban infrastructure faces problems like sink holes and washouts due to the drought.

• Key effects of drought on CO2 emissions, subsidence and salinisation are: (1) soil moisture content (SMC) and (2) groundwater level (GL).

• Soil moisture content SMC in the layers above the groundwater level GL is not well known, knowledge of the spatial extent of soil moisture falls short.

• Consequently the physics-based forecasting of subsidence, salinisation and CO2 emissions is difficult.

• Cross-domain TNO technology is used for this problem by using an Electro-Magnetic Induction (EMI) mapping system, InSAR, GPS, CO2 data and geological models.

• We have mapped time-lapse groundwater level GL and soil moisture content SMC in a pilot peat area, coupling geophysical measurements with predictive models to forecast and possibly mitigate CO2 emissions, subsidence.

1

of Holocene peat distributed over the Netherlands (after Koster et al., 2020), and the locations of the Zegveld and Cabauw sites. b) Map of Surface Soil Moisture Drought indicator by inference on NASA GRACE satellite data (https://nasagrace.unl.edu/). The drought situation is displayed for Europe in the record hot year of 2020.

https:// bodemdalingskaart.portal.skygeo.com/portal/ bodemdalingskaart/u2/viewers/basic/ . b)

of salinisation in the Netherlands in 2021 from http://www.grondwatertools.nl.

86 FIRST BREAK I VOLUME 42 I MARCH 2024 SPECIAL TOPIC: RESERVOIR MONITORING
Figure a) Accumulated thickness Figure 2 a) Map of Bodemdalings Kaart Nederland provided by Skygeo in 2021 on Map

Method

In this study we develop a workflow with the following steps (Figure 3):

• Derive soil moisture content and groundwater level from timelapse EMI and probe in-situ data using empirical relations, initially from literature and models, subsequently from pilot site field data

• Collect the time-lapse measurements EMI, InSAR, GPS, probes with in-situ SMC and GL, CO2 flux at a pilot site

• Calibrate predictive model of subsidence and CO2 emissions with geophysical measurements and to groundwater models and improved shallow geologic models

• Generalise the model such that land-based and airborne EMI, InSAR and GPS systems can forecast subsidence and CO2 emissions at desired locations on a feasible continuous, on-demand basis.

• Achieve a pilot on the target site of peat land in the western Netherlands, where ground-truth is available through existing monitor-wells

To run and validate this workflow, in 2021 we have conducted three time-lapse EMI field experiments (Figure 4) on the Zegveld peat observatory site (Figure 1a) and one at a test field in Cabauw (Figure 5, Figure 1a) to ascertain the correlation to SMC and GL. To capture as much as possible variations in soil moisture content the three field experiments were conducted in different seasons (spring – March, summer – June, autumn – September 2021). In the end, too much interference by electromagnetic devices that are permanently present at the Cabauw test field Figure 5) for other monitoring studies resulted in the abandonment of this location after the March measurement campaign. We continued with the Zegveld pilot site (Figure 1a).

The EMI field data is subsequently confronted with monitoring data that was previously collected for different studies (Boon-

man et al., 2022): InSAR (Sentinel-1), probe-based in-situ soil moisture content (Royal Dutch Meteorological Institute (KNMI) at Cabauw, National Research Programme on Greenhouse Gas Dynamics in Peatlands and Organic soils (NOBV) at Zegveld), and CO2 flux (KNMI at Cabauw, NOBV at Zegveld). These datasets are used in data assimilation and calibration procedures to predict soil moisture content.

We will estimate soil moisture content (SMC) over a large area employing electromagnetic induction methods (EMI). We now provide some background on EMI methods, their calibration and their relation to soil moisture.

EMI methods are well established and do not require major research. Over the past decades EMI has been explored as a tool in ‘precision agriculture’ or ‘site specific management’ The prime parameter in EMI is often the so-called apparent conductivity (ECa). ECa can sometime be interpreted in a more specific layer of electrical conductivity (ECl) Various studies were performed to study the relation between ECa and other soil parameters, such

FIRST BREAK I VOLUME 42 I MARCH 2024 87 SPECIAL TOPIC: RESERVOIR MONITORING
Figure 3 Schematic of the workflow and software tools for the predictive model for subsidence and CO2 emission due to drought. Figure 4 Field measurements of EMI at Cabauw site.

as SMC, but also soil texture, pH, organic matter content, which on their turn are interrelated. ECa generally correlates well with SMC in previous studies that were performed over rather varying conditions regarding soil and climate. Within the framework of this project the correlation between SMC and ECa or ECl must be confirmed (Figure 6) for typical Dutch conditions by a field test. For this, probe in-situ calibration measurements are also necessary and will be used at the sites Cabauw and Zegveld (Figure 1a, Figure 5).

The EMI methods generally use a transmitter loop and a receiver loop that receives a voltage that is induced from the transmitter loop plus the currents induced in the subsurface. Generally horizontal loop and vertical loop configurations are used. Each configuration has a specific weighting function that shows which part of the subsurface contributes to the total signal. By employing different loop configurations and different separations between source and receiver different parts of the subsurface are scanned. The more data points per location the better the subsurface model can be derived.

It is possible to calculate a simple layered model (ECl) for each measured location if multi offset and multi configuration

data is present (see e.g De Smedt et al. 2013). The layered model allows more advanced estimation of SMC with depth, compared to the use of the ECa. The validation results show that to derive reasonably accurate regression models for predicting SMC from EMI measurements for field scale mapping of SMC, site specific calibration is required (Badewa et al. 2018). An example of the relation between ECa (Vertical Dipole) and SMC for five soil types (Iowa, USA) is shown in Figure 6 (taken from Brevik, Fenton and Lazzari, 2006).

Results

We found that in-situ located SMC point measurements after calibration correlate well to the average ECa conductivities at those locations during the three timelapses. A solid empirical relation could be established between SMC and ECa allowing for spatial prediction of SMC on the Zegveld field into plausible maps (Figures 6, 7).

As seen in Figure 7, it was found at the Zegveld site that both SMC and ECa followed intimately the behaviour of precipitation and GL. The usual pattern arose that a short- or long-term precipitation event would take place, then with short delay the GL would rise and after more delay the SMC and ECa would rise. For a drought the opposite effect occurred with the same delays: first a period without precipitation, then GL drops, and subsequently the SMC and ECa. This is a helpful insight that enables us to not only spatially predict SMC from ECa, but also to make assessments of how the SMC will react after wet and dry period.

At Cabauw, we have observed strong indications that subsidence from InSAR is also closely related to the SMC and GL in the upper 0.5 of soil and causative precipitation events. Figure 8 demonstrates that subsidence or in general surface displacement estimates derived from InSAR (black curve) are seen to correlate well to calibrated SMC (red band) at the Cabauw site. The relation of InSAR displacements to coinciding precipitation is weaker, possibly due to the delay factor.

88 FIRST BREAK I VOLUME 42 I MARCH 2024 SPECIAL TOPIC: RESERVOIR MONITORING
Figure 5 Field layout at Cabauw site. Figure 6 Relation between EC and volumetric water content, also known as soil moisture content, for various soil types (after Brevik, Fenton and Lazzari, 2006).

At Cabauw, we have also observed strong indications that net CO2 emission is closely related to the SMC and GL in the upper 0.5 m of the soil and causative precipitation events (Figure 9). The analysis of net CO2 emission is a delicate procedure, involving much use of statistics and calibration to separate the biomass intake, seasonal trends, atmospheric factors like wind etc. In this study, we could do only a crude estimation of the net CO2 emission at the Cabauw site in 2020 using running average models on the raw data. Yet, these running averages do show a convincing delayed relation between precipitation, GL and SMC, similar to what we found at the Zegveld site from our ECa-SMC analysis. At Cabauw, net CO2 emission increases with a delay after the start of a drought and decreases again with delay after a wet season commences. This is a promising result that translates the calibration at Cabauw to the Zegveld site and that allows for EMI data to be a proxy for subsidence and net CO2 emission through soil moisture content SMC and groundwater level GL.

Figure 9 presents the 2020 precipitation, SMC, GL and NEE data for the Cabauw site (KNMI) with drought/drier periods marked by the red arrows and wet periods marked by the green arrows (Figure 9 a/b/c). An interesting response is seen in the CO2 NEE curves if plotted as the 2-months average curve (Figure 9f). A phase delayed response occurs in the CO2 NEE curve where the drought causes an increase in the CO2 NEE curve (a net CO2 emission, green upward arrow) and the wet period decreases the

CO2 NEE curve (a relative uptake of CO2, red downward arrow). Although the balance of uptake and emission is more complicated than presented here it is a clear indication of drought-induced peat processes emitting CO2. Also, the precipitation appears to be a predictor for soil movement in the shallowest 0.5 m. Given that drought can be spatially predicted by EMI measurements, EMI can most likely also spatially predict CO2 emissions and subsidence through empirical relations.

Conclusions

This study confirms that the key factors controlling the negative effect of drought on CO2 emissions, subsidence and salinisation are (1) the content of soil moisture (SMC) and (2) the groundwater level (GL). The upper +- 0.5 m of Dutch soil is found to be a highly dynamic part of the subsurface which acts as a conduit and mirror of atmospheric processes towards the subsurface and vice versa. In case of events of drought or highly wet conditions the upper +- 0.5 m of soil responds, albeit with a delay, strongly on these events by changing its soil moisture content, its groundwater table, its electrical conductivity, soil movement and net CO2 emission.

Especially in peat areas this is a strong effect. Soil moisture content in the layers above the groundwater table is by default not so well known and knowledge of the spatial extent of soil moisture falls short. We have found however that electrical

FIRST BREAK I VOLUME 42 I MARCH 2024 89 SPECIAL TOPIC: RESERVOIR MONITORING
Figure 7 SMC time-lapse maps from Zegveld in March, June and September 2021 at 0.3m depth (3 panels right) derived from the observed variations in ECa at 0.3m (3 panels left). X- and Y axis represent GPS coordinates in the Dutch RD coordinate system. The colorbar units in the left three panels represent conductivity ECa in mSiemens and in the right three panels SMC in percentage. Figure 8 In red the SMC ensemble members after 4 assimilation steps. In black the InSAR data. For the fit with SMC data a seasonal trend with flattened tops and some peaks is visible. The peak in the dry summer of 2018 stands out the most. Chi-square is 1.63. Y-axis is relative displacement in meters with respect to 01-01-2017, X-axis is time in days.

conductivity (EMI) is an excellent proxy for soil moisture content and correlates well. In this study, we conducted tree timelapse EMI field experiments on the Zegveld peat observatory site. We found that in-situ located SMC point measurements after calibration correlated well to the average EMI conductivities at those locations during the three timelapses. A solid empirical relation could be established between SMC and EMI allowing for spatial prediction of SMC on the Zegveld field into plausible time-lapse monitoring maps.

Additionally, it was found at the Zegveld site that both SMC and EMI followed intimately the behaviour of precipitation and GL. The usual pattern arose that a short or long-term precipitation event would take place, then with short delay the GL would rise and after more delay the SMC and EMI would rise. For a drought the opposite effect occurred with the same delays: first a period without precipitation, then the GL drops and then the SMC and EMI drop. This is a helpful insight that enables us to not only spatially predict SMC from EMI, but also make assessments of how the SMC will react after a wet and dry period.

At the other large peat observatory Cabauw, we have observed strong indications that subsidence derived from InSAR is also closely related to the SMC and GL in the upper 0.5 m of soil and causative precipitation events. Subsidence or in general

soil movement from InSAR is seen to correlate well to SMC at the Cabauw site and another peat site in Friesland. The relation of InSAR displacement estimates to coinciding precipitation is weak, possibly due to the delay factor.

At the same peat observatory Cabauw, we have observed strong indications that net CO2 emissions are also closely related to the SMC and GL in the upper 0.5 m of soil and causative precipitation events. The analysis of net CO2 emission is a delicate procedure, involving many statistics and calibration to separate the biomass intake, seasonal trends, atmospheric factors like wind etc. In this study we could do only a crude estimation of the net CO2 emission at the Cabauw site in 2020 using running average models on the raw data. Yet these running averages do show a convincing delayed relation between precipitation, GL and SMC, similar to what we found at the Zegveld site from our EMI-SMC analysis. At Cabauw, net CO2 emission increases with a delay after the commence of a drought and decreases again with delay after a wet season commences. This is a promising result that may allow for EMI data to be a proxy for subsidence and net CO2 emission through SMC.

We conclude that electrical conductivity (EMI) is an excellent proxy for soil moisture content and correlates well. This is promising for subsidence research worldwide, as EMI can also be conducted airborne and by satellite.

90 FIRST BREAK I VOLUME 42 I MARCH 2024 SPECIAL TOPIC: RESERVOIR MONITORING
Figure 9 2020 yearly CO2 flux curves at Cabauw (KNMI). 6 panels from top to bottom: precipitation, groundwater level (GL), Soil Moisture Content (SMC) at 20 cm depth, CO2 Net Ecosystem Exchange (NEE) flux 30 minutes interval, CO2 NEE flux 2-daily moving average, CO2 NEE flux 2-monthly moving average. Y-axis is relative amounts of displayed properties, X-axis is number of half hour intervals in 2020.

Acknowledgements

This work has been produced with support from the TNO Ideation Challenge funds. We are very grateful to KNMI (Cabauw), NOBV and KTC, Kennis Transfer Centrum (Zegveld) for enabling us to conduct measurements at their field locations and providing us access to their data. We also thank Joana Esteves Martins for help and advice on the InSAR data.

References

Altdorff, D., Bechtold, M., van der Kruk, J., Vereecken, H. and Huisman, J.A. [2016]. Mapping peat layer properties with multi-coil offset electromagnetic induction and laser scanning elevation data. Geoderma, 261, 178-189

Badewa, E., Unc, A., Cheema, M., Kavanagh, V., Galagedara, L. Soil [2018]. Moisture Mapping Using Multi-Frequency and Multi-Coil Electromagnetic Induction Sensors on Managed Podzols. Agronomy, 8, 224. https://doi.org/10.3390/agronomy8100224.

Boonman, J., Hefting, M.M., van Huissteden, C.J.A., van den Berg, M., van Huissteden, J., Erkens, G., Melman, R. and van der Velde, Y. [2022]. Cutting peatland CO2 emissions with water management practices, Biogeosciences 19, 5707-5727.

https://doi.org/10.5194/ bg-19-5707-2022.

Brevik, E., Fenton, C., Thomas, E. and Lazari, A. [2006]. Soil electrical conductivity as a function of soil water content and implications for soil mapping. Precision Agriculture, 7(6). https://doi.org/10.1007/ s11119-006-9021-x.

Comas, X. and Slater, L. [2004]. Low-frequency electrical properties of peat, Water Resour. Res., 40, W12414, doi:10.1029/2004WR003534.

Dutch Hydrological Resources [2021]. http://www.grondwatertools.nl.

Kechavarzi, C., Dawson, Q. and Leeds-Harrison, P.B. [2010]. Physical properties of low-lying agricultural peat soils in England. Geoderma, 154, 196-202.

Koster, K., Frumau, A. Stafleu, J., Dijkstra, J., Hensen, A., Velzeboer, I., Esteves Martins, J. and Zaadnoordijk, W.J. [2020]. GreenhousePeat: a model linking CO2 emissions from subsiding peatlands to changing groundwater levels. PIAHS 382, 609-614.

McNeill, J.D. [1980]. Electromagnetic terrain conductivity measurement at low induction numbers: Geonics Ltd., Technical Note TN-6.

NASA GRACE satellite data [2020], https://nasagrace.unl.edu/.

Sluijter, R., Plieger, M., Van oldenborgh, G. J., Beersma, J. and De Vries, H. [2018]. De droogte van 2018, Een analyse op basis van het potentiële neerslagtekort, KNMI, De Bilt, 39 pp. (in Dutch).

Delefortrie, S., De Smedt, P., Saey, T., Van De Vijver, E. and Van Meirvenne, M. [2014]. An efficient calibration procedure for correction of drift in EMI survey data, Journal of Applied Geophysics, 110, 2014, 115-125, ISSN 0926-9851, https://doi.org/10.1016/j. jappgeo.2014.09.004.

De Smedt, P., Van Meirvenne, M., Davies, N.S., Bats, M., Saey, T., De Reu, J., Meerschman, E., Gelorini, V., Zwertvaegher, A., Antrop, M., Bourgeois, J., De Maeyer, P., Finke, P.A., Verniers, J. and Crombé, P. [2013]. A multidisciplinary approach to reconstructing Late Glacial and Early Holocene landscapes, Journal of Archaeological Science, 40(2), 1260-1267, ISSN 0305-4403, https://doi.org/10.1016/j. jas.2012.09.004.

Vereecken, H., Huisman, J.A., Pachepsky, Y., Montzka, C., van der Kruk, J., Bogena, H., Weihermüller, L., Herbst, M., Martinez, G. and Vanderborght, J. [2014]. On the spatio-temporal dynamics of soil moisture at the field scale, Journal of Hydrology, 516, 76-96, ISSN 0022-1694, https://doi.org/10.1016/j.jhydrol.2013.11.061.

Wait, J.R. [1962]. A Note on the Electromagnetic Response of a Stratified Earth: Geophysics, 27, 382-85.

Wait, J.R. [1982]. Geo-electromagnetism: Academic Press Inc.

FIRST BREAK I VOLUME 42 I MARCH 2024 91 SPECIAL TOPIC: RESERVOIR MONITORING
Publish with EAGE CONTACT OUR PUBLICATIONS DEPARTMENT AT PUBLICATIONS@EAGE.ORG! To serve the interests of our members and the wider multidisciplinary geoscience and engineering community, EAGE publishes a range of books and scientific journals in-house. Our extensive, professional marketing network is used to ensure publications get the attention they deserve. EAGE is continually seeking submissions for both book publishing and articles for our journals. A dedicated and qualified publishing team is available to support your publication at EAGE. 20879-Filler Journal Media Publish with EAGE 170x94.indd 1 09/02/2024 09:38 ADVERTISEMENT

TECHNICAL PROGRAMME

Includes Oral and Poster Presentations

WORKSHOP AND PANEL DISCUSSION

SOCIAL PROGRAMME

NETWORKING

OPPORTUNITIES

NOW AND TAKE ADVANTAGE OF THE EARLY BIRD FEE!
WWW.ECMOR.ORG #ECMOR2024
REGISTER
FEATURES 2-5 SEPTEMBER 2024 I OSLO, NORWAY

Impact of effective pressure on acoustic impedancevelocity linear relationships: Ordovician Red River ‘C’ Zone reservoir, Williston Basin, USA

Killian Ikwuakor1,2* demonstrates that the impedance-velocity linear relationships for P-wave and S-wave could become important tools for predictive and quantitative reservoir characterisation in well logs and seismic data.

Abstract

P-wave and S-wave impedance are linearly related with their respective velocities at both low and high levels of effective pressure. The study was carried out at the core scale and brine-saturated state of carbonate core samples with variable porosities. The slopes, derived from linear-linear crossplots of P-wave and S-wave impedance versus their respective velocities, exhibit close quantitative agreement from one level of effective pressure to another. The intercept values are all negative and exhibit significant increase, going from low to high effective pressures. For practical purposes, the impedance-velocity relationships are both rock-typing and porosity-discriminating criteria. The high correlation coefficient exhibited in the crossplots at all levels of differential pressure signifies that the relationships could potentially be used to investigate carbonate reservoirs at different depths and rock competencies. The large differential between intercept values for P-waves and S-waves could be a diagnostic tool for discriminating carbonate reservoirs. These results show that the impedance-velocity linear relationships for P-wave and S-wave could become important tools for predictive and quantitative reservoir characterisation in well logs and seismic data.

Introduction

Background

Ikwuakor (2022) arrived at the following linear equations relating P-wave impedance (AIP) and P-wave velocity (V p), and relating S-wave impedance (AI s) and S-wave velocity (V s):

where rb is bulk density, rm is matrix or grain density dependent on lithology or rock-type, rf is fluid density, BP is P-wave coefficient dependent on lithology or rock-type, effective pressure, grain contact areas and sometimes pore fluid, Δ tmp is P-wave matrix transit-time dependent on lithology or rock-type, BS is S-wave coefficient dependent on lithology or rock-type, effective pressure, grain contact areas and pore fluid, and Δ tms is S-wave matrix transit-time dependent on lithology or rock-type.

Equation 1 predicts that P-wave acoustic impedance (AIP) is linearly related with P-wave velocity (V p), and S-wave impedance (AI s) is linearly related with S-wave velocity (V s) with well-defined slope and intercept terms. The geology dependent parameters in the slope and intercept terms endow the relationships’ geologic character and relevance.

-----Slope term----- -Intercept term-

-----Slope term----- -Intercept term-

1 PEER Research Ltd. |

Subsequently, these relationships were demonstrated in a multi-well carbonate reservoir at a high level of effective pressure (6000 psi, or ≈ 414 bar), and found to be valid for both air-saturated and brine-saturated states of the core samples studied (Ikwuakor, 2023). The question that remained was how the relationships would perform at lower levels of effective pressure. This question was relevant because reservoirs occur at different depths and rock/reservoir competencies. Answering the question became the primary objective of the study presented herein. Previous authors like Pickett (1963) and Domenico (1984a, 1984b), working on relationships between reciprocal velocity and porosity, observed that values of BP and B s changed at low levels of effective pressure but stabilised at higher levels. These authors also observed that Δ tmp and Δ tms did not change appreciably, irrespective of the level of effective pressure. They also observed that the nature of pore fluid did not affect V p at high levels of effective pressure. Ikwuakor (1988, 1994) corroborated these findings, including when the geology-dependent parameters occurred in combination in the slope and intercept terms of rock property interrelations. But in Equation 1 and Equation 2, additional geology-dependent parameters, rm and rf, have been introduced in the slope and intercept terms. The impact of these combined parameters as effective pressure changes makes this work all

2 Ikwuakolam Energy Company (IEC), Inc.

* Corresponding author, E-mail: ikwuakorkc@aol.com

DOI: 10.3997/1365-2397.fb2024028

FIRST BREAK I VOLUME 42 I MARCH 2024 93 SPECIAL TOPIC: RESERVOIR MONITORING
(1)
(2)

the more valuable in understanding and applying these novel equations.

Geology

The Red River Formation (Ordovician) in the Williston Basin, USA, consists of three major sequences or zones, designated from the youngest to the oldest, ‘A’, ‘B’ and ‘C’. The zones are separated by layers of anhydrite. The ‘C’ zone, the thickest and economically more significant, is the zone of interest for the work presented here.

According to the stratigraphic nomenclature and depositional model of Kohm and Louden (1978), the ‘C’ zone is considered to be a ‘brining-upward’ subtidal sequence with lithologic units, namely, in descending order: (1) ‘C’ Anhydrite Member (Anhydrites), (2) ‘C’ Laminated Member (Dolomites), and (3) ‘C’ Burrowed Member (Limestones). The ‘C’ Anhydrite Member is generally bedded, nodular in places, and laterally persistent throughout most of the Williston Basin. The ‘C’ Laminated Member consists of laminated dolomites. Its contact with the overlying ‘C’ Anhydrite Member is sharp, although anhydritic dolomite may occur in places in the uppermost part of the ‘C’ Laminated Member. The unit is persistent, almost uniformly thick, and can be correlated across the basin. Fossils are rare in this unit. Most of the oil production comes from the porous dolomite and anhydritic dolomite rock-types. The ‘C’ Burrowed Member is characterised by abundant burrows. The limestones are highly fossilised and, in places, interbedded with dolomites. Within the Burrowed Member are thin marker beds of black kerogenite, usually 2 to 6 ft thick, that can be correlated throughout the basin. These are thought to be the source of the Red River hydrocarbon (Kohm and Louden, 1978).

The Red River ‘C’ zone carbonates are extremely heterogenous. The heterogeneity is manifested in the wide variability and distribution of lithologic types and rock-types, in porosity and permeability variations, in pore fluid composition and distribution, and in the depositional and diagenetic conditions that caused the above characteristics (Ikwuakor, 1994)

Core data

The data set available for this work already existed in the public domain (Ikwuakor, 1994). The data consists of laboratory measurements of bulk density and porosity, as well as V p and V s measured at low to high levels of effective pressure for the

Red River ‘C’ zone complex carbonate reservoirs (Ordovician). Laboratory measurements were made on 141 core samples from the Chevron Melby #4-1 well, located at NWSW Sec. 1, T33N R58E, Brush Lake Field, Sheridan County, Montana. Cored samples were from 11272 ft to 11452 ft. Measured core porosities vary widely, and range from 0.1% in the anhydrites to 19.1% in the dolomites. Core analysis in the Chevron Melby #4-1 well also shows permeabilities that vary widely, ranging from less than 0.01 md to about 11 md.

Ninety one samples taken at 2ft intervals and four additional samples with medium-to-high porosities were plotted in this paper. The four additional samples were randomly selected to help determine the trend of porosities in subsequent crossplots. All the core samples were measured for porosity, bulk density and grain density, using standard methods. V p and V s were also measured at a high effective pressure of 6500 psi (≈ 448 bar) that simulated competent rocks at typical reservoir depths, as well as at lower effective pressures of 3500 psi (≈ 241 bar), 1500 psi (≈ 103 bar), and 500 psi (≈ 34 bar) that simulated less competent rocks at lower reservoir depths. V p and V s were measured twice at 500 psi (≈ 34 bar). Since the values often varied, averages of the two measurements were used in the plots. Core descriptions identified limestone, dolomite, anhydrite, and various mixtures of the units. Based on measured grain densities and porosities, rock-types include porous dolomite and anhydritic dolomite, and predominant low porosity limestone and dolomitic limestone.

Data analysis and interpretation

To determine the effects of effective pressure on the impedance-velocity relationships, AI p and AIS at each sampled depth were first calculated using the measured bulk densities and velocities. Linear-linear crossplots of AI p versus and V p, and AIS versus VS were made for the four selected levels of effective pressure. The results of these crossplots are shown in Figures 1 to 4 for P-wave, and Figures 5 to 8 for S-wave.

AI p versus V p at 500 psi effective pressure: The Figure 1 crossplot exhibits a good linear trend, as evidenced by the high correlation coefficient 0.9697. The linear equation that represents the trendline is also shown on the crossplot. The slope is 3.1554 while the intercept is -8325.7. This strong linear trend is quite remarkable because it connects all the rock-types present – the predominant low porosity limestone and dolomitic limestone occupying the upper part of the trendline, porous dolomite and

94 FIRST BREAK I VOLUME 42 I MARCH 2024 SPECIAL TOPIC: RESERVOIR MONITORING
Figure 1 Linear-linear crossplot of versus for brinesaturated carbonate samples measured at 500 psi (≈ 34 bar) effective pressure. Data is from the Chevron Melby #4-1 well that penetrated the Red River ‘C’ Zone (Ordovician) complex carbonates, Williston Basin. The high correlation coefficient (R2) validates the linear relationship between and at the 500 psi (≈ 34 bar) effective pressure level.

anhydritic dolomite occupying the lower side of the trendline, and anhydrite represented by the two data points sitting above the upper end of the trendline.

AI p versus V p at 1500 psi effective pressure: The Figure 2 crossplot replicates the same features and characteristics shown in Figure 1. Because Figure 1 and Figure 2 are plotted on the same scale, one can observe the lowest data point in Figure 2 has shifted slightly in the direction of increasing V p and AIP. The correlation coefficient 0.9656 is equally high. The linear equation that represents the trendline is also shown on the crossplot. The slope is 3.2131, similar to the slope in Figure 1. The intercept is also negative (-9626.7), higher negative than in Figure 1.

AI p versus V p at 3500 psi effective pressure: The Figure 3 crossplot replicates the same features and characteristics shown

Figure 2 Linear-linear crossplot for brine-saturated carbonate samples measured at 1500 psi (≈ 103 bar) effective pressure. Data is from the Chevron Melby #4-1 well that penetrated the Red River ‘C’ Zone (Ordovician) complex carbonates, Williston Basin. The high correlation coefficient (R2) validates the linear relationship between and at the 1500 psi (≈ 103 bar) effective pressure level.

Figure 3 Linear-linear crossplot for brine-saturated carbonate samples measured at 3500 psi (≈ 241 bar) effective pressure. Data is from the Chevron Melby #4-1 well that penetrated the Red River ‘C’ Zone (Ordovician) complex carbonates, Williston Basin. The high correlation coefficient (R2) validates the linear relationship between and at the 3500 psi (≈ 241 bar) effective pressure level.

Figure 4 Linear-linear crossplot for brine-saturated carbonate samples measured at 6500 psi (≈ 448 bar) effective pressure. Data is from the Chevron Melby #4-1 well that penetrated the Red River ‘C’ Zone (Ordxovician) complex carbonates, Williston Basin. The high correlation coefficient (R2) validates the linear relationship between and at the 6500 psi (≈ 448 bar) effective pressure level.

in Figure 1 and Figure 2. There is also another shift of the lowest data point in the direction of increasing V p and AIP. The core data also exhibits this shift, and shows non uniform V p increments in the direction of higher effective pressures. The correlation coefficient (0.9568 is equally high. The linear equation that represents the trendline is also shown on the crossplot. The slope is 3.3354, and slightly higher than the previous slopes in Figure 1 and Figure 2. The intercept is also negative (-12200), a much higher negative than the intercepts in Figure 1 and Figure 2.

AI p versus V p at 6500 psi effective pressure: The Figure 4 crossplot replicates the same features and characteristics shown in Figure 1, Figure 2 and Figure 3. The shift of the lowest data point is more conspicuous than the shift associated with the data points in the upper side of the trendline (e.g., the anhydrites and low

FIRST BREAK I VOLUME 42 I MARCH 2024 95 SPECIAL TOPIC: RESERVOIR MONITORING

porosity limestones). It appears that porosity may be an important contributor in the amount of shift, since the lower data points usually represent the more porous samples (Ikwuakor, 2023). The correlation coefficient 0.9497 is also high. The linear equation that represents the trendline is also shown on the crossplot. The slope (3.4362) is slightly higher than the slope in Figure 3 and, overall, is in quantitative proximity with the three previous slopes in Figure 1, Figure 2 and Figure 3. The intercept is also negative (-14445), and much more negative than the intercepts in Figure 1, Figure 2 and Figure 3.

AI s versus V s at 500 psi effective pressure: The Figure 5 crossplot exhibits a good linear trend, as evidenced by the high correlation coefficient 0.9669. The linear equation that represents the trendline is also shown on the crossplot. The slope is 3.0259 while the intercept is -2878.8. This strong linear trend, like its P-wave component, connects all the rock-types present. The predominant low-porosity limestone and dolomitic limestone occupy the upper part of the trendline, while porous dolomite and anhydritic dolomite occupy the lower side of the trendline. Anhydrite, represented by two overlapping data points (9340, 27450; and 9340, 27422) sits above the upper end of the trendline.

AI s versus V s at 1500 psi effective pressure: The Figure 6 crossplot replicates the same features and characteristics shown in Figure 5. Figure 5 and Figure 6 are plotted on the same scale; so, one can observe the lowest data point in Figure 6 has shifted slightly in the direction of increasing V s and AI s . The correlation coefficient (0.9528) is equally high. The linear equation that

represents the trendline is also shown on the crossplot. The slope is 3.0999, slightly higher than the slope in Figure 5. The intercept is also negative (-3729.4) and more negative than the intercept in Figure 5.

AI s versus V s at 3500 psi effective pressure: The Figure 7 crossplot replicates the same features and characteristics shown in Figure 5 and Figure 6. Figure 7 also shows continued shift of the lowest data point in the direction of increasing V s and AIS Inspection of the core data also shows increments in V s in the direction of higher effective pressure, but the increment is not uniform. The correlation coefficient (0.9568) is equally high. The linear equation that represents the trendline is also shown on the crossplot. The slope is 3.1848, and slightly higher than the previous slopes in Figure 5 and Figure 6. The intercept is also negative (-4737.7), much more negative than the intercepts in Figure 5 and Figure 6.

AI s versus V s at 6500 psi effective pressure: The Figure 8 crossplot replicates the same features and characteristics shown in Figure 5, Figure 6 and Figure 7. The shift of the lowest data point appears more conspicuous than the shift associated with the data points in the upper side of the trendline (e.g., the anhydrites and low porosity limestones). It appears that porosity may be an important contributor in the amount of shift, since the lower data points represent the more porous samples (Ikwuakor, 2023). The correlation coefficient (0.9171) is also high. The linear equation that represents the trendline is also shown on the crossplot. The slope (3.1781) is slightly lower than the slope in Figure 7, but

500 psi (≈ 34 bar) effective pressure. Data is from the Chevron Melby #4-1 well that penetrated the Red River ‘C’ Zone (Ordovician) complex carbonates, Williston Basin. The high correlation coefficient (R2) validates the linear relationship between and at the 500 psi (≈ 34 bar) effective pressure level.

‘C’ Zone (Ordovician) complex carbonates, Williston Basin. The high correlation coefficient (R2) validates the linear relationship between and at the 1500 psi (≈ 103 bar) effective pressure level.

96 FIRST BREAK I VOLUME 42 I MARCH 2024 SPECIAL TOPIC: RESERVOIR MONITORING
Figure 5 Linear-linear crossplot for brine-saturated carbonate samples measured at Figure 6 Linear-linear crossplot for brine-saturated carbonate samples measured at 1500 psi (≈ 103 bar) effective pressure. Data is from the Chevron Melby #4-1 well that penetrated the Red River

Figure 7 Linear-linear crossplot for brine-saturated carbonate samples measured at 3500 psi (≈ 241 bar) effective pressure. Data is from the Chevron Melby #4-1 well that penetrated the Red River ‘C’ Zone (Ordovician) complex carbonates, Williston Basin. The high correlation coefficient (R2) validates the linear relationship between and at the 3500 psi (≈ 241 bar) effective pressure level.

Figure 8 Linear-linear crossplot for brine-saturated carbonate samples measured at 6500 psi (≈ 448 bar) effective pressure. Data is from the Chevron Melby #4-1 well that penetrated the Red River ‘C’ Zone (Ordovician) complex carbonates, Williston Basin. The high correlation coefficient (R2) validates the linear relationship between and at the 6500 psi (≈ 448 bar) effective pressure level.

slightly higher than the slopes in Figure 5 and Figure 6. Overall, however, the variations among the slopes appear insignificant. The intercept (-4838.3) is closer to the intercept in Figure 7, but much more negative than the intercepts in Figure 5 and Figure 6.

Table 1 shows values of correlation coefficient (R2), slopes and intercepts from the Figure 1 to Figure 8 crossplots for each level of effective pressure. The correlation coefficient is uniformly high for both the P-wave and S-wave at all levels of effective pressure. The slopes for P-wave and those for S-wave exhibit closer quantitative similarity than their intercepts. The two groups share negative intercept values, but the quantitative difference between the two groups is high, with the P-wave group having much greater negative values than the S-wave group, by approximately three orders of magnitude. For practical purposes, this is significant.

Porosity trends in the crossplots: Porosity is a very important rock and reservoir property. But the impedance-velocity relationships appear to show that the linear relationships are

valid, independently of porosity. The crossplots confirm this. The high correlation coefficients, common in all the crossplots, indicate differences in rock-types, porosities, permeabilities, rock competence existing in the complex Red River ‘C’ zone reservoir are captured in the linear trendline. The segregation of data points along the linear trendlines in the crossplots also demonstrates that some of these reservoir properties have been segregated.

Mere inspection of the grain densities derived from core measurements revealed that the rock-types with the lowest porosities line up at the upper part of the trendline, in the direction of increasing V p, V s, AIP and AI s. These rock types include anhydrite, limestone and dolomitic limestone. The more porous rock-types, on the other hand, line up in the lower part of the trendline, in the direction of decreasing V p, V s, AI p and AI s . Since I was more interested in the more porous samples, I created Table 2 that shows the sample depth, associated porosity, V p, AI p, V s and AIS of the first seven data points in the lower part of the trendline for each level of effective pressure.

FIRST BREAK I VOLUME 42 I MARCH 2024 97 SPECIAL TOPIC: RESERVOIR MONITORING
VP AI s vs. V s Effective Pressure (psi) R2 Slope Intercept R2 Slope Intercept 500 0.9697 3.1554 -8325.7 0.9669 3.0259 -2878.8 1500 0.9656 3.2131 -9626.7 0.9528 3.0999 -3729.4 3500 0.9568 3.3354 -12200 0.9326 3.1848 -4737.7 6500 0.9497 3.4362 -14445 0.9171 3.1781 -4838.3
AIP vs.
Table 1 Values of correlation coefficient (R2), slopes and intercepts from the crossplots for each level of effective pressure.

The results confirm a preliminary observation by Ikwuakor (2023) that, at high levels of effective stress, the most favourable porosities trend in the direction of decreasing V p and AIP in the AIP versus V p linear-linear crossplot, and in the direction of decreasing V s and AI s in the AI s versus V s linear-linear crossplot. That this observation is also proven for lower levels of effective pressure is of tremendous practical significance.

A closer look at the 3500 psi and 6500 psi effective pressure levels for S-waves also show that a low porosity of 2% is the much higher porosities. This in an obvious anomaly. An inspection of all the data associated with this porosity at sample depth 11426 ft reveals that the measured velocities increase, as would be expected, from 8350 ft/s at 500 psi to 8370 ft/s at 1500 psi and to 8630 ft/s at 3500 psi effective pressure. The velocity then decreases anomalously to 8420 ft/s at 6500 ft/s. I can only

98 FIRST BREAK I VOLUME 42 I MARCH 2024 SPECIAL TOPIC: RESERVOIR MONITORING
Depth (ft) VP AIP Ø (%) Depth (ft) V s AI s Ø (%) 11290 12450 31946.7 13.3 11290 5915 15177.89 13.3 11293 13750 34650 16.0 11295 6595 17344.85 8.5 11289 14250 35197.5 19.1 11293 6960 17539.2 16.0 11294 14650 37884.9 12.6 11292 7090 18639.61 8.2 11295 15150 39844.5 8.5 11286 7280 19459.44 7.0 11286 15650 41832.45 7.0 11289 7535 18611.45 19.1 11284 16100 41264.3 15.1 11294 7540 19498.44 12.6 1500 psi 1500 psi 11290 13400 34384.4 13.3 11290 6800 17448.8 13.3 11293 14400 36288 16.0 11293 7560 19051.2 16.0 11289 14800 36556 19.1 11289 7930 19587.1 19.1 11294 15400 39824 12.6 11295 7770 20435.1 8.5 11292 15800 41538.2 8.2 11292 7810 20532.49 8.2 11295 16100 42343 8.5 11294 8220 21256.92 12.6 11284 16600 42545 15.1 11286 8220 21972.06 7.0 3500 psi 3500 psi 11290 14700 37702.2 13.3 11290 7820 20066.12 13.3 11289 15300 37791 19.1 11293 8070 20336.4 16.0 11293 15200 38304 16.0 11289 8310 20525.7 19.1 11294 16300 42151.8 12.6 11294 8810 22782.66 12.6 11284 16800 43058.4 15.1 11292 8750 23003.75 8.2 11292 16900 44430.1 8.2 11426 8630 23542.64 2.0 11288 17600 45848 12.2 11284 9050 23195.15 15.1 6500 psi 6500 psi 11294 15800 39026 19.1 11289 8570 21167.9 19.1 11290 15700 40286.2 13.3 11293 8540 21520.8 16.0 11293 15900 40068 16.0 11290 8400 21554.4 13.3 11294 16900 43703.4 12.6 11426 8420 22969.76 2.0 11284 17300 44339.9 15.1 11294 9270 23972.22 12.6 11288 18000 46890 12.2 11284 9420 24143.46 15.1 11292 17900 47059.1 8.2 11292 9410 24738.89 8.2
500 psi 500 psi
Table 2 Coordinates (V p , AI p) and (V s , AI s), sample depths and porosity (Ø) values of the first seven data points in the trendline zone of decreasing velocity and acoustic impedance. Data is presented for P-wave and S-wave at each level of effective pressure.

speculate that the recorder may have swapped the readings for 3500 psi and 6500 psi.

Conclusions and recommendations

Rock property measurements obtained from the public domain confirm that the acoustic impedance-velocity linear relationships for P-wave and S-wave are valid for both low and high levels of effective pressure. The measurements were made on brine-saturated core samples extracted from the complex Red River ‘C’ zone reservoir in the Williston Basin, USA. The samples represent various ranges of porosity, rock-types and permeability.

Linear-linear crossplots of P-wave impedance versus P-wave velocity and S-wave impedance versus S-wave velocity show uniformly high correlation coefficients indicative of strong linearity at high and low levels of effective pressure. Both carbonate rock-types and porosities are consistently segregated along the trendlines, with low porosity rock-types segregated in the direction of increasing velocities and impedances and higher porosity rock-types segregated in the direction of decreasing velocities and impedances.

Values of slopes and intercepts obtained from the crossplots show consistent results within the S-wave group and within the P-wave group. The slopes show slight differences within each group but quantitatively similar in both groups. The intercepts are all negatives and increase in the direction of increasing effective pressure, but the intercepts in the P-wave group are much greater than those in the S-wave group. The slopes and intercepts represent groups of geology-dependent parameters; any discussion of the correlation between their values and the geology-dependent parameters is beyond the scope of this work. Despite this limitation, results of this study have immense potential in predictive and quantitative reservoir characterisation.

This work has been done with laboratory measurements on cores that exist in the public domain. A more controlled study will be required to further understand the effects of effective pressure on air-saturated carbonate and clastic samples, and, ultimately, to extend the study to well logs and reflection seismic data. For more predictive use of the impedance-velocity linear relationships, better understanding of the correlation between values of slopes, and intercepts and geology-dependent parameters that comprise the slope and intercept terms, would be essential. Because erroneous data could masquerade as favourable porosity and rock-type, adequate quality control must be an essential component of any future studies.

Nomenclature

Abbreviations

P-wave = compressional (primary) wave

S-wave = shear (secondary) wave

Symbols

AI p = P-wave acoustic impedance

AI s = S-wave acoustic impedance

rb = bulk density

rf = fluid density

rm = matrix density dependent on lithology or rock-type

V p = P-wave velocity

V s = S-wave velocity

Δ tp = P-wave transit-time (reciprocal velocity, sometimes called slowness)

Δ ts = S-wave transit-time (reciprocal velocity, sometimes called slowness)

Δ tmp = P-wave matrix transit-time dependent on lithology or rock-type

Δ tms = S-wave matrix transit-time dependent on lithology or rock-type

BS = S-wave coefficient dependent on lithology or rock-type, effective stress, grain contact areas and pore fluid

B p = P-wave coefficient dependent on lithology or rock-type, effective stress, grain contact areas and sometimes pore fluid

∅= porosity

References

Domenico, S.N. [1984a]. Determine lithology/porosity from P and S-wave velocities: World Oil, July, 142A-G.

Domenico, S.N. [1984b]. Rock lithology and porosity determination from shear and compressional wave velocity: Geophysics, 49, 1188-1195.

Ikwuakor, K.C. [1988]. Vp/V s Revisited: Pitfalls and new interpretation techniques: World Oil, 207, 41-46.

Ikwuakor, K.C. [1994]. Use of “Rock-Typing” to characterize carbonate reservoir heterogeneity: Final Report prepared for the U.S. Department of Energy, Contract No. DE-AC22-91BC14655, 389 p. https:// doi.org/10.2172/10143027.

Ikwuakor, K. [2022]. Connecting elastic properties estimated from seismic inversion to reservoir properties and geologic interpretations: First Break, 40, March, 83-91, https://doi.org/10.3997/1365-2397. fb2022026.

Ikwuakor, K.C. [2023]. Multi-well characterization of complex carbonate reservoirs using S-wave and P-wave impedance: The Mission Canyon Carbonates (Mississippian) , Williston Basin, USA, as a test case: First Break, 41, March, 57-64. https://doi.org/10.3997/13652397.fb2023021.

Kohm, J.A. and Louden, R.O. [1978]. Ordovician Red River of Eastern Montana and Western North Dakota: Relationships between lithofacies and production: Montana Geological Society Guidebook, Williston Basin Symposium, 99-107.

Pickett, G.R. [1963]. Acoustic character logs and their application in formation evaluation: Journal Petroleum Technology, 15, 659667.

FIRST BREAK I VOLUME 42 I MARCH 2024 99 SPECIAL TOPIC: RESERVOIR MONITORING

Minus CO2 Challenge 2023 – Student teams tackle load-balancing via compressed air and hydrogen storage in Carboniferous salt caverns: Cumberland County, Nova Scotia, Atlantic Canada

Imad Smaini1, Lucia Varela2, Waithera Gakio3, Vinicius Carneiro 4, Reem Al-Subaie 5, Helen Cen 6, Natasha MacAdam 6, Trevor Kelly6, Fraser Keppie 6, Adam Macdonald 6, Maurice Dusseault7, Grant Wach8, Carla Skinner 9,10, Giancarlo Bernasconi9,11, Antonia Hardwick 9,12 , Karine Labatt2,9, Roger Clark 9,13, Thomas Finkbeiner 9,14 and Bill Richards 6,8,9*.

Competition results

Congratulations to the five teams who prepared technical reports and gave excellent online presentations in the final round of the 2023 Minus CO2 Challenge. We also congratulate the two leading teams who presented in person at the opening session of the Global Energy Transition Conference (GET) in Paris in November 2023 (Figure 1). Edward Wiarda, EAGE president, kindly presented the prizes. A special mention goes to Lucia Manuel Varela, who singlehandedly represented her team.

The competing teams were:

• (1) ‘Decarbo-Nomads’ University of M’hamed Bougara, Boumerdes, Algeria (UMBB)

• (2) ‘The CarbonBusters’ IFP School, Paris (IFP)

• (3) ‘NetZero Heroes’ Clausthal University of Technology, Germany (TUC)

• ‘Gaia Team’ Federal University of Bahia, Salvador, Brazil (UFBA)

• Kuwait University Team, Kuwait City, Kuwait (KU)

Introduction

The Cumberland Basin project (location in Figure 2) is the third of three successive Minus CO2 Challenges set in Nova Scotia, and the 18th EAGE student competition since 2010 (world map of all participant universities in Figure 3). It follows a carbon storage assessment of the Scotian Shelf (Chakraborty et al, 2022) and carbon-neutral development of a hypothetical oil field at Penobscot near Sable Island (Haemmerlein et al., 2023). The 2023 competition was stimulated by an online news article (Dusseault and Wach, 2020) and regional geocellular-geothermal modelling of the Cumberland Basin at the Nova Scotia Department of Natural Resources and Renewables that includes major salt deposits (Cen & Richards – in preparation).

The Cumberland Basin (Waldron et al, 2005 & 2013) is an intermontane Mississippian-Pennsylvanian basin located mainly

in Cumberland County which includes much of the Isthmus of Chignecto that connects Nova Scotia to mainland Canada. It is one of a number of basins within the overall Maritimes Basin (Gibling et al, 2019) that, along with American and European coal basins, formed during the late stages of the assembly Pangea (Figure 4). The Cumberland Basin is dominated by deposition of continental clastics, punctuated in the Visean by marine incursions, with deposition of limestones and extensive evaporites of the Windsor Group. Subsequent diapirs have driven a major salt industry where they reach the surface near coastal ports. In addition, a major salt diapir brings Westphalian bituminous coals to the surface at Springhill. In this town, five vertically stacked coal mines were worked from 1873 to 1959, downdip from surface outcrops to ~1300m depth. Subsequent water wells down to 200 m provide district heating and cooling (Jessop et al., 1995). Teams were charged with developing 300 MW of greenfield renewable energy from wind, solar or hydro-electric sources (but not tidal) and to guarantee a consistent base load capability using either CAES (compressed air energy

FIRST BREAK I VOLUME 42 I MARCH 2024 101 SPECIAL FEATURE: MINUS CO2 CHALLENGE 2023 1 University M’hamed Bougara of Boumerdes | 2 IFP School | 3 Clausthal University of Technology 4 Federal University of Bahia | 5 Kuwait University | 6 Nova Scotia Department of Resources and Renewables 7 University of Waterloo | 8 Dalhousie University | 9 EAGE Student Affairs Committee | 10 Geological Survey of Canada 11 Politecnico di Milano | 12 Rejuvenate Energy, Hardwick Geophysical & University of Leicester | 13 University of Leeds 14 King Abdullah University of Science and Technology * Corresponding author, E-mail: billrichards888@hotmail.com
Figure 1 Edward Wiarda (EAGE president, third left), Bill Richards (EAGE Student Affairs Committee chair and judge, second right) with Imad Smaini, Ahmed Guembour and Ibrahim Elkhallil Hadjadj from ‘Decarbo-Nomads’ team and Lucia Varela from ‘The CarbonBusters’ team.

storage) or UHS (underground hydrogen storage) in salt caverns.

In North America and Europe, operational facilities at Huntorf, Mcintosh and Goderich provide CAES analogues with UHS analogues in the UK, Texas, and Germany (Table 1). The teams needed to address three additional tasks.

1. To place the project in the United Nations Framework Classification for Resources (United Nations, 2019). It ranked very high, based on technical feasibility, geologic knowledge, and socio-economic viability. UMBB assessed it 122 out of 1-4 in each category. KU placed it 222.

2. To consider community involvement – in view of a recently terminated methane salt cavern storage project at Alton (Ryan, CBC News, 2021). Teams focused on early engagement and participation, with UMBB envisaging interaction with indigenous communities through the Mi’kmaw Kina’matnewey initiative.

3. To discuss how this type of project might play out in their countries. TUC presented leading developments in wind and hydrogen storage technology in Germany. UMBB highlighted abundant solar, wind and salt diapirism in Algeria; KU emphasised undeveloped wind potential on Kuwait’s offshore islands and UFBA stressed the economic attractiveness given Brazilian energy tariffs.

Dataset

The project was conceived and organised by the Nova Scotia Department of Natural Resources and Renewables (DNRR) who, in addition to public access to their extensive online resources, provided digital copies of online data: geologic cross-sections and geologic maps (notably NS DNNR, 2006; Keppie J.D.); well reports and LAS files; a regional salt horizon (from geocellular modelling); seismic images; and key publications such as ‘Salt and Potash Deposits in Nova Scotia’ (Boehner, 1986).

Figure 5a and 5b show, respectively, an annotated map view of surface salt distribution and mines (Boehner, 1986) adjacent to a 3D perspective view from the 2022 geocellular model. The geocellular model (Figure 6) was constructed via surface geology, wells, and good quality 2D seismic data. Initial complex interpretations by John Waldron at the DNRR (Waldron et al., 2005 and 2013) were simplified for modelling purposes and geothermal calculations were undertaken using a procedure published by Bedard et al. (2020) in the St. Lawrence Lowlands sedimentary basin. A representative seismic line is shown in Figure 7.

Power generation

The teams considered wind, solar, and hydro-electric power generation with consensus that onshore wind provides the best opportunities based on abundant wind, costs, and the

102 FIRST BREAK I VOLUME 42 I MARCH 2024 SPECIAL FEATURE: MINUS CO2 CHALLENGE 2023
CAES Huntorf Germany McIntosh Alabama Goderich Ontario Company Uniper Power S. Hydrostor Date 1978 1991 2019 Caverns* 2 1 1 Depth (m) 650 450 NA Height (m) 150 NA NA Diameter (m) 50 NA NA Volume m3 310.000 583.000 NA Pressure (bar) 43-70 45-76 NA Power 290 MW 110 MW 2.2 MW Energy 580 MWh 2.86 GWh 10 MWh Sources * 1 unless known otherwise. NA= not available. He et al., 2017; Wang et al., 2022; Polanski, 2019. UHS Teesside UK Keil Germany Clemens Dome Texas Moss Bluff Texas Spindletop Texas Company SABIC NA Praxair Conoco-Phillips Air Liquide Date 1972 1971 1986 2007 2017 Caverns* 3 1 1 1 1 Depth (m) 350-400 1335 850 823 1128 Height (m) 15-40 80-100 300 579 518 Diameter (m) 70 NA 49 60 76 Volume m3 70.000 32.000 580.000 566.000 NA Pressure (bar) 45-50 80-100 70-135 55–152 up to 150 Power NA NA NA NA NA Energy 25 GWh NA 92 Gwh 120 GWh >120 Gwh Sources * 1 unless known otherwise. Pnafilov, 2016; GaffneyCline, 2022; Williams et al.; 2022, Jahanbakhsh et al., 2024.
Table
1 Operational CAES and UHS facilities in Europe and North America.

complexities of offshore ice in the Northumberland Strait and Bay of Fundy (plus famous tides). None of the teams pursued onshore hydro-electricity, mainly due to costs and lack of suitable new potential sites. UMBB augmented 200 MW of wind power with solar to cope with slack wind periods of 10-20 days, mostly in the summer when daylight approaches 16 hours.

The design of wind power facilities comprised several stages, influenced by proximity to suitable storage sites.

Potential locations were assessed based on online wind maps (Figure 8, Global Wind Atlas, from the UFBA report)

and open-source software that provides yearly/hourly wind data worldwide with power generation capability based on the number, type, height, and nominal capacity of turbines (Figure 9, with data from windatlas.xyz: Hayes et.al., 2021).

The next step was estimating the power production to storage ratio, allowing for inefficiencies in both storage and retrieval. Teams typically estimated that ~100 MW continuous production is sustainable with storage above that, up to the design capacity of 300 MW (Figure 9).

Specific wind-farm plans ranged from 20 to 165 turbines matched to local conditions. UMBB proposed 80 x 2.5 MW turbines on the North Shore near Malagash for 200 MW (+100 MW solar). IFP proposed 45 x 6.6 MW turbines for 300 MW near Oxford. TUC proposed 150 x 2 MW turbines at Nappan. UFBA (reasonably) interpreted the objective as 300 MW of guaranteed base load capacity and designed a 700 MW wind-farm in the Springhill area (the area also selected by KU). UMBB designed a 100 MW solar farm at Amherst using Solar HiKu 350-watt panels. Average solar irradiance in Nova Scotia is shown in Figure 10.

Energy storage

Two teams opted for CAES: IFP at Oxford, and UTC at Nappan, with UMBB opting for an A-CAES (Adiabatic) system with a new 200,000 m3 solution-mined cavern to meet daily needs and a UHS system in a new 600,000 m3 solution-mined cavern to meet seasonal, mostly winter, shortfall. Two teams opted for UHS: UFBA with a 500,000 m3 cavern and UTC with a development in the Nappan area. Similar to power generation, some

FIRST BREAK I VOLUME 42 I MARCH 2024 103 SPECIAL FEATURE: MINUS CO2 CHALLENGE 2023
Figure 3 Locations of universities that have participated in the Laurie Dake and Minus CO2 Challenges since 2010. Many thanks to organisations that have provided data sets, software, and sponsorship. (From EAGE records & Roger Clark’s personal records). Figure 2 Location of the Cumberland Basin Project within the Maritimes Basin (2023 Minus CO2 Challenge); the Penobscot Project (2022 Minus CO2 Challenge); the Scotian Shelf Project (2021 Minus CO2 Challenge). Basins from GSC and CNSOPB publications.

teams put very detailed effort into specific technical aspects: IFP on the geomechanics of salt cavern design and UTC on energy conversion to hydrogen through different electrolysismethods.

The differing selections of CAES versus UHS were based on safety (favouring compressed air over small-molecule, potentially leaky, flammable, hydrogen) or based on energy density, movability and storage duration (favouring hydrogen).

Costs, revenues and economics

The two leading teams, UMBB and IFP, presented economic analyses aligned with the organisers, with costs sourced from IRENA (2022) and the Pacific Northwest National Laboratories (2021) and revenues from Nova Scotia Power (https://www.nspower.ca/) and Energy Nova Scotia (https://energy.novascotia.ca). Five recent wind projects, majority-owned by Mi’kmaw communities, are expected to generate at an average cost of $53.17 / MWh (Smith, CBC News, 2022). UMBB estimated Capex at $826 million with wind and solar facilities at $627 million. At $164 / MWh revenue (Nova Scotia Power standard residential rate) UMBB calculated an IRR of 21% at 20 years.

IFP had Capex at $557 million (wind-farm $390 million; caverns $160 million) and positive economics with a consumer price of $132 / MWh and a 12% hurdle rate. However at wholesale prices as low as $40 / MWh (from purchase agreements) the project would require support to becompetitive.

These results should be seen in the context of Nova Scotia abandoning the proposed Atlantic Loop linkage to hydro-electric power in Labrador that costs 250-300 /MWh (Withers, CBC News, October 2023). One thousand MW of onshore wind is planned by 2030 including battery storage.

104 FIRST BREAK I VOLUME 42 I MARCH 2024 SPECIAL FEATURE: MINUS CO2 CHALLENGE 2023
Figure 4 Tectonic setting of the Maritimes Basin within collisional area of Gondwana and Laurasia in the final stages of Pangean assembly (summarised from Gibling et al, 2019). Figure 5 (a) The Cumberland Basin, bounded by the Hastings Uplift and Cobequid Highlands. Salt deposit surface outcrops are shown in green (Boehner, 1986). 5 (b) Perspective view of Top Windsor Salt horizon (Cen & Richards - Nova Scotia DNNR model) with outlines of the Springhill coal mines.
FIRST BREAK I VOLUME 42 I MARCH 2024 105 SPECIAL FEATURE: MINUS CO2 CHALLENGE 2023
Figure 6 (a). Nova Scotia DNRR geocellular/geothermal model of the Cumberland Basin. Map view of surface geology. Coastline (green), towns (red), wells (black), surface geology, seismic lines (blue). Figure 6 (b). Traverses A,B,C with wells, gamma ray logs and isotherms extracted from temperature model. Figure 7 2D seismic line through Nappan and Springhill salt diapirs (based on Waldron, 2013) Figure 8 Mean Wind Speed (from the UFBA report), https:// globalwindatlas.info/en.

Yearly/hourly wind converted to power and separated into storage and production. Low wind periods are highlighted. The optimum guaranteed baseload (~ 100 MW) can be estimated iteratively keeping the cumulative sum of production and storage positive. This can be adjusted seasonally or with input from secondary sources such as solar.

106 FIRST BREAK I VOLUME 42 I MARCH 2024 SPECIAL FEATURE: MINUS CO2 CHALLENGE 2023
Figure 11 Strengths Weaknesses Opportunities and Threats (SWOT analysis): IFP School. Figure 10 Provincial solar energy map (www.energyhub.org). Figure 9 Wind power production versus storage. //windatlas.xyz/about/.

Environmental and demographic risks and mitigation

IFP summarised strengths, weaknesses, opportunities, and threats in a SWOT analysis (Figure 11), while more broadly, UMBB embraced the UNFC classification and SDGs, aligning the project with goals 17, 13, 9 and 7 (Figure 12).

At a detailed level IFP School tabulated risks, mitigation (and monitoring) strategies in the key areas of health and safety, environmental, social and community, economic and financial (reproduced here as Figure 13). Most important are geo-mechanical and operational monitoring that impact safety.

Conclusions and acknowledgments

From the perspective of the Nova Scotia DNRR this has been a very useful exercise, with many sets of eyes and multi-disciplinary teamwork progressing an idea in a 2020 news article to wide-ranging analyses and concrete plans. We hope the teams found this an exciting and interesting project and we thank them – and the EAGE judges – for their enthusiasm and hard work. The EAGE would like to thank Fraser Keppie and Natasha MacAdam from the NS DNRR for participating as judges.

The ‘Minus CO2 Challenge 2023’

Top 5 Teams, Judges, and Administrators

First Place – University M’hamed Bougara of Boumerdes, Algeria

• Merouane Sbaihi

• Imad Smaini

• Ahmed Guembour

• Ibrahim Elkhalil Hadjadj

• Wassim-Allalouche

Second Place – IFP School, France

• Dri Juan Manuel

• Lencinas Pupkiewicz Santiago

• Miranda Pinto Lucas

• Sepulveda Pablo

• Varela Lucia

• Advisor: Torres Arnaud

Third Place – Clausthal University of Technology, Germany

• Waithera Gakio

• Jonathan Heetlage

• Mahmoodzia Zamaninia

• Supervisor: Prof. Dr. Philip Jaeger

Runner Up – Federal University of Bahia, Salvador, Brazil

• Filipe de Moura Antônio Cordeiro

• João Pedro Silva Gomes

• Matheus Radames Silva Barbosa

• Vinicius Carneiro Santana

• Mentor: Alexsandro Guerra Cerqueira

Runner Up – Kuwait University Team, Kuwait

• Reem Al-Subaie

• Sultan K. Dwier

• Nuwyer Al-Azmi

Judges and Administrator

• Fraser Keppie and Natasha MacAdam (Nova Scotia Department of Resources and Renewables)

• Giancarlo Bernasconi (Politecnico di Milano)

• Roger Clark (University of Leeds)

• Thomas Finkbeiner (King Abdullah University of Science and Technology)

• Karine Labat (IFP School)

• Antonia Hardwick (Lithothermal Resources Ltd., Hardwick Geophysical Ltd., Rejuvenate Energy)

• Carla Skinner (Geological Survey of Canada)

• Bill Richards (Dalhousie University and NS DNRR)

• Maria Jose Rodriguez (EAGE Adminstrator)

References

Bedard, K., Comeau, F-A., Raymond, J., Gloaguen, E., Malo, M., Richard M-A. [2019]. Deep geothermal resource assessment of the St. Lawrence Lowlands sedimentary basin (Quebec) based on 3D regional geological modelling. Geomechanics and Geophysics for Geo-Energy and Geo-Resources volume 6, 46. https://doi. org/10.1007/s40948-020-00170-0

Boehner, R.C. [1986]. Salt and Potash Resources in Nova Scotia. Department of Natural Resources. Mineral Resources Branch. Bulletin ME 5. https://novascotia.ca/natr/meb/pdf/bull05.asp.

Chakraborty, A., Barbosa, M.R.S., Rizk, A.S.M., Watts, K., Richards, B. and Wach, G. [2022]. Minus CO2 Challenge 2021/2022 – Student teams evaluate potential world-class carbon storage resources offshore Nova Scotia, Eastern Canada. First Break, 40, April 2022.

Dusseault, M.B. and Wach, G.D. [2020]. Greening the Maritimes – Leading the World in the Energy Transition? https://www.saltwire.com/halifax/ opinion/local-perspectives/maurice-b-dusseault-grant-wach-greeningthe-maritime-grid-lets-lead-world-in-energy-transition-489931/ Gaffney Cline [2022]. Underground Hydrogen Storage https://www. gaffneycline.com/sites/g/files/cozyhq681/files/2022- 07/gaffneycline_underground_hydrogen_storage_article.pdf

Gibling, M.R., Culshaw, N., Pascucci, V., Waldron, J.W.F. and Rygel, M.C. [2019]. The Maritimes Basin of Atlantic Canada: Basin Creation and Destruction During the Palaeozoic Assembly of Pangea. In: The Sedimentary Basins of the United States and Canada (Second Edition), 267-314. https://doi.org/10.1016/B978-0-444-63895-3.00006-1. Haemmerlein, M., Eleslambouly, A., Rafik, B., Rezvani, H., Berrehal, B.E., Richards, B. and Wach, G. [2023]. Minus CO2 Challenge 2023 – carbon neutral development of a 400-million-barrel prospect at Penobscot, offshore Nova Scotia, Eastern Canada. First Break, 41, June 2023. 101-112.

Hayes, L., Stocks, M. and Blakers, A. [2021] Accurate long-term power generation model for offshore wind farms in Europe using ERA5 reanalysis. Energy 229 (2021) 120603. http://windatlas.xyz/ about/.

He, W., Luo, X., Evans, D., Busby, J., Garvey, S., Pakes, D. and Wang, J. [2017]. Exergy storage of compressed air in cavern and cavern volume estimation of the large-scale compressed air energy

FIRST BREAK I VOLUME 42 I MARCH 2024 107
FEATURE: MINUS CO2 CHALLENGE 2023
SPECIAL
108 FIRST BREAK I VOLUME 42 I MARCH 2024 SPECIAL FEATURE: MINUS CO2 CHALLENGE 2023
Figure 12 ‘Meeting the UNFC Evaluation Standards’ (UMBB). Figure 13 Potential risks and mitigations: IFP School.

storage system. Applied Energy 208 (2017) 745-757. https://doi. org/10.1016/j.apenergy.2017.09.074.

IRENA International Renewable Energy Agency. [2022] Renewable power Generation Costs in 2021. https://www.irena.org/publications/2022/Jul/Renewable-Power-Generation-Costs-in-2021.

Jahanbakhsh, A., Potapov-Crighton, A.L., Mosallanezhad, A., Kaloorazi, N.T. and Maroto-Valer, M. [2024]. Underground hydrogen storage: A UK perspective. Renewable and Sustainable Energy Reviews. 189 (2024) 114001. https://doi.org/10.1016/j.rser.2023.114001.

Jessop, A.M., MacDonald, J.K. Spence, H. 1995. Clean energy from abandoned mines at Springhill, Nova Scotia. Energy Sources 17(1), 93-106. https://doi.org/10.1080/00908319508946072.

NS DNRR, [2006]. Geological map of the province of Nova Scotia, Scale 1:500 000, Compiled by J. D. Keppie, 2000. Digital Version of Nova Scotia Department of Natural Resources Map ME 2000-1. DP ME 43, Version 2 https://novascotia.ca/natr/meb/download/dp043.asp.

Pacific Northwest National Laboratory [2020]. Grid Energy Storage Technology Cost and Performance Assessment. https://www.pnnl. gov/sites/default/files/media/file/Final%20-%20ESGC%20Cost%20 Performance%20Report%2012-11-2020.pdf.

Panfilov, M. [2016]. Underground and pipeline hydrogen storage. In Compendium of Hydrogen Energy, Ed. Gupta R.B., Elsevier, Chapter 4, p. 920116, 2015. https://www.sciencedirect.com/science/article/ pii/B9781782423621000043.

Polanski, K. [Oct 22,2019]. Numerical calculations of main stress in the rock massif around salt cavern for compressed air storage. Earth and Environmental Science 214 (2019) 012079. doi:10.1088/17551315/214/1/012079.

Ryan, H. [Oct 22,2021]. CBC News. Alton Gas project cancelled after years of opposition.. https://www.cbc.ca/news/canada/nova-scotia/ alton-gas-project-cancelled-after-years-of-opposition-1.6221165.

Smith, S. [Aug 17, 2022] CBC News. N.S. selects five wind projects to produce electricity from renewable sources. https://www.cbc.ca/ news/canada/nova-scotia/n-s-selects-five-projects-largest-ever-windprocurement-1.6553677.

United Nations [2019]. United Nations Framework Classification for Resources. ECE Energy Series No. 61. https://unece.org/sites/default/ files/2023-10/UNFC_ES61_Update_2019.pdf.

Wang, H., Wang, Z., Liang, C., Carriveau, R., Ting, D.S-K., Peng, L., Cen, H. and Xiong, W., [2022]. Underwater Compressed Gas Energy Storage (UWCGES). Applied Sciences 2022,12 9361. https://doi. org/10.3390/app12189361.

Waldron, J.W.F., and Rygel, M.C. [2005]. Role of evaporite withdrawal in the preservation of a unique coal bearing succession: Pennsylvanian Joggins Formation, Nova Scotia: Geology, 33, 337-340, doi:10.1130/ G21302.1.

Waldron, J.W.F., Rygel, M.C., Gibling, M.R. and Calder, J.H. [2013]. Evaporite tectonics and the late Palaeozoic stratigraphic development of the Cumberland basin, Appalachians of Atlantic Canada. GSA Bulletin; May/June 2013, 125(5/6) 945-960; doi: 10.1130/B30718.

Williams, J.D.O., Williamson, J.P., Parkes, D., Evans, D., Kirk, K.L., Nixon, N., Hough, E., Vosper, H and, Akhurst, M.C. [2022] Does the United Kingdom have sufficient geological storage capacity to support a hydrogen economy? Estimating the salt cavern storage potential of bedded halite formations. Journal of Energy Storage 53 (2022) 105109. https://doi.org/10.1016/j.est.2022. 105109.

Withers, P. [Oct 11,2023] CBC News. N.S. abandons Atlantic Loop, will increase wind and solar energy projects for green electricity. https:// www.cbc.ca/news/canada/nova-scotia/clean-power-plan-abandonsatlantic-loop-1.69927651.

FIRST BREAK I VOLUME 42 I MARCH 2024 109
Email earthdoc@eage.org to start your FREE TRIAL today! www.earthdoc.org Connect your institution with cutting edge geoscience and engineering content ■ Access over 75,000 papers and articles ■ Event papers from EAGE and partner associations held around the world ■ IP address authenticated access from your smart phone, tablet, laptop or PC EarthDoc 171x100.indd 1 14/12/2023 13:50 ADVERTISEMENT

CALENDAR OF EVENTS

March 2024

4-6 Mar EAGE Sub-Saharan Africa Energy Forum www.eage.org

13-15 Mar Norwegian Petroleum Society Biennial Meeting www.npf.no/konferansen/geophysical2024

25-27 Mar 4th EAGE Digitalization Conference & Exhibition www.eagedigital.org

26-27 Mar AAPG/GESGB Business & Exploration Opportunities Show www.beosevent.com

April 2024

8-10 Apr EAGE GeoTech 2024 - 3 rd EAGE Geoscience Technologies and Applications Conference (including 4th EAGE Workshop on Distributed Fibre Optic Sensing and 4th EAGE Workshop on Practical Reservoir Monitoring) www.eagegeotech.org

8-12 Apr ARPEL-NATURGAS Week 2024 www.semanaarpelnaturgas.com/english

14-19 Apr EGU General Assembly www.egu24.eu

23-25 Apr First EAGE Workshop on Advances in Carbonate Reservoirs: from Prospects to Development www.eage.org

May 2024

1-2 May Seismic2024 www.spe-aberdeen.org/events/seismic-2024

13-15 May Fourth EAGE/AAPG Hydrocarbon Seals Workshop www.eage.org

13-15 May 6th Asia Pacific Meeting on Near Surface Geoscience and Engineering www.eage.org

EAGE Events Non-EAGE Events

8-10 APRIL 2024

EAGE GeoTech 2024

3rd EAGE Geoscience Technologies and Applications Conference

The Hague, The Netherlands www.eagegeotech.org

Windhoek Namibia

Kristiansand Norway

Paris France

London United Kingdom

The Hague The Netherlands

Cartagena Colombia

Vienna Austria

Kuwait City Kuwait

Aberdeen United Kingdom

Al Khobar Saudi Arabia

Tsukuba Japan

110 FIRST BREAK I VOLUME 42 I MARCH 2024 CALENDAR

13-16 May InterPore 2024 events.interpore.org/event/46/

15-16 May DGMK/ÖGEW Spring Conference 2024 www.dgmk.de

20-23 May EAGE/SUT Workshop on Integrated Site Characterization for Offshore Renewable Energy www.eage.org

27-31 May 12 th Congress and Technical Exhibition of the Balkan Geophysical Society (BGS) www.ageserbia.org

June 2024

10-13 Jun 85 th EAGE Annual Conference and Exhibition www.eageannual.org

July 2024

30-31 Jul EAGE Workshop on Advanced Petroleum Systems AssessmentsIn Pursuit of Differentiated Barrels www.eage.org

August 2024

12-13 Aug 3 rd EAGE Conference on Carbon Capture and Storage Potential www.eage.org

14-15 Aug 4th EAGE Workshop on Fiber Optic Sensing for Energy Applications www.eage.org

14-15 Aug 1st EAGE/SUT Workshop on Integrated Site Characterization for Offshore Wind in Asia Pacific www.eage.org

18-23 Aug Goldschmidt 2024 conf.goldschmidt.info/goldschmidt/2024/meetingapp.cgi

September 2024

2-4 Sep Fourth EAGE Marine Acquisition Workshop www.eage.org

2-5 Sep ECMOR 2024 - European Conference on the Mathematics of Geological Reservoirs www.ecmor.org

3-5 Sep SGI - SIMP Congress www.geoscienze.org/bari2024

8-12 Sep Near Surface Geoscience Conference and Exhibition 2024 www.eagensg.org

12-13 Sep First EAGE Workshop on The Role of AI in FWI www.eage.org

16-18 Sep Eighth EAGE High Performance Computing Workshop www.eage.org

17-19 Sep Fourth EAGE Conference on Pre-Salt Reservoir www.eage.org

Qingdao China

Celle Germany

Boston United States

Kopaonik Mt. Serbia

Oslo Norway

Kuala Lumpur Malaysia

Perth Australia

Perth Australia

Perth Australia

Chicago United States

Oslo Norway

Cartagena Colombia

KAUST Saudi Arabia

Rio de Janeiro Brazil

FIRST BREAK I VOLUME 42 I MARCH 2024 111 CALENDAR
MORE EVENTS ON THE NEXT PAGE!
EAGE Events Non-EAGE Events
E u r o p e a n M e e t i n g o f E n v i r o n m e n t a l a n d E n g i n e e r i n g G e o p h y s i c s 30th C o n f e r e n c e o n Ge o p h y s i c s f o r M i n e r a l E x p lo r a t i o n a n d M i n i n g 5th C o n f e r en c e o n A i r b o r n e , D r o n e a n d R o b o t i c Ge o p h y s i c s 4th
SEPTEMBER
| HELSINKI, FINLAND
8-12
2024
112 FIRST BREAK I VOLUME 42 I MARCH 2024 CALENDAR EAGE Events Non-EAGE Events October 2024 1-4 Oct 18 th SAGA Biennial Conference & Exhibition www.sagaconference.co.za Windhoek Namibia CALENDAR OF EVENTS 12-13 Nov 2 nd EAGE Workshop on Integrated Subsurface Characterization and Modeling www.eage.org Kuala Lumpur Malaysia 20-21 Nov Asia Petroleum Geoscience Conference and Exhibition (APGCE) icep.com.my/apgce Kuala Lumpur Malaysia December 2024 3-5 Dec First EAGE Symposium on Geosciences for New Energies in America www.eage.org México City México STAY TUNED AND STAY ENGAGED DISCOVER NEW DEVELOPMENTS ON OUR EVENTS EAGE.ORG/EVENTS
DELIVERING BETTER ENERGY IN A TRANSFORMING WORLD 25-27 MARCH 2024 I PARIS I FRANCE JOIN EAGE’S FLAGSHIP EVENT HIGHLIGHTING DIGITALIZATION AND TECHNOLOGICAL INNOVATION IN THE SUBSURFACE WWW.EAGEDIGITAL.ORG HOSTED BY REGISTER NOW TO CLAIM YOUR SPOT STRATEGIC PROGRAMME Enagage with Executive Speakers in Keynotes, Roundtables and Panel Discussions TECHNICAL PROGRAMME Delve into Diverse Oral and Poster Presentations FOCUSED EXHIBITION Meet the Companies Pioneering Digital Solutions
REGISTRATION IS OPEN! BENEFIT FROM THE EARLY BIRD FEE UNTIL 15 MARCH 2024 OSLO | NORWAY 2024 HOST PARTNERS WWW.EAGEANNUAL.ORG
Issuu converts static files into: digital portfolios, online yearbooks, online catalogs, digital photo albums and more. Sign up and create your flipbook.