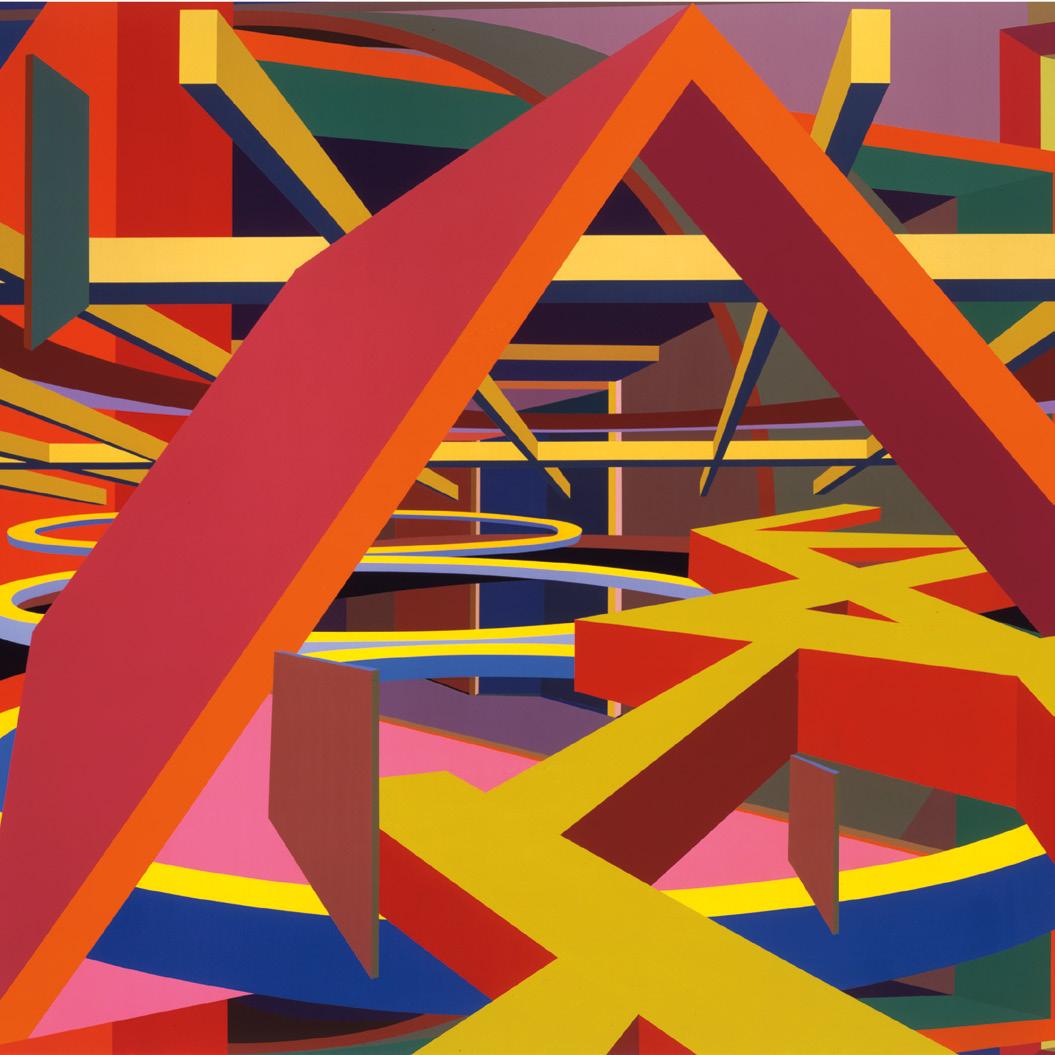
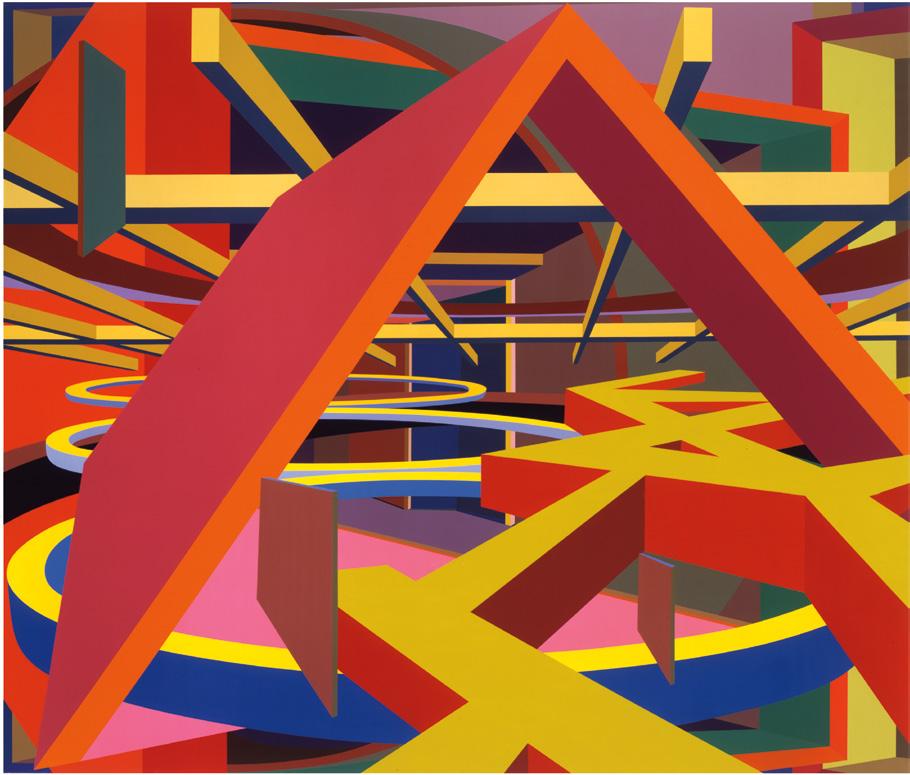
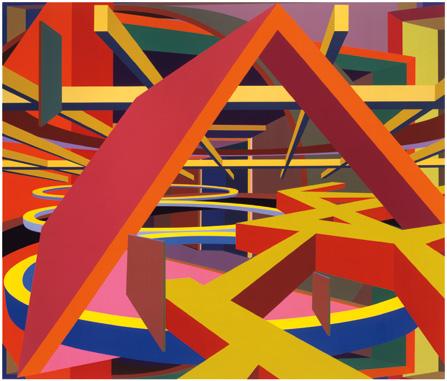
Abstract expressionist Al Held was an American painter best known for his “hard edge” geometric paintings. His bright palettes and bold forms create a three-dimensional space that appears to have infinite depth. Held, who sometimes found inspiration in architecture, would often play with the viewer’s sense of visual perception. While most of Held’s artworks are paintings, he also worked in mosaic and stained glass.
1 Scientific Notation, Exponents, and Irrational Numbers
2 Rigid Motions and Congruent Figures Module
3 Dilations and Similar Figures
4 Linear Equations in One and Two Variables
5 Systems of Linear Equations
6 Functions and Bivariate Statistics
Dilations and Similar Figures
Topic A 3
Dilations
Lesson 1
Exploring Dilations
Lesson 2
Enlargements
Lesson 3
Reductions and More Enlargements
Topic B
Properties of Dilations
Lesson 4
Using Lined Paper to Explore Dilations
Lesson 5
Figures and Dilations
Lesson 6
The Shadowy Hand
31
Lesson 12
Exploring Angles in Similar Triangles
Lesson 13
Similar Triangles
Topic D
Applications of Similar Figures
Lesson 14
Using Similar Figures to Find Unknown Side Lengths
Applications of Similar Figures
Lesson 16
Similar Right Triangles
Lesson 17
Lesson 7 87 Dilations on a Grid
Lesson 8 103 Dilations on the Coordinate Plane
Topic C
Similar Figures
Lesson 9
Describing Dilations
Lesson 10
Sequencing Transformations
Lesson 11
Similar Figures
Sprint: Apply Properties of Exponents for a Power Raised to a
Sprint: Compare Numbers and Square Roots
Sprint: One-Step Equations—Multiplication
Sprint:
TOPIC A Dilations
Student Edition: Grade 8, Module 3, Topic A
Alice in Wonderland Reads the Nutrition Label
In the classic novel Alice’s Adventures in Wonderland—written, it is worth noting, by a mathematician— the character of Alice finds herself changing in size.
A lot.
First, she shrinks. Then, she grows. Then, she shrinks again. Then, she grows again. And so it goes, each shrinking or growing caused by a different food or drink she has consumed. It all fits the spirit of the Alice books: zany, impossible, and illogical.
Or is shrinking and growing really that impossible?
Shrinking and growing aren’t such ridiculous processes. They can be described by using the simple and powerful mathematics of dilations. If Alice had just read the fine print a little more carefully, perhaps her strange adventures would not have seemed so strange!
Student Edition: Grade 8, Module 3, Topic A, Lesson 1
Name Date
LESSON
Exploring Dilations
Dilation—A Transformation
Exploring Dilations
Comparing Dilations and Scale Drawings
Student Edition: Grade 8, Module 3, Topic A, Lesson 1
For problems 1 and 2, determine whether the transformation is a rigid motion or is not a rigid motion. Explain how you know.
Exploring Dilations
In this lesson, we
• classified a dilation as a transformation that is not a rigid motion.
• described the effects of changing the center and scale factor of a dilation.
Examples
If the distance between any two points changes, then the transformation is not a rigid motion. Name Date
Terminology
A transformation is a rule that maps each point of the plane to a unique point in the plane.
For problems 1–4, name the transformation. Then state whether the transformation is a rigid motion or is not a rigid motion.
Translation
The transformation is a rigid motion.
Reflection
The transformation is a rigid motion.
If the distance between any two points stays the same, then the transformation is a rigid motion.
Dilation
The transformation is not a rigid motion.
Rotation
The transformation is a rigid motion.
5. Each diagram shows a dilation with center O and scale factor 1 3 , 1, or 2. Write the scale factor by the corresponding diagram.
If the image is larger than the figure, then the scale factor is greater than 1
If the image is the same size as the figure, then the scale factor is equal to 1
If the image is smaller than the figure, then the scale factor is less than 1
Student Edition: Grade 8, Module 3, Topic A, Lesson 1
Name Date
1. Is a dilation a rigid motion? Explain.
2. Classify the following transformations by writing them in the correct location on the diagram.
• Reflections
• Dilations
• Rotations
• Translations
Rigid Motions
3. Circle the transformations that are also rigid motions.
4. Name each transformation shown. Then circle the transformations that are also rigid motions. Transformations
For problems 5–8, name the transformation shown in the diagram.
9. Four images of △T are shown. State which triangle does not represent the image of △T under a dilation.
Remember
For problems 10–13, evaluate the expression for the given value.
10. 4x + 5 when x = 3
11. 8x − 1 when x = 5
12. 9x + 6 when x = −2
13. 5x − 8 when x = −4
14. Consider the diagram.
What is the value of x ?
15. Is figure ABCD congruent to figure EFGH ? If so, describe a sequence of rigid motions that maps figure ABCD onto figure EFGH. If not, explain how you know.
Student Edition: Grade 8, Module 3, Topic A, Lesson 2
Name Date
Enlargements
1. The diagram shows figures A, B, and C and point O.
LESSON
Figure B is the image of figure A under a dilation with center O and scale factor 2.
Figure C is the image of figure A under a dilation with center O and scale factor 4.
Sketch the image of figure A under a dilation with center O and scale factor 3. Label this figure D.
Enlarge
2. Draw and label the image of point P under a dilation with center O and scale factor 4.
3. Draw and label the image of point Q under a dilation with center O and scale factor 2.
4. Draw and label the image of point P under a dilation with center O and scale factor 3.
5. Describe the dilation shown in the diagram that maps point R to R′ .
6. Describe the dilation shown in the diagram that maps point Q to Q′ .
Distance Relationships Under Dilations
7. Write an equation that represents the dilation shown with center O and scale factor r that maps point P to P′ .
8. A dilation with center O and scale factor 6 maps point R to point R′. What is the distance between O and R′?
9. Point P′ is the image of point P under a dilation with center O. What is the scale factor of the dilation?
Features of Dilations
10. Yu Yan draws S′H′ . She claims it is the image of SH under a dilation with center O.
Do you agree with Yu Yan? Explain.
11. Sara draws △B′I′T′. She claims it is the image of △BIT under a dilation with center O.
Do you agree with Sara? Explain.
Dilations
A dilation with center and scale factormaps a figure to its image. center name value
Example: A dilation with center and scale factor maps P to P′
Student Edition: Grade 8, Module 3, Topic A, Lesson 2
Name
Points O and P are shown.
a. Draw the image of point P under a dilation with center O and scale factor 3. Label the image P′ .
b. If the distance between O and P is 5 ft, what is the distance between O and P′?
Student Edition: Grade 8, Module 3, Topic A, Lesson 2
Name Date
Enlargements
In this lesson, we
• used a transparency to apply a dilation with a whole-number scale factor greater than 1.
• described the effects of a dilation with a whole-number scale factor greater than 1.
Examples
1. A dilation with center O and scale factor 4 maps point K to point K′ .
0.8 ft 0.8 ft 0.8 ft 0.8 ft K ʹ × ×
K
First, draw ⟶ OK which starts at center O and extends beyond K
a. Draw and label K′ .
b. What is the distance between O and K′?
Terminology
A dilation is a transformation with a center, called the center of dilation, and a scale factor greater than 0 that maps a figure to its image. A dilation with center O and scale factor r, with r > 0, maps any point P that is not O to a point P′ with the following features:
• P′ is on ⟶ OP
• OP′ = r OP
• The center of dilation O and its image, O′, are the same point.
Then, use a transparency to mark the distance between O and K. Mark this distance 3 more times on ⟶ OK to locate K′
OK′ = r · OK
OK′ = 4 · 0.8
OK′ = 3.2
The distance between O and K′ is 3.2 ft.
The distance between O and K′ is 4 times the distance between O and K
2. A dilation with center O maps point Y to point Y′. What is the scale factor of the dilation?
The distance between O and Y′ is 3 times the distance between O and Y.
The scale factor of the dilation is 3.
Student Edition: Grade 8, Module 3, Topic A, Lesson 2
1. Circle an answer choice from the list to make a true statement.
A dilation centered at (A) with scale factor (B) maps point I to point E
2. Sara provides the following description of the dilation shown.
A dilation with center S and scale factor 2 maps point U to point U′. I know this because the distance between U and U′ is two times the distance between U and S.
Do you agree with Sara? Explain.
For problems 3–5, draw and label the image of point K under a dilation with center O and the given scale factor.
3. Scale factor 2
4. Scale factor 4
5. Scale factor 7
6. A dilation with center O and scale factor 5 maps point G to point G′ . G
a. What is the distance from point O to point G′?
b. What is the distance from point G to point G′?
7. A dilation with center O maps point B to point B′. What is the scale factor of the dilation? Explain.
8. A dilation with center O maps point H to point H′. The distance between O and H′ is 24 cm. The distance between O and H is 3 cm. What is the scale factor of the dilation?
Remember
For problems 9–12, evaluate the expression for the given value.
9. 3x + 5 when x = 1 3
11. 6x + 2 when x = − 1 3
10. 18x − 2 when x = 1 2
12. 15x − 4 when x = − 1 5
13. Describe a sequence of rigid motions that shows △ ABC ≅ △JKL
Student Edition: Grade 8, Module 3, Topic A, Lesson 3
Reductions and More Enlargements
1. Sketch the image of figure A under a dilation with center O and scale factor 2 3 .
2. Draw and label the image of point P under a dilation with center O and scale factor 2 3 .
3. Draw and label the image of point P under a dilation with center O and scale factor 1 2 .
4. Draw and label the image of point R under a dilation with center O and scale factor 3 4
5. In the diagram, Eve identified the scale factor as −2 for the dilation centered at point O. Jonas identified the scale factor as 2 for the dilation. Do you agree with Eve or Jonas? Why?
Reduce or Enlarge?
6. A dilation with center O and scale factor 2 3 maps point R to point R′. What is the distance between O and R′? Write and solve an equation to support your answer.
7. A dilation with center O maps point P to point P′. What is the scale factor of the dilation? Write and solve an equation to support your answer.
8. Draw and label the image of point Q under a dilation with center O and scale factor 2.5.
Scale Factor Match
Diagram Card Letter
Scale Factor Card Number
Student Edition: Grade 8, Module 3, Topic A, Lesson 3
Name Date
Points O and P are shown.
a. Draw the image of point P under a dilation with center O and scale factor 1 2 . Label the image P′ .
b. If the distance between O and P is 9 ft, what is the distance between O and P′ ? Write and solve an equation to support your answer.
Student Edition: Grade 8, Module 3, Topic A, Lesson 3
Name Date
Reductions and More Enlargements
In this lesson, we
• used a ruler to apply a dilation with a scale factor greater than 0.
• described the effects of a dilation with any scale factor greater than 0.
Examples
1. Draw and label the image of point R under a dilation with center O and scale factor 1 4 .
First, use a ruler to draw ⟶ OR and measure the distance from O to R, which is 6 cm
OR
Then use the equation to find the distance between O and R′
To locate R′, use a ruler to measure 1.5 cm from O on ⟶ OR and draw R′
2. A dilation with center O and scale factor 2 3 maps point S to point S′. What is the distance between O and S′ ? Write and solve an equation to support your answer.
A scale factor less than 1 results in an image closer to the center of dilation.
The distance between O and S′ is 1 _ 2 yd.
3. A dilation with center O maps point T to point T′. What is the scale factor of the dilation? Write and solve an equation to support your answer.
The scale factor of the dilation is 3.2.
The scale factor should be greater than 1 because T′ is farther from center O than T is from center O
Student Edition: Grade 8, Module 3, Topic A, Lesson 3
Name Date
PRACTICE
1. Each diagram in the table shows a dilation with center O. Indicate whether the scale factor is greater than 1, between 0 and 1, or equal to 1.
Diagram
1
1
2. Draw and label the image of point P under a dilation with center O and scale factor 1 3 .
3. Draw and label the image of point Q under a dilation with center O and scale factor 1 _ 5 .
4. Draw and label the image of point R under a dilation with center O and scale factor 3 4 .
For problems 5–7, use the equation OR′ = r ⋅ OR to calculate the answer.
5. A dilation with center O and scale factor 1 3 maps point R to point R′. What is the distance between O and R′ ?
6. A dilation with center O and scale factor 2 5 maps point R to point R′. What is the distance between O and R?
5 yards
7. A dilation with center O maps point R to point R′. What is the scale factor of the dilation?
ʹ 18 in 24 in
Remember
For problems 8–11, evaluate the expression for the given value. 8. 5x + 2 when x = 0.3
4x − 5 when x = 0.7 10. 9x + 1 when
12. Find the length of AB
13. The coordinate plane shows the locations of Nora’s and Vic’s houses. Nora travels the path shown to get to Vic’s house.
House Locations
a. Write the locations of Nora’s and Vic’s houses as ordered pairs.
b. How many kilometers is the path that Nora takes to Vic’s house?
TOPIC B Properties of Dilations
Student Edition: Grade 8, Module 3, Topic B
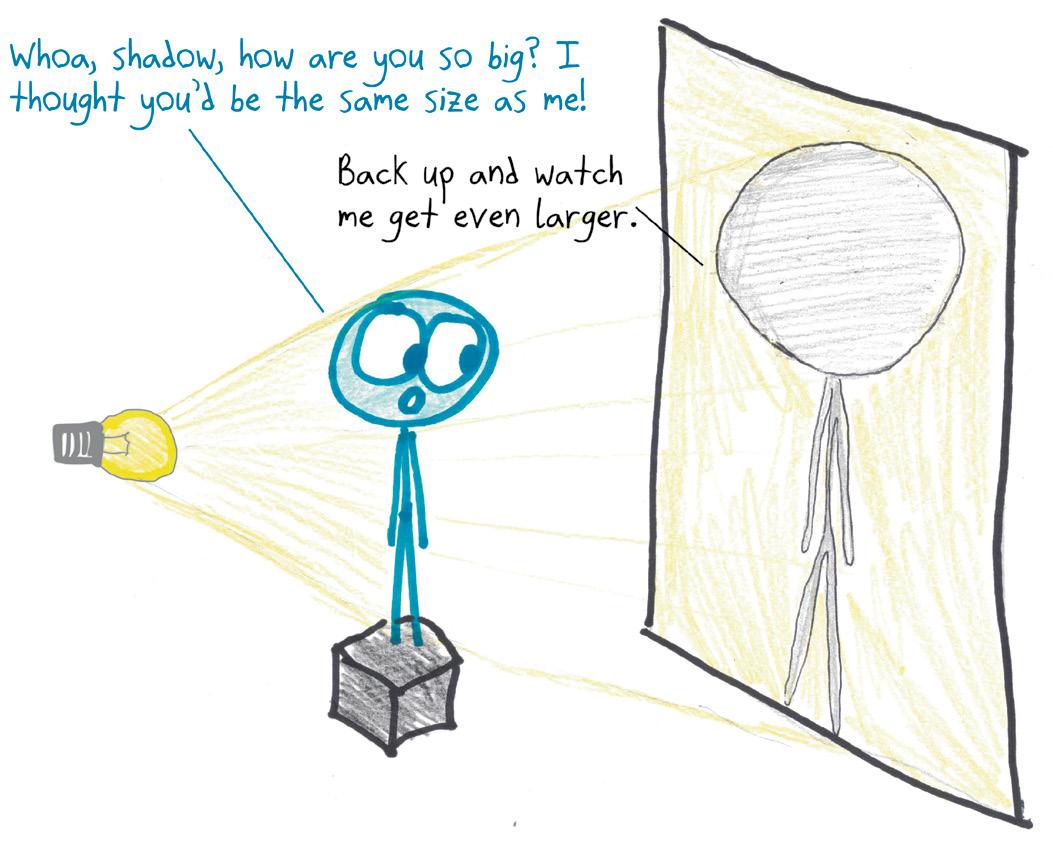
Shadow Play
If you’ve ever made shadow puppets on a distant wall, you know that your shadow can be much bigger than you are. When lit from behind with a flashlight, an ordinary hand that is 6 inches long can look like a 3-foot-long hand of a giant.
Why?
The size of a shadow has to do with geometry. Where is the light source? How far is it from the person casting the shadow to the surface on which the shadow is cast? Understanding the mathematical process of dilation is crucial to figuring out the size of a shadow. And the upcoming topic will—if you can forgive the pun—shed some light on this process.
1. A dilation is drawn on lined paper. The dilation has center O and maps point R to point R
What is the scale factor of the dilation?
2. Several dilations are drawn on lined paper. Each dilation has center O and maps point L to point Lʹ. Find each scale factor and write it by the corresponding diagram. Choose from the following scale factors: 3 8 , 5 8 , 8 5 , and 8 3 .
3. Several dilations are drawn on lined paper. Each dilation has center O and maps point R to point Rʹ. Find each scale factor and write it by the corresponding diagram. Choose from the following scale factors: 1 9 , 8 9 , 9 8 , and 9.
4. Points A, B, and E are drawn on lined paper as shown.
a. Draw and label the images of B and E under a dilation with center A and scale factor 2 9 .
b. Draw a line segment that connects B to E and a line segment that connects Bʹ to Eʹ .
c. Are BE and BʹEʹ parallel? Explain.
d. Is the value of BʹEʹ BE greater than 1, or is the value between 0 and 1? How do you know?
e. Write an equation that represents the relationship between the length of BE and the length of BʹEʹ .
5. A dilation is drawn on lined paper. The dilation has center T and maps RS onto RʹSʹ .
a. Is the value of RʹSʹ RS greater than 1, or is the value between 0 and 1? Explain.
b. Write an equation that represents the relationship between the length of RS and the length of RʹSʹ .
6. A dilation is drawn on lined paper. The dilation has center O and maps PQ onto PʹQʹ .
a. What is the scale factor of the dilation?
b. Sara measures the length of PQ as 6.25 cm and the length of PʹQʹ as 8.25 cm. Is 8.25 6.25 equivalent to the scale factor you found in part (a)? If not, why do you think they are different?
7. A dilation is drawn on lined paper. The dilation has center C and maps PT onto PʹTʹ .
a. Are PT and PʹTʹ parallel? How do you know?
b. Write an equation that represents the relationship between the length of PT and the length of PʹTʹ .
c. The measure of ∠TPC is 27°. What is the measure of ∠TʹPʹC ? Explain.
d. Nora explains that ∠CTʹPʹ is not congruent to ∠CTP because there is no rigid motion that maps ∠CTʹPʹ onto ∠CTP. Do you agree with Nora? Why?
8. The diagram shows a dilation with center O and scale factor 3 2 .
a. If the length of OS is 9 cm, what is the length of OSʹ ?
b. If the length of ORʹ is 1.5 cm, what is the length of OR ?
c. Write an equation that represents the relationship between the length of RS and the length of RʹSʹ .
9. The diagram shows a dilation with center O and scale factor 1.8.
a. Draw and label the image of point I under the same dilation.
b. If the length of FI is 18 mm, what is the length of FʹIʹ ?
c. If the length of IʹXʹ is 9 mm, what is the length of IX ?
10. The diagram shows a dilation with center O and scale factor 3 4 .
a. Draw and label the image of point T under the same dilation.
b. If the length of BT is 3 4 inches, what is the length of BʹTʹ ?
c. If the length of PʹTʹ is 3 4 inches, what is the length of PT ?
d. What is the value of BʹPʹ BP ? How do you know?
Remember
For problems 11–14, evaluate the expression for the given value.
11. 8x + 3 4 when x = 4 12. 5x − 1 2 when x = 7
13. 6x + 1 4 when x = −3 14. 2x − 5 6 when x = −2
15. Is the transformation shown in the diagram a rigid motion? Explain.
16. A segment has endpoints (−2, 4) and (4, 4).
a. Plot the points and create the segment in the coordinate plane.
1. Draw and label the image of △ULB under a dilation with center O and scale factor 2.
Polygon Enlargements and Reductions
2. Draw and label the image of figure JEANS under a dilation with center O and scale factor 3.
3. Consider the figure VEST.
a. Draw and label the image of figure VEST under a dilation with center V and scale factor 1 4 .
b. Measure and record the segment lengths in the table.
c. Select measurements and show the calculation that demonstrates you have applied the scale factor of the dilation correctly.
Figure VEST Figure
The Business of Dilations
4. In the diagram, a dilation with center O and scale factor 2 maps figure RS onto figure RʹSʹ .
Draw and label the image of figure RS under a dilation with center O and scale factor 3. Use the first diagram as a model to help you.
The Business of Dilations Activity
An ice cream store owner wants to create a reduction of the store’s logo to make business cards and an enlargement of the logo to make flyers.
• Determine which partner will create the flyer image and which partner will create the business card image.
• Choose tools for your dilation.
For the business card, get the Logo Business Card page and any tools you need to create the image. Your image must be able to fit inside the business card shown on the page.
For the flyer, get a sheet of construction paper, the Logo Flyer quarter-page, tape, and any tools you need to create the image. Tape the quarter-page to the top edge of the construction paper. Your image must fit on the construction paper.
• With your partner, determine the scale factor to use for the reduction from center O and the scale factor to use for the enlargement from center O.
a. For each side in △ XYZ, find the value of the ratio of the length of the side’s image to the length of the side.
b. What is the scale factor of the dilation? Explain.
2. Draw and label the image of figure LMNO under a dilation with center P and scale factor 2.
3. Draw and label the image of figure HEARTS under a dilation with center H and scale factor 2
4. Ava is creating business cards with a T-shirt logo. She applies a dilation with center A to reduce the size of the logo. What is the scale factor of the dilation?
5. Kabir’s Cookie Shop is creating flyers with a cookie-shaped logo. Kabir applies a dilation with center C and scale factor 3 to enlarge the size of the logo. He finds the image of five points. What is a problem Kabir could have with this dilation?
Remember
For problems 6–9, evaluate the expression for the given value.
10. Draw and label the image of point P under a dilation with center O and scale factor 2.
11. A segment has endpoints (2, 0) and (2, 6).
a. Plot the points and create the segment in the coordinate plane.
b. What is the length of the segment?
Name Date Student Edition: Grade 8, Module 3, Topic B, Lesson 6
The Shadowy Hand
1. Focus Question: Describe the outcome you are trying to achieve. Include a sketch.
Where to Stand
2. Predict how far your hand should be from the light source.
3. Record any measurements your group makes.
4. Calculate how far your group member’s hand should be from the light source.
5. Test your predicted and calculated distances by standing in these locations and recording the results. Include a sketch of your results for your predicted and calculated distances.
6. Measure and record the actual distance your group member’s hand should be from the light source.
7. Describe your results. Compare your results from the predicted, calculated, and actual distances.
In a Different Light (Optional)
8. Predict how far your group member’s hand should be from the light source.
9. Record any new measurements your group has made.
10. Calculate how far your group member’s hand should be from the light source.
11. Test your predicted and calculated distances by standing in these locations and recording the results. Include a sketch of your results for your predicted and calculated distances.
12. Measure and record the actual distance your group member’s hand should be from the light source.
13. Compare your results from the predicted, calculated, and actual distances. Was your predicted distance closer to the actual distance this time?
1. An activity is set up as shown in the diagram. The figure is not drawn to scale.
• A light source is placed 30 feet from a wall and turned on.
• On the wall is an outline of a hand. The height of the hand from the wrist to the tip of the longest finger is 15 inches.
• When your classmate’s hand is held parallel to the wall, the height of their hand from the wrist to the tip of their longest finger is 6 inches.
a. Label the diagram with the given measurements.
b. How far should your classmate’s hand be from the light source so their hand’s shadow matches the hand outline on the wall?
c. Explain your answer by using dilations.
Remember
For problems 2–5, evaluate the expression for the given value.
2. 0.4x + 5 when x = 8 3. 1.2x − 4 when x = 4
4. 0.6x + 4 when x = −6 5. 9.2x − 3 when x = −1
6. Points O and P are shown.
a. Draw and label the image of point P under a dilation with center O and scale factor 1 _ 2 .
b. The distance between O and P is 6 cm. What is the distance between O and Pʹ ?
7. A sequence of transformations maps a figure onto its image. Which transformations could be part of a sequence that would always result in a figure that is congruent to its image? Choose all that apply.
1. A dilation with center O is shown. What is the scale factor of the dilation?
2. Plot and label the image of point C under a dilation with center O and scale factor 5 4 .
3. Each diagram shows a dilation with center O. Find each scale factor and write it by the corresponding diagram. Choose from the following scale factors: 1 2 , 3 4 , 2, and 5 2 .
For problems 4–7, plot and label the image of point S under a dilation with center O and the given scale factor.
8. Draw and label the image of △PQR under a dilation with center O and scale factor 2 3 .
9. Draw and label the image of figure STUV under a dilation with center O and scale factor 8 3 .
10. Shawn plots the image of point M under a dilation with center O and scale factor 0.6 as shown in the diagram.
Use the properties of dilations to explain how Shawn determines the location of point Mʹ .
Remember
For problems 11–14, evaluate the expression for the given value.
11. 0.4x + 5 when x = 0.8
13. 0.6x + 4 when x = −1.4
1.2x − 5 when x = 0.3
6.2x − 9 when x = −0.8
15. The diagram shows a dilation with center O and scale factor 7 3 .
a. Place a point R on PQ . Draw and label the image of point R under a dilation with center O and scale factor 7 _ 3 .
b. How do you know the image of point R is in the correct location?
16. In the given diagram, two lines meet at a point that is also the endpoint of a ray.
(5x – 2)° (3x + 4)°
a. In a complete sentence, describe an angle relationship that would help you solve for x.
1. Draw and label the image of JK under a dilation with center O and scale factor 2.
Finding a Pattern
2. Consider points O and B in the coordinate plane.
a. Choose a Scale Factor card. Then plot and label the image of point B under a dilation with center O and scale factor r from the card.
b. Check one another’s images. Then complete the table for the group’s four images.
Point B Coordinates
Scale Factor
Point B′ Coordinates
c. Look for a pattern within each row of the table. What do you notice about the relationship between the scale factor and the coordinates of points B and B′?
Formalizing a Pattern
3. Use the pattern you found in problem 2 to complete the table for dilations centered at the origin. The first row is completed for you.
4. What are the coordinates of the image of a point (x, y) under a dilation centered at the origin with scale factor r?
For problems 5 and 6, plot the image of point K under a dilation centered at the origin with scale factor 2
• Use the grid strategy from lesson 7 to plot and label the actual location of point K′
• Use the rule to calculate the coordinates of point K′ .
• Compare the actual location to the calculated location of point K′. Does the rule work?
Applying a Pattern
For problems 7 and 8, find the coordinates of the image of each vertex under a dilation centered at the origin with the given scale factor r. Then graph and label the image of the figure.
7. r = 2.5
For problems 9 and 10, find the scale factor of the dilation centered at the origin.
a. Find the coordinates of the images of vertices B, C, and D under a dilation centered at the origin with scale factor 3. Explain how you found your answer.
b. Graph and label the image of △BCD under the same dilation.
1. Each point A is mapped to point A′ by a dilation centered at the origin with the given scale factor. Complete the table.
2. Plot the image of point A under a dilation centered at the origin with scale factor 3. Write the coordinates of the image.
3. Plot the image of point Z under a dilation centered at the origin with scale factor 3 4 . Write the coordinates of the image.
4. Point A lies on the x-axis. A dilation centered at the origin maps point A to point A′. Which statements are true? Choose all that apply.
A. Point A′ lies on the x-axis.
B. Point A′ lies on the y-axis.
C. Point A′ lies in Quadrant I.
D. Point A′ has an x-coordinate of 0.
E. Point A′ has a y-coordinate of 0
5. What are the coordinates of a point that maps back to itself under a dilation centered at the origin? Explain.
6. Consider △PQR in the coordinate plane.
a. What are the coordinates of the images of vertices P, Q, and R under a dilation centered at the origin with scale factor 1.5?
b. Graph and label the image of △PQR under the same dilation.
7. Graph and label the image of figure UVWZ under a dilation centered at the origin with scale factor 1 2
8. Graph and label the image of △RST under a dilation centered at the origin with scale factor 3.
For problems 9 and 10, find the scale factor of the dilation centered at the origin.
Remember
For problems 11–14, evaluate the expression for the given value.
15. Draw the image of figure AB under a dilation with center O and scale factor 2.
16. A small bottle of soap costs $8.00 for 40 fluid ounces. A large bottle of soap costs $19.20 for 120 fluid ounces. What is the unit cost for each bottle size?
11. 2(x + 4) when x = 6
12. 5(x + 9) when x = 3
13. −4(x + 8) when x = −8 14. −7(x − 3) when x = −5
Similar Figures TOPIC
Student Edition: Grade 8, Module 3, Topic C
Similar Viewing Experiences
Ugh. How can you watch a movie
... in what way?
It’s
not so bad. In fact, this
When you want to watch a video, you have a dizzying number of choices—not just of what video to watch, but also at what size to watch it. Do you want a phone screen, which is roughly 5 inches along the diagonal?
Or a tablet, which is roughly 9 inches?
Or perhaps a laptop, which is roughly 14 inches?
Or a TV, which may be as large as 4 feet?
Or even a huge movie theater screen, which is 90 feet or more?
This raises another question. What allows us to view the same content on screens of such radically different sizes? It’s possible only because of a mathematical agreement we’ve all reached: We will build most of our screens and film many of our TV shows and movies with the same aspect ratio.
That ratio happens to be 16 : 9. In other words, the video should be 16 units wide, and 9 units high, no matter how large or small those units are. That’s why movies on a phone screen don’t look smooshed but just look smaller.
• located the center of a dilation given a figure and its image under the dilation.
• precisely described a dilation given a figure and its image by using the center and scale factor of the dilation.
• identified that the scale factor of a dilation that maps a figure onto its image is the reciprocal of the scale factor of the dilation that maps the image back onto the figure.
Example
Figure S′T′U′V′ is the image of figure STUV under a dilation.
Use lines to connect corresponding points on the figure and its image.
The center of dilation is the point where all the lines intersect.
a. Locate the center of dilation. Label it O.
b. Describe the dilation that maps figure STUV onto figure S′T′U′V′ .
A dilation with center O and scale factor 1 4 maps figure STUV onto figure S′T′U′V′ .
c. Describe the dilation that maps figure S′T′U′V′ back onto figure STUV.
A dilation with center O and scale factor 4 maps figure S′T′U′V′ back onto figure STUV.
The scale factor of the dilation that maps figure STUV onto figure S′T′U′V′ is the reciprocal of the scale factor of the dilation that maps figure S′T′U′V′ onto figure STUV
1. A dilation maps △EFG onto △E′F′G′. Locate the center of dilation. Label it O
2. A dilation maps figure JKLMN onto figure
3. A dilation maps PQ onto P′Q′ .
a. Locate the center of dilation. Label it O
b. Describe the dilation that maps PQ onto P′Q′ .
4. Consider the diagram.
a. Describe the dilation that maps figure ABCD onto figure A′B′C′D′ .
b. Describe the dilation that maps figure A′B′C′D′ back onto figure ABCD.
5. Point P′ is the image of point P under a dilation. Complete the table by writing the scale factor needed to apply each dilation.
Scale Factor of the Dilation
Maps P to P′
Maps P′ to P
6. A dilation with scale factor r maps JK onto J′K′ . What is the scale factor of the dilation that maps J′K′ back onto JK ? Explain.
7. A dilation with scale factor a b maps figure RSTU onto figure R′S′T′U′. What is the scale factor of the dilation that maps figure R′S′T′U′ back onto figure RSTU ? Explain.
8. A dilation with center O maps point N to point N′. What is the scale factor of the dilation that maps N′ back to N?
9. A dilation maps △STU onto △
a. Locate the center of dilation. Label it O.
b. Describe the dilation that maps △STU onto △S′T′U′
10. A dilation maps figure STUV onto figure S′T′U′V′ .
a. What is the center of dilation?
b. Describe the dilation that maps figure STUV onto figure S′T′U′V′
11. A dilation maps figure LMNPQR onto figure L
a. Locate the center of dilation. Label it O.
b. Describe the dilation that maps figure LMNPQR onto figure L
c. Describe the dilation that maps figure L′M′N′P′Q′R′ back onto figure LMNPQR
12. A dilation maps figure EFGH onto figure E′F′G′H′ .
a. Locate the center of dilation. Label it O
b. What is the scale factor of this dilation? Explain how you know.
Remember
For problems 13–16, evaluate the expression for the given value.
13. 5(x + 3 4 ) when x = 1 4
14. 7(x + 0.2) when x = 0.5
15. −2(x 3 5 ) when x = − 1 5
16. −3(x − 1.3) when x = −0.2
17. Consider the diagram.
a. Draw and label the image of △ABC under a dilation with center O and scale factor 4.
b. Compare the distance between O and A to the distance between O and A′
c. Is AB parallel to A′B′ ? Explain.
18. A 10-foot ladder leans against a wall. The bottom of the ladder is 40 inches from the wall. What height does the top of the ladder reach on the wall? Round your answer to the nearest tenth of an inch.
• recognized a sequence that involves a dilation and a translation as a single dilation.
Examples
1. Draw and label the image of △EFG under the following sequence of transformations.
• 180° rotation around the origin
• Dilation centered at the origin with scale factor 2
F′(−3, 1) maps to F″(−6, 2) because 2(− 3) = − 6 and 2(1) = 2.
2. Consider figure HIJK and ⟶ LM .
Draw lines to connect the corresponding vertices of figure HIJK and figure H″I″J″K″ .
The center of dilation is at the intersection point of all the lines.
a. Draw and label the image of figure HIJK under the following sequence of transformations.
• Dilation with center K and scale factor 1 _ 3
• Translation along ⟶ LM
b. Locate the center of dilation for the single dilation that maps figure HIJK onto figure H″I″J″K″. Label the point O
c. What is the scale factor of the dilation with center O that maps figure HIJK onto figure H″I″J″K″?
1 3
The dilation in the sequence that maps HIJK to H′I′J′K′ and the dilation that maps HIJK to H″I″J″K″ share the same scale factor but have different centers.
• described a sequence of rigid motions or dilations, or both, to show that two figures are similar.
• identified that in similar figures
▸ corresponding side lengths are proportional, and
▸ corresponding angles are congruent.
Examples
Terminology
One figure is similar to another if there is a sequence of rigid motions or dilations, or both, that maps one figure onto the other.
1. Describe a sequence of rigid motions or dilations, or both, that shows figure PQRS ∼ figure VUTS
Draw and label any necessary vectors, lines, or points.
To show that the figures are similar, find a sequence that maps figure PQRS onto figure VUTS or find a sequence that maps figure VUTS onto figure PQRS.
For a sequence that maps figure PQRS onto figure VUTS, the scale factor of the dilation is VS PS . VS PS = 10 5 = 2
A reflection across line ℓ followed by a dilation with center S and scale factor 2 maps figure PQRS onto figure VUTS.
2. Describe a sequence of rigid motions or dilations, or both, that shows △ ABC ∼ △LMN.
Use units or grid lines to determine the scale factor of the dilation.
MN BC = 1 5
A dilation centered at the origin with scale factor 1 5 followed by a translation 4 units right and 1 unit down maps △ ABC onto △LMN
1. A sequence of rigid motions or dilations, or both, maps △CAT onto △DOG
a. What is the relationship between △CAT and △DOG?
b. What is true about the corresponding angles and corresponding side lengths of △CAT and △DOG?
2. Which sequence shows △RST ∼ △UVW ?
A. A translation along ⟶ OP followed by a dilation with center O and scale factor 4 maps △RST onto △UVW.
B. A translation along ⟶ OP followed by a dilation with center P and scale factor 4 maps △RST onto △UVW.
C. A dilation with center O and scale factor 4 followed by a reflection across ⟷ OP maps △RST onto △UVW.
D. A dilation with center P and scale factor 4 followed by a reflection across ⟷ OP maps △RST onto △UVW.
3. Which sequence shows △MNO ∼ △STU?
A. A dilation with center P and scale factor 1 2 followed by a reflection across line ℓ maps
△MNO onto △STU.
B. A dilation with center P and scale factor 2 followed by a reflection across line ℓ maps △MNO onto △STU.
C. A reflection across line ℓ followed by a dilation with center P and scale factor 1 2 maps
△MNO onto △STU.
D. A reflection across line ℓ followed by a dilation with center P and scale factor 2 maps △MNO onto △STU.
For problems 4–10, describe a sequence of rigid motions or dilations, or both, that shows one figure is similar to the other. Draw and label any necessary vectors, lines of reflection, centers of rotation, or centers of dilation.
4. △FGH ∼ △EGI
5. △DBE ∼ △ ABC
7. △RST ∼ △MNO
8. Figure ABCDEFG ∼ figure HIJKLMN
9. Figure C ∼ figure D
10. Figure ABCDE ∼ figure PQRST
11. The sequence of transformations that maps one triangle onto a similar triangle includes a dilation with scale factor 2.
• Logan states that the side lengths of the larger triangle are twice as long as the side lengths of the smaller triangle.
• Shawn states that the angle measures of the larger triangle are twice as large as the angle measures of the smaller triangle.
Do you agree with Logan? Do you agree with Shawn? Explain.
Remember
For problems 12–15, solve for x.
12. 1 3 x + 6 = 4
14. 1 3 x + 7 = −7
13. 1 5 x − 4 = 10
15. 1 10 x − 11 = −2
16. Plot and label the image of point A under a dilation with center O and scale factor 1 4 .
1. Circle the transformations you would use in a sequence to show that △DEF ∼ △ ABC. rotation reflection translation dilation
Triangle Angles
2. Follow the directions to draw two triangles, △ ABC and △DEF. Then decide whether they are similar. Complete part (a) with a partner. Then complete parts (b)–(f) independently.
a. Choose two angle measures that will be in both triangles.
Measure of angle 1:
Measure of angle 2:
b. Use a protractor to draw two distinct triangles with the angle measures from part (a) on the index card. Cut out the triangles.
c. Trace both triangles onto the space provided.
• Label one △ ABC and the other △DEF.
• Label the angles of each triangle with the measures you used from part (a).
• Measure the lengths of the sides and show that the lengths of the corresponding sides of the triangles are proportional.
d. Lay the triangle cutouts on top of the traced triangles in the book. Is there a sequence of rigid motions that maps one of the angles in △ ABC onto a congruent angle in △DEF? If so, describe the rigid motions used.
e. After applying a sequence of rigid motions, can a dilation that maps △ ABC onto △DEF be precisely described? If so, describe the dilation.
f. Is △ ABC similar to △DEF? Explain your reasoning.
Are They Similar?
3. Points A, K, and T are collinear, and points A, S, and C are collinear. Are △ ASK and △ ACT similar? Complete parts (a)–(d) to determine the answer.
a. What two pairs of angles are congruent according to the diagram? Write the statements of congruence.
b. Based on the information, what can we conclude about KS and TC ? Explain your conclusion.
c. Describe the sequence that maps △ ASK onto △ ACT.
d. What can you now conclude about △ ASK and △ ACT?
Angle–Angle Criterion
For problems 4–9, determine whether the triangles are similar by the angle–angle criterion. Explain your reasoning.
• state whether the two triangles are similar by the angle–angle criterion and explain your reasoning, and
• if there is not enough information to determine whether the triangles are similar by the angle–angle criterion, explain why not.
For problems 6–9, determine whether △ ABC is similar to △ XYZ by the angle–angle criterion. Explain how you know.
6. 7.
8.
10. Is △NOP similar to △LOM by the angle–angle criterion? Explain.
11. The diagram shows a dilation with center A and scale factor 1.5 that maps BC onto BʹCʹ .
Henry and Sara are asked to explain how they know that △ABC ∼ △ABʹCʹ
Henry’s Response
I know that △ ABC ∼ △ ABʹCʹ because a dilation is shown that maps BC onto BʹCʹ . That means the same dilation maps △ ABC onto △ ABʹCʹ, which means △ ABC ∼ △ ABʹCʹ .
Sara’s Response
I know that △ ABC ∼ △ ABʹCʹ because I can use parallel lines and corresponding angles to show that ∠ ABC ≅ ∠ ABʹCʹ and ∠ ACB ≅ ∠ ACʹBʹ. By the angle–angle criterion, △ ABC ∼ △ ABʹCʹ .
Is Henry’s response correct? Is Sara’s response correct? Explain.
Remember
For problems 12–15, solve for x
16. Plot and label the image of point A under a dilation with center O and scale factor 3.
17. The table shows the total cost in dollars to buy muffins. Write an equation to represent the relationship between the total cost t and the number of muffins m
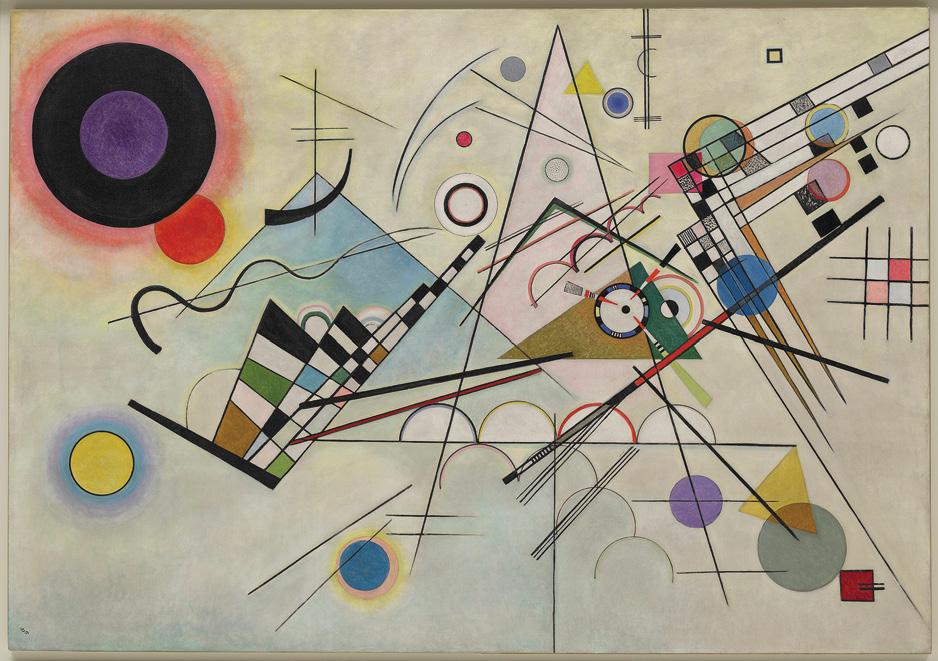
What kind of feeling do you think the artist was trying to convey through this piece? Why?
What do you notice about the shapes in the painting?
What do you wonder about the shapes in the painting?
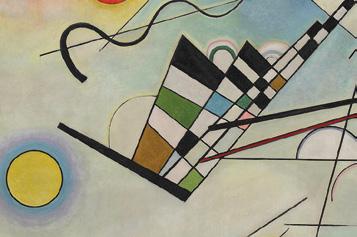
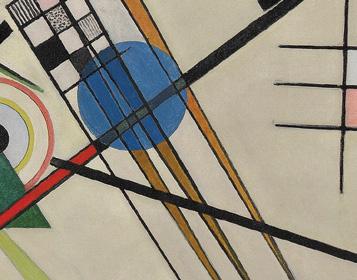
For problems 1 and 2, a diagram of figures has been recreated from an enlarged section of the painting. Determine whether the recreated figures are similar.
1. Is quadrilateral QUIZ similar to quadrilateral QUAD? Explain.
2. Is △MAT similar to △MUD? Explain.
Angle Relationships for Similarity
3. List as many angle relationships as possible.
Angle Relationships
4. Consider △KLM and △STU shown in the diagram.
a. Complete the table with the angle measures. Then identify the angle relationship that allowed you to find the measure. Angle in △ KLM Corresponding Angle
b. Is △KLM similar to △STU by the angle–angle criterion? Explain.
For problems 5–8, determine whether the given triangles are similar by the angle–angle criterion. Explain your reasoning. If there is not enough information to determine whether the triangles are similar by the angle–angle criterion, explain why not.
• used angle relationships to find unknown angle measures in diagrams.
• determined whether two triangles are similar by the angle–angle criterion.
Examples
1. Determine whether △LJK is similar to △LHG by the angle–angle criterion. Explain your reasoning.
The sum of the interior angle measures of a triangle is 180°.
and
△ LJK is not similar to △LHG. Because m∠LGH = 52° and m∠LJK = 81°, the two triangles have only one pair of congruent angles.
2. Determine whether △ JKL is similar to △NML. Explain your reasoning.
∠ JKL and ∠ NML are alternate interior angles.
∠ JLK and ∠ NLM are vertical angles.
△ JKL ∼ △ NML by the angle–angle criterion. ∠JLK ≅ ∠NLM because they are vertical angles. ∠JKL ≅ ∠ NML because they are alternate interior angles created by parallel lines cut by a transversal.
For problems 1–4, determine whether △WIT is similar to △PIC by the angle–angle criterion. Explain your reasoning.
5. Consider the diagram.
a. If the angle measures in △GHI and △ JKL can be found, list them in the table. Then identify the angle relationship that allowed you to find the measure.
Angle in △GHI
Corresponding Angle in △ JKL
b. Is △GHI similar to △JKL by the angle–angle criterion? Explain.
Angle Relationship
6. Is △ABC similar to △DEC by the angle–angle criterion? Explain.
For problems 7–9,
• state whether the two triangles are similar by the angle–angle criterion and explain your reasoning;
• if there is not enough information to determine whether the triangles are similar by the angle–angle criterion, explain why not; and
• use some or all of the following vocabulary terms in your explanations.
angle sum of a triangle vertical angles alternate interior angles right angle linear pair
△TOY and △CON
8. △WIZ and △TIX
a. △ NAH and △YAS
b. △NAS and △YAH
10. One of the properties of a trapezoid is that the diagonals of the trapezoid form a pair of similar triangles.
a. Select the pair of similar triangles.
A. △ KLX and △ XWK
B. △ JLX and △ JWK
C. △ JKL and △JXW
D. △ LXW and △ LWK
b. Explain why the triangles you selected are similar by the angle–angle criterion.
11. Ethan and Liam were given the following diagram and asked to explain why △NEW ∼ △GEO by the angle–angle criterion.
Ethan’s First Step
Used the angle sum of a triangle for △ NEW
Liam’s First Step
Used the angle sum of a triangle for △GEO
Choose Ethan’s or Liam’s first step and continue with their reasoning to show that △ NEW ∼ △GEO by the angle–angle criterion.
Remember
For problems 12–15, solve for x.
12. 5(x + 12) = 10
3)
is shown in the coordinate plane.
13. 4(x − 8) = 60
a. Graph the image of △ABC under a dilation centered at the origin with scale factor 2. Label the image △ AʹBʹCʹ .
b. What are the coordinates of the vertices of △ AʹBʹCʹ?
c. Describe how you located the coordinates of the vertices of △ A
14. 6(x +
= −30 15. 10(x − 4) = −100
16. △ ABC
17. The student council sells tickets to the school dance. The graph shows the amount of money the student council earns by selling tickets on four different days.
School Dance Ticket Sales
Number of Tickets Sold
a. What does the point (2, 5) represent?
b. What is the unit rate?
c. What point would you plot on the graph to indicate the unit rate?
d. What does the unit rate represent?
Applications of Similar Figures
Student Edition: Grade 8, Module 3, Topic D
We're So Similar!
You have a 30o So weird! Do you also have a 60o angle?
Wait... is your hypotenuse exactly twice as long as your shorter leg??
IT’S LIKE YOU READ MY MIND!
In mathematics, we use the word similar in a special and specific way.
It doesn’t mean “looking pretty much alike.”
It doesn’t mean “having a lot in common.”
It doesn’t mean “Yeah, I can see the resemblance.”
It means that the two figures match up under a sequence of rigid motions or dilations, or both. And that meaning has big consequences for what the two figures wind up looking like. You can expect not only the same angle measures, but side lengths with the same proportions, too—every part of one figure relates to every part of the other figure.
That’s why, across mathematics, when you want to know more about a figure, it helps to identify the figure’s similar partner. Study that figure’s partner, and you’ll learn loads about the original figure.
Using Similar Figures to Find Unknown Side Lengths
1. What strategies could you use to find the height of the rectangle?
PQ R S 15 20 25
Unknown Lengths in Similar Figures 2. △ ABC is similar to △ ADE
a. What is the length of EA ?
b. If the length of DE is 17.1 units, what is the length of BC ?
3. In the diagram, △ APE ∼ △ ANT. Find the lengths of AN and AE .
4. A user pinches the touch screen of a tablet computer to reduce the size of a full-screen picture. The diagram shows the full screen and the reduced picture, which are similar figures. Find the screen length of the tablet computer in inches.
5. In the diagram, △ELK ∼ △HUG and △HUG ∼ △WIN. Find all the unknown side lengths of the triangles.
Using Similar Figures to Find Unknown Side Lengths
In this lesson, we
• assessed whether two triangles are similar.
• used properties of similar figures to find unknown side lengths.
Examples
1. Find the length of MO .
First, determine whether △MNO is similar to △PQR.
△MNO ∼ △PQR by the angle–angle criterion. The sum of the interior measures of a triangle is 180°, which means m∠MNO = 37°. So ∠OMN ≅ ∠RPQ and ∠MNO ≅ ∠PQR.
MO PR = MN PQ
MO 4 = 5 6 4(MO 4 ) = 4(5 6 ) MO = 3.3
This type of equation is called a proportion. Because the triangles are similar, write a proportion to represent the relationship between the lengths of the corresponding sides.
The length of MO is 3.3 units.
2. Find the lengths of CD and CA .
The triangles share ∠BCD
BD and AE are parallel segments with transversal CA
△ ACE ∼ △BCD by the angle–angle criterion. The diagram shows that ∠ACE ≅ ∠BCD. I know ∠EAC ≅ ∠DBC because they are corresponding angles created by parallel segments cut by a transversal.
CD CE = BD AE
CD 11.6 = 7.2 14.4 11.6( CD 11.6 ) = 11.6( 7.2 14.4 )
1. △BRI is similar to △GHT. Find the length of GT .
2. △SMR is similar to △SAT. Find the length of ST
3. Each diagram shows similar triangles. Find the length of the segment and write it by the corresponding diagram. Choose from the following segment lengths: 4.8 units, 7.5 units, 30 units, and 42 units.
a. △ AYE is similar to △ ADR. What is the length of AY ?
b. △RAN is similar to △REL. What is the length of EL ?
4. Figure ZERO is similar to figure LIST.
a. Find the scale factor of the dilation that maps figure ZERO onto figure LIST.
b. Find the length of ZE .
c. Find the length of ST .
d. Find the length of TL .
5. Is △VET similar to △VOX by the angle–angle criterion? If so, find the length of TV . If not, explain how you know.
6. Find the lengths of ZA and AK .
7. Find the length of RC .
8. Find the length of SL .
9. Find the lengths of FI , IX , and IT .
Remember
For problems 10–13, solve for x. 10. 1 2 (x + 8) = 6
4 5 (x + 4) = 8
14. A dilation is shown in the diagram.
1 8 (x + 7) = 1
2 3 (x − 8) = −2
a. Find the center of dilation. Label it O
b. What is the scale factor of the dilation? Explain how you know.
c. Describe the dilation that maps figure AʹBʹCʹDʹ back onto figure ABCD.
15. Alex earns $114 for 8 hours of work. He earns the same amount of money for each hour he works. Write an equation that represents the relationship between Alex’s total earnings a and the total number of hours he works h.
Lily stands near a streetlamp. The light from the streetlamp causes her to cast a shadow. Lily is 5.5 feet tall. The shadow she casts is 3 feet long. Lily is 10 feet away from the streetlight.
What is the height of the streetlamp? Round your answer to the nearest tenth of a foot.
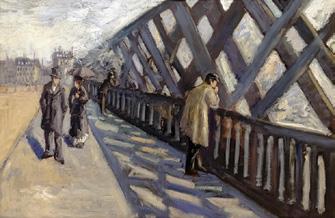
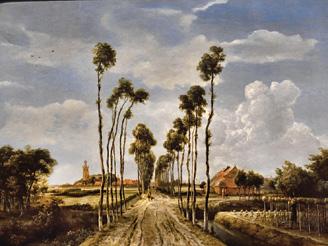
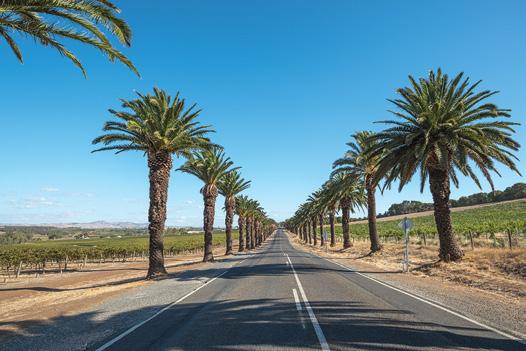
• examined examples of linear perspective in artwork and related it to dilations.
• used properties of similar figures to solve problems.
Example
When Nora stands 140 feet from the base of a tree, the tip of her shadow meets the tip of the tree’s shadow. Nora is 4.5 feet tall, and her shadow is 10 feet long.
How tall is the tree?
Draw and label a diagram that represents the situation.
Label the unknown length you need to find with a variable.
The two triangles share an angle, and both also have a right angle.
The distance from the base of the tree to the tip of Nora’s shadow is 150 ft.
The two triangles are similar by the angle–angle criterion because they share an angle and both triangles also have a right angle. x 4.5 = 150 10 4.5( x 4.5 ) = 4.5(150 10 ) x = 67.5
2. How is linear perspective related to dilations?
3. Shawn sits outside his building during lunch. He notices that his seated height is 3.5 feet, and he casts a shadow that is 1.4 feet long. The building casts a shadow that is 72.8 feet long. Diagram not drawn to scale.
a. How tall is Shawn’s office building?
b. The average ceiling height of each floor of the building is 14 feet. How many floors are in the building?
4. Jonas measures the height of his apartment’s balcony. He lays a mirror on the ground 11.8 horizontal feet from the edge of the balcony. Then he moves farther from his apartment so that he is 6 feet from the mirror. If he looks into the mirror, he can see the bottom edge of his balcony. Jonas’s eyes are 5.1 feet from the ground. Diagram not drawn to scale.
How high is the bottom edge of his balcony? Use similar triangles to show your work.
Jonas’s balcony
5. The Leaning Tower of Pisa is a bell tower in Italy that is famous because it tilts at an angle. Diagram not drawn to scale.
The top of the tower is approximately 183 feet from the ground. At a particular time of day, the tower casts a shadow of 12.8 feet. A flagpole was placed vertically on the tower, which added an additional 2.1 feet to the shadow.
To the nearest whole foot, how tall is the flagpole on top of the Leaning Tower of Pisa? Use similar triangles to show your work.
6. Create a context for the diagram. Provide a question based on the unknown length in the diagram, and then answer that question.
Remember
For problems 7–10, solve for x.
7. 0.5(x + 10) = 8.2
8. 0.3(x − 4) = 9.6
9. 1.2(x + 5) = −4.2 10. 6.4(x − 1) = −2.4
11. Graph and label the image of figure ABCD under the following sequence of transformations.
• Dilation centered at the origin with scale factor 1 4
• determined that right triangles with horizontal and vertical legs and with hypotenuses that lie on the same line are similar triangles.
Examples
For problems 1 and 2, the right triangles have horizontal and vertical legs, and the hypotenuses of the two triangles lie on the same line. Find the value of a b .
Because the triangles are similar, use within-triangle ratios to find the value of
Right triangles with a horizontal leg, a vertical leg, and hypotenuses that lie on the same line are similar triangles.
The values of the within-triangle ratios are equivalent.
For problems 1–6, the right triangles have horizontal and vertical legs, and the hypotenuses of the two triangles lie on the same line. Find the value of a b
7. In the diagram, EF and VW are vertical, and EF DE = 1 3 . What are possible values for the lengths of VW and UV ? Choose all that apply.
A. VW = 0.5, UV = 1.5
B. VW = 1 2 , UV = 1 6
C. VW = 6, UV = 2
D. VW = 1 3 , UV = 1
E. VW = 2.1, UV = 0.7
8. In the diagram, AB and XY are vertical, and AC and XZ lie on the same line. What are possible values for the lengths of XY and YZ ? Choose all that apply. The diagram is not drawn to scale.
A. XY = 15, YZ = 7.5
B. XY = 12.5, YZ = 25
C. XY = 18.4 , YZ = 9.2
D. XY = 14, YZ = 7
E. XY = 21.3, YZ = 42.6
9. Maya states that △RST ∼ △GHI because they are both right triangles that lie on the same line. Do you agree with Maya? Explain. T
10. In the diagram, the hypotenuse of △ ABC lies on the line, AB is horizontal, and BC is vertical. Draw and label a second right triangle △ AGH with the following conditions:
• Point G is halfway between points of A and B.
• GH forms a right angle with AB .
• Point H is on AC .
• Include side lengths AG and HG .
11. In the diagram, △ ABC has a vertical leg, AB , a horizontal leg, BC , and the hypotenuse lies on ⟷ AC . Draw and label a second right triangle with the following conditions:
• The triangle shares either ∠ A or ∠C
• The triangle has a hypotenuse on AC .
• The drawing of the triangle includes all three side lengths rounded to the tenths place.
Remember
For problems 12 and 13, solve for x. 12. 1 2 x + 6 − x = − 5
1 4 x − 1 + 1 2 x = 9
14. Is △ ABE similar to △CDE ? Explain.
15. Identify the relationship as either proportional or not proportional. Explain.
Mixed Practice 1
1. Nora makes muffins for the school bake sale. The equation m = 12t represents the total number of muffins m Nora makes with t muffin trays. What is the constant of proportionality?
2. Henry plants a tree and measures its height each month. The table shows his results.
Is the relationship between the number of months and the tree height proportional? Explain.
3. Eve buys sandwiches for a party. The table shows the total cost to buy a different number of sandwiches.
Sandwiches
Is the relationship between the number of sandwiches and the total cost proportional? Explain.
4. The distance from the sun to Earth is about 150,000,000 km. The distance from the sun to Neptune is about 4,500,000,000 km. The distance from the sun to Neptune is how many times as much as the distance from the sun to Earth?
Write your answer in scientific notation and in standard form.
5. Find the value of x.
6. What is the image of ⟷ AB under a translation 3 units left and 2 units down?
A. A line segment parallel to ⟷ AB
B. A line segment that intersects ⟷ AB
C. A line parallel to ⟷ AB
D. A line that intersects ⟷ AB
7. Graph and label the image of figure ABCDEFG under the following sequence of rigid motions.
• Reflection across the y-axis
• Translation 2 units left and 8 units down
8. Is △ ABC congruent to △DEF ? Explain.
Mixed Practice 2
1. Indicate whether each number is rational or irrational.
0.08333333…
2.44948949847…
2. Logan and Shawn are trying to decide whether 2.01388888… is a rational or irrational number.
• Logan says the number is rational because the 8 repeats.
• Shawn says the number is irrational because the 0, 1, and 3 appear only once and do not repeat.
Who is correct? Explain. Name
For problems 3–6, fill in the blank with an approximation of the number rounded to the nearest tenth. Then plot your approximation on the number line.
For problems 7–9, compare the numbers by using the < or > symbol.
2 · √ 2 2 · √ 3
π + 3 √ 50
3. √ 5 ≈
7. π √ 7
8.
9.
10. A translation along ⟶ AB maps figure M onto which figure?
A. Figure A
B. Figure B
C. Figure C
D. Figure D
11. Consider △ ABC shown in the coordinate plane.
a. Graph the image of △ ABC under the following rigid motions.
• Reflection across the y-axis
• Reflection across the x-axis Label the image △DEF.
b. Graph the image △ ABC under a 180° rotation around the origin. Label the image △GHI
c. Are △DEF and △GHI in the same location? Explain with the coordinates of the vertices.
12. Let △ ABC be a right triangle with an area of 30 square units. The triangle is located in the first quadrant. One side of △ ABC is shown.
a. Determine one possible location for point C. Draw △ ABC.
1. Graph the image of figure M under a reflection across the y-axis. Label the image R.
2. Graph the image of figure M under a translation 9 units left and 5 units down. Label the image V
3. Graph the image of figure M under a dilation centered at the origin with scale factor 2. Label the image D.
Apply the properties and definitions of exponents to write an equivalent expression with positive exponents. Assume x and y are nonzero.
1. (7 6) 3
2. (x 2 y 3)5
ANumber Correct:
Apply the properties and definitions of exponents to write an equivalent expression with positive exponents. Assume x and y are nonzero.
1. (53)2 23. (3x) 8
2. (53)3 24. (3x) 9
3. (53) 4
4. (53)5
5. (x 5) 3
6. (x 6)3
7. (x 7)3
8. (x 8)3
9. (x 3 y 6)2
10. (x 3 y 6)3
11. (x 3 y 6)4
(220)50
(220)55
(220)60
(2270)0
(x y 3)10
(x 4 y) 9
(x 3 y) 8
(x 0 y) 7
(x 2 y 3 )4 12. (x 3 y 6)5
(22 x 2)2
(x 6 y 8 )4 14. (23 x 4)2
15. (24 x 6)2
16. (25 x 8)2
17. (4 x 2)3
18. (6 x 4)4
19. (8 x 4)5
( x 8 y 10 )4
((1 2 )4)5
((1 2 )5)10
((1 2 )6)20
((1 2 )7)30
((2 3 )5)2 20. (10 x 5)6
((2 3 )10)3 21. (3 x) 5
((2 3 )20)4 22. (3 x) 7
((2 3 )30)5
BNumber Correct: Improvement:
Apply the properties and definitions of exponents to write an equivalent expression with positive exponents. Assume x and y are nonzero.
1. (5 4) 2
23. (3 x) 9
2. (5 5) 3 24. (3 x) 10
3. (5 6) 4
4. (57) 5
5. (x 4) 3
6. (x 5) 3
7. (x 6) 3
8. (x 7) 3
9. (x 2 y 5) 2
10. (x 2 y 5) 3
11. (x 2 y 5) 4
12. (x 2 y 5) 5
(220)30
(220)35
(220)40
(2250)0
(x y 3)5
(x 4 y) 4
(x 3 y) 3
(x 0 y) 2
(x 2 y 3 )5
(x 4 y 6 )5 13. (22 x 2) 3
14. (23 x 4) 3
15. (2 4 x 6) 3
16. (25 x 8) 3
17. (4 x 3) 4
18. (6 x 5) 5
19. (8 x 5) 6
(x 6 y 8 )5
( x 8 y 10 )5
((1 2 )10)3
((1 2 )20)4
((1 2 )30)5
((1 2 )40)6
((2 3 )6)5 20. (10 x 6) 7
((2 3 )7)10 21. (3 x) 6
22. (3 x) 8
((2 3 )8)30
((2 3 )9)40
Use the symbols >, =, or < to make a true statement.
AUse the symbols >, =, or < to make a true statement.
Number Correct:
Use the symbols >, =, or < to make a true statement.
Number Correct: Improvement:
Find the value of p in each equation.
1. 2p = 8
2. 3p = 24
AFind the value of p in each equation. 1.
Number Correct:
BFind the value of p in each equation. 1. 3p = 3
Number Correct: Improvement:
Solve each equation.
1. 1 6 = x 18
2. 1 6 = 5 x
ASolve each equation.
Number Correct:
Number Correct: Improvement:
Solve each equation.
Solve each equation.
1. 3x + 1 = 10
2. 3x − 4 = 8
ASolve each equation.
1. 2x + 4 = 14
2. 2x + 5 = 15
3. 2x + 6 = 16
4. 2x + 7 = 17
5. 2x + 8 = 18
6. 2x − 2 = 6
7. 2x − 4 = 6
8. 2x − 6 = 6
9. 2x − 8 = 6
10. 2x − 6 = 14
Number Correct:
12 = 3(x + 2)
3x + 6 = 12
3x + 12 = 6
−6 = 3x + 12
3x − 12 = −6
−3x − 6 = −12
−3(x − 2) = −12
6 = −3(x − 2)
3(x + 2) = −6
1 3 (x + 6) = 3 11. 2x − 6 = 12
13. 2x + 4 = 16
2(x + 2) = 16
15. 2(x + 2) = 18
16. 2(x + 2) = 20
17. 2(x − 2) = 20
18. 2(x − 2) = 18
3 =
−2 = − 1 3 (x − 9)
1 3 (x − 9) = 3
BSolve each equation.
1. 3x + 4 = 10
2. 3x + 5 = 11
3. 3x + 6 = 12
4. 3x + 7 = 13
5. 3x + 8 = 14
6. 3x − 3 = 6
7. 3x − 6 = 6
8. 3x − 9 = 6
9. 3x − 12 = 6
10. 3x − 6 = 18
Number Correct: Improvement:
20 = 4(x + 3)
4x + 12 = 20
4x + 20 = 12
−12 = 4x + 20
4x − 20 = −12
−4x − 12 = −20
−4(x − 3) = −20
12 = −4(x − 3)
4(x + 3) = −12
1 4 (x + 8) = 4 11. 3x − 6 = 15
12. 3x + 9 = 21
x − 2 = −4 13. 3x + 9 = 18
14. 3(x + 3) = 18
15. 3(x + 3) = 21
16. 3(x + 3) = 24
17. 3(x − 3) = 24
18. 3(x − 3) = 21
1 4 x + 4 = 2
−2 = − 1 4 (x − 16)
1 4 (x − 16) = 4
Student Edition: Grade 8, Module 3, Credits
Credits
Great Minds® has made every effort to obtain permission for the reprinting of all copyrighted material. If any owner of copyrighted material is not acknowledged herein, please contact Great Minds for proper acknowledgment in all future editions and reprints of this module.
Adriana Akers, Amanda Aleksiak, Tiah Alphonso, Lisa Babcock, Christopher Barbee, Reshma P Bell, Chris Black, Erik Brandon, Beth Brown, Amanda H. Carter, Leah Childers, David Choukalas, Mary Christensen-Cooper, Cheri DeBusk, Jill Diniz, Mary Drayer, Karen Eckberg, Dane Ehlert, Samantha Falkner, Scott Farrar, Kelli Ferko, Krysta Gibbs, Winnie Gilbert, Danielle Goedel, Julie Grove, Marvin E. Harrell, Stefanie Hassan, Robert Hollister, Rachel Hylton, Travis Jones, Kathy Kehrli, Raena King, Emily Koesters, Liz Krisher, Alonso Llerena, Gabrielle Mathiesen, Maureen McNamara Jones, Pia Mohsen, Bruce Myers, Marya Myers, Kati O’Neill, Ben Orlin, April Picard, John Reynolds, Bonnie Sanders, Aly Schooley, Erika Silva, Hester Sofranko, Bridget Soumeillan, Ashley Spencer, Danielle Stantoznik, Tara Stewart, James Tanton, Cathy Terwilliger, Cody Waters, Valerie Weage, Allison Witcraft, Caroline Yang
Trevor Barnes, Brianna Bemel, Adam Cardais, Christina Cooper, Natasha Curtis, Jessica Dahl, Brandon Dawley, Delsena Draper, Sandy Engelman, Tamara Estrada, Soudea Forbes, Jen Forbus, Reba Frederics, Liz Gabbard, Diana Ghazzawi, Lisa Giddens-White, Laurie Gonsoulin, Nathan Hall, Cassie Hart, Marcela Hernandez, Rachel Hirsh, Abbi Hoerst, Libby Howard, Amy Kanjuka, Ashley Kelley, Lisa King, Sarah Kopec, Drew Krepp, Crystal Love, Maya Márquez, Siena Mazero, Cindy Medici, Ivonne Mercado, Sandra Mercado, Brian Methe, Patricia Mickelberry, Mary-Lise Nazaire, Corinne Newbegin, Max Oosterbaan, Tamara Otto, Christine Palmtag, Andy Peterson, Lizette Porras, Karen Rollhauser, Neela Roy, Gina Schenck, Amy Schoon, Aaron Shields, Leigh Sterten, Mary Sudul, Lisa Sweeney, Samuel Weyand, Dave White, Charmaine Whitman, Nicole Williams, Glenda Wisenburn-Burke, Howard Yaffe
Student Edition: Grade 8, Module 3, Talking Tool
Talking Tool
Share Your Thinking
I know . . . . I did it this way because . . . . The answer is because . . . . My drawing shows . . . .
Agree or Disagree
Ask for Reasoning
I agree because . . . . That is true because . . . . I disagree because . . . . That is not true because . . . .
Do you agree or disagree with ? Why?
Why did you . . . ? Can you explain . . . ? What can we do first? How is related to ?
Say It Again
I heard you say . . . . said . . . .
Another way to say that is . . . . What does that mean?
Thinking Tool
When I solve a problem or work on a task, I ask myself
Before
Have I done something like this before?
What strategy will I use?
Do I need any tools?
During Is my strategy working?
Should I try something else?
Does this make sense?
After
What worked well?
What will I do differently next time?
At the end of each class, I ask myself
What did I learn?
What do I have a question about?
MATH IS EVERYWHERE
Do you want to compare how fast you and your friends can run?
Or estimate how many bees are in a hive?
Or calculate your batting average?
Math lies behind so many of life’s wonders, puzzles, and plans.
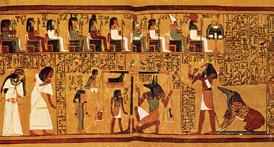
From ancient times to today, we have used math to construct pyramids, sail the seas, build skyscrapers—and even send spacecraft to Mars.
Fueled by your curiosity to understand the world, math will propel you down any path you choose.
Ready to get started?
Module 1
Scientific Notation, Exponents, and Irrational Numbers
Module 2
Rigid Motions and Congruent Figures
Module 3
Dilations and Similar Figures
Module 4
Linear Equations in One and Two Variables
Module 5
Systems of Linear Equations
Module 6
Functions and Bivariate Statistics
What does this painting have to do with math?
Abstract expressionist Al Held was an American painter best known for his “hard edge” geometric paintings. His bright palettes and bold forms create a three-dimensional space that appears to have infinite depth. Held, who sometimes found inspiration in architecture, would often play with the viewer’s sense of visual perception. While most of Held’s artworks are paintings, he also worked in mosaic and stained glass.