4 A Story of Units® Fractional Units
TEACH ▸ Module 6 ▸ Geometric Measurement and Data
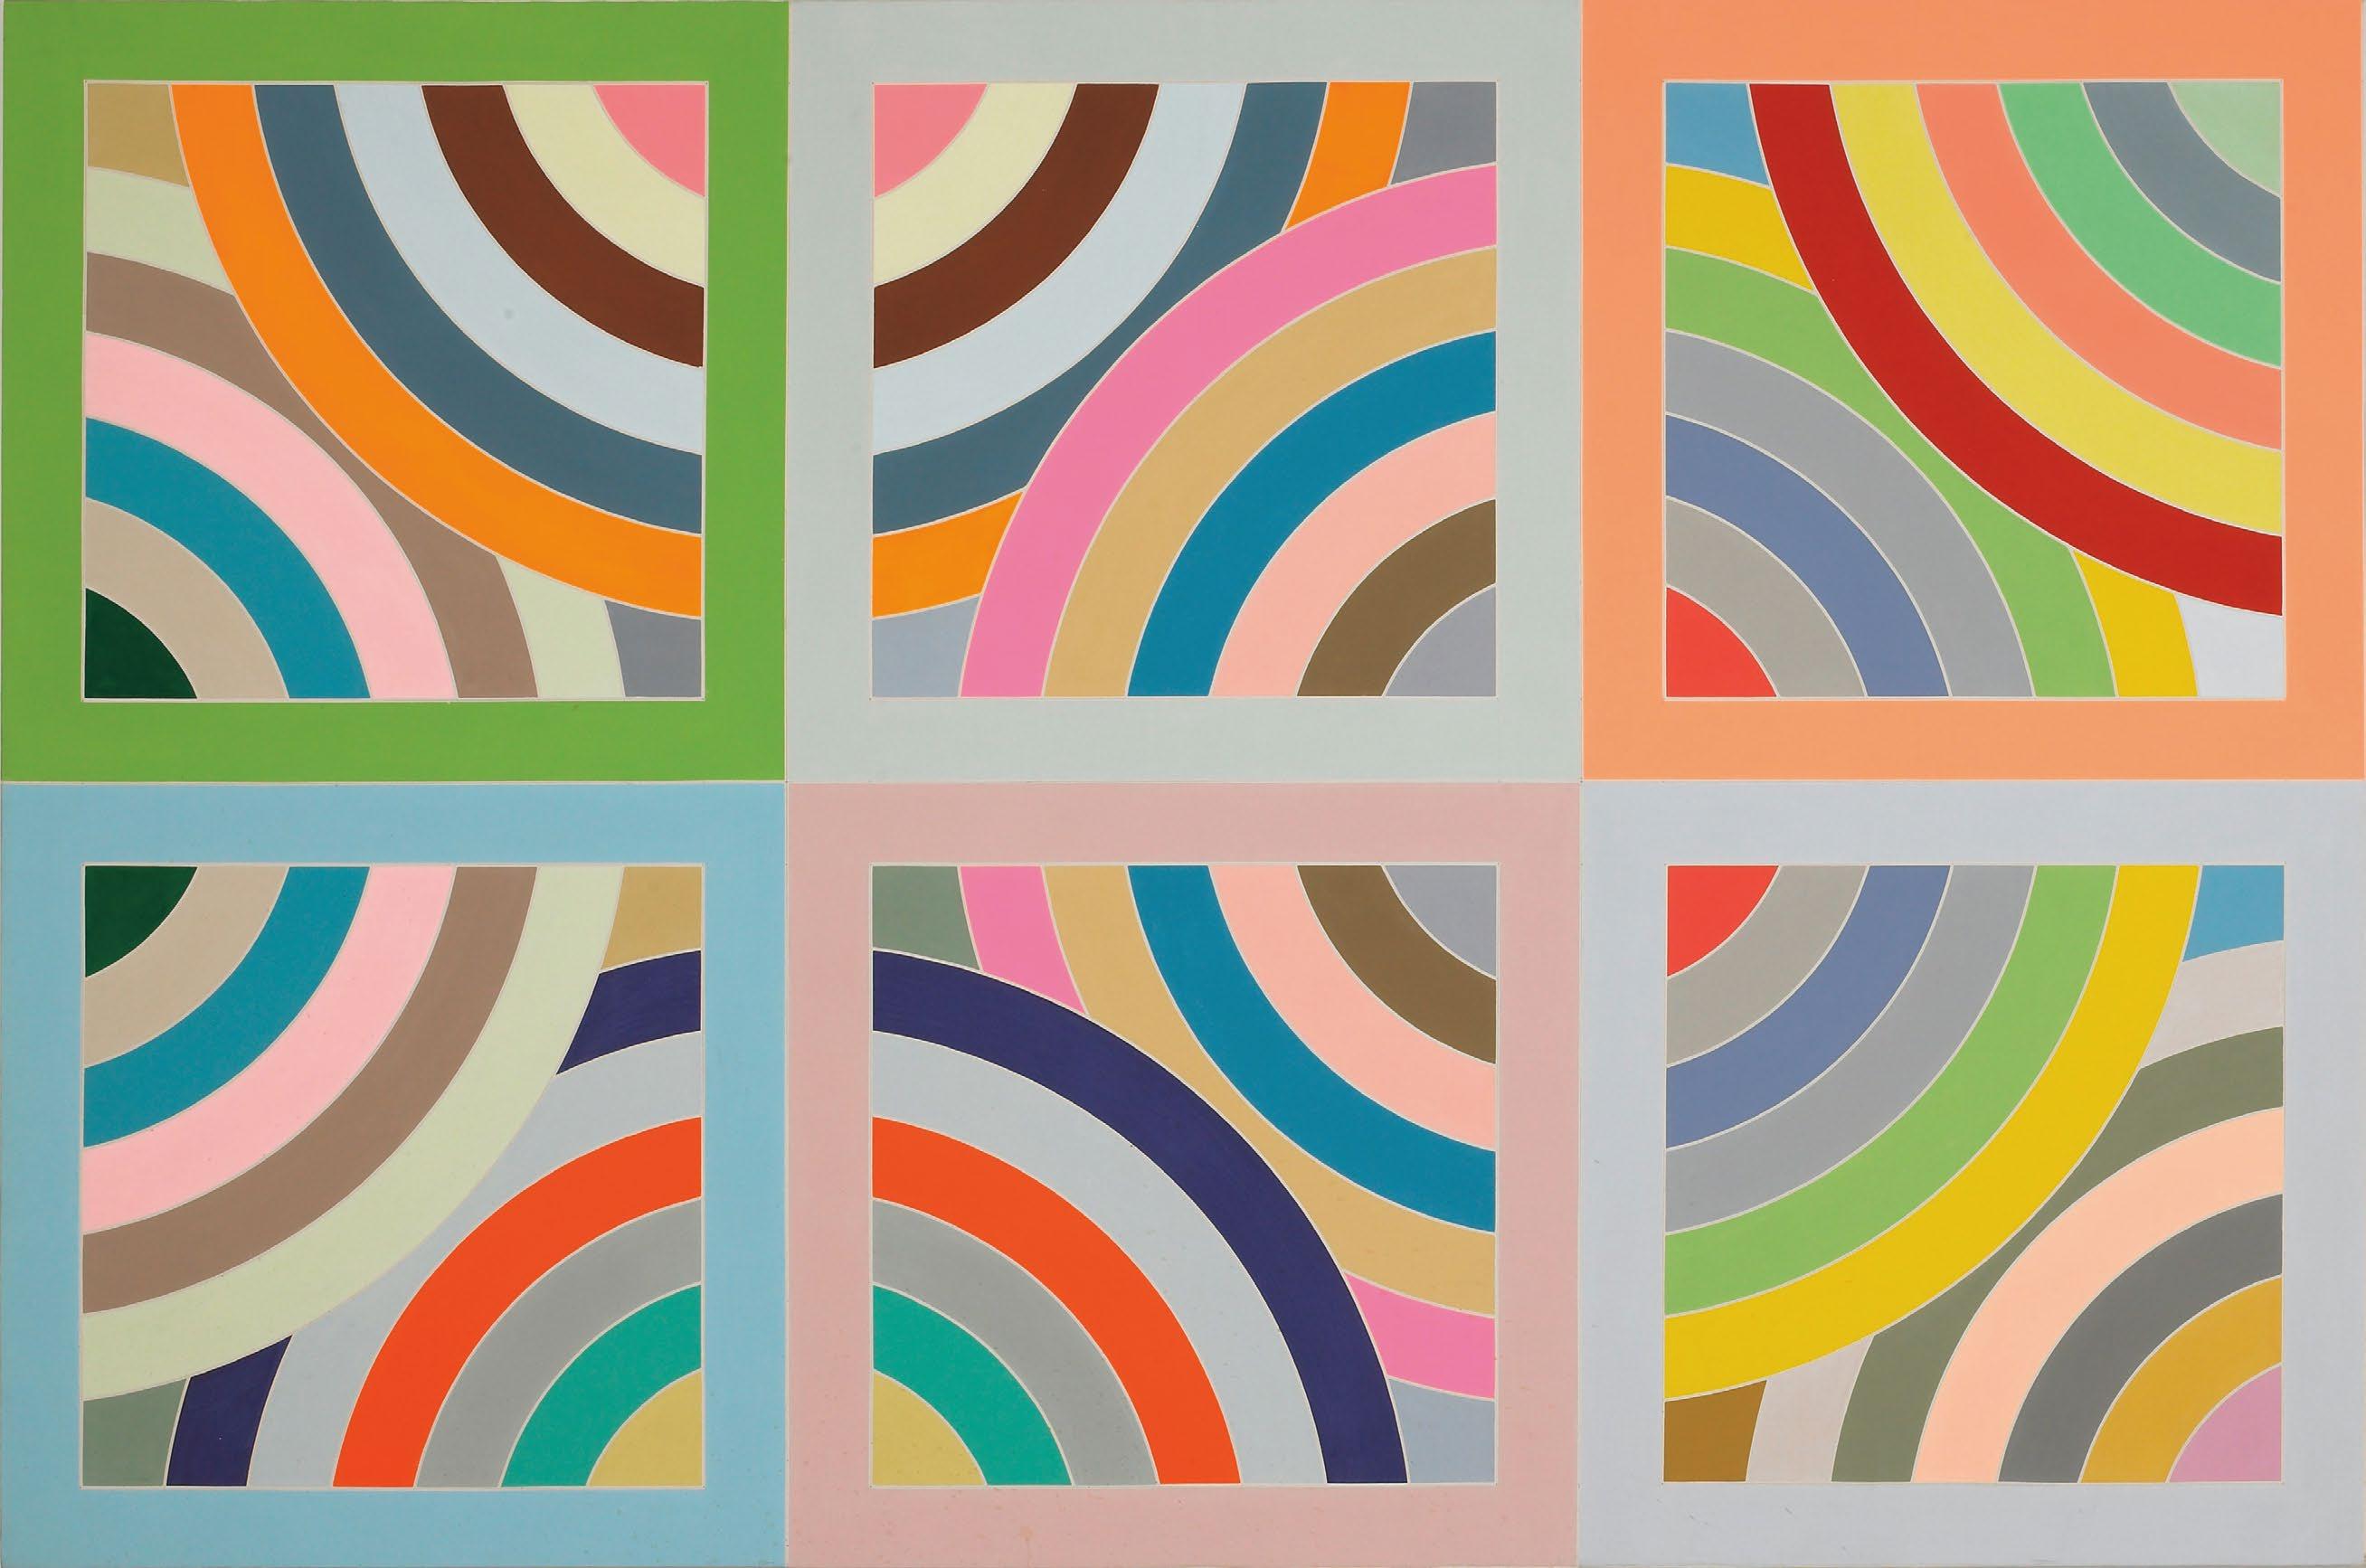
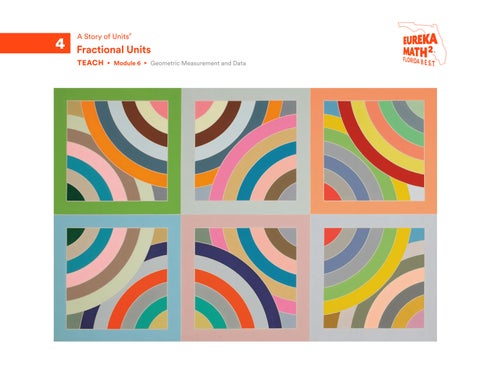
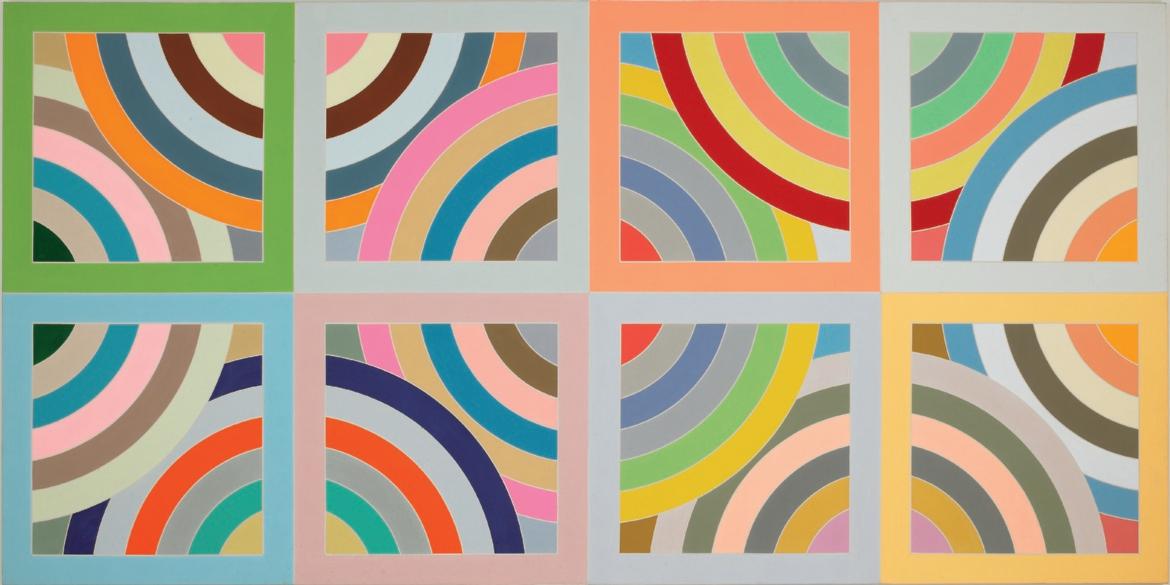
What
does
this painting have to do with math?
American abstract painter Frank Stella used a compass to make brightly colored curved shapes in this painting. Each square in this grid includes an arc that is part of a design of semicircles that look like rainbows. When Stella placed these rainbow patterns together, they formed circles. What fraction of a circle is shown in each square?
On the cover
Tahkt-I-Sulayman Variation II, 1969
Frank Stella, American, born 1936
Acrylic on canvas
Minneapolis Institute of Art, Minneapolis, MN, USA
Frank Stella (b. 1936), Tahkt-I-Sulayman Variation II, 1969, acrylic on canvas. Minneapolis Institute of Art, MN. Gift of Bruce B. Dayton/Bridgeman Images. © 2020 Frank Stella/Artists Rights Society (ARS), New York
Great Minds® is the creator of Eureka Math® , Wit & Wisdom® , Alexandria Plan™, and PhD Science®
Published by Great Minds PBC. greatminds.org
© 2023 Great Minds PBC. All rights reserved. No part of this work may be reproduced or used in any form or by any means—graphic, electronic, or mechanical, including photocopying or information storage and retrieval systems—without written permission from the copyright holder. Where expressly indicated, teachers may copy pages solely for use by students in their classrooms.
USA
ISBN 978-1-63642-524-5
2 3 4 5 6 7 8
10
25 24 23 22
Printed in the
A-Print 1
9
XXX
21
Module 1
Module 2
Module 3
Place Value Concepts for Addition and Subtraction
Module 4
Place Value Concepts for Multiplication and Division
Module 5
Multiplication and Division of Multi-Digit Numbers
Module 6
Foundations for Fraction Operations
Place Value Concepts for Decimal Fractions
Geometric Measurement and Data
A Story of Units® Fractional
▸ 4 TEACH
Units
Before This Module
Overview
Grade 3 Modules 4 and 6
In grade 3, students compare and classify polygons, including regular polygons, by attributes such as the number of sides, number of angles, right angles, pairs of parallel sides, and sides that have equal length. They describe, identify, and draw points, lines, line segments, rays, intersecting lines, perpendicular lines, and parallel lines. Students draw polygons to match a list of attributes and recognize that some combinations of attributes are not possible. Describing, defining, and sorting quadrilaterals—squares, rectangles, rhombuses, parallelograms, and trapezoids—by their attributes is an emphasis.
Grade 3 students describe angles as right angles (i.e., square corners), angles larger than a right angle, or angles smaller than a right angle. They identify the size of the angles by matching the angles with the corner of an index card.
Grade 4 module 6 elevates the work of grade 3 through formal introduction of angles as acute, right, obtuse, straight, or reflex, and through work with angle measurement, including measuring angles in degrees and drawing angles.
Geometric Measurement and Data
Topic A Data and Measurement
Students collect, represent, and answer questions about numerical and measurement data. They count numbers of objects and measure lengths to the nearest eighth inch and sixteenth inch to create data sets. Students represent data in tables, on stem-and-leaf plots, and on line plots. Students answer questions about the data, including determining the mode, median, and range. They also compare different representations of the same data set and discuss which representations are more useful to them when answering questions about the data.
© Great Minds PBC 2
× × × × × × × × × × × × × × × × × × × × × × × × ×
Topic B
Angles and Angle Measurement
Students identify different types of angles and describe them in relationship to each other (e.g., an obtuse angle is larger than a right angle and smaller than a straight angle). Students apply fractional understanding to see an angle as a fractional turn through a circle that is measured in degrees—a 1° angle is 1 360 of a turn through a circle. They describe turns in real-world situations, and they refine their definitions of angle types to include degree measures. Students use protractors to measure and draw angles with accuracy and use benchmark angles to estimate the measures of angles.
After This Module
Grade 5 Module 5
In grade 5, students classify triangles and quadrilaterals based on their sides and angles and classify three-dimensional figures based on their defining attributes. Students recognize categories and subcategories of quadrilaterals, for example, noting that a square is a rhombus.
Topic C
Determine Unknown Angle Measures
Students recognize and apply the additive nature of angle measure to find the unknown measures of angles within figures without using a protractor. They use what is known and the part–total relationship to determine an unknown angle measure when right angles, straight angles, and angles of known measures are decomposed.
EUREKA MATH2 Florida B.E.S.T. Edition 4 ▸ M6 © Great Minds PBC 3
43° y° E H FG 43 + y = 180 y = 137 The measure of is 137°. HFG
© Great Minds PBC 4 Contents Geometric Measurement and Data Why....................................................... 6 Achievement Descriptors: Overview ..................... 8 Topic A .................................................. 12 Data and Measurement Lesson 1 ................................................... 16 Collect and represent data by using stem-and-leaf plots. Lesson 2 ................................................... 38 Determine and interpret the mode, median, and range of a given data set. Lesson 3 ................................................... 60 Measure length to the nearest eighth inch and sixteenth inch. Lesson 4 ................................................... 80 Collect, represent, and interpret data. Topic B .................................................. 101 Angles and Angle Measurement Lesson 5 .................................................. 106 Identify right, acute, obtuse, and straight angles. Lesson 6 .................................................. 128 Draw right, acute, obtuse, and straight angles. Lesson 7 .................................................. 144 Relate geometric figures to a real-world context. Lesson 8 .................................................. 162 Explore angles as fractional turns through a circle. Lesson 9 .................................................. 178 Use a circular protractor to recognize a 1° angle as a turn through 1 360 of a circle. Lesson 10 ................................................. 200 Identify and measure angles as turns and recognize them in various contexts. Lesson 11. . . . . . . . . . . . . . . . . . . . . . . . . . . . . . . . . . . . . . . . . . . . . . . . . . 216 Use 180° protractors to measure angles. Lesson 12 ................................................. 236 Estimate and measure angles with a 180° protractor. Lesson 13 ................................................. 258 Use a protractor to draw angles up to 180°. Topic C ................................................. 275 Determine Unknown Angle Measures Lesson 14 ................................................. 278 Decompose angles by using pattern blocks. Lesson 15 ................................................. 298 Find unknown angle measures within right and straight angles. Lesson 16 ................................................. 318 Find unknown angle measures within a decomposed angle of up to 180°.
EUREKA MATH2 Florida B.E.S.T. Edition 4 ▸ M6 © Great Minds PBC 5 Resources Standards ................................................ 334 Achievement Descriptors: Proficiency Indicators ............... 336 Terminology .............................................. 344 Math Past ................................................ 346 Materials ................................................. 350 Works Cited .............................................. 352 Credits ................................................... 354 Acknowledgments ......................................... 355
Why
Geometric Measurement and Data
Why are students introduced to so much terminology?
The intention of introducing the terms in this module is to build a strong core foundation of geometry. The purposeful inclusion of formal terminology helps to make other definitions clearer or to prepare students for future learning. Following are some examples that demonstrate this intention.
To support their understanding of acute, right, and obtuse angle types, students are introduced to straight and reflex angles. By including straight and reflex angles, this module allows students to define angle types in relation to each other and to use those relationships when solving problems. Student understanding of 360° as a full turn through a circle is crucial to their understanding of degrees as units used to measure angles. With acute, right, obtuse, straight, and reflex angles in their tool kit, students can name any angle whose measure is within 360°
© Great Minds PBC 6
. E F D R P S Z Y X BC D RS P Angle Ty pe Angle MeasureExample acute angleBet ween 0° and 90° reflex angleBet ween 180° and 36 0° r ight angle 90° obtuse angle Between 90° and 180° straight angle 180°
The formal relationships of complementary and supplementary angles is important in later grades when students write equations to find multiple unknown angle measures. However, the additive nature of angle measure is a key concept in grade 4, and therefore, this module helps students gain familiarity with these angles and their relationships. Students decompose right and straight angles into smaller angles and see that the total measure of the smaller angles is 90° and 180°, respectively. The terms complementary and supplementary give students the precise vocabulary to name the relationships they discover.
Why is this module placed last in the year?
The deliberate sequence of the grade 4 modules allows students to build on their prior grade-level understanding, develop new learning, create foundational scaffolds and supports for future learning, and attend to the major mathematical topics of the grade.
Fractional understanding is an integral part of the definition of degree, the unit used to measure angles. Placing geometric work last allows students time to develop fluency with grade 4 fraction and decimal concepts. They can then apply that knowledge to add and subtract new units of measure, degrees.
Studying geometry last in the sequence also allows students to connect their algebraic work from the year to their familiarity with two-dimensional shapes. Their mathematical understanding matures as they make these connections and expand their geometric vocabulary.
EUREKA MATH2 Florida B.E.S.T. Edition 4 ▸ M6 © Great Minds PBC 7
Achievement Descriptors: Overview
Geometric Measurement and Data
Achievement Descriptors (ADs) are standards-aligned descriptions that detail what students should know and be able to do based on the instruction. ADs are written by using portions of various standards to form a clear, concise description of the work covered in each module.
Each module has its own set of ADs, and the number of ADs varies by module. Taken together, the sets of module-level ADs describe what students should accomplish by the end of the year.
ADs and their proficiency indicators support teachers with interpreting student work on
• informal classroom observations,
• data from other lesson-embedded formative assessments,
• Exit Tickets,
• Topic Quizzes, and
• Module Assessments.
This module contains the eight ADs listed.
Measure the length of an object by using a ruler.
Classify angles as acute, right, obtuse, straight, or reflex.
Describe angle attributes in two-dimensional figures.
Estimate angle measures by using the benchmark angles of 30°, 45°, 60°, 90°, and 180°
© Great Minds PBC 8
FL.4.Mod6.AD1
MA.4.M.1.1
FL.4.Mod6.AD2
MA.4.GR.1.1
FL.4.Mod6.AD3
MA.4.GR.1.1
FL.4.Mod6.AD4
.
MA.4.GR.1.2
FL.4.Mod6.AD5
Measure and draw angles in degrees.
FL.4.Mod6.AD6
Solve for unknown angle measures by using addition and subtraction.
MA.4.GR.1.2
FL.4.Mod6.AD7
Create a line plot or stem-and-leaf plot and solve real-world problems involving numerical data.
MA.4.DP.1.1
MA.4.DP.1.3
The first page of each lesson identifies the ADs aligned with that lesson. Each AD may have up to three indicators, each aligned to a proficiency category (i.e., Partially Proficient, Proficient, Highly Proficient). While every AD has an indicator to describe Proficient performance, only select ADs have an indicator for Partially Proficient and/or Highly Proficient performance.
An example of one of these ADs, along with its proficiency indicators, is shown here for reference. The complete set of this module’s ADs with proficiency indicators can be found in the Achievement Descriptors: Proficiency Indicators resource.
ADs have the following parts:
• AD Code: The code indicates the grade level and the module number and then lists the ADs in no particular order. For example, the first AD for grade 4 module 6 is coded as FL.4.Mod6.AD1.
• AD Language: The language is crafted from standards and concisely describes what will be assessed.
• AD Indicators: The indicators describe the precise expectations of the AD for the given proficiency category.
• Related Standard: This identifies the standard or parts of standards from the Florida Benchmarks for Excellent Student Thinking (B.E.S.T.) that the AD addresses.
FL.4.Mod6.AD8
Determine the mode, median, or range of a data set. MA.4.DP.1.2 MA.4.DP.1.3
EUREKA MATH2 Florida B.E.S.T. Edition 4 ▸ M6 © Great Minds PBC 9
MA.4.GR.1.2 MA.4.GR.1.3
AD Code: FL.Grade.Mod#.AD# AD Language
Achievement Descriptors: Proficiency Indicators
FL.4.Mod6.AD1 Measure the length of an object by using a ruler.
RELATED B.E.S.T.
MA.4.M.1.1 Select and use appropriate tools to measure attributes of objects.
Partially Proficient Proficient
Measure the length of an object to the nearest eighth inch by using a ruler.
Use a ruler to measure and record the length of the pencil to the nearest eighth inch. inches
Measure the length of an object to the nearest sixteenth inch by using a ruler.
Use a ruler to measure and record the length of the pencil to the nearest sixteenth inch. inches
Highly Proficient
Related Standard
AD Indicators
4 ▸ M6 EUREKA MATH2 Florida B.E.S.T. Edition © Great Minds PBC 10
Great Minds PBC 336
©
Topic A Data and Measurement
In topic A, students collect, represent, and answer questions about data sets. Students begin the topic by collecting numerical data. They count the number of raisins in pictures of boxes of raisins to help answer a question about how well a box-filling machine works. They record the whole-number data values in a table and recognize that the table does not help them efficiently answer questions about the data. Students then create a stem-and-leaf plot to display the same whole-number data. To create a stem-and-leaf plot, students draw a two-column table and decompose the data values into two parts: stems and leaves. The leaves represent the smallest unit of the values in the data set, and the stems represent the remaining place value units in the data set. The stem-and-leaf plot organizes the data values from least to greatest and groups values that have the same stem. Students use the stem-and-leaf plot to help them more efficiently answer questions about the data. Students also represent data values of mixed numbers on a stem-and-leaf plot. The stems represent the whole numbers, and the leaves represent the fractional parts.
In module 4, students determine the range and mode of a data set. In this topic, they realize that a data set can have one mode, more than one mode, or no mode. Students also learn that determining the median, or middle value, is another way to think about a data set. Students determine the median by ordering the data from least to greatest and then finding the value in the middle of all the data values. They determine the median, mode, and range of data sets represented on stem-and-leaf plots and on line plots. Students discuss the efficiency of answering questions by using stem-and-leaf plots and line plots.
In grade 3, students iterate half- and quarter-inch pieces of straws to partition whole-number intervals on rulers into halves and fourths. Then they measure the lengths of objects to the nearest half inch and quarter inch. In this topic, students partition quarter-inch intervals on a ruler into eighths and sixteenths. Then they measure the lengths of objects to the nearest eighth inch and sixteenth inch. Students think about how and when smaller units can be used to record lengths more precisely.
© Great Minds PBC 12
After practicing measuring to the nearest eighth inch and sixteenth inch, students create a data set by measuring lengths of objects to the nearest sixteenth inch. They record the data in a table and use the data to create a line plot. Students use the line plot to answer questions about the data, including questions about determining the mode, median, and range.
In topic B, students identify, measure, and draw angles.
EUREKA MATH2 Florida B.E.S.T. Edition 4 ▸ M6 ▸ TA © Great Minds PBC 13
Progression of Lessons
Lesson 1
Collect and represent data by using stem-and-leaf plots.
Lesson 2
Determine and interpret the mode, median, and range of a given data set.
Lesson 3
Measure length to the nearest eighth inch and sixteenth inch.
Key: 8 5 means 85
I can record data in a table and represent the data on a stem-and-leaf plot. I can use a stem-and-leaf plot to represent whole-number or fractional data. Organizing data on a stem-and-leaf plot helps me efficiently answer questions about the data set.
I can use different strategies to find the middle value, or median, of an ordered data set. I can also find the mode and the range of a data set. Stem-and-leaf plots and line plots are useful representations when answering questions about a data set.
I can label eighths and sixteenths on a ruler. I can measure length to the nearest eighth inch or sixteenth inch. I look at the tick mark on the ruler that lines up with the end of the object to decide which fractional unit to use for the most precise measurement.
© Great Minds PBC 14 4 ▸ M6 ▸ TA EUREKA MATH2 Florida B.E.S.T. Edition
Temperatures (degrees Fahrenheit) Stem Leaf 7 5 6 8 0 0 1 2 2 4 6 6 7 8 9 0 1 3 4 5 7 7 8 9 10
1 2 3 4 5 6 0
Lesson 4
Collect, represent, and interpret data.
I can measure length to the nearest sixteenth inch and record the measurements in a table. I can make a line plot to represent the measurement data. The line plot is a useful way to look at all the measurements to help me answer questions about the data set.
EUREKA MATH2 Florida B.E.S.T. Edition 4 ▸ M6 ▸ TA © Great Minds PBC 15
0 × × × × × × × × × × × × × × × × × × × × × × × × ×
Collect and represent data by using stem-and-leaf plots.
Lesson at a Glance
Students collect data by counting the number of raisins in a picture of a box of raisins. Students record the class data in a table and then discuss the efficiency of using the table to answer questions about the data. Students use the data to create a stem-and-leaf plot. They also create a stem-and-leaf plot by using fractional data. Students compare the data represented on a line plot with the same data represented on a stem-and-leaf plot to identify similarities and differences between the two types of data displays. This lesson formalizes the term stem-and-leaf plot.
Key Questions
• How can we organize data on a stem-and-leaf plot?
• When is it useful to display data on a stem-and-leaf plot?
Achievement Descriptor
FL.4.Mod6.AD7 Create a line plot or stem-and-leaf plot and solve real-world problems involving numerical data. (MA.4.DP.1.1) (MA.4.DP.1.3)
© Great Minds PBC LESSON 1
EUREKA MATH2 Florida B.E.S.T. Edition 4 ▸ M6 ▸ TA ▸ Lesson 1 © Great Minds PBC 9 1 The table shows the heights of seedlings in a garden. Heights of Seedlings (inches) 1 1 4 3 3 4 3 1 2 3 4 3 1 1 2 3 4 1 1 4 1 2 1 1 4 3 1 4 3 1 4 3 4 1 1 1 2 a. Create a stem-and-leaf plot of the seedling heights in inches. Include a title and a key.
How many seedlings are represented by the data? 15 seedlings
What is the height in inches of the smallest seedling? 1 2 inch
How many seedlings have a height that is less than 3 inches? 10 seedlings Heights of Seedlings (inches) Stem Leaf 0 1 2 3 1 2 3 4 3 4 3 4 0 1 4 1 4 1 4 1 2 1 2 0 1 4 1 4 1 2 3 4 1 4 1 4 Key: 1 means 1 Name Date
b.
c.
d.
1
Agenda
Fluency 10 min
Launch 5 min
Learn 35 min
• Whole-Number Data and Stem-and-Leaf Plots
• Fractional Data and Stem-and-Leaf Plots
• Stem-and-Leaf Plots and Line Plots
• Problem Set
Land 10 min
Materials
Teacher
• Computer or device*
• Projection device*
• Teach book*
• Raisin Cards (in the teacher edition)
Students
• Dry-erase marker*
• Learn book*
• Pencil*
• Personal whiteboard*
• Personal whiteboard eraser*
* These materials are only listed in lesson 1. Ready these materials for every lesson in this module.
Lesson Preparation
Print or copy Raisin Cards and cut out the pictures of the boxes of raisins. Prepare enough cards to have one card per student.
© Great Minds PBC 17 EUREKA MATH2 Florida B.E.S.T. Edition 4 ▸ M6 ▸ TA ▸ Lesson 1
Fluency
Choral Response: Convert Liters to Milliliters
Students convert liters to milliliters to build fluency with expressing metric measurements in a larger unit in terms of a smaller unit from module 1.
Display the equation 1 L = mL.
One liter is equivalent to how many milliliters? Raise your hand when you know.
Wait until most students raise their hands, and then signal for students to respond.
1,000 mL
Display the answer.
Repeat the process with the following sequence:
© Great Minds PBC 18 4 ▸ M6 ▸ TA ▸ Lesson 1 EUREKA MATH2 Florida B.E.S.T. Edition
2 L = mL 5 L = mL 8 L 750 mL = mL 4 L 150 mL = mL 7 L 50 mL = mL 5 L 300 mL = mL 8 L 700 mL = mL 2,000 5,000 8,750 4,150 7,050 5,300 8,700 10 1 L = mL 1,000
Whiteboard Exchange: Line Plots
Students answer questions about a line plot to develop fluency with interpreting data in line plots.
Display the line plot.
After each prompt for a written response, give students time to work. When most students are ready, signal for students to show their whiteboards. Provide immediate and specific feedback. If students need to revise, briefly return to validate their corrections.
What does this line plot show?
The amount of sleep in hours that a group of students in Miss Diaz’s class gets on a school night
How many students are represented on the line plot?
26 students
How many students sleep for less than 8 hours on a school night?
7 students
What is the mode? 10 hours
What is the least number of hours a student sleeps on a school night?
4 1 2 hours
© Great Minds PBC 19 EUREKA MATH2 Florida B.E.S.T. Edition 4 ▸ M6 ▸ TA ▸ Lesson 1
0 4 5 6 7 8 9 10 11 × × × × × × × × × × × × × × × × × × × × × × × × × × 4 1 2 5 1 2 6 1 2 7 1 2 8 1 2 9 1 2 10 1 2 111 2 Amount of Sleep (hours)
Amount of Sleep on a School Night for Students in Miss Diaz’s Class
What is the greatest number of hours a student sleeps on a school night?
11 hours
What is the range?
6 1 2 hours
Launch
Materials—T: Raisin Cards
Students collect data and discuss how they can use that data to answer questions. Pose the following situation.
An engineer designed a machine to fill small boxes of raisins. The engineer wonders how well the machine is working. If the machine is working well, there should be about the same number of raisins in each box. We have pictures of some of the boxes of raisins that the machine has filled.
Distribute one Raisin Card to each student.
How might we decide how well the box-filling machine is working?
We can count the number of raisins in each box and then compare the numbers to see if they are about the same.
Direct students to count the number of raisins in their box. Then direct students to problem 1 in their books. Invite students to share the number of raisins in their box. As each student reports the number of raisins in their box, record the number in a class table. Have students enter these numbers into the table shown in problem 1.
Language Support
Consider using strategic, flexible grouping throughout the module, based on students’ mathematical and English language proficiency.
• Pair students who have different levels of mathematical proficiency.
• Pair students who have different levels of English language proficiency.
• Join two pairs of students to form small groups of four.
As applicable, complement any of these groupings by pairing students who speak the same native language.
© Great Minds PBC 20 4 ▸ M6 ▸ TA ▸ Lesson 1 EUREKA MATH2 Florida B.E.S.T. Edition
5
1. Complete the table by recording the number of raisins in each box.
a. How many boxes of raisins are represented in the table?
24 boxes
b. What is the fewest number of raisins in a box?
10 raisins
c. How many boxes have exactly 21 raisins?
2 boxes
d. How many boxes have more than 30 raisins?
12 boxes
Invite students to work with a partner to complete parts (a) through (d). Select one or two pairs to share their answers.
Which parts of problem 1 did you take more time to answer? We took longer to answer parts (b) and (d) than parts (a) and (c).
© Great Minds PBC 21 EUREKA MATH2 Florida B.E.S.T. Edition 4 ▸ M6 ▸ TA ▸ Lesson 1
Number of Raisins in a Box 30 10 27 16 32 35 35 24 23 45 27 23 21 19 21 34 40 36 17 41 31 38 32 42
Invite students to think–pair–share about why some of the questions take more time to answer than others when using the data represented in the table.
To complete part (b), we had to look at all the numbers recorded in the table and compare them to each other to find the fewest number of raisins in a box.
For part (d), we had to look at all the numbers and keep track of how many boxes had more than 30 raisins.
For parts (a) and (c), we quickly found the answers. We counted all the boxes of raisins for part (a), and we counted how many boxes have 21 raisins for part (c).
How else might we display the data set so we can quickly answer questions about the data?
We could make a line plot. That way, we could quickly see information about the data, like the fewest and greatest number of raisins in a box.
Transition to the next segment by framing the work.
Today, we will organize data in another type of display by thinking about the values in the data set.
Learn
Whole-Number Data and Stem-and-Leaf Plots
Students represent whole-number data by using a stem-and-leaf plot.
Direct students to look at the data set they recorded in the table in problem 1. What place value units are represented by the data values in the table?
Tens and ones
Let’s think about the fewest number of raisins in a box, 10. In unit form, what is the value of each digit?
1 ten and 0 ones
© Great Minds PBC 22 4 ▸ M6 ▸ TA ▸ Lesson 1 EUREKA MATH2 Florida B.E.S.T. Edition
35
Begin a stem-and-leaf plot by drawing a two-column table. Record 1 in the left column and 0 in the right column.
How do you see 10 represented?
It looks like 10 is written as a number of tens and a number of ones.
We see the digit 1 and the digit 0, but there aren’t any headings to label the digits as tens and ones.
Are there any other values in our data set that also have 1 ten?
Yes. The values 16, 17, and 19 also have 1 ten.
Each of those values has 1 ten, just like our first value, 10, so we can represent each of the values by only recording the number of ones.
Record 6, 7, and 9 in the right column.
What do you notice about the order in which I recorded the ones?
You wrote the ones in order from least to greatest.
We started with the fewest number of raisins in a box, 10, and wrote 10 as a number of tens and a number of ones. Then we looked for the other values in our data set that have 1 ten, and we recorded the number of ones for each of those values.
Invite students to turn and talk about which values from the data set they think should be displayed next.
Begin a new row in the stem-and-leaf plot. Record 2 in the left column and 1, 1, 3, 3, 4, 7, and 7 in the right column.
What do you notice about the way I recorded the number of ones for each value in our data set that has 2 tens?
You wrote the numbers of ones in order from least to greatest.
You wrote the following numbers of ones twice each: 1 one, 3 ones, and 7 ones.
You wrote the digits so they are lined up one beneath the other.
Differentiation: Support
Consider using number bonds to support students as they decompose each value in the data set to represent the data on the stem-and-leaf plot. The familiar representation of the number bond can help students with the unfamiliar representation of the stem-and-leaf plot. 10 6
16
© Great Minds PBC 23 EUREKA MATH2 Florida B.E.S.T. Edition 4 ▸ M6 ▸ TA ▸ Lesson 1
Invite students to think–pair–share about why the number of ones has some repeated digits in the row that represents the values with 2 tens.
We need to represent all the values. Since our data set has two boxes with 21 raisins, we need to write 1 one twice in the row for 2 tens. The same is true for 23 and 27. If 1 one, 3 ones, and 7 ones were not included twice, the stem-and-leaf plot wouldn’t show all our data. That means not all the boxes of raisins would be represented. We wouldn’t be able to correctly answer questions about the data without all the data represented.
We thought about Xs on a line plot. If we drew a line plot, we would draw two Xs above 21 because there are two boxes that each have 21 raisins. So in this table, we write 1 one twice in the row for 2 tens to represent two boxes of 21 raisins.
To accurately represent each value in our data set that has 2 tens, we need to write the following numbers of ones twice each: 1 one, 3 ones, and 7 ones.
Continue creating the stem-and-leaf plot by using the values in the data set that have 3 tens and then 4 tens.
What is the smallest place value unit represented by the values in our data set?
Ones
Gesture to the column on the right in the stem-and-leaf plot.
The digits in the right column represent the smallest unit of the values in the data set, the ones. We call the digits in the right column leaves. Each digit is a leaf. Draw a row above the row that represents the values with 1 ten. Label the column on the right with the heading Leaf.
Gesture to the column on the left in the stem-and-leaf plot.
What do the digits in the column on the left represent?
Tens
Teacher Note
The conventions used in this lesson to represent data by using stem-and-leaf plots include
• ordering the stems and leaves from least to greatest,
• vertically aligning leaves in one row below the leaves in a previous row (and not including commas between leaves),
• including a stem with no leaves to indicate a gap in the data, and
• using a leaf of 0 with fractional data to indicate that the value of the fractional part is 0.
© Great Minds PBC 24 4 ▸ M6 ▸ TA ▸ Lesson 1 EUREKA MATH2 Florida B.E.S.T. Edition
The digits in the left column represent the units that are not ones in our data set. We call the digits in the left column stems. Each digit is a stem.
Label the column on the left with the heading Stem.
Gesture to the entire stem-and-leaf plot.
We organized our data in a table by representing the values decomposed into parts. We made a stem-and-leaf plot.
Invite students to turn and talk about whether other people who look at the stem-and-leaf plot will know what data is displayed and what the stems and leaves represent.
We include a title to describe the data displayed in the stem-and-leaf plot. We also include a key to show what numbers the stems and leaves represent.
Add a title and a key to the stem-and-leaf plot.
How do you think we would represent a value of 9 in our stem-and-leaf plot?
We would need to include a row above the row that represents 1 ten. The stem would be 0 and the leaf would be 9 because 9 has 0 tens and 9 ones.
Direct students to problem 1.
Earlier, you used the table in problem 1 to complete parts (a) through (d) and then discussed why you took longer to answer some of the questions.
Invite students to think–pair–share about whether they would need the same amount of time to complete parts (a) through (d) if they used the stem-and-leaf plot to think about the data.
We would probably still take about the same amount of time to complete part (a) because we would still have to count all the values.
We would take less time to complete part (b) because the values in the stem-and-leaf plot are organized from least to greatest. The first value, 10, represents the fewest number of raisins in a box.
Language Support
Consider showing or creating an image to support the term stem-and-leaf plot. Use the data from one row in the stem-and-leaf plot to label a picture of an actual stem with leaves.
© Great Minds PBC 25 EUREKA MATH2 Florida B.E.S.T. Edition 4 ▸ M6 ▸ TA ▸ Lesson 1
1
0 6 7 9
We would take less time to complete part (c) because we can use the stem-and-leaf plot to quickly see that two boxes have 21 raisins. We look at the stem that represents 2 tens and then see that there are two leaves in that row that represent 1 one. We would take less time to complete part (d) because we can look at the stem that represents 3 tens to quickly count the leaves in that row that are greater than 0 ones. We also need to include all the leaves in the row with the stem that represents 4 tens to determine how many boxes have more than 30 raisins.
Display the picture of the table and the stem-and-leaf plot.
We displayed the data we collected about the number of raisins in each box in a table and on a stem-and-leaf plot. When deciding whether the engineer’s box-filling machine is working well, which display do you think is more helpful? Why?
I think the stem-and-leaf plot is more helpful because the data values are more organized.
I think the stem-and-leaf plot is more helpful because we can quickly see that the boxes do not have about the same number of raisins.
I think the stem-and-leaf plot is more helpful because the values are organized from least to greatest. This helps us quickly see that there’s a big difference between the greatest number of raisins and the fewest number of raisins. So the machine is not working well because the boxes do not have about the same number of raisins.
Invite students to turn and talk about why they might want to display data on a stem-and-leaf plot.
© Great Minds PBC 26 4 ▸ M6 ▸ TA ▸ Lesson 1 EUREKA MATH2 Florida B.E.S.T. Edition
Number of Raisins in a Box 30 10 27 16 32 35 35 24 23 45 27 23 21 19 21 34 40 36 17 41 31 38 32 42 Number of Raisins in a Box Stem Leaf 1 0 6 7 9 1 1 3 3 4 7 7 0 1 2 5 0 1 2 2 4 5 5 6 8 2 3 4 Key: 2 3 means 23
Fractional Data and Stem-and-Leaf Plots
Students represent fractional data by using a stem-and-leaf plot. Direct students to problem 2 and chorally read the problem.
2. Adam grows sunflowers. He measures the height of each sunflower plant to the nearest 1 4 inch. Adam records the heights in the table shown.
Differentiation: Challenge
Consider inviting students to collect their own data with fractional values to represent on a stem-and-leaf plot. They might measure the lengths of pencils, the heights of block towers, or some other measurement of their choosing. Consider giving the students guidelines for their data collection, such as collecting at least 15 measurements and measuring to the nearest 1 4 inch.
Create a stem-and-leaf plot of the sunflower plant heights in inches. Include a title and a key. Stem Leaf Heights of Sunflower Plants (inches)
UDL: Representation
Consider showing a picture of a sunflower plant to help support the context of measuring the heights of these plants. Label the picture to show that Adam measures the height of the plant from the ground to the top of the plant. Make sure students understand that Adam does not consider the roots when he measures the height of each plant.
© Great Minds PBC 27 EUREKA MATH2 Florida B.E.S.T. Edition 4 ▸ M6 ▸ TA ▸ Lesson 1
Heights
(inches) 11 1 4 11 3 4 10 1 2 11 1 2 11 1 4 10 1 4 12 1 4 10 3 4 11 8 3 4 11 1 4 11 12 1 2 10 3 _ 4 11 1 2 11 1 4 11 10 3 _ 4
of Sunflower Plants
8 9 10 11 3 4 0 0 0 12 1 4 1 2 1 4 1 2 3 4 3 4 3 4 1 4 1 4 1 4 1 4 1 2 1 2 3 4 1 2 1 2 Key: 10 means 10
What do you notice about the measurements in the table?
Some of the measurements are mixed numbers. Some of the measurements are whole numbers.
The fractional units in the mixed numbers are fourths and halves.
Some of the whole-number parts of the mixed numbers only have ones, and some of the whole-number parts of the mixed numbers have tens and ones.
Making a stem-and-leaf plot requires choosing a unit for the leaves. When we made a stem-and-leaf plot to display the number of raisins in each box, we used the smallest place value unit to determine the leaves. Then all the other digits in the number became the stem.
Invite students to turn and talk about how they might determine the stems and leaves for the data set that includes fractional units.
When creating stem-and-leaf plots for fractional data values, the whole-number parts of the numbers are the stems and the fractional parts of the numbers are the leaves.
What is the height of the shortest sunflower plant in inches that Adam grew?
8 3 4 inches
How can we record 8 3 _ 4 in the stem-and-leaf plot?
We can write 8 for the stem since it’s the whole-number part of the height and 3 4 for the leaf since it’s the fractional part of the height.
Direct students to record 8 3 4 on the stem-and-leaf plot in problem 2.
What is the next-tallest height in the table after 8 3 _ 4 inches?
10 1 4 inches
Is 10 1 _ 4 the next number after 8 3 _ 4 when you count by fourths? Why?
No. The next number when counting by fourths would be 9. Then when we keep counting, we would say 9 1 _ 4 , 9 1 _ 2 , 9 3 _ 4 , and 10 before we get to 10 1 _ 4 .
UDL: Action & Expression
Consider providing index cards or sticky notes for students to write individual data values on. The index cards or sticky notes can be manipulated as students work with the data set. Students can use the index cards or sticky notes to order the values in the data set, to track which values they have recorded on the stem-and-leaf plot, or to group values with the same stem.
© Great Minds PBC 28 4 ▸ M6 ▸ TA ▸ Lesson 1 EUREKA MATH2 Florida B.E.S.T. Edition
There is a gap in the data between 8 3 _ 4 and 10 1 _ 4 . When we display data, it’s important to show a complete picture of the data by including all the data values and by showing the gaps between data values.
Invite students to think–pair–share about how to show the gap in the data values between 8 3 4 inches and 10 1 4 inches on the stem-and-leaf plot.
We know the next whole number after 8 3 _ 4 is 9. We can include 9 as a stem on our stem-and-leaf plot. But we’re not sure what we should write for the leaf.
We think we can include 9 as a stem on the stem-and-leaf plot and then not include any leaves for 9. At first, we thought about writing 0 for the leaf, but that would look like there was another sunflower plant.
To represent the gap in the data values between 8 3 _ 4 inches and 10 1 _ 4 inches on the stem-and-leaf plot, we record 9 as a stem and don’t record any leaves.
Direct students to record 9 as a stem on the stem-and-leaf plot. Have students work with a partner to record the heights of the sunflower plants that all have 10 as the whole-number part of the mixed-number measurement.
In what order did you record the leaves for 10? Why?
We recorded 1 _ 4 and 1 _ 2 , and then we recorded 3 _ 4 three times. We know 1 _ 2 is the same amount as 2
, so
is greater than
and less than
.
What is the next height we need to record on the stem-and-leaf plot?
11 inches
How do you think we can represent 11 inches on the stem-and-leaf plot?
The stems are the whole-number parts, and the leaves are the fractional parts. We can record 11 as the stem. I am not sure what we would put for the leaf, but I think we need to record something. If we don’t write anything, it might look like there are no data values of 11.
Direct students to represent the three heights of 11 inches on the stem-and-leaf plot. Have students record 11 for the stem to represent the whole number and 0 three times for the leaves to indicate that there is no fractional part.
Promoting the Mathematical Thinking and Reasoning Standards
Students complete tasks with mathematical fluency (MTR.3) as they create a stem-and-leaf plot of the sunflower plant data.
Ask the following questions to promote MTR.3:
• When you record data values in a stem-and-leaf plot, what do you need to be extra careful with? Why?
• What details are important to think about when recording fractional data values in a stem-and-leaf plot?
© Great Minds PBC 29 EUREKA MATH2 Florida B.E.S.T. Edition 4 ▸ M6 ▸ TA ▸ Lesson 1
4
2
1 4
3 4
1
Invite students to work with a partner to record the remaining heights from the table on the stem-and-leaf plot.
Is your stem-and-leaf plot complete? Why?
No. We need to include a title so people who look at the stem-and-leaf plot know what data are displayed.
No. We need to include a key so people know what numbers the stems and leaves represent.
Invite students to write a title and a key for the stem-and-leaf plot.
What would you say to Adam to explain why a stem-and-leaf plot is a useful way to display the heights of the sunflower plants?
The stem-and-leaf plot organizes the heights from shortest to tallest, so it can be easier to think about the heights of the sunflower plants.
On the stem-and-leaf plot, you can quickly see that there is a gap in the heights of the plants between 8 3 4 inches and 10 1 4 inches. That might be something for Adam to think about more. He can try to figure out why there is one sunflower plant that is so much shorter than the others.
The stem-and-leaf plot organizes the data in a way that helps you ask and answer questions about the heights of the sunflower plants.
Invite students to turn and talk about how they can represent data values with fractional units on a stem-and-leaf plot.
© Great Minds PBC 30 4 ▸ M6 ▸ TA ▸ Lesson 1 EUREKA MATH2 Florida B.E.S.T. Edition
Stem-and-Leaf Plots and Line Plots
Students compare representations of the same data set on a stem-and-leaf plot and on a line plot.
Display the picture of the line plot.
Heights of Sunflower Plants
The line plot shows the heights of the sunflower plants that Adam measures. How is the representation of the data set on the line plot similar to the representation of the same data set on the stem-and-leaf plot?
They both represent all the data values from the table.
They both show the data values in order from the shortest sunflower plant to the tallest sunflower plant.
They both show the gap in the data values. On the line plot, we see that there aren’t any Xs between 8 3 4 and 10 1 4 . On the stem-and-leaf plot, we see the gap represented by the row that has 9 as the stem and no leaves.
© Great Minds PBC 31 EUREKA MATH2 Florida B.E.S.T. Edition 4 ▸ M6 ▸ TA ▸ Lesson 1
0 9 10 × × × × × × × × × × × × × × × × × × 8 3 4 9 1 4 9 1 2 9 3 4 11 10 1 4 10 1 2 10 3 4 12 11 1 4 11 1 2 11 3 4 12 1 2 12 1 4 Height (inches)
How is the representation of the data set on the line plot different from the representation of the same data set on the stem-and-leaf plot?
The line plot uses Xs above each number to represent measurements. On the stem-and-leaf plot, each measurement is represented by a whole-number stem and a fractional leaf. Some measurements have the same stem.
On the line plot, identical data values are represented vertically because the Xs are written above one another. On the stem-and-leaf plot, identical data values are represented horizontally because the leaves are written next to each other.
The stem-and-leaf plot includes a key, but the line plot doesn’t have a key.
What do you think about when creating a scale for a line plot?
I think about the smallest and largest values in the data set because that helps me think about the starting point and ending point on my line plot.
I think about the place value units represented in the data values because that helps me think about the intervals on my line plot.
Invite students to think–pair–share about how the stem-and-leaf plot might be helpful when creating a line plot of the same data set.
We think it would be helpful because we can quickly look at the stem-and-leaf plot to determine what we should use as the starting point and ending point on the line plot.
We think a stem-and-leaf plot would be helpful because the data values are organized from least to greatest, just like on a line plot. When we create a line plot, it would be quicker for us to look at the data values already organized on a stem-and-leaf plot.
We think the stem-and-leaf plot would be helpful because we could just count the number of leaves that represent a value to determine how many Xs we need to draw above that same value on the line plot.
Problem Set
Differentiate the set by selecting problems for students to finish independently within the timeframe. Problems are organized from simple to complex.
© Great Minds PBC 32 4 ▸ M6 ▸ TA ▸ Lesson 1 EUREKA MATH2 Florida B.E.S.T. Edition
Land
Debrief 5 min
Objective: Collect and represent data by using stem-and-leaf plots.
Ask the following questions to facilitate a class discussion about representing data by using stem-and-leaf plots.
How can we organize data on a stem-and-leaf plot?
We can use place value to help us determine the stems and leaves. The smallest place value unit determines the leaves, and then all the other digits in the values can be the stems.
When the data values include mixed numbers, we can organize the data so that the whole numbers are the stems and the fractional units are the leaves. We can include values with the same stems in the same row on a stem-and-leaf plot. Stems and leaves are organized from least to greatest.
When is it useful to display data on a stem-and-leaf plot?
If you want to be able to look at the data and quickly answer questions about that data, a stem-and-leaf plot is helpful.
A stem-and-leaf plot can be helpful when making a line plot. The stem-and-leaf plot can help you think about the starting point and ending point for the line plot.
A stem-and-leaf plot is helpful for finding gaps in data values. When there is a stem but no leaf, that shows that there might be a gap in the data values.
Exit Ticket 5 min
Provide up to 5 minutes for students to complete the Exit Ticket. It is possible to gather formative data even if some students do not complete every problem.
© Great Minds PBC 33 EUREKA MATH2 Florida B.E.S.T. Edition 4 ▸ M6 ▸ TA ▸ Lesson 1
10
Sample Solutions
Expect to see varied solution paths. Accept accurate responses, reasonable explanations, and equivalent answers for all student work.
Wait Times for Roller Coaster (minutes) Name Date
1. The table shows wait times for people who rode a roller coaster at an amusement park.
a. Create a stem-and-leaf plot of the wait times for the people who rode the roller coaster. Include a title and a key.
Stem Leaf 1 5 7 2 1 3 5 6 8 3 0 1 1 3 4 5 4 0 2 Key: 2 3 means 23
b. How many wait times are represented by the data?
c. What is the fewest number of minutes someone waited to ride the roller coaster?
15 minutes
d. How many people waited at least 25 minutes to ride the roller coaster?
11 people
e. How many people waited less than half an hour to ride the roller coaster?
7 people
f. Did you use the table or the stem-and-leaf plot to answer part (d)? Why?
Sample:
I used the stem-and-leaf plot because the data is organized, so it was easier for me to count
how many people waited at least 25 minutes.
2. The table shows the heights of 16 giraffes. Heights of Giraffes (feet)
16 1 2 14 3 4 17 1 2 14 1 4 13 1 2 16 13 3 4 16 1 2 16 1 4 16 3 4 17 17 1 4 14 1 4 14 1 2 17 1 2 16 1 4
4 ▸ M6 ▸ TA ▸ Lesson 1 EUREKA MATH2 Florida B.E.S.T. Edition © Great Minds PBC 6 PROBLEM SET
4 ▸ M6 ▸ TA ▸ Lesson 1 EUREKA MATH2 Florida B.E.S.T. Edition © Great Minds PBC 34
EUREKA MATH2 Florida B.E.S.T. Edition 4 ▸ M6 ▸ TA ▸ Lesson 1 © Great Minds PBC 5 1
Wait Times for Roller Coaster (minutes) 17 23 34 31 40 28 21 31 15 25 42 33 26 30 35
15 wait times
a. Create a stem-and-leaf plot of the heights of the giraffes in feet. Include a title and a key.
of Giraffes (feet)
b. What is the height in feet of the shortest giraffe?
13 1 2 feet
c. How many giraffes are less than 17 feet tall?
12 giraffes
d. How many giraffes are exactly 16 1 2 feet tall?
2 giraffes
EUREKA MATH2 Florida B.E.S.T. Edition 4 ▸ M6 ▸ TA ▸ Lesson 1 © Great Minds PBC 35 EUREKA MATH2 Florida B.E.S.T. Edition 4 ▸ M6 ▸ TA ▸ Lesson 1 © Great Minds PBC 7 PROBLEM SET
Heights
Stem Leaf 13 14 15 16 1 2 3 4 17 1 4 1 4 1 2 3 4 0 1 4 1 4 1 2 1 2 3 4 0 1 4 1 2 1 2 1 4 1 4 Key: 14 means 14
© Great Minds PBC 36 This page may be reproduced for classroom use only. 4 ▸ M6 ▸ TA ▸ Lesson 1 ▸ Raisin Cards EUREKA MATH2 Florida B.E.S.T. Edition
© Great Minds PBC 37 This page may be reproduced for classroom use only. EUREKA MATH2 Florida B.E.S.T. Edition 4 ▸ M6 ▸ TA ▸ Lesson 1 ▸ Raisin Cards
Determine and interpret the mode, median, and range of a given data set.
Lesson at a Glance
Students determine the median of a data set by ordering the data values from least to greatest and then finding the middle value. They answer questions about different data sets represented on stem-and-leaf plots and line plots. Then students discuss the efficiency of answering questions by using data represented on a stem-and-leaf plot and data represented on a line plot. This lesson formalizes the term median.
Key Questions
• How can we determine the median of a data set?
• How can we use data represented on stem-and-leaf plots and line plots to determine the mode, median, and range of a data set?
a. What is the mode? What does the mode tell you about the number of cars that drive over the bridge each day?
The mode is 194 cars. The mode tells me that the most frequent number of cars to drive over the bridge is 194.
b. What is the median? What does the median tell you about the number of cars that drive over the bridge each day?
The median is 202 cars. The median tells me that 202 is in the middle of the ordered numbers of cars that drive over the bridge.
c. What is the range? What does the range tell you about the number of cars that drive over the bridge each day?
The range is 50 cars. The range tells me that the difference between the greatest number of cars that drive over the bridge and the fewest number of cars that drive over the bridge is 50 cars.
Achievement Descriptor
FL.4.Mod6.AD8 Determine the mode, median, or range of a data set. (MA.4.DP.1.2) (MA.4.DP.1.3)
2 © Great Minds PBC LESSON 2
EUREKA MATH2 Florida B.E.S.T. Edition 4 ▸ M6 ▸ TA ▸ Lesson 2 © Great Minds PBC 19 2
Number of Cars That Drive over the Town Bridge Stem Leaf 16 8 1 4 4 4 6 0 7 7 9 17 18 19 2 2 3 5 7 7 9 20 0 6 7 8 21 Key: 19 6 means 196
Miss Wong records the number of cars that drive over the town bridge each day. She creates a stem-and-leaf plot to represent the data.
Name Date
Agenda
Fluency 10 min
Launch 5 min
Learn 35 min
• Determine the Median
• Interpret Data Represented on a Stem-and-Leaf Plot
• Interpret Data Represented on a Line Plot
• Problem Set
Land 10 min
Materials
Teacher
• Race Time Cards (in the teacher edition)
Students
• Least to Greatest Cards (1 set per student pair, in the student book)
Lesson Preparation
• Print or copy Race Time Cards and cut out the cards.
• Consider whether to remove Least to Greatest Cards from the student books and cut out the cards in advance or have students prepare them during the lesson.
© Great Minds PBC 39 EUREKA MATH2 Florida B.E.S.T. Edition 4 ▸ M6 ▸ TA ▸ Lesson 2
Fluency
Choral Response: Convert Kilograms to Grams
Students convert kilograms to grams to build fluency with expressing metric measurements in a larger unit in terms of a smaller unit from module 1.
Display the equation 1 kg = g.
One kilogram is equivalent to how many grams? Raise your hand when you know. Wait until most students raise their hands, and then signal for students to respond.
1,000 g
Display the answer.
Repeat the process with the following sequence:
4 ▸ M6 ▸ TA ▸ Lesson 2 EUREKA MATH2 Florida B.E.S.T. Edition © Great Minds PBC 40
2 kg = g4 kg = g 9 kg 850 g = g3 kg 250 g = g5 kg 50 g = g 4 kg 500 g = g9 kg 800 g = g 2,000 4,000 9,850 3,250 5,050 4,500 9,800 10 1 kg = g 1,000
Sort: Least to Greatest
Materials—S: Least to Greatest Cards
Students order a set of numbers from least to greatest to prepare for finding the median of a data set.
Have students form pairs. Distribute a set of cards to each student pair. Have them order the cards from least to greatest.
Circulate as students work, and provide support as needed.
If time permits, display the following sets of numbers for students to order from least to greatest on their whiteboards.
EUREKA MATH2 Florida B.E.S.T. Edition 4 ▸ M6 ▸ TA ▸ Lesson 2 © Great Minds PBC 41
1 2 1 4 3 4 9 4 1 2 1 1 4 1 2 4 1 3 4
0.13, 2.1, 1.3, 3, 2.01, 0.21 2 , 1 6 1 , 2 3 2, 2 , 1 2 1 , 5 6 2 1 3
Launch
Students discuss how they might determine the middle value in a data set. Present the situation.
Mr. Endo runs 5-kilometer, or 5K, races. In his first race, he finished last in his age group. In his next race, he finished tenth in his age group. For his most recent race, Mr. Endo’s goal was to finish in the exact middle of his age group.
Display the picture of the table.
The table shows the race times of the people in Mr. Endo’s age group in his most recent race. The times are rounded to the nearest minute. The highlighted race time represents how many minutes it took Mr. Endo to finish the race.
Invite students to think–pair–share about how Mr. Endo might determine whether he met his goal.
We think he needs to put all the times in order from least to greatest. Then he can find the time that’s exactly in the middle. He can compare his time to the time in the middle to see if he met his goal.
We think if he plots the times on a line plot, then he can find his time and compare it to the other times to see if his time is in the middle. The line plot will help him see all the times in order from least to greatest.
We think he should create a stem-and-leaf plot of the data because then the times will be in order from least to greatest. Then he can see where his time is compared to the other times.
Let’s think about finding the middle of a data set in a more familiar situation.
4 ▸ M6 ▸ TA ▸ Lesson 2 EUREKA MATH2 Florida B.E.S.T. Edition © Great Minds PBC 42
5 5K Race Times (minutes) 23 31 33 41 30 21 26 36 43 24 27 34 35 27 36
Teacher Note
The familiar context of people in a line helps students think about the middle value in a data set because they can visualize finding the value that is exactly in the middle of the data.
Invite students to work with a partner to determine who is in the middle of the line of students.
Who is in the middle of the line of students? How do you know?
Mia is in the middle. We started at each end of the line with David and Eva, and then we moved to the next pair of students, Jayla and Carla. We kept moving toward the middle of the line until we got to Mia.
The line could start with David, or it could start with Eva. When the line starts with David, is the person in the middle different than when the line starts with Eva? Why?
No. The line can be facing either way and Mia is still the person in the middle because we found pairs of students at each end of the line until we got to the middle student. The pairs won’t change, even if the line faces a different way.
Invite students to turn and talk about how finding the middle student in line can help them think about finding the middle time in the data set of race times.
Transition to the next segment by framing the work.
Today, we will learn how to determine the middle value in a data set, and we will answer questions about data presented in different ways.
EUREKA MATH2 Florida B.E.S.T. Edition 4 ▸ M6 ▸ TA ▸ Lesson 2 © Great Minds PBC 43 Display the picture of the students in line.
David Jayla Gabe James Mia Luke Ray Carla Eva
Learn
Determine the Median
Materials—T: Race Time Cards
Students find the median of the race times data set by ordering the times on the cards from least to greatest.
Display the picture of the table.
Let’s help Mr. Endo determine whether he met his goal of finishing the race in the middle of his age group.
Hold up the Race Time Cards.
Each card represents one of the race times from the table.
Invite 15 students to the front of the room. Distribute one Race Time Card to each student.
Direct the students to stand in a line so that their race times are in order from the shortest time to the longest time. Students with the same race time should stand next to each other so that all students with a Race Time Card are in one line. Have the remaining students in the class verify that the race times are correctly ordered.
Now that the race times are ordered from least to greatest, how can we find the time that is in the middle?
We can make pairs of students by taking a student from each end of the line until we get to the student in the middle. The race time on that student’s card represents the race time in the middle of all the data values.
Let’s pair up students from each end of the line and work our way in to determine the middle race time.
4 ▸ M6 ▸ TA ▸ Lesson 2 EUREKA MATH2 Florida B.E.S.T. Edition © Great Minds PBC 44
35 5K Race Times (minutes) 23 31 33 41 30 21 26 36 43 24 27 34 35 27 36
Have one student on each end of the line leave the line at the same time and return to their seats. Repeat this process until only one student remains in line.
What race time is in the middle of the ordered data set?
31 minutes
31 minutes is the middle value in our data set. We call the middle value of an ordered data set the median.
Did Mr. Endo meet his goal of finishing the race in the middle of his age group? How do you know?
No. His race time is 41 minutes. The middle value, or median, is 31 minutes. It took him longer than the median time to finish the race.
We ordered the race times from the shortest time to the longest time to determine the median. Do you think the median would change if we ordered the race times from the longest time to the shortest time? Why?
No, the median wouldn’t change. It’s like the line of students from earlier. The same student in line was in the middle no matter which student was at the front of the line. So
31 minutes is the median even if the race times are ordered from the longest time to the shortest time.
No, the median wouldn’t change. The students were lined up with the race times from the shortest time to the longest time, but we could have had the students line up from the longest time to the shortest time. The median would still be the same time because the same pairs of students would leave the line and the same student would be left to represent the median.
We can order the data set from the shortest time to the longest time or from the longest time to the shortest time. Either way, the median doesn’t change.
Invite students to turn and talk about how they can determine the median of a data set.
Language Support
Consider showing students a picture of a median on a highway. Discuss that the median runs down the middle of the roads. The familiar context can support the understanding that the median of a data set represents the middle value of the data.

Teacher Note
Students in grade 4 determine the median when a data set has an odd number of values. In grade 5, students learn how to determine the median when a data set has an even number of values.
EUREKA MATH2 Florida B.E.S.T. Edition 4 ▸ M6 ▸ TA ▸ Lesson 2 © Great Minds PBC 45
Interpret Data Represented on a Stem-and-Leaf Plot
Students answer questions about a data set represented on a stem-and-leaf plot. Direct students to problem 1 in their books and chorally read the problem.
1. Amy records the outside temperature at the same time each day for 21 days. She creates a stem-and-leaf plot to represent her data.
Promoting the Mathematical Thinking and Reasoning Standards
As students interpret data on a stem-and-leaf plot, they are actively participating in effortful learning (MTR.1).
Ask the following questions to promote MTR.1:
• What are some strategies you can use to determine the mode, median, and range of the temperature data set?
• Explain your method for determining the median to a partner.
Key: 8 5 means 85
a. How many days had a recorded temperature that was less than 90°F? 10 days
b. What fraction of the days had a recorded temperature of at least 100°F? 3 21
c. What are the modes? What do the modes tell you about the temperatures?
The modes are 87°F, 92°F, 96°F, and 100°F. There are four modes for the data set, and they tell me that 87°F, 92°F, 96°F, and 100°F are the four most frequent temperatures.
d. What is the median? What does the median tell you about the temperatures?
The median is 92°F. It tells me that 92°F is the temperature in the middle of the ordered temperatures.
e. What is the range? What does the range tell you about the temperatures?
The range is 26°F. It tells me that the difference between the hottest temperature and the coldest temperature is 26°F.
4 ▸ M6 ▸ TA ▸ Lesson 2 EUREKA MATH2 Florida B.E.S.T. Edition © Great Minds PBC 46
Temperatures (degrees Fahrenheit) Stem Leaf 7 5 6 8 0 0 1 2 2 4 6 6 7 8 9 0 1 3 4 5 7 7 8 9 10
Direct students to complete part (a). Invite one or two students to share their answers with the class.
How did you determine how many days had a recorded temperature that was less than 90°F?
I counted all the leaves for the stems that represent 7 tens and 8 tens.
Direct students to part (b) and chorally read the problem.
What does at least 100°F mean?
At least 100°F means to count all the days the temperature was 100°F or greater.
Will your answer to part (b) be a whole number? Why?
No. Part (b) asks us to find the fraction of the days that had a temperature of at least 100°F. That means we need to find a fraction of a set.
Invite students to work with a partner to complete part (b).
What fraction of the days had a recorded temperature of at least 100°F?
Direct students to parts (c) through (e). Invite students to whisper-read the problems with a partner.
What information about the data are we finding in parts (c) through (e)?
The mode, median, and range
How can you determine the mode, or the temperature that occurs most frequently?
We can look at the data and see which temperature occurs more often than the other temperatures.
Direct students to look at the stem-and-leaf plot to determine the mode.
What did you notice about the data when you looked at the stem-and-leaf plot to determine the mode?
I noticed most temperatures occur once, but there are four temperatures that each occur twice: 87°F, 92°F, 96°F, and 100°F.
Teacher Note
The fractional units of twenty-firsts and elevenths are used in this lesson to describe a fraction of a set. Students are not expected to perform operations with these fractional units.
Teacher Note
The terms mode and range were formalized in module 4 lesson 29. Students learned that the data value that occurs most frequently is called the mode and the difference between the largest data value and the smallest data value is called the range. In this lesson, students learn that there can be more than one mode or no mode in a data set.
EUREKA MATH2 Florida B.E.S.T. Edition 4 ▸ M6 ▸ TA ▸ Lesson 2 © Great Minds PBC 47
3 __ 21
A data set can have one mode, more than one mode, or no mode. You determined that Amy’s data has four modes: 87°F, 92°F, 96°F, and 100°F.
What do the modes tell us about the data?
The modes tell us that the four temperatures that occurred the most during the days that Amy collected data are 87°F, 92°F, 96°F, and 100°F.
Invite students to turn and talk about how to determine the mode when there is more than one data value that occurs most frequently.
Direct students to record the answer to part (c).
Invite students to work with a partner to complete parts (d) and (e). Invite one or two pairs to share their answers with the class.
How did you use the stem-and-leaf plot to determine the median?
Since the data set is organized from least to greatest, we lightly crossed off pairs of temperatures, starting with the lowest temperature and the highest temperature. We continued crossing off pairs of low and high temperatures until we found the median temperature, 92°F.
What does the median tell us about the temperatures?
We can see that there are the same number of temperatures on either side of the median. The median is in the middle.
The median tells us that the temperature in the middle of the ordered data is 92°F.
How did you use the stem-and-leaf plot to determine the range?
We found the lowest temperature and the highest temperature. Then we subtracted the lowest temperature from the highest temperature to determine the range, 26°F.
What does the range tell us about the data?
The range tells us the difference between the hottest and coldest temperatures. During the 21 days that Amy collected data, the range of the temperatures was 26°F.
Invite students to turn and talk about how they can use a stem-and-leaf plot to answer questions about the data.
UDL: Representation
Consider annotating the stem-and-leaf plot to label examples of median, mode, and range. Students can reference the annotated stem-and-leaf plot as needed throughout the lesson.
4 ▸ M6 ▸ TA ▸ Lesson 2 EUREKA MATH2 Florida B.E.S.T. Edition © Great Minds PBC 48
Temperatures (degrees Fahrenheit) Stem Leaf 7 5 6 8 0 0 1 2 2 4 6 6 7 8 9 0 1 3 4 5 7 7 8 9 10 Key: 8 5 means 85
Interpret Data Represented on a Line Plot
Students answer questions about a data set represented on a line plot. Direct students to problem 2 and chorally read the problem.
2. The line plot shows the arm spans of some professional basketball players.
Arm Spans of Basketball Players
Differentiation: Support
Consider using the following prompts to support students as they use the stem-and-leaf plot to determine the median.
• What is the lowest temperature? The highest temperature? (Prompt students to lightly cross off the lowest and highest temperatures on the stem-and-leaf plot.)
• What is the next lowest temperature? The next highest temperature? (Prompt students to lightly cross off the next lowest and next highest temperatures on the stem-and-leaf plot and to repeat this process until only one temperature is not crossed off.)
a. How many players have an arm span that is at most 6 3 4 feet? 6 players
b. What fraction of the players have an arm span that is longer than 7 feet? 2 11
c. What is the mode? What does the mode tell you about the arm spans of the basketball players?
The modes are 6 3 4 feet and 7 feet. There are two modes for the data, and they tell me that 6 3 4 feet and 7 feet are the two most frequent arm spans.
d. What is the median? What does the median tell you about the arm spans of the basketball players?
The median is 6 3 4 feet. It tells me that 6 3 4 feet is the arm span that is in the middle of all the ordered arm spans.
• What do you notice? What does the temperature that is not crossed off represent?
UDL: Representation
Consider demonstrating or showing an image of how arm span is measured to support the context of the arm span line plot. Explain that arm span is measured from fingertip to fingertip when a person’s arms are fully extended.
EUREKA MATH2 Florida B.E.S.T. Edition 4 ▸ M6 ▸ TA ▸ Lesson 2 © Great Minds PBC 49
0 6 7 8 × × × × × × × × × × × 6 1 4 7 1 4 7 1 2 7 3 4 6 1 2 6 3 4 Length (feet)
e. What is the range? What does the range tell you about the arm spans of the basketball players?
The range is 1 1 4 feet. It tells me the difference between the longest arm span and the shortest arm span is 1 1 4 feet.
Invite students to work with a partner to complete parts (a) through (e). Circulate as students work, and ask the following questions as needed to advance student thinking.
• What does each X on the line plot represent?
• What does at most mean? Where can you look on the line plot to find the number of players who have an arm span that is at most 6 3 _ 4 feet?
• Do you see the mode on the line plot? Where?
• What does the mode tell you about the arm spans of the basketball players?
• Can you use the line plot to help you find the median? How?
• What does the median tell you about the arm spans of the basketball players?
• Can you find the shortest arm span and longest arm span on the line plot? How does that help you find the range?
• What does the range tell you about the arm spans of the basketball players?
Have one or two pairs share their answers to parts (a) through (e) with the class. Invite students to turn and talk about how they can use a line plot to answer questions about the data set.
Differentiation: Challenge
Consider presenting problems that involve converting feet to inches or inches to feet. For example, students can convert 1 2 foot to inches or 4 inches to feet to solve the following problem.
The difference between a player’s arm span and their height is 4 inches. The player is 6 1 2 feet tall. Can you represent the player’s arm span on this line plot? Why?
4 ▸ M6 ▸ TA ▸ Lesson 2 EUREKA MATH2 Florida B.E.S.T. Edition © Great Minds PBC 50
Display the pictures of the stem-and-leaf plot and the line plot.
You found the mode, median, and range of a data set represented on a stem-and-leaf plot and a data set represented on a line plot. Do you think one representation is more helpful than the other when finding the mode, median, or range? Why?
I think either representation is helpful when finding the range. Since the data is ordered in both the stem-and-leaf plot and the line plot, it’s easy for me to find the smallest and greatest values in the data. Then I can subtract to determine the range.
I think the line plot is more helpful when finding the mode. You can quickly look at the line plot and find the value or values with the greatest number of Xs. On the stem-and-leaf plot, you have to look carefully at all the data values to find the mode.
I think the stem-and-leaf plot is more helpful when finding the median. It’s easier for me to find the value in the data set that is in the middle when there are digits instead of Xs.
I think the line plot is more helpful to find the median. I can cross off pairs of Xs on opposite ends of the line plot until one X is left, which represents the median.
Invite students to turn and talk about how they can use a stem-and-leaf plot or a line plot to find the mode, median, and range of a data set.
Problem Set
Differentiate the set by selecting problems for students to finish independently within the timeframe. Problems are organized from simple to complex.
EUREKA MATH2 Florida B.E.S.T. Edition 4 ▸ M6 ▸ TA ▸ Lesson 2 © Great Minds PBC 51
Temperatures (degrees Fahrenheit) Stem Leaf 7 5 6 8 0 0 1 2 2 4 6 6 7 8 9 0 1 3 4 5 7 7 8 9 10 Key: 8 5 means 85 0 6 7 8 × × × × × × × × × × × 6 1 4 7 1 4 7 1 2 7 3 4 6 1 2 6 3 4 Length (feet) Arm
Basketball Players
Spans of
Land
Debrief 5 min
Objective: Determine and interpret the mode, median, and range of a given data set.
Ask the following questions to facilitate a class discussion about finding the median, mode, and range of a data set represented on a stem-and-leaf plot or a line plot.
How can we determine the median of a data set?
We can order the data values from least to greatest. Then we can pair numbers from each end of the list of numbers until just the middle number remains. The middle number represents the median of the data set.
How can we use data represented on stem-and-leaf plots and line plots to determine the mode, median, and range of a data set?
On a line plot, we can determine the mode by finding the value or values with the greatest number of Xs. On a stem-and-leaf plot, we can look at each stem and find leaves that are the same to help determine the mode.
On a stem-and-leaf plot, the values are ordered from least to greatest, so we can find the median by crossing off pairs of numbers until just the number in the middle is left. On a line plot, we can find the median by crossing off a pair of Xs—one X from each end of the line plot. When only one X is left, that X represents the median. On the stem-and-leaf plot and the line plot, we can find the smallest value and the greatest value in the data. Then we can subtract to determine the range.
Exit Ticket 5 min
Provide up to 5 minutes for students to complete the Exit Ticket. It is possible to gather formative data even if some students do not complete every problem.
4 ▸ M6 ▸ TA ▸ Lesson 2 EUREKA MATH2 Florida B.E.S.T. Edition © Great Minds PBC 52
10
Sample Solutions
Expect to see varied solution paths. Accept accurate responses, reasonable explanations, and equivalent answers for all student work.
d. What is the median? What does the median tell you about the number of books checked out of the library each day?
1. Mrs. Smith records how many books are checked out of the town library each day. She creates a stem-and-leaf plot to represent the data.
Books Checked Out of Town Library
24
Key: 21 2 means 212
a. Each day, Mrs. Smith’s goal is for at least 215 books to be checked out of the town library. How many days does Mrs. Smith meet her goal? 10 days
b. What fraction of days are more than 220 books checked out of the library? 9 15
c. What are the modes? What do the modes tell you about the number of books checked out of the library each day?
The modes are 212 books and 227 books. That tells me that the two most frequent number of books checked out of the library are 212 and 227
The median is 223 books. That tells me 223 is in the middle of the ordered numbers of books checked out of the library.
e. What is the range? What does the range tell you about the number of books checked out of the library each day?
The range is 48 books. That tells me that the difference between the greatest number of books checked out of the library and the fewest number of books checked out of the library is 48 books.
2. Ray weighs each bag of apples he sells at his fruit stand. He creates a line plot to represent his data.
a. A sign at Ray’s fruit stand says that the apples are sold in 5-pound bags. What fraction of the bags of apples that Ray sells weigh exactly 5 pounds?
EUREKA MATH2 Florida B.E.S.T. Edition 4 ▸ M6 ▸ TA ▸ Lesson 2 © Great Minds PBC 53
4 ▸ M6 ▸ TA ▸ Lesson 2 EUREKA MATH2 Florida B.E.S.T. Edition © Great Minds PBC 16 PROBLEM SET
0 5 × × × × × × × × × × × × × 4 6 8 4 7 8 5 1 8 5 2 8 5 3 8 5 4 8 5 5 8 Weight (pounds)
of Bags of Apples
Weights
2 13 EUREKA MATH2 Florida B.E.S.T. Edition 4 ▸ M6 ▸ TA ▸ Lesson 2 © Great Minds PBC 15 2
Stem Leaf 19 2 7 1 3 4 7 7 9 0 2 2 6 20 21 22 4 5
0
23
Name Date
b. Miss Diaz weighs the bag of apples she buys. She says, “My bag of apples weighs 5 1 4 pounds.” Where is Miss Diaz’s bag of apples represented on the line plot? How do you know?
Miss Diaz’s bag of apples is represented by one of the Xs above 5 2 8. I know because 5 1 4 = 5 2 8 .
c. What is the mode? What does the mode tell you about the weights of the bags of apples?
The mode is 5 1 8 pounds. That tells me that the most frequent weight of the bags of apples is 5 1 8 pounds.
d. What is the median? What does the median tell you about the weights of the bags of apples? The median is 5 1 8 pounds. That tells me that 5 1 8 pounds is the weight that is in the middle of the ordered weights.
e. What is the range? What does the range tell you about the weights of the bags of apples? The range is 7 8 pounds. That tells me the difference between the heaviest bag of apples and the lightest bag of apples is 7 8 pounds.
4 ▸ M6 ▸ TA ▸ Lesson 2 EUREKA MATH2 Florida B.E.S.T. Edition © Great Minds PBC 54 EUREKA MATH2 Florida B.E.S.T. Edition 4 ▸ M6 ▸ TA ▸ Lesson 2 © Great Minds PBC 17 PROBLEM SET
© Great Minds PBC 55 This page may be reproduced for classroom use only. EUREKA MATH2 Florida B.E.S.T. Edition 4 ▸ M6 ▸ TA ▸ Lesson 2 ▸ Race Time Cards 23 31 33 41
© Great Minds PBC 56 This page may be reproduced for classroom use only. 4 ▸ M6 ▸ TA ▸ Lesson 2 ▸ Race Time Cards EUREKA MATH2 Florida B.E.S.T. Edition 30 21 26 36
© Great Minds PBC 57 This page may be reproduced for classroom use only. EUREKA MATH2 Florida B.E.S.T. Edition 4 ▸ M6 ▸ TA ▸ Lesson 2 ▸ Race Time Cards 43 24 27 34
© Great Minds PBC 58 This page may be reproduced for classroom use only. 4 ▸ M6 ▸ TA ▸ Lesson 2 ▸ Race Time Cards EUREKA MATH2 Florida B.E.S.T. Edition 35 27 36
3 © Great Minds PBC LESSON 3 Measure length to the nearest eighth inch and sixteenth inch. EUREKA MATH2 Florida B.E.S.T. Edition 4 ▸ M6 ▸ TA ▸ Lesson 3 © Great Minds PBC 31 3 Use a ruler to measure the length of each object to the nearest eighth inch. 1. Length: 4 1 8 inches 2. Length: 3 5 8 inches Name Date 4 ▸ M6 ▸ TA ▸ Lesson 3 EUREKA MATH2 Florida B.E.S.T. Edition © Great Minds PBC 32 EXIT TICKET Use a ruler to measure the length of each object to the nearest sixteenth inch. 3. Length: 5 3 16 inches 4. Length: 4 7 16 inches
Lesson at a Glance
Students draw to partition quarter inches into eighths and sixteenths. Students label eighths and sixteenths on a ruler by using what they know about equivalent fractions. Students use a ruler to measure lengths to the nearest eighth inch and sixteenth inch. Then they compare lengths of the same object measured to the nearest eighth inch and to the nearest sixteenth inch.
Key Questions
• How can we use a ruler to measure length to the nearest eighth inch or sixteenth inch?
• When do we use smaller units to describe the length of an object?
Achievement Descriptor
FL.4.Mod6.AD1 Measure the length of an object by using a ruler. (MA.4.M.1.1)
Agenda
Fluency 10 min
Launch 5 min
Learn 35 min
• Eighths and Sixteenths on a Ruler
• Measure to the Nearest Eighth Inch
• Measure to the Nearest Sixteenth Inch
• Problem Set
Land 10 min
Materials
Teacher
• Jayla’s Shells (in the teacher edition)
Students
• Jayla’s Shells (in the student book)
• Ruler
Lesson Preparation
Consider whether to remove Jayla’s Shells from the student books in advance of the lesson or to have students remove it during the lesson.
© Great Minds PBC 61 EUREKA MATH2 Florida B.E.S.T. Edition 4 ▸ M6 ▸ TA ▸ Lesson 3
Fluency
Choral Response: Convert Kilometers to Meters
Students convert kilometers to meters to build fluency with expressing metric measurements in a larger unit in terms of a smaller unit from module 1.
Display the equation 1 km = m.
One kilometer is equivalent to how many meters? Raise your hand when you know.
Wait until most students raise their hands, and then signal for students to respond.
1,000 m
Display the answer.
Repeat the process with the following sequence:
© Great Minds PBC 62 4 ▸ M6 ▸ TA ▸ Lesson 3 EUREKA MATH2 Florida B.E.S.T. Edition
2 km = m6 km = m 9 km 950 m = m3 km 450 m = m2 km 50 m = m 6 km 500 m = m9 km 900 m = m 2,000 6,000 9,950 3,450 2,050 6,500 9,900 10 1 km = m 1,000
Counting on the Ruler by Eighths of an Inch
Students count by eighths of an inch and rename eighths as larger units to prepare for measuring objects and collecting data.
Display the segment of the inch ruler.
What is the smallest fractional unit shown on the ruler? Whisper your idea to your partner.
Eighths
Use the ruler to count by eighths to 2 inches. Use whole numbers or mixed numbers when possible. The first number you say is 0 inches. Ready?
Display the arrow moving from one tick mark on the ruler to the next, guiding students to count.
0 inches, 1 _ 8 inch, … , 1 7 _ 8 inches, 2 inches
Count by eighths to 2 inches again. This time also rename the eighths as fourths when possible. The first number you say is 0 inches. Ready?
Display the arrow moving from one tick mark on the ruler to the next, guiding students to count.
_
Count by eighths to 2 inches one more time. This time also rename the eighths as fourths or halves when possible. The first number you say is 0 inches. Ready?
Display the arrow moving from one tick mark on the ruler to the next, guiding students to count.
0 inches, 1 _ 8 inch, 1 _ 4 inch, 3 _ 8 inches, 1 2 inch, … , 1 3 4 inches, 1 7 8 inches, 2 inches
© Great Minds PBC 63 EUREKA MATH2 Florida B.E.S.T. Edition 4 ▸ M6 ▸ TA ▸ Lesson 3
2
4 inches, … , 1 3 _ 4 inches, 1 7 _ 8 inches, 2 inches
0 inches, 1
8 inch, 1 _ 4 inch, 3 _ 8 inches,
_
1 2 in 1 2 in 7 18 3 4 1 5 18 1 12 3 8 1 1 14 1 8 1 1 3 4 1 2 3 8 1 4 0 7 8 5 8 1 8
Launch
Students discuss precisely measuring lengths by using fractional units of an inch.
Display the picture of the ruler. What do you notice about the ruler?
It measures in inches. It is a 6-inch ruler.
I see tick marks that represent half inches.
I see tick marks that represent quarter inches.
I see other tick marks between the quarter-inch marks.
Display the picture of the shell and ruler.
Jayla collects shells at the beach. Her favorite shell is shown. Jayla uses a ruler to measure the length of her favorite shell.
What is the length of the shell to the nearest half inch? How do you know?
The length is 2 1 2 inches. We can see the shell ends right before the half-inch mark between 2 and 3 inches. Because it’s closer to 2 1 2 than 2, the length of the shell to the nearest half inch is 2 1 2 inches.
Teacher Note
This lesson provides students with an opportunity to measure lengths in inches to the nearest eighth and to the nearest sixteenth. These skills are used again in lesson 4 when students collect data by measuring to the nearest eighth inch and to the nearest sixteenth inch. In lesson 4, students also represent their data on a line plot and answer questions about the data.
© Great Minds PBC 64 4 ▸ M6 ▸ TA ▸ Lesson 3 EUREKA MATH2 Florida B.E.S.T. Edition
5 1 2 3 4 5 6 0
1 2 3 4 5 6 0
What is the length of the shell to the nearest quarter inch? How do you know?
The length is 2 1 2 inches. We can see the end of the shell is between the quarter-inch marks that represent 2 1 4 inches and 2 1 2 inches. Because it’s closer to 2 1 2 than 2 1 4 , the length of the shell to the nearest quarter inch is 2 1 _ 2 inches.
Invite students to turn and talk about why the same measurement, 2 1 _ 2 inches, expresses the length of the shell to the nearest half inch and to the nearest quarter inch.
Jayla notices that the length of the shell is closest to the tick mark right before the 2 1 _ 2 inch mark. Do you think we can record the length of the shell more precisely than to the nearest quarter inch? Why?
Yes. When I look at the tick marks that represent quarter inches, I can see more tick marks between the quarter inches. That must mean that there are smaller units represented on the ruler and that the length of Jayla’s shell can be represented by a unit smaller than a quarter inch.
Transition to the next segment by framing the work.
Today, we will use what we know about fractions to measure the length of objects with more precision.
Language Support
Consider using age as an example to support the meaning of more precise when referring to length measurements. For example, you can say that a student is 9 years old. To be more precise, you can say that the student is 9 years and 3 months old. To be even more precise, you can say that the student is 9 years, 3 months, and 2 days old.
© Great Minds PBC 65 EUREKA MATH2 Florida B.E.S.T. Edition 4 ▸ M6 ▸ TA ▸ Lesson 3
Learn
35 Teacher Note
Eighths and Sixteenths on a Ruler
Students partition familiar fractional parts of an inch on a ruler to represent eighths and sixteenths.
Direct students to problem 1 in their books. Chorally read the problem with the class.
1. Use the picture of the ruler to complete parts (a) through (e).
Students create rulers with half-inch and quarter-inch marks in grade 3. They iterate a physical unit by using the mark-and-moveforward technique to draw the tick marks that represent half inches. Then students estimate to draw tick marks to represent quarter inches. Students use their rulers to measure the lengths of objects to the nearest half inch and quarter inch.
a. Label the tick marks between 0 inches and 1 inch.
b. Draw tick marks to partition each quarter inch into two equal parts.
c. Label the new tick marks on the ruler.
d. Draw tick marks to partition each eighth inch into two equal parts.
e. Label the new tick marks on the ruler.
UDL: Representation
Consider having students draw a number line to represent the ruler from 0 inches to 1 inch. Invite them to partition the interval from 0 to 1 into fourths, then eighths, and then sixteenths. Direct students to label the fractions on the number line and to put equivalent fractions above the number line. Facilitate a discussion about the connections they see between the number line and the ruler.
© Great Minds PBC 66 4 ▸ M6 ▸ TA ▸ Lesson 3 EUREKA MATH2 Florida B.E.S.T. Edition
1 2 3 4 5 6 0 Inch 1 0 Inch 1 16 1 8 2 8 4 8 6 8 8 8 1 4 1 2 3 8 5 8 3 4 7 8 3 16 2 16 4 16 8 16 12 16 16 16 6 16 10 16 14 16 5 16 7 16 9 16 11 16 13 16 15 16
1 4 3 8 1 2 5 8 3 4 7 8 1 8 0 1 0 8 0 1 6 2 8 4 1 6 4 8 8 1 6 6 8 12 1 6 8 8 1 6 1 6 2 1 6 6 1 6 10 16 14 16 7 16 5 16 3 16 1 16 13 16 11 16 9 16 15 16
What do the tick marks between 0 inches and 1 inch represent? How do you know?
The tick marks represent quarter inches because 1 inch is partitioned into 4 equal parts. Invite students to complete part (a).
Read the fractions you labeled on the ruler.
Why is one of the fractions expressed as 1 _ 2 when the tick marks represent quarter inches?
The tick mark that we labeled as 1 _ 2 also represents 2 _ 4 . The fractions are equivalent, and we can express the measurement by using the larger unit.
Invite students to read part (b) with a partner.
How can you partition each quarter inch into two equal parts?
We can estimate to draw a line halfway between each pair of quarter-inch marks.
Direct students to complete part (b).
What fractional unit do the tick marks that you drew represent? How do you know?
The tick marks represent eighths. I know because now there are eight equal parts between 0 and 1.
The tick marks represent eighths. I know because we started with fourths, and then we partitioned each fourth into two equal parts. We doubled the number of fractional units between 0 inches and 1 inch from 4 to 8, which makes the fractional unit eighths.
Direct students to complete part (c). Have students record equivalent fractions above the ruler. For example, students can record 2 _ 8 above the tick mark that represents 1 _ 4 .
Read the numbers on the ruler that label the tick marks.
and
inch
Why are fourths, halves, and a whole number in your list of numbers?
The list includes numbers that were already labeled on the ruler that are equivalent to eighths. We know
, and
.
Teacher Note
Throughout the lesson, measurements to the nearest half inch, quarter inch, eighth inch, and sixteenth inch are expressed by using larger units when possible. Measurements expressed by using smaller units are also acceptable.
© Great Minds PBC 67 EUREKA MATH2 Florida B.E.S.T. Edition 4 ▸ M6 ▸ TA ▸ Lesson 3
1 _ 4 , 1 _ 2 , 3 _ 4
1 8 , 1 4 , 3 8 , 1 2 , 5 8 , 3 4 , 7 8
1
2 8
1 4 , 4 8
1 2 , 6 8 = 3 4
8 8
1
=
=
=
Use a similar process to guide students as they partition and label sixteenths on the ruler to complete parts (d) and (e).
Invite students to turn and talk about how eighth inches and sixteenth inches are represented on a ruler.
Measure to the Nearest Eighth Inch
Materials—S: Jayla’s Shells, ruler
Students measure the lengths of pictures of shells to the nearest eighth inch. Display the picture of the line segment and ruler.
Differentiation: Support
Consider displaying a picture of the line segment and a ruler that only has eighth-inch tick marks. This display can support students as they determine the length of the line segment to the nearest eighth inch.
How many whole inches long is the line segment?
2 inches
How many eighth inches longer than 2 inches is the line segment? How do you know?
The line segment is 1 _ 8 inch longer than 2 inches. When I look at the tick marks that represent eighths, the end of the line segment is closest to the tick mark that is 1 _ 8 inch longer than 2 inches.
What is the length of the line segment to the nearest eighth inch?
2 1 8 inches
© Great Minds PBC 68 4 ▸ M6 ▸ TA ▸ Lesson 3 EUREKA MATH2 Florida B.E.S.T. Edition
1 2 3 4 5 6 0
1 2 3 4 5 6 0
Direct students to problem 2 and to Jayla’s Shells. Chorally read problem 2 with the class.
2. Measure and record the lengths of Jayla’s shells to the nearest eighth inch.
Invite students to work with a partner to measure Jayla’s shells to the nearest eighth inch and to record the measurements in the table in problem 2.
Gather the class and use the following questions to facilitate a discussion about the lengths of Jayla’s shells.
What did you record for the length of shell B?
2 inches
2 1 _ 8 inches
UDL: Engagement
Consider inviting students to find objects around the room to measure instead of measuring the pictures of Jayla’s shells. Students should measure their chosen objects to the nearest eighth inch and to the nearest sixteenth inch.
© Great Minds PBC 69 EUREKA MATH2 Florida B.E.S.T. Edition 4 ▸ M6 ▸ TA ▸ Lesson 3
Shell Length (inches) A 3 1 8 B 2 C 2 7 8 D 2 1 2 E 3 1 8 F 2 5 8 G 2 3 8 H 3 1 4
2 inches and 2 1 _ 8 inches can both express the length of shell B to the nearest eighth inch. How is that possible?
The end of shell B is in the middle of two tick marks that each represent an eighth inch. Since it isn’t closer to either tick mark, we can say the length of the shell to the nearest eighth inch is 2 inches or 2 1 8 inches.
Did you use units other than eighths to record the lengths of the shells? Why?
Yes. We used halves for the length of shell D. We know 4 _ 8 is equivalent to 1 _ 2 .
Yes. We used fourths for the length of shell H. We know 2 8 is equivalent to 1 4 . Invite students to turn and talk about how they can use a ruler to measure length to the nearest eighth inch.
Measure to the Nearest Sixteenth Inch
Materials—S: Jayla’s Shells, ruler
Students measure the lengths of pictures of shells to the nearest sixteenth inch.
Display the picture of the line segment and ruler.
UDL: Representation
Consider displaying a picture that shows the end of the line segment and the section of the ruler from 2 inches to 2 3 16 inches. Label the tick mark that represents 1 8 inch.
Earlier, we measured the length of a line segment. We said the length of that line segment to the nearest eighth inch is 2 1 _ 8 inches. How can we measure the length of the same line segment to the nearest sixteenth inch?
We need to look closely at the end of the line segment and find the nearest tick mark that represents sixteenths on the ruler.
We know 1 _ 8 is equivalent to 2 __ 16 , so the length of the line segment to the nearest sixteenth inch might also be 2 1 8 .
Which lengths, to the nearest sixteenth inch, is the line segment close to?
2 1 16 inches
© Great Minds PBC 70 4 ▸ M6 ▸ TA ▸ Lesson 3 EUREKA MATH2 Florida B.E.S.T. Edition
1 2 3 4 5 6 0
1 2 3 4 5 6 0 2 3 1 8
2 1 8 inches
2 3 16 inches
Which length, to the nearest sixteenth inch, is the line segment closest to?
2 1 8 inches
What is the length of the line segment to the nearest sixteenth inch?
2 1 8 inches
Direct students to problem 3 and chorally read it with the class.
3. Measure and record the lengths of Jayla’s shells to the nearest sixteenth inch.
© Great Minds PBC 71 EUREKA MATH2 Florida B.E.S.T. Edition 4 ▸ M6 ▸ TA ▸ Lesson 3
Shell Length (inches) A 3 1 8 B 2 1 16 C 2 7 8 D 2 1 2 E 3 3 16 F 2 5 8 G 2 7 16 H 3 1 4
Invite students to work with a partner to measure Jayla’s shells to the nearest sixteenth inch and to record the measurements in the table in problem 3. Gather the class and use the following questions to facilitate a discussion about the lengths of Jayla’s shells.
Look at the tables in problems 2 and 3. Compare the lengths of the shells to the nearest eighth inch to the lengths of the shells to the nearest sixteenth inch. What do you notice?
Some of the lengths are expressed the same way in both tables. When we measure to the nearest eighth inch, we can use fourths, halves, and eighths to record the lengths. We use those same units when we measure to the nearest sixteenth inch, and we can also use sixteenths.
We used sixteenths in only three of the measurements in problem 3 because we can use equivalent fractions when recording lengths, so we can express all the other lengths by using larger fractional units.
Which shells have the same length measurement to the nearest eighth inch as they do to the nearest sixteenth inch?
Shells A, C, D, F, and H
Which shells have different length measurements to the nearest eighth inch than they do to the nearest sixteenth inch?
Shells B, E, and G
Invite students to think–pair–share about why the measurements are sometimes the same and sometimes different when measuring the length of an object to the nearest eighth inch and to the nearest sixteenth inch.
When the length of an object is measured to the nearest eighth inch, we can use the units of halves, fourths, or eighths to record the length. When the length of the same object is measured to the nearest sixteenth inch and it also lines up with an eighth mark, we can also use the units of halves, fourths, or eighths because those units can be renamed as sixteenths.
The length measurements of shells B, E, and G are different when we measure to the nearest sixteenth inch than when we measure to the nearest eighth inch because the length of each shell is between two eighth marks and lines up with a sixteenth mark.
Differentiation: Challenge
Consider inviting students to answer questions about their measurements. Pose questions such as the following:
• What is the difference between the length of the longest shell and length of the shortest shell?
• How many eighth inches longer is shell H than shell A?
• How many sixteenth inches shorter is shell A than shell E?
Promoting the Mathematical Thinking and Reasoning Standards
As students think–pair–share about why the measurements are sometimes the same and sometimes different when measuring the length of an object to the nearest eighth inch and to the nearest sixteenth inch, they are engaging in discussions that reflect on their mathematical thinking (MTR.4).
Ask the following questions to promote MTR.4:
• What details are important to think about when measuring to the nearest eighth inch or to the nearest sixteenth inch?
• What question can you ask your partner to make sure you understand their explanation?
© Great Minds PBC 72 4 ▸ M6 ▸ TA ▸ Lesson 3 EUREKA MATH2 Florida B.E.S.T. Edition
Sometimes the length of an object is expressed in the same way when measuring to different units because the length lines up with a mark on the ruler that can be expressed in more than one way. Sometimes the length is expressed in a different way because the smaller unit gives a more precise measurement.
When measuring an object to the nearest eighth inch, the length measurement might be the same as when the object is measured to the nearest sixteenth inch because of what we know about equivalent fractions.
Invite students to turn and talk about how they can use a ruler to measure length to the nearest sixteenth inch.
Problem Set
Differentiate the set by selecting problems for students to finish independently within the timeframe. Problems are organized from simple to complex.
Land
Debrief 5 min
Objective: Measure length to the nearest eighth inch and sixteenth inch. Use the following questions to facilitate a class discussion about measuring length to the nearest eighth inch and sixteenth inch.
© Great Minds PBC 73 EUREKA MATH2 Florida B.E.S.T. Edition 4 ▸ M6 ▸ TA ▸ Lesson 3
10
Display the picture of the shell and ruler.
Earlier, we recorded the length of Jayla’s favorite shell to the nearest quarter inch. Can we record the length of Jayla’s shell more precisely than to the nearest quarter inch? Explain your reasoning.
Yes, now we know the tick marks between the quarter inch marks represent eighths and sixteenths.
Yes, the length of Jayla’s favorite shell can be recorded to the nearest sixteenth inch because the tick mark that is closest to the end of the shell represents a sixteenth inch.
How can we use a ruler to measure length to the nearest eighth inch or sixteenth inch?
We can line one end of the object up with the 0 mark and then find the tick mark that is closest to the other end of the object. We know that fourths on the ruler are partitioned into eighths and that eighths are partitioned into sixteenths. We can use what we know about fractions to record the length to the nearest eighth inch or sixteenth inch.
When we measure length to the nearest eighth inch, we look at the tick marks that represent eighths. We find the eighth inch that is closest to the end of the object. We can use the same process when we measure to the nearest sixteenth inch.
When do we use smaller units to describe the length of an object?
We use smaller units when we want to describe the measurement of an object more precisely. For example, we use smaller units when we need a measurement that is more exact than to the nearest whole number.
When the length of an object is between two larger units, a smaller unit can be used to describe a more precise length. For example, when we measured Jayla’s favorite shell to the nearest quarter inch, we saw that the length of the shell was between two quarter-inch measurements. We can use smaller units to find a more precise measure of the length of the shell.
© Great Minds PBC 74 4 ▸ M6 ▸ TA ▸ Lesson 3 EUREKA MATH2 Florida B.E.S.T. Edition
1 2 3 4 5 6 0
Exit Ticket 5 min
Provide up to 5 minutes for students to complete the Exit Ticket. It is possible to gather formative data even if some students do not complete every problem.
© Great Minds PBC 75 EUREKA MATH2 Florida B.E.S.T. Edition 4 ▸ M6 ▸ TA ▸ Lesson 3
Sample Solutions
Expect to see varied solution paths. Accept accurate responses, reasonable explanations, and equivalent answers for all student work.
4 ▸ M6 ▸ TA ▸ Lesson 3 EUREKA MATH2 Florida B.E.S.T. Edition © Great Minds PBC 76
EUREKA MATH2 Florida B.E.S.T. Edition 4 ▸ M6 ▸ TA ▸ Lesson 3 © Great Minds PBC 27 3 1. Label the unknown fractions of an inch on the ruler. 1 2 3 4 5 6 0 Inch 1 0 Inch 13 16 5 8 1 2 5 16 1 4 1 8 1 16 3 16 7 16 3 8 9 16 11 16 15 16 3 4 7 8 Use a ruler to measure the length of each object to the nearest eighth inch. 2. Length: 5 3 8 inches Name Date 4 ▸ M6 ▸ TA ▸ Lesson 3 EUREKA MATH2 Florida B.E.S.T. Edition © Great Minds PBC 28 PROBLEM SET 3. Length: 1 7 8 inches 4. Length: 3 1 4 inches Use a ruler to measure the length of each object to the nearest sixteenth inch. 5. Length: 5 9 16 inches 6. Length: 2 3 8 inches
Zara says, “The length of the marker to the nearest eighth inch is 5 3 8 inches.”
Luke says, “The length of the marker to the nearest sixteenth inch is 5 3 8 inches.”
Who is correct? Why?
They are both correct. The end of the marker is closest to the tick mark that represents 5 3 8 inches, so the length of the marker to the nearest eighth inch can be expressed as 5 3 8 inches. 6 16 and 3 8 are equivalent fractions, so the length of the marker to the nearest sixteenth inch can also be recorded in eighths.
EUREKA MATH2 Florida B.E.S.T. Edition 4 ▸ M6 ▸ TA ▸ Lesson 3 © Great Minds PBC 77 EUREKA MATH2 Florida B.E.S.T. Edition 4 ▸ M6 ▸ TA ▸ Lesson 3 © Great Minds PBC 29 PROBLEM SET
7. Length: 6 5 16 inches
1 2 3 4 5 6 0 Inch
8. Zara and Luke each measure the length of the marker shown.
© Great Minds PBC 78 This page may be reproduced for classroom use only. 4 ▸ M6 ▸ TA ▸ Lesson 3 ▸ Jayla’s Shells EUREKA MATH2 Florida B.E.S.T. Edition A. B. C.
E.
G.
D.
F.
H.
Collect, represent, and interpret data.
Lesson at a Glance
Students measure lengths to the nearest sixteenth inch. They record the measurements in a table and then use the data to create a line plot. Students use the line plot to answer questions about the data. They also think about how adding additional data values to the data set might affect the mode, median, and range.
Key Questions
• Is a line plot a useful way to represent data? Why?
• Can using a line plot help you interpret data? How?
Achievement Descriptors
FL.4.Mod6.AD7 Create a line plot or stem-and-leaf plot and solve real-world problems involving numerical data. (MA.4.DP.1.1) (MA.4.DP.1.3)
b. What is the mode? What does the mode tell you about the lengths of the pencils?
The mode is 6 1 4 inches. The mode tells me that 6 1 4 inches is the most frequent length of the pencils.
c. What is the median? What does the median tell you about the lengths of the pencils?
The median is 6 5 16 inches. The median tells me that the length in the middle of the ordered data values is 6 5 16 inches.
d. What is the range? What does the range tell you about the lengths of the pencils?
The range is 6 8 inches. The range tells me the difference in length between the longest pencil and the shortest pencil.
FL.4.Mod6.AD8 Determine the mode, median, or range of a data set. (MA.4.DP.1.2) (MA.4.DP.1.3)
4 © Great Minds PBC LESSON 4
EUREKA MATH2 Florida B.E.S.T. Edition 4 ▸ M6 ▸ TA ▸ Lesson 4 © Great Minds PBC 39 The data values in the table show the lengths of pencils to the nearest eighth inch. Lengths of Pencils (inches) 6 1 2 6 1 4 6 7 8 6 3 8 6 1 8 6 1 4 6 7 8 6 1 8 6 5 8 6 1 4 a. Use the data values in the
0 × × 6 7 × × × × × × × × 6 1 8 6 1 4 6 3 8 6 1 2 6 5 8 6 3 4 6 7 8 Length (inches) Lengths of Pencils
table to make a line plot.
Name Date
4
Agenda
Fluency 10 min
Launch 5 min
Learn 35 min
• Collect Colored-Pencil Data
• Represent Colored-Pencil Data on a Line Plot
• Answer Questions About Colored-Pencil Data
• Problem Set
Land 10 min
Materials
Teacher
• Colored Pencil cards (in teacher edition)
Students
• Ruler
Lesson Preparation
Print or copy Colored Pencil cards and cut out the cards. Prepare enough cards for each student to have at least one card. Ensure there is an odd number of cards.
© Great Minds PBC 81 EUREKA MATH2 Florida B.E.S.T. Edition 4 ▸ M6 ▸ TA ▸ Lesson 4
Fluency
Counting on the Ruler by Sixteenths of an Inch
Students count by sixteenths of an inch and rename sixteenths as larger units to prepare for measuring objects and collecting data.
Display the segment of the inch ruler.
What is the smallest fractional unit shown on the ruler? Whisper your idea to your partner.
Sixteenths
Use the ruler to count by sixteenths to 1 inch. Use whole numbers when possible. The first number you say is 0 inches. Ready?
Display the arrow moving from one tick mark on the ruler to the next, guiding students to count.
0 inches, 1 16 inch, 2 16 inches, … , 15 16 inches, 1 inch
Count by sixteenths to 1 inch again. This time, also rename the sixteenths as eighths when possible. The first number you say is 0 inches. Ready?
Display the arrow moving from one tick mark on the ruler to the next, guiding students to count.
0 inches, 1 16 inch, 1 8 inch, 3 16 inches, 2 8 inches, … , 7 8 inches, 15 16 inches, 1 inch
Count by sixteenths to 1 inch again. This time, also rename the sixteenths as eighths or fourths when possible. The first number you say is 0 inches. Ready?
Display the arrow moving from one tick mark on the ruler to the next, guiding students to count
4 ▸ M6 ▸ TA ▸ Lesson 4 EUREKA MATH2 Florida B.E.S.T. Edition © Great Minds PBC 82
10 1 in
0 inches, 1 16 inch, 1 8 inch, 3 16 inches, 1 4 inch, … , 7 8 inches, 15 16 inches, 1 inch
Count by sixteenths to 1 inch one more time. This time, also rename the sixteenths as eighths, fourths, or halves when possible. The first number you say is 0 inches. Ready?
Display the arrow moving from one tick mark on the ruler to the next, guiding students to count.
0 inches, 1 ___ 16 inch, 1 __ 8 inch, 3 ___ 16 inches,
1 4 inch, 5 16 inches, 3 8 inches, 7 16 inches,
1 2 inch, … , 7 8 inches, 15 16 inches, 1 inch
Whiteboard Exchange: Line Plots
Students answer questions about a line plot to develop fluency with interpreting data in line plots.
After each prompt for a written response, give students time to work. When most students are ready, signal for students to show their whiteboards. Provide immediate and specific feedback. If students need to revise, briefly return to validate their corrections.
EUREKA MATH2 Florida B.E.S.T. Edition 4 ▸ M6 ▸ TA ▸ Lesson 4 © Great Minds PBC 83
1 0 1 16 1 8 3 16 1 4 5 16 3 8 7 16 1 2 9 16 5 8 11 16 3 4 13 16 15 16 7 8
Display the line plot.
Mr. Endo’s Pepper Seedlings
What does this line plot show?
The height in inches of Mr. Endo’s pepper seedlings
How many pepper seedlings were measured?
20 seedlings
How many pepper seedlings were less than 2 inches tall?
4 seedlings
What is the mode?
2 1 4 inches
What is the height in inches of the shortest pepper seedling?
1 1 4 inches
What is the height in inches of the tallest pepper seedling?
3 2 __ 4 inches
What is the range?
2 1 4 inches
4 ▸ M6 ▸ TA ▸ Lesson 4 EUREKA MATH2 Florida B.E.S.T. Edition © Great Minds PBC 84
0 2 3 4 × × × × × × × × × × × × × × × × × × × × 1 1 4 3 1 4 3 2 4 3 3 4 2 1 4 2 2 4 2 3 4 1 2 4 1 3 4 Height (inches)
Launch
Students discuss which data representation should be used to efficiently answer questions about the data.
Display the picture of the table that shows the heights of bean plants data.
Mr. Endo’s class grows bean plants. They measure the heights of the plants and record the data in a table.
What do you notice about the measurements?
The heights are measured in inches. The smallest fractional unit used to record the heights of the bean plants is an eighth inch. There are whole-number measurements and mixed-number measurements. Some measurements occur more than once.
Heights of Bean Plants
The class wants to use the data to learn more about the heights of their bean plants. Do you think they can efficiently use the data represented in the table to learn more about the heights of their bean plants? Why?
No. The data values are not organized in the table in a way that makes it easy to see important information about the heights of the bean plants.
Invite students to think–pair–share about how they might represent the data values in a way that would help them learn more about the heights of the bean plants.
We could organize the data values from least to greatest. If the data values are ordered, it might help Mr. Endo’s class learn more about the heights of the bean plants.
First, we thought about making a stem-and-leaf plot to represent the data. Then the data values would be organized from the shortest height to the tallest height, and that might make it easier to learn more about the heights of the bean plants. But when
EUREKA MATH2 Florida B.E.S.T. Edition 4 ▸ M6 ▸ TA ▸ Lesson 4 © Great Minds PBC 85
5
8 3 4 9 1 8 8 7 8 9 8 1 2 9 1 2 8 5 8 9 1 4 9 3 8 9 3 4 9 8 3 8 8 1 2 9 1 8 9 9 1 4 9 1 8 9 5 8 9 1 2 9 5 8 9 7 8 8 1 4 9 1 8 8 3 4 8 5 8
(inches)
we looked at the data in the table, we realized the stem-and-leaf plot would only have two stems, 8 and 9. That would mean each stem would have a lot of leaves. We’re not sure if a stem-and-leaf plot is the best way to represent the data.
A line plot could help the class organize the data values from least to greatest. The Xs on the line plot would also help the class efficiently answer questions about the data so they could learn more about the heights of the bean plants.
What information might Mr. Endo’s class want to know about the data?
They might want to determine the mode of the plant heights to see which height occurred most frequently.
Maybe they would want to know the range of the plant heights to see the difference between the height of the tallest plant and the height of the shortest plant. They might want to know the median plant height to see which plant height is in the middle of the ordered data values.
They might want to know how many of the plants are a certain height or taller than a certain height.
Transition to the next segment by framing the work.
Today, we will collect data, represent the data on a line plot, and answer questions about the data.
Learn Collect Colored-Pencil Data
Materials—T: Colored Pencil cards; S: Ruler
Students measure and record the lengths of pictures of colored pencils to the nearest sixteenth inch.
Distribute one Colored Pencil card to each student. Direct students to problem 1 in their books. Chorally read the problem with the class.
4 ▸ M6 ▸ TA ▸ Lesson 4 EUREKA MATH2 Florida B.E.S.T. Edition © Great Minds PBC 86
35
1. Record the length of each colored pencil in the table.
Lengths of Colored Pencils (inches)
Teacher Note
There are 25 Colored Pencil cards. If you have less than 25 students in your class, consider giving one or more students two cards or consider using fewer cards. Make sure you distribute an odd number of cards so that the median of the data set will be one of the data values.
Direct students to measure the length of the colored pencil on their card to the nearest sixteenth inch. As time allows, invite students to work with a partner to check each other’s measurements.
Gather the class and invite students to share their measurements. Record each student’s measurement in a class table and direct students to record the measurements, including their own, in the table in problem 1.
Lengths of Colored Pencils (inches)
UDL: Action & Expression
Consider providing each student with a paper ruler for measuring the length of their colored pencil to the nearest sixteenth inch. Students can align their picture of the colored pencil with their paper ruler and tape the two together, minimizing the fine motor demands of using a regular ruler.
Invite students to turn and talk about how they used their ruler to measure the length of their colored pencil to the nearest sixteenth inch.
EUREKA MATH2 Florida B.E.S.T. Edition 4 ▸ M6 ▸ TA ▸ Lesson 4 © Great Minds PBC 87
6 3 4 6 1 16 6 1 8 6 3 16 6 11 16 6 1 2 6 9 16 6 1 8 6 5 8 6 7 16 6 5 8 6 7 16 6 1 4 6 9 16 6 13 16 6 7 8 6 9 16 6 3 8 6 5 8 6 1 2 6 9 16 6 13 16 6 1 2 6 11 16 6 5 8
Represent Colored-Pencil Data on a Line Plot
Students make line plots with measurement data from a table. Direct students to part (a) and chorally read the problem.
a. Use the data in the table to make a line plot.
Let’s start by creating a scale for our line plot. What is the length in inches of the shortest colored pencil?
6 1 16 inches
What is the length in inches of the longest colored pencil?
6 7 8 inches
The line plot already shows the whole number 0. What other whole numbers should we include on the scale for our line plot?
6 and 7
Draw and label tick marks to represent 6 and 7. Direct students to do the same.
What fractional unit should we partition the whole-number interval from 6 to 7 into? Why?
Sixteenths because sixteenths is the smallest fractional unit in our data set
UDL: Representation
Consider displaying a picture of a ruler from 6 inches to 7 inches partitioned into sixteenths. Discuss what the tick marks represent on the ruler and ask students to make connections between the ruler and the scale on the line plot.
4 ▸ M6 ▸ TA ▸ Lesson 4 EUREKA MATH2 Florida B.E.S.T. Edition © Great Minds PBC 88
0 × × × × × × × × × × × × × × × × × × × × × × × × × Lengths of Colored Pencils 6 7 6 1 16 6 1 8 6 3 16 6 1 4 6 5 16 6 3 8 6 7 16 6 1 2 6 9 16 6 5 8 6 11 16 6 3 4 6 13 16 6 7 8 6 15 16 Length (inches)
7 6 6 1 16 6 3 16 6 5 16 6 7 16 6 9 16 6 11 16 6 13 16 6 15 16 6 1 8 6 1 4 6 3 8 6 1 2 6 5 8 6 3 4 6 7 8
What larger fractional unit can we partition the whole-number interval into first to help us make sixteenths?
We can make fourths and then partition each fourth into two equal parts to make eighths. Then we can partition each eighth into two equal parts to make sixteenths. We can make halves and partition each half into two equal parts to make fourths. We can partition each fourth into four equal parts to make sixteenths.
Draw to partition the whole-number interval into sixteenths. Direct students to do the same.
Invite students to think–pair–share about how they should label the tick marks that represent sixteenths.
We can start at 6 and count by sixteenths to label each tick mark. We can use equivalent fractions to help us label the tick marks to match the measurements in the table. We can use halves, fourths, eighths, and sixteenths to label the tick marks.
We can label the tick mark that represents 6 1 2 . Then we can label 6 1 4 and 6 3 4 . Halfway between the fourths, we can label the eighths. Then we can label the remaining tick marks as sixteenths.
Label each tick mark with a mixed number. Direct students to do the same.
Invite students to make a line plot from the data.
Point to the scale as you ask the following question.
What do the numbers on our scale represent?
The numbers represent lengths measured in inches.
Below the line plot, write the following: Length (inches). Direct students to do the same.
If someone looks at our line plot now, will they know what the data set represents?
They will know that the data set represents lengths in inches, but they would not know that these are lengths of colored pencils.
Differentiation: Support
Consider displaying three different number lines that show the whole-number interval from 6 to 7 partitioned into fourths, eighths, and sixteenths. Circle equivalent fractions and ask the following question:
How can we use equivalent fractions to rename some of the sixteenths as halves, fourths, and eighths?
The separate number lines can support students as they label sixteenths on the line plot.
EUREKA MATH2 Florida B.E.S.T. Edition 4 ▸ M6 ▸ TA ▸ Lesson 4 © Great Minds PBC 89
6 7 1 16 6 2 16 6 3 16 6 4 16 6 5 16 6 6 16 6 7 16 6 8 16 6 9 16 6 10 16 6 11 16 6 12 16 6 13 16 6 14 16 6 15 16 6 6 7 1 8 6 2 8 6 3 8 6 4 8 6 5 8 6 6 8 6 7 8 6 6 7 1 4 6 2 4 6 3 4 6
Let’s write a title for our line plot to show that the data set represents the lengths of colored pencils.
Above the line plot, write the following: Lengths of Colored Pencils. Direct students to do the same.
Invite students to turn and talk about what is the same and what is different about the representations of the colored-pencil data in the table and the line plot.
Answer Questions About Colored-Pencil Data
Students answer questions about the data represented on a line plot.
Direct students to part (b) and chorally read the problem.
b. What fraction of the colored pencils are at most 6 1 2 inches long? 11 25
c. Which lengths occur at least twice?
d. What are the modes? What do the modes tell you about the lengths of the pencils?
The modes are 6 9 16 inches and 6 5 8 inches. There are two modes for the data, and they tell me that 6 9 16 inches and 6 5 8 inches are the two most frequent lengths.
4 ▸ M6 ▸ TA ▸ Lesson 4 EUREKA MATH2 Florida B.E.S.T. Edition © Great Minds PBC 90
0 × × × × × × × × × × × × × × × × × × × × × × × × ×
6 1 8 , 6 7 16 , 6 1 2 , 6 9 16 , 6 5 8 , 6 11 16 , and 6 13 16
e. What is the median? What does the median tell you about the lengths of the pencils?
The median is 6 9 16 inches. It tells me that 6 9 16 inches is the length in the middle of the ordered colored-pencil lengths.
f. What is the range? What does the range tell you about the lengths of the pencils?
The range is 13 16 inches. It tells me that the difference in length between the longest colored pencil and the shortest colored pencil is 13 16 inches.
g. Shen finds two colored pencils that were not measured. He measures the colored pencils and records the lengths in the data set as 6 1 2 inches and 6 13 16 inches. Does including the lengths of Shen’s pencils in the data set change the mode, median, or range? How do you know?
The range is the same because the lengths of Shen’s colored pencils are between the lengths of the shortest and the longest colored pencils. There are now three modes instead of two modes because 6 1 2 inches, 6 9 16 inches, and 6 5 8 inches are the three most frequent lengths. The median is still 6 9 16 inches. I drew Xs on the line plot to represent the lengths of Shen’s colored pencils to help me determine the median. When I include the lengths of Shen’s pencils on the line plot, the median is still 6 9 16 inches.
Direct students to complete part (b). Invite one or two students to share their answers with the class.
How did you determine the fraction of the colored pencils that are at most 6 1 2 inches long?
I counted Xs on the line plot that represent lengths of 6 1 __ 2 inches or shorter.
Direct students to part (c) and chorally read the problem.
What does at least twice mean?
At least twice means all the lengths that occur two or more times.
Invite students to complete part (c).
What lengths occur at least twice?
Promoting the Mathematical Thinking and Reasoning Standards
As students answer questions about the data represented on a line plot, they are actively participating in effortful learning (MTR.1).
Ask the following questions to promote MTR.1:
• How can you determine the mode, median, and range from the line plot?
• What is your plan to determine whether including Shen’s two measurements changes the mode, median, and range of the colored-pencil data?
Teacher Note
The fractional unit of twenty-fifths is used in this lesson to describe a fraction of a set. Students are not expected to perform operations with this fractional unit.
Differentiation: Challenge
Consider inviting students to write their own questions that can be answered by using the data on the line plot. They can exchange their questions with those of a partner and answer each other’s questions.
EUREKA MATH2 Florida B.E.S.T. Edition 4 ▸ M6 ▸ TA ▸ Lesson 4 © Great Minds PBC 91
6 1 8 , 6 7 16 , 6 1 2 , 6 9 16 , 6 5 8 , 6 11 16 , and 6 13 16
Direct students to parts (d) through (f). Invite students to whisper-read the problems with a partner.
What information about the data do we find in parts (d) through (f)?
The mode, median, and range
Invite students to work with a partner to complete parts (d) through (f). Invite one or two pairs to share their answers with the class.
How did you determine the mode?
We looked for the length that has the most Xs on the line plot. There are two lengths that each have four Xs: 6 9 16 inches and 6 5 8 inches.
What do the modes tell us about the data?
The modes tell us that 6 9 16 inches and 6 5 8 inches are the most frequent lengths.
How did you determine the median?
Since the lengths in the data set are organized from shortest to longest, we lightly crossed off pairs of Xs, starting with the shortest length and the longest length. We continued crossing off pairs of shorter and longer lengths until we found the median length, 6 9 16 inches.
What does the median tell us about the data?
The median tells us that the length in the middle of the ordered data is 6 9 ___ 16 inches.
How did you determine the range?
We found the shortest length and the longest length. Then we subtracted the shortest length from the longest length to determine the range.
What does the range tell us about the data?
The range tells us that the difference in length between the longest colored pencil and the shortest colored pencil is 13 16 inches.
Direct students to part (g) and chorally read the problem.
What new data values does Shen have for our data set?
6 1 2 inches and 6 13 16 inches
Language Support
Consider displaying sentence starters that students can use as they work with a partner to complete parts (d) through (f).
• The mode represents the length that . We can find the mode by .
• The median represents the length that . We can find the median by .
• The range represents the . We can find the range by .
4 ▸ M6 ▸ TA ▸ Lesson 4 EUREKA MATH2 Florida B.E.S.T. Edition © Great Minds PBC 92
What does part (g) ask us to think about with the two new lengths of 6 1 2 inches and 6 13 16 inches?
We need to think about whether the two new lengths change the mode, median, or range of our data set.
Invite students to work with a partner to complete part (g).
When the lengths of Shen’s colored pencils are included in the data set, does the mode change? How do you know?
Yes. One of the colored pencils that Shen measured is 6 1 2 inches long, so that means that there are now four pencils that are 6 1 2 inches long. Before we included the lengths of Shen’s pencils, we determined the modes as 6 9 16 inches and 6 5 8 inches because they both had four Xs. Now there are three modes: 6 1 2 inches, 6 9 16 inches, and 6 5 8 inches.
When the lengths of Shen’s colored pencils are included in the data set, does the median change? How do you know?
No. I drew Xs on the line plot to represent the lengths of Shen’s colored pencils to help me determine the median. With Shen’s data on the line plot, the median is still 6 9 16 inches.
No. The length of one of Shen’s colored pencils is less than the median of 6 9 16 inches, and the length of the other is greater than the median of 6 9 16 inches. That means there is still an equal number of data values on either side of the median, so the median will stay the same.
When the lengths of Shen’s colored pencils are included in the data set, does the range change? How do you know?
No. The range is still 13 16 inches because the lengths of Shen’s colored pencils are between the lengths of the shortest colored pencil and the longest colored pencil. That means the difference in length between the longest and shortest colored pencils doesn’t change.
Invite students to turn and talk about how a line plot is useful when answering questions about data.
Problem Set
Differentiate the set by selecting problems for students to finish independently within the timeframe. Problems are organized from simple to complex.
EUREKA MATH2 Florida B.E.S.T. Edition 4 ▸ M6 ▸ TA ▸ Lesson 4 © Great Minds PBC 93
Land
Debrief 5 min
Objective: Collect, represent, and interpret data.
Use the following prompts to facilitate a class discussion about representing data on a line plot and using the line plot to answer questions about the data.
Is a line plot a useful way to represent data? Why?
Yes, because a line plot helps us quickly see the data.
Yes, because the data on a line plot is organized in order, which can be helpful when answering questions about the data.
Yes, because I think it’s easier to determine the mode, median, and range when the data is represented on a line plot.
Can using a line plot help you interpret data? How?
Yes. Line plots are one way to display data so that the data values are ordered from least to greatest. Using a line plot helps us see if there are any data values that are the same or if there are any data values that are very different from the others.
Yes. We can use a line plot to answer questions about a data set, and that helps us make sense of the data. For example, the range of the lengths of all 25 colored pencils is 13 16 inches. We know that 13 16 inches is less than 1 inch. That means that the lengths are all within 1 inch of each other.
Exit Ticket 5 min
Provide up to 5 minutes for students to complete the Exit Ticket. It is possible to gather formative data even if some students do not complete every problem.
4 ▸ M6 ▸ TA ▸ Lesson 4 EUREKA MATH2 Florida B.E.S.T. Edition © Great Minds PBC 94
10
Sample Solutions
Expect to see varied solution paths. Accept accurate responses, reasonable explanations, and equivalent answers for all student work.
4
1. The data values in the table show the lengths of caterpillars to the nearest sixteenth inch.
b. Mia measures the length of a caterpillar that is not represented in the table.
a. Use the data values in the table to make a line plot.
(Note: The answer for part (c) is shown in green.)
She notices that the length of the caterpillar is closest to the tick mark between 1 1 2 inches and 1 5 8 inches. What is the length of the caterpillar? How do you know?
The length of the caterpillar is 1 9 16 inches. I know 1 1 2 = 1 8 16 , and since the smallest tick marks on this ruler represent sixteenths, the next sixteenth is 1 9 16 .
c. Draw an X on the line plot to represent the length of Mia’s caterpillar.
(Note: The answer for part (c) is shown on the line plot in green.)
d. What fraction of the caterpillars are at least 1 5 16 inches long?
e. How many caterpillars have lengths that can be recorded by using eighth inches?
6 caterpillars
f. What is the total length of the caterpillars that are 1 9 16 inches long?
3 2 16 inches
EUREKA MATH2 Florida B.E.S.T. Edition 4 ▸ M6 ▸ TA ▸ Lesson 4 © Great Minds PBC 95
EUREKA MATH2 Florida B.E.S.T. Edition 4 ▸ M6 ▸ TA ▸ Lesson 4 © Great Minds PBC 35
Lengths of Caterpillars (inches) 1 1 4 1 7 16 1 1 2 1 5 16 1 9 16 1 1 2 1 1 8 1 1 8 1 5 16 1 1 16 1 11 16 1 3 16 1 3 4 1 5 16
0 1 2 × × × × × × × × × × × × × × 1 1 8 1 1 4 1 2 8 1 1 2 1 5 8 1 3 4 1 7 8 1 1 16 1 3 16 1 5 16 1 7 16 1 9 16 111 16 113 16 115 16 Lengths of Caterpillars Length (inches) ×
Name Date
4 ▸ M6 ▸ TA ▸ Lesson 4 EUREKA MATH2 Florida B.E.S.T. Edition © Great Minds PBC 36 PROBLEM SET
10 15
1 2 3 4 5 6 0 Inch
g. What is the mode? What does the mode tell you about the lengths of the caterpillars?
The mode is 1 5 16 inches. The mode tells me that 1 5 16 inches is the most frequent length of the caterpillars.
h. What is the median? What does the median tell you about the lengths of the caterpillars?
The median is 1 5 16 inches. The median tells me that the length in the middle of the ordered data values is 1 5 16 inches.
i. What is the range? What does the range tell you about the lengths of the caterpillars?
The range is 11 16 inches. The range tells me the difference in length between the longest caterpillar and the shortest caterpillar.
j. Ivan finds the difference between the lengths of two caterpillars represented on the line plot. He says the difference is 1 1 8 inches. Do you think Ivan is correct? Why?
No, I do not think Ivan is correct. I know the range is 11 16 inches. That means the greatest difference between the lengths of any two caterpillars is 11 16 inches. I know 1 1 8 > 11 16 , so Ivan is not correct.
4 ▸ M6 ▸ TA ▸ Lesson 4 EUREKA MATH2 Florida B.E.S.T. Edition © Great Minds PBC 96 EUREKA MATH2 Florida B.E.S.T. Edition 4 ▸ M6 ▸ TA ▸ Lesson 4 © Great Minds PBC 37 PROBLEM SET
© Great Minds PBC 97 This page may be reproduced for classroom use only. EUREKA MATH2 Florida B.E.S.T. Edition 4 ▸ M6 ▸ TA ▸ Lesson 4 ▸ Colored Pencil Cards A. B. C. D. E. F. G.
© Great Minds PBC 98 This page may be reproduced for classroom use only. 4 ▸ M6 ▸ TA ▸ Lesson 4 ▸ Colored Pencil Cards EUREKA MATH2 Florida B.E.S.T. Edition H. I. J. K. L. M. N.
© Great Minds PBC 99 This page may be reproduced for classroom use only. EUREKA MATH2 Florida B.E.S.T. Edition 4 ▸ M6 ▸ TA ▸ Lesson 4 ▸ Colored Pencil Cards O. P. Q. R. S. T. U.
Lengths
© Great Minds PBC 100 This page may be reproduced for classroom use only. 4 ▸ M6 ▸ TA ▸ Lesson 4 ▸ Colored Pencil Cards EUREKA MATH2 Florida B.E.S.T. Edition V. W. X. Y.
Pencils
A. 6 1 __ 16 B. 6 1 8 C. 6 1 _ 8 D. 6 3 __ 16 E. 6 1 4 F. 6 3 8 G. 6 7 __ 16 H. 6 7 _ 16 I. 6 1 2 J. 6 1 2 K. 6 1 2 L. 6 9 _ 16 M. 6 9 _ 16 N. 6 9 __ 16 O. 6 9 _ 16 P. 6 5 8 Q. 6 5 8 R. 6 5 8 S. 6 5 8 T. 6 11 _ 16 U. 6 11 16 V. 6 3 4 W. 6 13 __ 16 X. 6 13 _ 16 Y. 6 7 8
of
(inches)
Topic B Angles and Angle Measurement
In topic A, students collect, represent, and answer questions about data. In topic B, students build on their grade 3 knowledge of points, lines, line segments, rays, parallel and perpendicular lines, and angles to identify and draw right, acute, obtuse, and straight angles. They apply their learning from the topic to a real-world context as they create and describe floor plans.
Throughout the topic, students attend to precision. They use terminology and notation to identify and name figures. They use tools, such as straightedges, right-angle tools, and dot paper, to draw figures and angles, and they refine their descriptions of angle types by identifying similarities and differences among them. Students estimate and determine the reasonableness of a measure or drawing by using their knowledge of angle types. They formally identify and measure angles as turns, apply degree measures to angle definitions, and draw angles by using a protractor.
Students define an angle as a fractional turn through a circle. They construct an angle-maker tool and use it to create angles. They define a 1 degree angle as 1 360 of a turn through a circle and identify the fraction of the circular arc between the two rays that form an angle. Students recognize benchmark angles, find their measures with a 360° protractor, and then measure other angles by using degrees to describe the measures. Understanding angles as turns through a circle helps students apply degree measures to various contexts such as describing the number of degrees clock hands turn and navigating turns of varying degrees.
Topic B closes with students using a 180° protractor to measure and draw acute, right, and obtuse angles. Thinking about whether an angle is acute or obtuse helps students use a 180° protractor accurately.
In topic C, students use the measures of angles to see that angle measure is additive and determine the unknown measures of angles in a figure with multiple angles.
© Great Minds PBC 101
Progression of Lessons
Lesson 5
Identify right, acute, obtuse, and straight angles.
Lesson 6
Draw right, acute, obtuse, and straight angles.
Lesson 7
Relate geometric figures to a real-world context.
Comparing the size of an angle to a right angle or straight angle is one way to identify acute and obtuse angles. I can identify different types of angles in mathematical figures and real-world objects.
I can use tools to draw angles. Labeling the angles with points and arcs helps me name the angles. I can identify them as right, acute, or obtuse angles. Angles can have different orientations and the length of the drawn ray doesn’t change the type of angle.
I can use the terms I have learned to describe and identify figures in real-world drawings, such as floor plans, and in a floor plan that I create.
4 ▸ M6 ▸ TB EUREKA MATH2 Florida B.E.S.T. Edition © Great Minds PBC 102
R S X Y BC D Z E D F P
Lesson 8
Explore angles as fractional turns through a circle.
Lesson 9
Use a circular protractor to recognize a 1° angle as a turn through 1 ___ 360 of a circle.
Lesson 10
Identify and measure angles as turns and recognize them in various contexts.
When I create angles by turning a circle, I see that angles are fractional turns through a circle. I can use 1 4 turns and 1 _ 8 turns to create acute, right, obtuse, straight, and reflex angles.
A circular protractor can measure angles from 0° to 360°. The protractor helps me see that 1 ___ 360 of a turn is also a 1 degree angle. I can describe angles as a fraction of a circular arc or with a degree measure.
I can use degrees to describe turns in real-world situations. Degrees can describe the turn a clock hand makes and can be used to give someone directions.

EUREKA MATH2 Florida B.E.S.T. Edition 4 ▸ M6 ▸ TB © Great Minds PBC 103
Lesson 11
Use 180° protractors to measure angles.
Lesson 12
Estimate and measure angles with a 180° protractor.
Lesson 13
Use a protractor to draw angles up to 180°.
A 180° protractor is a common tool for measuring angles. I need to be careful to line up the protractor correctly with the angle I am measuring. Thinking about the type of angle helps me read the correct scale on the protractor when I measure an angle.
I can estimate the measure of an angle by thinking about the type of angle and comparing it to benchmark angles. Extending the rays of an angle can help me accurately measure an angle because it does not change the measure of the angle.
When I use a straightedge to draw rays and a protractor to measure degrees, I attend to precision as I draw angles. Estimating and sketching an angle first is one way to make sure my drawing is reasonable.
4 ▸ M6 ▸ TB EUREKA MATH2 Florida B.E.S.T. Edition © Great Minds PBC 104
C
B
Identify right, acute, obtuse, and straight angles.
each angle as right, acute, or obtuse. Use your right-angle tool.
© Great Minds PBC 5 LESSON 5
EUREKA MATH2 Florida B.E.S.T. Edition 4 ▸ M6 ▸ TB ▸ Lesson 5 © Great Minds PBC 49 5 Name Date Identify
Figure Type of Angle (right, acute, obtuse) X YZ Acute X YZ Obtuse Y Z X Acute 4 ▸ M6 ▸ TB ▸ Lesson 5 EUREKA MATH2 Florida B.E.S.T. Edition © Great Minds PBC 50 EXIT TICKET Figure Type of Angle (right, acute, obtuse) Y Z X Right Y X Z Obtuse
Lesson at a Glance
Students make a right-angle tool to identify different types of angles in real-world and mathematical figures. They use the right-angle tool to describe angles as right, acute, or obtuse in relation to the right angle of the tool, and they describe a straight angle. This lesson formalizes the terms classify, vertex, acute angle, obtuse angle, and straight angle.
Key Question
• How can you identify right, acute, obtuse, and straight angles?
Achievement Descriptor
FL.4.Mod6.AD2 Classify angles as acute, right, obtuse, straight, or reflex. (MA.4.GR.1.1)
Agenda
Fluency 10 min
Launch 5 min
Learn 30 min
• Make a Right-Angle Tool
• Use a Right-Angle Tool
• Angle Variations
• Problem Set
Land 15 min
Materials
Teacher
• Right-Angle Tool (in the teacher edition)
Students
• None
Lesson Preparation
• Print or copy Right-Angle Tool and cut out the circles. Prepare enough paper circles to have one per student and one for the teacher.
• Save the right-angle tools for use throughout the module.
EUREKA MATH2 Florida B.E.S.T. Edition 4 ▸ M6 ▸ TB ▸ Lesson 5 © Great Minds PBC 107
Fluency
Whiteboard Exchange: Stem-and-Leaf Plots
Students answer questions about a stem-and-leaf plot to develop fluency with interpreting data in stem-and-leaf plots.
After each prompt for a written response, give students time to work. When most students are ready, signal for students to show their whiteboards. Provide immediate and specific feedback. If students need to revise, briefly return to validate their corrections.
Display the picture of the stem-and-leaf plot.
Key: 13 0 means 130
What does this stem-and-leaf plot show?
The heights in centimeters of a group of students
How many students were measured?
23 students
How many students are less than 140 centimeters tall?
4 students
4 ▸ M6 ▸ TB ▸ Lesson 5 EUREKA MATH2 Florida B.E.S.T. Edition © Great Minds PBC 108
of Students (centimeters) Stem Leaf 12 7 0 0 0 2 5 5 5 6 8 8 0 2 3 5 6 7 8 0 3 5 13 14 15 2 8 16
Heights
10
What is the mode?
150 centimeters and 155 centimeters
What is the median?
150 centimeters
What is the height of the shortest student?
127 centimeters
What is the height of the tallest student?
168 centimeters
What is the range?
41 centimeters
Show Me Geometric Figures: Point, Line Segment, and Line
Students use gestures for point, line segment, and line to activate kinesthetic memory for geometric figures from grade 3.


Let’s use our hands and arms to show a point, a line segment, and a line. To show a point, we will do this. (Make a fist with one hand.)
Show me a point. (Shows gesture for point)
Arms down. (Lowers arms down to sides)
To show a line segment, we will do this. (Extend arms straight out to both sides, parallel to the floor. Make fists with both hands.)
Show me a line segment. (Shows gesture for line segment)
Why do you think this represents a line segment?
Whisper your idea to your partner.
Line segments are straight and have points at both ends. Our fists represent the points.
Arms down. (Lowers arms down to sides)
Teacher Note
As the geometric figures are being modeled, reiterate to students the following information:
• Points do not have size.
• Lines do not have thickness because they are made up of points.
EUREKA MATH2 Florida B.E.S.T. Edition 4 ▸ M6 ▸ TB ▸ Lesson 5 © Great Minds PBC 109
Point Line Segment
To show a line, we will do this. (Extend arms straight out to both sides, parallel to the floor. Keep hands open and fingers straight.)
Show me a line. (Shows gesture for line)
Why do you think this represents a line? Whisper your idea to your partner.
Lines have arrowheads on the ends to show they go on forever in both directions. Our straight fingers represent the arrowheads.
Arms down. (Lowers arms down to sides)
Alternate playfully between having students show a point, a line segment, and a line.
Choral Response: Polygons and Attributes
Students identify polygons with a specified attribute to prepare for new geometric terminology.
After asking each question, wait until most students raise their hands, and then signal for students to respond.

Raise your hand when you know the answer to each question. Wait for my signal to say the answer.
Display the attributes: 3 sides, 3 corners, and 3 angles.
What is the name of a polygon with 3 sides, 3 corners, and 3 angles?
Triangle
4 ▸ M6 ▸ TB ▸ Lesson 5 EUREKA MATH2 Florida B.E.S.T. Edition © Great Minds PBC 110
Line
Display the answer, and then display the triangles.
On my signal, say the letter or letters to answer each question.
Which triangles have at least 2 sides of equal length?
A
Display triangle A circled.
Which triangles have at least 1 right angle?
B and C
Display triangles B and C circled.
Attributes: 3 sides, 3 corners, and 3 angles
Repeat the process with the following sequence, replacing the name of the polygon in questions as needed:
Attributes: 4 sides, 4 corners, and 4 angles
Attributes: 6 sides, 6 corners, and 6 angles
EUREKA MATH2 Florida B.E.S.T. Edition 4 ▸ M6 ▸ TB ▸ Lesson 5 © Great Minds PBC 111
1 in 1 in 1 in 1 in 3 in 3 in H 2 in 2 in 2 in 2 in G 2 in 2 in 3 cm 4 cm 3 cm 5 cm 4 cm 5 cm K
5 cm 10 cm 3 cm 4 cm E 2 in 2 in F 6 cm 2 cm D hexagon quadrilateral
3 in 3 in 3 in A 6 cm 8 cm 10 cm B C 3 cm 4 cm 5 cm triangle
Launch
Students study a picture of four angles and discuss the similarities and differences. Introduce the Which One Doesn’t Belong? routine. Display the picture of the four figures and invite students to study them.
Give students 2 minutes to find a category in which three of the items belong, but a fourth item does not.
When time is up, invite students to explain their chosen categories and to justify why one item does not fit.
Highlight responses that describe angles based on their size.
Ask questions that invite students to use precise language, make connections, and ask questions of their own.
Sample question:
Which one doesn’t belong?
Figure A doesn’t belong because it is the only angle with a square corner.
Figure B doesn’t belong because it has rays that are drawn shorter and the other figures have rays that look like they are drawn the same size.
Figure C doesn’t belong because it has points D, E, and F and the others have points A, B, and C.
Figure D doesn’t belong because the angle is facing a different direction.
One way to describe angles is to name them based on their size. When we name something based on an attribute, such as size, we classify it.
Transition to the next segment by framing the work.
Today, we will learn to classify angles based on their size.
UDL: Representation
In previous grades, students identify the number of angles in a polygon as one of its attributes. To connect to prior knowledge, consider showing polygons with highlighted angles to prepare students for identifying angles apart from a shape.
Language Support
To further develop students’ understanding of the word classify, explain that we classify things regularly. Consider using an example such as animals. Provide students with the following categories: fish, bird, insect. Name some animals and invite students to classify them. Invite students to describe what makes each category distinct from the other categories.
4 ▸ M6 ▸ TB ▸ Lesson 5 EUREKA MATH2 Florida B.E.S.T. Edition © Great Minds PBC 112
5
B A A BC C B A D EF C A B C E F D A B C A B C
Figure AFigure B
Figure CFigure D
Learn
Make a Right-Angle Tool
Materials—T/S:
Paper circle
Students create a right-angle tool to be used to describe the size of angles.
Give one paper circle to each student. Fold the paper circle in half and then in half again along the straight edge that was made with the first fold. Direct students to do the same.
Do you notice any angles on your paper?
I see an angle in this corner.
Trace along each straight edge of the paper one at a time with your finger.
There is an angle where these two straight edges, or line segments, meet. Trace the segments with your finger starting at the endpoint.
Point to the angle in the corner of the paper.
This is a right angle. We can use this paper as a tool to help us identify right angles. We call it a right-angle tool.
Demonstrate how to use the right-angle tool by aligning the right-angle tool to the corner of an object such as a display board or a door.
The angle at the corner of the door is the same size as the angle of the right-angle tool.
Give students 2 minutes to identify right angles in the classroom with a partner. When time is up, gather students and invite them to share their observations.
As students share, invite the class to confirm that the object has a right angle.
EUREKA MATH2 Florida B.E.S.T. Edition 4 ▸ M6 ▸ TB ▸ Lesson 5 © Great Minds PBC 113
30
Use a Right-Angle Tool
Materials—T/S: Right-angle tool
Students use the right-angle tool to identify an angle as right, acute, or obtuse. Direct students to problem 1 in their books. Read the problem chorally with the class.
Use your right-angle tool to classify the angle as a right angle, an acute angle, or an obtuse angle.
Right angle
Trace the rays of the angle with your finger, beginning at P, moving to the vertex, R, and then extending to S.
We can call this ∠PRS.
Write ∠PRS.
Invite students to think–pair–share about how else the angle could be named. I think the angle could be named ∠SRP, just like lines and line segments have different names.
Write ∠SRP.
When we name an angle using the names of three points, we must list the points in order. We cannot call this ∠RSP or ∠RPS.
4 ▸ M6 ▸ TB ▸ Lesson 5 EUREKA MATH2 Florida B.E.S.T. Edition © Great Minds PBC 114
1.
R P S
There is also a third way to name the angle. You can sometimes name an angle by its vertex, or the endpoint of the two rays. What is the vertex of this angle?
The two rays meet at point R, so I think that point R is the vertex.
Write ∠R.
Support student understanding of the term vertex by inviting them to label the vertex of ∠R. Write vertex and draw a line pointing to the vertex. Invite students to do the same.
Does ∠R look like a right angle?
Yes, it looks like a right angle.
Let’s use our right-angle tool to check.
Use the right-angle tool to show students how to determine whether ∠R is the same size as, smaller than, or larger than a right angle. Think aloud and use precise language as you use the right-angle tool.
I can line up the bottom of the right-angle tool with ⟶ RS. Then I slide the right-angle tool so that its corner is at the vertex R.
Prompt students to use their right-angle tools to do the same.
Is ∠R the same size as, smaller than, or larger than a right angle? How do you know?
It is the same size as a right angle because the angle of the right-angle tool matches ∠R.
The sides of the right-angle tool line up with the rays of the angle, so ∠R is the same size as a right angle.
Point to the square at the vertex of the angle.
We know from learning about squares and rectangles that this square at the vertex identifies this angle as a right angle.
Teacher Note
To help students understand why the angle cannot be called ∠RSP or ∠RPS, consider tracing your finger from R to S and then pausing so students see that there is no line segment going from S to P. Do the same from R to P to S to show that there is no angle drawn there either.
Differentiation: Support
Some students may need support lining up the right-angle tool along the bottom ray and the vertex. To support students in using the right-angle tool appropriately, have them make a square at the corner of the right-angle tool.
EUREKA MATH2 Florida B.E.S.T. Edition 4 ▸ M6 ▸ TB ▸ Lesson 5 © Great Minds PBC 115
R
R S R P S
Direct students to problems 2 and 3. Point to the arc of each angle. This is an arc. An arc is a symbol that we use to identify which angle we are looking at.
Write arc and draw a line pointing to the arc in problem 2. Invite students to do the same in their books.
Identify the type of angle.
Invite students to turn and talk about whether they think the angles are smaller than or larger than a right angle. As students talk, prompt them to refer to the angles by name (e.g., ∠E looks like it is smaller than a right angle).
Invite students to use their right-angle tool to determine whether ∠E and ∠Y are the same size as, smaller than, or larger than a right angle. Then have two or three students explain how the tool helped them.
Is ∠E the same size as, smaller than, or larger than a right angle? How do you know?
∠E is smaller than a right angle. I know because when I line up the corner of the right-angle tool with the vertex of ∠E, ⟶ ED is completely covered up by the tool.
Promoting the Mathematical Thinking and Reasoning Standards
Students use patterns and structure (MTR.5) when they use their right-angle tool to determine whether an angle is right, acute, or obtuse.
Ask the following questions to promote MTR.5:
• How are acute and obtuse angles related? How can that help you identify them?
• How can you use what all angles have in common to help identify right, acute, and obtuse angles?
4 ▸ M6 ▸ TB ▸ Lesson 5 EUREKA MATH2 Florida B.E.S.T. Edition © Great Minds PBC 116
2. Acute angle
3. Obtuse angle
E E F D
Z Y X
∠E is an acute angle. Acute angles are angles that are smaller than right angles. Is ∠Y the same size as, smaller than, or larger than a right angle? How do you know?
∠Y is larger than a right angle. I know because when I line up the corner of the right-angle tool with the vertex of ∠Y, there is space between ⟶ YX and the edge of my tool.
∠Y is an obtuse angle. How would you describe an obtuse angle? An obtuse angle is an angle that is larger than a right angle.
Direct students to write the type of angle for problems 2 and 3. Then invite students to use their right-angle tools to identify the angle types in problems 4–6.
Invite students to turn and talk about how the right-angle tool helped them identify the type of each angle.
EUREKA MATH2 Florida B.E.S.T. Edition 4 ▸ M6 ▸ TB ▸ Lesson 5 © Great Minds PBC 117
Obtuse angle
4.
Acute angle
Acute angle
5.
6.
C B A B EK L D M
Angle Variations
Students use the right-angle tool to name a straight angle and angles with variations in ray length and orientation.
Direct students to problems 7–9. Give students 1 minute to study the angles. Invite students to turn and talk about what they notice and wonder about the angles.
Language Support
Consider creating an anchor chart for the types of angles. In lesson 9, students revise these definitions using angle measures.
A right angle is an angle that is the same size as the angle of the right-angle tool.
An acute angle is an angle that is smaller than a right angle.
An obtuse angle is an angle that is larger than a right angle and smaller than a straight angle.
A straight angle is an angle formed by two rays, with a common endpoint, that together make a line.
4 ▸ M6 ▸ TB ▸ Lesson 5 EUREKA MATH2 Florida B.E.S.T. Edition © Great Minds PBC 118
7. Straight angle
8. Acute angle
9. Obtuse angle
R P S
E F D
Y X
Z
BC D BC D L T F C E A
Direct students to problem 7.
How many points are labeled on the angle?
We can think of point C as the vertex of this angle. Trace the angle with your finger, from point B to point C and point C to point D.
Is ∠BCD smaller or larger than a right angle?
Larger
What have we called angles that are larger than right angles?
Obtuse angles
What does the figure in problem 7 look like?
A line
Invite students to think–pair–share about how they could determine whether the figure is a line.
We could use a straightedge or ruler to see if it’s straight. We could use the straight side of our right-angle tool to see if it’s a straight line.
Invite students to use the straight side of their right-angle tool to see that the rays that form the angle make a line.
We have a special name for this angle. When an angle is formed by 2 rays, with a common endpoint, that together make a line, we call it a straight angle.
How does the description of a straight angle compare to what we said about an obtuse angle?
We said that an obtuse angle is larger than a right angle, but a straight angle is also larger than a right angle.
Let’s make our definition of an obtuse angle more precise. An obtuse angle is larger than a right angle and smaller than a straight angle.
Invite students to look around the room and identify straight angles.
Invite students to complete problem 7 and then direct them to problems 8 and 9.
EUREKA MATH2 Florida B.E.S.T. Edition 4 ▸ M6 ▸ TB ▸ Lesson 5 © Great Minds PBC 119
3
Direct partners to use their right-angle tools to identify the type of angle in each problem.
When students are finished, invite them to share their thinking about the angles. Consider asking the following questions.
What was different about the angle in problem 8?
The angle was open to the left.
How did you use your right-angle tool to identify the type of angle?
I lined up the tool along ⟶ LT and put the corner of the tool at the vertex. It’s smaller than a right angle, so it’s an acute angle.
What was different about problem 9?
The rays that were drawn were shorter than other angles.
How did you identify the type of angle?
I used the right-angle tool and saw that there was space between the edge of the tool and ⟶ EA , so it’s an obtuse angle.
The lengths of the rays can be drawn to look short or long. What we look at when identifying an angle type is the space between the rays indicated by the arc.
As time allows, display the picture of the geometric figures and have students turn and talk about the different types of angles they see.
Problem Set
Differentiate the set by selecting problems for students to finish independently within the timeframe. Problems are organized from simple to complex.
Teacher Note
Problem 7 in the Problem Set requires students to draw points, lines, line segments, rays, and angles on a piece of art. To preserve the integrity of the art in the printed materials, the sample student response in the answer key is separate from the art.
4 ▸ M6 ▸ TB ▸ Lesson 5 EUREKA MATH2 Florida B.E.S.T. Edition © Great Minds PBC 120
L T
Land
Debrief 10 min
Objective: Identify right, acute, obtuse, and straight angles.
Use the following prompts to facilitate a discussion emphasizing precise geometric language and differences between right, acute, and obtuse angles.
How are right, acute, obtuse, and straight angles similar and different?
They are all angles but they have different names.
They are all formed when two rays meet at a vertex.
They can be named in different ways.
Right angles are the same size as the corner of a right-angle tool. Acute angles are smaller than a right angle, and obtuse angles are larger than a right angle but smaller than a straight angle. A straight angle is a straight line.
How does a right-angle tool help you identify right, acute, and obtuse angles?
I line up the right-angle tool along a ray and put the corner on the vertex of the angle. I look to see if the other ray of the angle is lined up with the edge of the tool, hidden by the tool, or if there is a space between the edge of the tool and the ray.
How is a straight angle different from the other angles we looked at today?
A straight angle looks like a line.
Display ∠TLF.
How do we classify an angle that is positioned like ∠TLF?
We look at the size of the angle shown by the arc. The position doesn’t change how we classify it.
EUREKA MATH2 Florida B.E.S.T. Edition 4 ▸ M6 ▸ TB ▸ Lesson 5 © Great Minds PBC 121
15 L T F
Display My Egypt, 1927, by Charles Demuth.
The painting in the Problem Set is called My Egypt. The artist who painted this is named Charles Demuth. It is one of several paintings he made of American buildings and machines. This painting shows a grain elevator, which is a building where farmers store corn, wheat, or other grains before they are taken to a factory to make into food. The artist named the painting My Egypt because it reminded him of Egyptian architecture.
Use the following questions to help students engage with the art:
• What do you notice in the painting?
• What do you wonder?
Guide students to think about the painting in terms of figures such as points, line segments, lines, rays, and angles.
Where do you see figures that remind you of lines, line segments, and rays in this painting?
Charles Demuth (1883–1935). My Egypt. 1927. Oil, fabricated chalk, and graphite pencil on composition board. Overall: 35 15/16 x 30 in. (91.3 x 76.2 cm). Purchase, with funds from Gertrude Vanderbilt Whitney. Inv. N.: 31.172 Digital image © Whitney Museum of American Art/Licensed by Scala/Art Resource, NY

It looks like there are rays coming from the top corner that remind me of rays of sunlight. At the top of the building, there are horizontal blue lines. I think of them as lines instead of line segments because they keep going off the edge of the painting. The parts of the building are outlined mostly with line segments.
Invite two or three students to share examples of right, acute, or obtuse angles they identified in problem 7 of the Problem Set.
Language Support
To support the context of the discussion, build background knowledge by showing photographs of a grain elevator.
4 ▸ M6 ▸ TB ▸ Lesson 5 EUREKA MATH2 Florida B.E.S.T. Edition © Great Minds PBC 122
Does the painting look like a realistic building? How do the lines, line segments, rays, and angles make the building seem more realistic or less realistic?
The painting looks realistic because the long vertical line segments make the building seem tall and I know grain elevators are tall. It looks even taller because we are looking at it from the bottom.
In some ways it looks realistic, but it also looks flat because of how the line segments cross over each other and cut up the picture. Real grain elevators are shaped like cylinders, but this grain elevator looks flat.
The lines and angles make it look like the sun is coming into the picture from the top left and from the right. This is not very realistic because the sun only comes from one side in real life.
Exit Ticket 5 min
Provide up to 5 minutes for students to complete the Exit Ticket. It is possible to gather formative data even if some students do not complete every problem.
EUREKA MATH2 Florida B.E.S.T. Edition 4 ▸ M6 ▸ TB ▸ Lesson 5 © Great Minds PBC 123
Sample Solutions
Expect to see varied solution paths. Accept accurate responses, reasonable explanations, and equivalent answers for all student work.
4 ▸ M6 ▸ TB ▸ Lesson 5 EUREKA MATH2 Florida B.E.S.T. Edition © Great Minds PBC 124
EUREKA MATH2 Florida B.E.S.T. Edition 4 ▸ M6 ▸ TB ▸ Lesson 5 © Great Minds PBC 45 5 Name Date Complete the table. Use your right-angle tool. The first one has been done for you. Figure Size Compared to a Right Angle (same size, smaller than, larger than) Type of Angle (right, acute, obtuse) 1. A BC Smaller than Acute 2. A BC Same size Right 3. A BC Smaller than Acute 4 ▸ M6 ▸ TB ▸ Lesson 5 EUREKA MATH2 Florida B.E.S.T. Edition © Great Minds PBC 46 PROBLEM SET Figure Size Compared to a Right Angle (same size, smaller than, larger than) Type of Angle (right, acute, obtuse) 4. A BC Larger than Obtuse 5. A B C Same size Right 6. A B C Larger than Obtuse
7. Use your right-angle tool to help identify right, acute, and obtuse angles within Charles Demuth’s painting My Egypt. Trace at least two of each kind of angle. Label them with points and an arc, and then name them in the table.
8. Amy draws two angles that are the same size. David says they can’t be the same size because the rays in ∠QRX are drawn longer than the rays in ∠PWL Explain how the angles can be the same size.
The angles can be the same size because the lengths of the rays that are drawn do not determine the size of the angle.
Charles
My Egypt. 1927. Oil, fabricated chalk, and graphite pencil on composition board. Overall: 35 15/16 x 30 in. (91.3 x 76.2 cm). Purchase, with funds from Gertrude Vanderbilt Whitney. Inv. N.: 31.172 Digital image © Whitney Museum of American Art/ Licensed by Scala/Art Resource, NY

EUREKA MATH2 Florida B.E.S.T. Edition 4 ▸ M6 ▸ TB ▸ Lesson 5 © Great Minds PBC 125 EUREKA MATH2 Florida B.E.S.T. Edition 4 ▸ M6 ▸ TB ▸ Lesson 5 © Great Minds PBC 47 PROBLEM SET
Sample: A B C E D F G M L N Sample: Right Angle ∠EFG ∠DFE Acute Angle ∠BCD ∠LMN Obtuse Angle ∠ABC ∠CDE 4 ▸ M6 ▸ TB ▸ Lesson 5 EUREKA MATH2 Florida B.E.S.T. Edition © Great Minds PBC 48 PROBLEM SET
Demuth (1883–1935).
Q R X P WL
4 ▸ M6 ▸ TB ▸ Lesson 5 ▸ Right-Angle Tool EUREKA MATH2 Florida B.E.S.T. Edition © Great Minds PBC 126 This page may be reproduced for classroom use only.
Draw right, acute, obtuse, and straight angles.
Lesson at a Glance
Students draw angles using a straightedge and a right-angle tool. They reason about how to draw an angle when a single ray is given and how to draw an angle from a description. Students name the angles in different ways, classify the angles by their size, and notice that angles can have rays drawn with different lengths and can be oriented on the page in various ways.
Key Questions
• What tools are helpful for drawing angles?
• What should a drawing of an angle include?
Achievement Descriptor
FL.4.Mod6.AD2 Classify angles as acute, right, obtuse, straight, or reflex. (MA.4.GR.1.1)
© Great Minds PBC 6 LESSON 6
EUREKA MATH2 Florida B.E.S.T. Edition 4 ▸ M6 ▸ TB ▸ Lesson 6 © Great Minds PBC 57 6 Name Date 1. Draw an acute angle KLM. Explain how you know the angle is acute. M K L I know this angle is acute because it is smaller than a right angle. 2. Draw an obtuse angle XZY. Explain how you know the angle is obtuse. Y X Z I know this angle is obtuse because it is larger than a right angle.
Agenda
Fluency 10 min
Launch 5 min
Learn 35 min
• Draw and Name an Angle
• Draw an Obtuse Angle
• Similar and Different Angles
• Problem Set
Land 10 min
Materials
Teacher
• Straightedge
• Right-angle tool
Students
• Straightedge
• Right-angle tool
• Blank paper
Lesson Preparation
Gather the right-angle tools created in lesson 5.
© Great Minds PBC 129 EUREKA MATH2 Florida B.E.S.T. Edition 4 ▸ M6 ▸ TB ▸ Lesson 6
Fluency
Whiteboard Exchange: Stem-and-Leaf Plots
Students answer questions about a stem-and-leaf plot to develop fluency with interpreting data in stem-and-leaf plots.
After each prompt for a written response, give students time to work. When most students are ready, signal for students to show their whiteboards. Provide immediate and specific feedback. If students need to revise, briefly return to validate their corrections.
Display the picture of the stem-and-leaf plot.
What does this stem-and-leaf plot show?
The weights in pounds of a group of cats
How many cats were weighed?
21 cats
4 ▸ M6 ▸ TB ▸ Lesson 6 EUREKA MATH2 Florida B.E.S.T. Edition © Great Minds PBC 130
Weights of Cats (pounds) Stem Leaf 8 9 10 11 0 12 1 2 3 4 0 1 4 3 4 3 4 Key: 9 means 9 1 4 1 4 0 0 0 1 4 1 4 1 4 1 2 1 2 3 4 0 1 4 1 2 1 2 3 4
10
How many cats weigh less than 10 pounds?
6 cats
What is the mode?
10 pounds and 10 1 4 pounds
What is the median?
10 1 _ 4 pounds
What is the weight of the lightest cat?
8 1 2 pounds
What is the weight of the heaviest cat?
12 pounds
What is the range?
3 1 2 pounds
Choral Response: Polygons and Attributes
Students identify polygons with a specified attribute to prepare for new geometric terminology.
After asking each question, wait until most students raise their hands, and then signal for students to respond.
Raise your hand when you know the answer to each question. Wait for my signal to say the answer.
Display the attributes: 3 sides, 3 corners, and 3 angles.
What is the name of a polygon with 3 sides, 3 corners, and 3 angles? Triangle
Display the answer, and then display the triangles.
On my signal, say the letter or letters to answer each question.
EUREKA MATH2 Florida B.E.S.T. Edition 4 ▸ M6 ▸ TB ▸ Lesson 6 © Great Minds PBC 131
Which triangles have at least 2 sides of equal length?
Display triangle C circled. Which triangles have at least 1 right angle?
Attributes: 3 sides, 3 corners, and 3 angles
Display triangle B circled. Repeat the process with the following sequence, replacing the name of the polygon in questions as needed:
Attributes: 4 sides, 4 corners, and 4 angles quadrilateral
Attributes: 6 sides, 6 corners, and 6 angles hexagon
Show Me Geometric Figures: Ray and Angles
Students use gestures for ray, right angle, acute angle, obtuse angle, and straight angle to develop kinesthetic memory for geometric figures.

Let’s use our hands and arms to show a ray and different types of angles. To show a ray, we will do this. (Extend arms straight out to both sides, parallel to the floor. Make a fist with one hand and leave the other hand open with fingers straight.)
Show me a ray. (Shows gesture for a ray)
Arms down. (Lowers arms down to sides)
To show a right angle, we will do this. (Hold one arm straight out to the side, parallel to the floor, and the other arm straight overhead. Keep hands open and fingers straight.)
Ray
Teacher Note
Consider asking students to whisper to their partner why each gesture represents the geometric figure. For example, after “Show me a ray.” Say, “How do you think our arms show a ray? Whisper your idea to your partner.”
4 ▸ M6 ▸ TB ▸ Lesson 6 EUREKA MATH2 Florida B.E.S.T. Edition © Great Minds PBC 132
C
B
J 4 m 2.5 m 4.1 m 3.4 m 4.5 m 10.3 m 5 cm G 5 cm 5 cm 5 cm 2 cm 2 cm H 1 in 1 in 1 in 1 in 2 in 1 2 2 in 1 2 1.5 cm 4.5 cm 10.5 cm 7.5 cm D 9.5 cm 5 cm 6.5 cm 4 cm F E 3 in 1 2 2 in 1 4
C 8 cm 1 2 8 cm 1 2 3 cm 1 2 3.5 m 3.2 m 3 m A B 50 yd 30 yd 40 yd triangle
Show me a right angle. (Shows gesture for a right angle)
Arms down. (Lowers arms down to sides)
Use the descriptions and gestures provided to continue the process with the following sequence:
Acute Angle
Obtuse Angle
Right Angle
Start with the gesture of a right angle. Then bring your arms closer together.
Start with the gesture of a right angle. Then move your arms farther apart.
Straight Angle
Extend arms straight out to both sides, parallel to the floor. Keep hands open and fingers straight.


Alternate playfully between having students show a ray and the four types of angles. Consider adding point, line segment, and line into the sequence.
Launch
Students reason about whether statements about angles are always, sometimes, or never true.
Present the following statement: An angle that is larger than a right angle is an obtuse angle. Use the Always Sometimes Never routine to engage students in constructing meaning and discussing their ideas.
Give students about 1 minute of silent think time to evaluate whether the statement is always, sometimes, or never true.
Language Support
To support students in sharing their thinking with a partner, direct students’ attention to the Agree or Disagree portion of the Talking Tool.
EUREKA MATH2 Florida B.E.S.T. Edition 4 ▸ M6 ▸ TB ▸ Lesson 6 © Great Minds PBC 133
5
Have students discuss their thinking with a partner. Circulate and listen as they talk. Identify a few students to share their thinking. Then facilitate a class discussion. Invite students to share their thinking with the whole group. Encourage them to provide examples and nonexamples to support their claim. Conclude by coming to the consensus that the statement is sometimes true because a straight angle is larger than a right angle, but it is not obtuse.
Repeat the Always Sometimes Never routine for the following statements:
• An angle that is larger than an acute angle is an obtuse angle. This is sometimes true. The angle could be a right angle or a straight angle.
• A straight angle is smaller than an obtuse angle. This is never true. A straight angle is always larger than an obtuse angle.
Transition to the next segment by framing the work. Today, we will draw angles of different sizes.
Learn
Draw and Name an Angle
Materials—T/S: Straightedge, right-angle tool
Students draw an angle by using a given ray and identify the angle as right, acute, obtuse, or straight.
Draw ⟶ LM .
What is the name of this figure?
⟶ LM
What makes this a ray and not an angle?
An angle would have another ray that meets at L.
Teacher Note
It is also true that an angle larger than a right angle or an acute angle could be a reflex angle. Reflex angle is a new term in lesson 8.
4 ▸ M6 ▸ TB ▸ Lesson 6 EUREKA MATH2 Florida B.E.S.T. Edition © Great Minds PBC 134
35
Invite students to think–pair–share about how to construct an angle using ⟶ LM as one of its rays.
We can use our straightedge to draw another ray that extends from L.
We can draw a point somewhere that’s not on ⟶ LM and then connect that point to L.
Draw a point, K, below ⟶ LM and to the right of point L. Use your finger to draw an imaginary ray connecting L to K.
If I connect L and K to make ⟶ LK , what type of angle would that make? How do you know?
An acute angle. I can see that the angle would be smaller than a right angle. Erase K. Then draw a new K, above ⟶ LM and to the left of L. Use your finger to draw an imaginary ray connecting L to K as you say the following:
If I connect L and K to make ⟶ LK , what type of angle would that make? How do you know?
An obtuse angle. I can see that the angle would be larger than a right angle but smaller than a straight angle.
Invite students to think–pair–share about what other types of angles they could draw using ⟶ LM and how they could draw them. Listen for students to say that they could use their right-angle tools to make right angles and their straightedges to draw straight angles.
I can use my right-angle tool to make a right angle. I can use my straightedge to extend ⟶ LM and make it a line. Then I can add another point on the line, and it will be a straight angle.
Direct students to problem 1 in their books and prompt them to use their straightedges to draw an angle using ⟶ LM .
Teacher Note
Instead of drawing an imaginary ray with your finger, consider using a pencil or straightedge to represent the ray and help indicate what the angle would look like.
EUREKA MATH2 Florida B.E.S.T. Edition 4 ▸ M6 ▸ TB ▸ Lesson 6 © Great Minds PBC 135
Draw an angle with the given ray. Label the angle.
1. Use ⟶ LM to draw ∠KLM. K
As students work, circulate and ensure that students are using a straightedge to construct the angle and are labeling their drawings (e.g., labeling point K on ⟶ LK , drawing an arc at the vertex to indicate the angle, or drawing a small square to indicate a right angle if a right angle is drawn).
After students finish drawing, invite them to turn and talk about how their angles are similar to and different from their partners’ angles. Prompt students to use the terms right, acute, obtuse, and straight angle to describe their angles as they share.
Draw an Obtuse Angle
Students draw an angle from a given description. Direct students to problem 2. Read the problem chorally.
UDL: Action & Expression
Consider providing a choice of tools for drawing angles. Make pattern blocks available for students to trace, rather than using only a straightedge and right-angle tool. For example, when drawing an acute angle, students can trace two edges of an equilateral triangle. When drawing an obtuse angle, students can trace two edges of a regular pentagon.
Promoting the Mathematical Thinking and Reasoning Standards
When students draw different-size angles and name them, they are completing tasks with mathematical fluency (MTR.3).
Ask the following questions to promote MTR.3:
• What details should be considered when drawing and naming an angle?
• When naming an angle, what steps need to be precise? Why?
4 ▸ M6 ▸ TB ▸ Lesson 6 EUREKA MATH2 Florida B.E.S.T. Edition © Great Minds PBC 136
L M
2. Draw and label an obtuse angle PRS.
Teacher Note
A single angle can be named in different ways. For example, this angle can be named as ∠ABC, ∠CBA, or ∠B.
A
Invite students to turn and talk about what their drawings should include. Then lead students in drawing the angle.
Let’s begin by drawing one of the rays of our angle. Do you think it matters which direction the ray is pointing?
No, it does not matter. We can draw it any way that we want.
I am going to draw my ray horizontally.
Draw a ray and direct students to do the same.
How should we label the two points on this ray?
The angle is named ∠PRS, so we have to use two of those letters.
Point R is the vertex of the angle because it is the middle letter, so the point on the left needs to be labeled as R.
The point on the right, near the arrowhead could be P or S.
In ∠PRS, point R is the vertex so I can label the point on the left as R and the point on the right as S.
Label the points on the ray as R and S and direct students to do the same.
BC
However, when more than one angle shares a vertex, using a single letter does not precisely indicate the angle being referred to. For example, ∠F could refer to any one of the angles in the figure. To be more precise, the angle should be named by using three points, not just by using the vertex (e.g., ∠WFG).
EUREKA MATH2 Florida B.E.S.T. Edition 4 ▸ M6 ▸ TB ▸ Lesson 6 © Great Minds PBC 137
R P S
SQ E G W F
Invite students to think–pair–share about how they can use their ray to draw an obtuse angle.
I can draw point P so when I connect P and R it makes an angle larger than a right angle.
I can use my straightedge to show where the other ray would be and then trace along the straightedge.
Prompt students to complete their drawings of obtuse ∠PRS, including labeling the new point. Then invite students to show their drawing to a partner to confirm that it is an obtuse angle.
Invite students to turn and talk about other ways to name their angle (i.e., ∠R or ∠SRP).
Similar and Different Angles
Materials—S: Blank paper, right-angle tool, straightedge
Students draw an angle and discuss the similarities and differences between their angle and the angles drawn by other students.
Give each student a piece of paper. Prompt students to use their tools to draw an angle of their choice. As students work, circulate and identify three or four students to share their work. Look for a variety of angle types (i.e., right, acute, obtuse, and straight angles) as well as some angles that have rays that are drawn shorter or longer than others and some angles that are oriented in different ways on the page.
Then facilitate a class discussion. Invite the identified students to share their drawings with the
Differentiation: Challenge
If students are able to draw a single angle easily, challenge them to use one of the rays to draw another angle in the same figure.
For example, after drawing ∠ABC, prompt students to draw an acute angle that also uses ⟶ BC as one of its rays.
B
Teacher Note
Consider collecting the angle drawings and displaying them in an anchor chart, categorized by angle size. The chart can serve as a reference to students as they continue to learn about angles.
4 ▸ M6 ▸ TB ▸ Lesson 6 EUREKA MATH2 Florida B.E.S.T. Edition © Great Minds PBC 138
A
D C J K B E C M X Y Z A P L
whole group. For each drawing, prompt the class to name the angle in three different ways (e.g., ∠JKL, ∠LKJ, and ∠K), and, if possible, classify the angle as right, acute, obtuse, or straight. Then invite students to turn and talk about how the displayed angle is similar to and different from the angle they drew. As students share, circulate, listen, and promote dialogue by asking questions such as the following:
• How is the size of the displayed angle similar to or different from the size of your angle?
• How is the name of the displayed angle similar to or different from the name of your angle?
• How does the length of each drawn ray in the displayed angle compare to the length of the drawn rays in your angle?
• Is the displayed angle arranged in the same position as your angle? Does your angle open in the same direction as the displayed angle?
After displaying and discussing three or four student work samples, invite students to turn and talk about whether they think any two students drew angles that were exactly alike.
Problem Set
Differentiate the set by selecting problems for students to finish independently within the timeframe. Problems are organized from simple to complex.
Language Support
Consider providing sentence frames to support students as they share and compare work.
• This angle is (a right, an acute, an obtuse, a straight) angle. I know because .
• One way to name this angle is to call it ∠ .
• My angle is similar because , but it is different because .
EUREKA MATH2 Florida B.E.S.T. Edition 4 ▸ M6 ▸ TB ▸ Lesson 6 © Great Minds PBC 139
Land
Debrief 5 min
Objective: Draw right, acute, obtuse, and straight angles.
Use the following prompts to facilitate a discussion emphasizing precise geometric language and differences between drawing different types of angles.
What tools are helpful for drawing angles?
A straightedge is helpful so you can draw rays that are straight. A right-angle tool is helpful especially if you want to draw a right angle.
What should a drawing of an angle include?
The drawing should have two rays that share a common end point. The drawing should include labels for the points.
Each ray needs to include an arrowhead at one end to show that it is a ray.
The drawing should include an arc to show where the angle is or a small square to indicate a right angle.
Exit Ticket 5 min
Provide up to 5 minutes for students to complete the Exit Ticket. It is possible to gather formative data even if some students do not complete every problem.
Teacher Note
Consider reserving time in the debrief for students to self-reflect.
• Are some angles more or less challenging to draw than others? Which angles? Why?
• What do you still need more time to practice?
4 ▸ M6 ▸ TB ▸ Lesson 6 EUREKA MATH2 Florida B.E.S.T. Edition © Great Minds PBC 140
10
Sample Solutions
Expect to see varied solution paths. Accept accurate responses, reasonable explanations, and equivalent answers for all student work.
Follow the directions to draw and name the angle. Then circle the type of angle.
1. a. Draw a point not on ⟶ CD Label it X
b. Draw ⟶ CX
c. Draw an arc to show the angle.
d. Name the angle three different ways.
b.
c. Draw a square to show the angle.
d. Name the angle three different ways.
3.
c. Draw an arc to show the angle.
d. Name the angle three different ways.
b. Draw an arc to show the angle.
c. Name the angle three different ways.
EUREKA MATH2 Florida B.E.S.T. Edition 4 ▸ M6 ▸ TB ▸ Lesson 6 © Great Minds PBC 141
EUREKA MATH2 Florida B.E.S.T. Edition 4 ▸ M6 ▸ TB ▸ Lesson 6 © Great Minds PBC 53 6 Name Date
Sample: X C D Sample: Right Acute Obtuse Straight
∠ C , ∠ DCX , ∠ XCD
⟶
2. a. Draw
KZ
Draw ⟶ KE
∠ EKZ , ∠ ZKE E KZ Right Acute Obtuse Straight
∠ K ,
a. Draw ⟶ LQ .
⟶
b. Draw
LP
L , ∠QLP , ∠PLQ QL P Right Acute Obtuse Straight
∠
4. a. Draw ∠HBT
B , ∠HBT , ∠TBH Sample: H B T Sample: Right Acute Obtuse Straight 4 ▸ M6 ▸ TB ▸ Lesson 6 EUREKA MATH2 Florida B.E.S.T. Edition © Great Minds PBC 54 PROBLEM SET 5. Complete the table. Angle Description Drawing of Angle Type of Angle Right X YZ Right Smaller than a right angle X YZ Acute Larger than a right angle X YZ Obtuse 2 rays, with
endpoints, that together make a line XY Z Straight
∠
common
6. Use the figure to complete parts (a)–(d). Use your right-angle tool to help you. Sample:
a. Name an acute angle. ∠SFQ
b. Name an obtuse angle. ∠EFW
c. Name a right angle. ∠QFG
d. Name a straight angle. ∠
4 ▸ M6 ▸ TB ▸ Lesson 6 EUREKA MATH2 Florida B.E.S.T. Edition © Great Minds PBC 142 EUREKA MATH2 Florida B.E.S.T. Edition 4 ▸ M6 ▸ TB ▸ Lesson 6 © Great Minds PBC 55 PROBLEM SET
Q S EF G W
EFG
Relate geometric figures to a real-world context.
Lesson at a Glance
Students use precise geometric terminology to identify a specific geometric figure from a set of figures. They use geometric figures to draw a floor plan of a dream home and relate geometric figures to the real-world context of a home.
There is no Problem Set in this lesson. Instead, use classroom observations and the classwork to analyze student thinking after the lesson.
Key Questions
• Why is it useful to be precise when describing figures?
• Where can you find examples of figures in the real world?
Achievement Descriptors
FL.4.Mod6.AD2 Classify angles as acute, right, obtuse, straight, or reflex. (MA.4.GR.1.1)
FL.4.Mod6.AD3 Describe angle attributes in two-dimensional figures. (MA.4.GR.1.1)
© Great Minds PBC 7 LESSON 7
EUREKA MATH2 Florida B.E.S.T. Edition 4 ▸ M6 ▸ TB ▸ Lesson 7 © Great Minds PBC 65 7 Name Date
Line segment 5 Parallel line segments 3 and 7 Perpendicular line segments 1 or 4 Right angle 1 or 4 Acute angle 6 Obtuse angle 2
1. Find an example of each figure in the floor plan. Use the numbers to complete the table.
Figure
Example in Floor plan
Figure Description
Describe the figure. Use precise language.
2. Two rays that intersect. One ray is almost horizontal. The other ray is almost vertical. One ray points to the left and one ray points mostly down. An angle arc is drawn to show an acute angle.
Living Room Patio Kitchen Entry Bedroom Closet Bathroom 2 1 3 7 5 6 4
3. Two perpendicular line segments. One line segment is horizontal. The other line segment is vertical. A right angle is labeled with a small square.
Agenda
Fluency 5 min
Launch 15 min
Learn 30 min
• Floor Plan Images
• Create a Floor Plan
Land 10 min
Materials
Teacher
• Geometric Figures Game (in the teacher edition)
• Dot Paper (in the teacher edition)
• Right-angle tool
• Straightedge
• Sample Floor Plans (in the teacher edition)
Students
• Geometric Figures Game (in the student book)
• Dot Paper (in the student book)
• Right-angle tool
• Straightedge
Lesson Preparation
• Consider whether to remove Geometric Figures Game from the student books and place them inside whiteboards in advance or have students prepare them during the lesson.
• Consider whether to remove Dot Paper from the student books in advance or have students tear them out during the lesson.
• Gather the right-angle tools created in lesson 5.
• Print the Sample Floor Plans as needed for students to use as references.
© Great Minds PBC 145 EUREKA MATH2 Florida B.E.S.T. Edition 4 ▸ M6 ▸ TB ▸ Lesson 7
Fluency
Counting on the Number Line by Halves, Thirds, Fourths, and Eighths
Students count by halves, thirds, fourths, and eighths to prepare for exploring angles as fractional turns in a circle beginning in lesson 8.
Display the number line.
What fractional unit does the number line show? Raise your hand when you know.
Wait until most students raise their hands, and then signal for students to respond.
Halves
Use the number line to count forward and back by halves to 2 halves. The first number you say is 0 halves. Ready?
Display each fraction one at a time on the number line as students count.
0 halves, 1 half, 2 halves
2 halves, 1 half, 0 halves
Now count forward and back by halves again. This time rename the fractions as whole numbers when possible. The first number you say is 0. Ready?
Display each number one at a time on the number line as students count.
0, 1 half, 1
1, 1 half, 0
Repeat the process with thirds, fourths, and eighths.
4 ▸ M6 ▸ TB ▸ Lesson 7 EUREKA MATH2 Florida B.E.S.T. Edition © Great Minds PBC 146
5 1 0 1 2 1 2 0 2 2 2
Show Me Geometric Figures: Lines and Line Segments
Students use gestures for lines and line segments, including parallel and perpendicular line segments, to activate kinesthetic memory for geometric figures from grade 3.

Let’s use our hands and arms to show a line, a line segment, and parallel and perpendicular lines. Remember, to show a line, we do this. (Show the gesture for line.)
Show me a line. (Shows gesture for line)
Arms down. (Lowers arms down to sides)
Use the descriptions and gestures provided to continue the process with the following sequence:
Parallel Lines
With elbows bent, hold forearms in front of your body, one arm stacked over the other, parallel to the floor. Keep hands open and fingers straight.

Perpendicular Lines
With elbows bent, hold one forearm in front of your body parallel to the floor and the other straight up and down, so that they cross at right angles. Keep hands open and fingers straight.
Teacher Note
Consider asking students to whisper to their partner how each gesture represents the geometric figure. For example, after “Show me parallel lines,” say, “How do you think our arms show parallel lines? Whisper your idea to your partner.”

EUREKA MATH2 Florida B.E.S.T. Edition 4 ▸ M6 ▸ TB ▸ Lesson 7 © Great Minds PBC 147
Line
Repeat the process by modeling line segment, parallel line segment, and perpendicular line segment by using the following gestures.

Line Segment

Parallel Line Segments Perpendicular Line Segments
Alternate playfully between having students show a line segment, a line, parallel lines, and perpendicular lines. Consider adding point, ray, right angle, acute angle, obtuse angle, and straight angle.

Launch Materials—T/S: Geometric Figures Game
Students play a guessing game with precise geometric terminology that helps them identify geometric figures.
Display the picture of the 16 figures and invite students to think–pair–share about what they see.
They mostly look the same, but they have different kinds of lines.
I see parallel lines, but some are vertical and some are horizontal.
There are parallel line segments, rays, and lines.
4 ▸ M6 ▸ TB ▸ Lesson 7 EUREKA MATH2 Florida B.E.S.T. Edition © Great Minds PBC 148
15 1 2 3 4 5 6 7 8 9 10 11 12 13 14 15 16
There are some pairs of perpendicular lines. I see right angles, acute angles, and obtuse angles. Invite students to remove Geometric Figures Game from their books and insert it into their whiteboards. Explain the rules of the game.
• The object of the game is to name the figure your partner circles.
• Partner A circles one of the figures on their whiteboard without letting partner B see what they circle.
• Partner B asks a question about the figure that can be answered with “yes” or “no.”
Does your figure have parallel lines?
• Partner A answers the question with “yes” or “no” and partner B uses the answer to cross out the figures that cannot be partner A’s figure.
• Partner B continues to ask questions until just one figure is left that has not been crossed out.
• Partner B circles the figure they think partner A chose, and then both partners show their whiteboards. If the circled figures do not match, partner A and partner B discuss what may have gone wrong.
• Then the two partners switch roles.
Model playing the game. Invite a student to circle one of the figures without letting you see what figure they circle. Ask the student yes or no questions to identify the figure. Consider using some of the following questions:
• Does your figure have rays? Line segments? Lines?
• Do the two lines intersect?
• Are the lines perpendicular?
• Are the lines parallel?
• Do the lines form a right angle? An acute angle? An obtuse angle?
• Are the lines vertical? Horizontal?
Invite students to turn and talk about some possible yes or no questions they might ask.
Teacher Note
While it is helpful to model what types of questions to ask, do not give away your reasoning for the strategy. It is important for students to activate their own strategic thinking throughout this game. Students will likely determine how to ask questions strategically after playing several rounds of the game.
EUREKA MATH2 Florida B.E.S.T. Edition 4 ▸ M6 ▸ TB ▸ Lesson 7 © Great Minds PBC 149
No.
Pair students. Give partners 7 minutes to play the game. Circulate as students play. Listen for students to ask questions that help them eliminate choices in a strategic way. Invite students to think–pair–share about the types of questions that were helpful to them and how they decided which questions to ask.
It was useful to first find out if they had lines, line segments, or rays, so I asked those questions first.
I asked questions that helped to get rid of many figures at once. I asked if the figure had parallel lines. Then I asked if the figure had perpendicular lines. To cross off a lot of figures, I asked if the angle had an arc.
What strategies did you use?
First, I asked about what kinds of lines it had—segments, lines, or rays—and then I narrowed it down by finding out what the lines were doing.
I asked if the lines were vertical or horizontal. Then I changed my strategy because some of the figures had lines, line segments, or rays that were both horizontal and vertical.
There were some figures that were similar, so I asked more specific questions about whether the angles were about the same size.
Once I had enough information, such as an obtuse angle, a ray, and no horizontal line, I would know the figure my partner circled.
How did using precise mathematical terminology help you?
It helped me be specific about which figure I was wondering about. There were some figures that were really similar to each other, so the precise terminology helped me to tell them apart in a way that my partner could also understand.
Transition to the next segment by framing the work.
Today, we will use the terms and figures we have learned to help create a floor plan of a home.
UDL: Action & Expression
Consider posting a list of questions, such as those used in modeling the game, for students to refer to when they play independently.
4 ▸ M6 ▸ TB ▸ Lesson 7 EUREKA MATH2 Florida B.E.S.T. Edition © Great Minds PBC 150
Learn
Floor Plan Images
Materials—T/S: Sample Floor Plans
Students identify geometric features of real-world floor plans. Display the pictures of the sample floor plans one at a time. Invite students to turn and talk about the figures they recognize.
These are floor plans of some real buildings. What do you notice and wonder about these drawings?
It seems like the thick outside lines are the walls.
I wonder if those sections shaped like blocks in the middle of walls are windows.
The doorways look like they have an angle arc like when we were labeling angles.
I think the large rectangular spaces must be the rooms; some of them are labeled.
What figures do you see in the floor plan?
Some of the walls are parallel to each other. There are perpendicular lines where the corners of the walls intersect.
Not every room is a rectangle; some of the walls show obtuse angles where they join.
The walls and windows are line segments; it doesn’t seem possible for one of the walls to stretch on forever like it would have to in a line or ray.
The doors that are just slightly open form acute angles.
Language Support
Consider clarifying for students what constitutes a floor plan. Include key features of a floor plan such as the following:
• It is a view from above.
• It only includes the outline of each space that has area. It might include what takes up space on the floor (e.g., furniture), but it does not include smaller details like objects hanging on the walls or ceilings.
• It is commonly used by people involved in building a home or other structure.
Teacher Note
This section is intended to be a general discussion about the features of real-world floor plans. Ensure that students have ample opportunity to ask questions about how to interpret the images and to get inspiration for how the geometric figures could be applied in their own floor plans.
Students may be familiar with floor plans from a grade 3 lesson.
A context video for this discussion of a floor plan is available. It may be used to facilitate the discussion and support students with additional context for the floor plan.
EUREKA MATH2 Florida B.E.S.T. Edition 4 ▸ M6 ▸ TB ▸ Lesson 7 © Great Minds PBC 151
30 © Great Minds PBC 161 This page may be reproduced for classroom use only. EUREKA MATH Florida B.E.S.T. Edition 4 M6 TB Lesson 7 Sample Floor Plans Kitchen Closet Entrance Living Room Bathroom Bedroom Dining Room Closet Master Bathroom Master Bedroom Bathroom Bedroom Patio Storage Walk-In Closet Walk-In Closet Laundry Living/Dining Room Kitchen
Create a Floor Plan
Materials—T/S: Dot Paper, right-angle tool, straightedge
Students examine the requirements of the project, draw a floor plan of a home using their knowledge of geometric figures, and discuss their floor plan and its features with a partner.
Direct students to remove Dot Paper from their books. Tell students that they will create a floor plan of their dream home. Explain that the floor plans should be well organized and creative and must include certain figures.
Direct students to problems 1 and 2 in their books and read the problems chorally with the class.
1. Use dot paper to create a floor plan of a home. Follow these guidelines:
Include only one level. Do not include stairs. Use straight line segments. Include hallways.
Include at least one example of each figure listed in the table. Label each room.
Promoting the Mathematical Thinking and Reasoning Standards
When students create a floor plan and identify geometric figures in it, they are applying mathematics to real-world contexts (MTR.7)
Ask the following questions to promote MTR.7:
• What do perpendicular line segments mean in your floor plan?
• How are different-size angles represented in your floor plan?
4 ▸ M6 ▸ TB ▸ Lesson 7 EUREKA MATH2 Florida B.E.S.T. Edition © Great Minds PBC 152
2. Use your floor plan to complete the table.
Sample: ✓ Figure Example of the Figure in the Floor Plan ✓ Line segment
There are line segments along the outside walls. ✓ Parallel line segments
Walls on opposite sides of the room are parallel line segments. ✓ Perpendicular line segments
The two walls in the corner are perpendicular.
Right angle
The two walls form a right angle where they meet in the corner.
Acute angle
The doorway is partly open and forms an acute angle.
Obtuse angle
There is an obtuse angle in the corner of the nonrectangular room.
EUREKA MATH2 Florida B.E.S.T. Edition 4 ▸ M6 ▸ TB ▸ Lesson 7 © Great Minds PBC 153
✓
✓
✓
Invite students to name the types of rooms that could be in the home. Consider making a list of rooms as students name them.
Display a sheet of dot paper and begin drawing a floor plan. Think aloud as you draw. Consider providing the following directions:
• I start by deciding how big the outline of my home will be. I’ll draw a rectangle. My rectangle has parallel sides and perpendicular sides.
• Next, I think about my rooms and draw lines to show where the rooms are. I need to show where the doors are too.
• I could draw a small square to mark a right angle to indicate that the sides are perpendicular, but the dots also help to show that it is a right angle. I don’t have to draw a small square to show every right angle.
• I could make arrow marks to show that the walls are parallel, but the dots help to show that too.
• I’ll put an acute angle where the door opens.
Distribute the straightedges and right-angle tools. Provide students time to work on their floor plans and to use their floor plans to complete problem 2. Circulate and provide support as needed. Invite students to explain parts of their floor plan by using precise terminology. Ask the following questions:
• Where in your floor plan do you have a ?
• I see that you are missing a in your floor plan. How could you include a ?
Invite students to turn and talk to share their floor plans with a partner or small group. Direct them to explain how they included figures in their plans. Identify a few students to share their plans with the whole class.
Differentiation: Support
Consider providing a frame for the home that students can fill with rooms.
4 ▸ M6 ▸ TB ▸ Lesson 7 EUREKA MATH2 Florida B.E.S.T. Edition © Great Minds PBC 154
The student work samples demonstrate different ways to create a floor plan.
Rectilinear Outline
Nonrectilinear Outline
Bedroom
Kitchen Living Room
Kitchen Living Room Bedroom Bedroom
Gather the class and invite the students you identified to share their solutions one at a time. Consider ordering shared student work from rectilinear homes to homes that are nonrectilinear.
As each student shares, ask questions to elicit their thinking and clarify where each figure is shown in their floor plan. Ask the class questions to make connections between the presented floor plan and their work and encourage students to ask questions of their own.
Differentiation: Challenge
Challenge students to create a second-floor plan of another home, office, or store. Ask them to consider what types of rooms would be in the floor plan and where entrances and exits should be placed.
EUREKA MATH2 Florida B.E.S.T. Edition 4 ▸ M6 ▸ TB ▸ Lesson 7 © Great Minds PBC 155
Rectilinear Outline (Casey’s Way)
Casey, tell us about your floor plan.
It has a living room, a kitchen, a bedroom, a closet, and a bathroom. The outline of the home is square.
What figures are represented in Casey’s floor plan?
There are parallel and perpendicular line segments. The wall between the bedroom and the kitchen is parallel to the outside walls on the sides. It is perpendicular to the wall with the back door.
The doorways and the way that they open can show examples of acute and obtuse angles, depending on whether you look at the opening you walk through or the space behind the door.
Invite students to turn and talk about the similarities and differences between Casey’s work and their work.
Nonrectilinear Outline (Robin’s Way)
Robin, tell us about your floor plan.
I wanted to have one of the bedrooms off on its own, so I made it in a different kind of shape that isn’t a rectangle. There is also a main living room and big kitchen.
What kinds of figures are represented in Robin’s floor plan?
There are many pairs of parallel and perpendicular line segments. The walls at each end of the bathtub are parallel line segments. The two walls by the front door are perpendicular line segments. One bedroom has a slanted wall that forms obtuse angles at the corners.
The rest of the corners are right angles because they are the intersection of two perpendicular line segments.
4 ▸ M6 ▸ TB ▸ Lesson 7 EUREKA MATH2 Florida B.E.S.T. Edition © Great Minds PBC 156
Kitchen Living Room Bedroom Kitchen Living Room Bedroom Bedroom
How is Robin’s work similar to Casey’s work? How is it different?
Both have parallel and perpendicular line segments for the outside walls and some of the inside walls.
They both have many right angles because of so many perpendicular line segments. Robin’s floor plan has an obtuse angle where there is a slanted wall.
Casey has the doors open less, so they look like acute angles. Robin’s doors look like right angles.
Invite students to turn and talk about the similarities and differences between Robin’s floor plan and their work.
Land
Debrief 5 min
Objective: Relate geometric figures to a real-world context.
Use the following prompts to facilitate a discussion about relating geometric figures to the real world.
Where can you find examples of figures in the real world?
There are examples of figures in homes. We saw some examples in our floor plans.
How did you apply your knowledge of figures today?
I used precise language to decide what kind of figure my partner chose in the game.
I drew a floor plan of a home that included examples of line segments, parallel lines, perpendicular lines, right angles, obtuse angles, and acute angles.
Why is it useful to be precise when describing figures?
Being precise helps us to be clearer about the figures so they are easier to picture. Precise language helps to better describe exactly what the figures look like.
EUREKA MATH2 Florida B.E.S.T. Edition 4 ▸ M6 ▸ TB ▸ Lesson 7 © Great Minds PBC 157
10
How did your knowledge of figures help you draw your floor plan?
I made right angles where two walls meet at a corner.
I made an obtuse angle by having a large open section of my home.
I knew if the door was open a little, it would be an acute angle.
Exit Ticket 5 min
Provide up to 5 minutes for students to complete the Exit Ticket. It is possible to gather formative data even if some students do not complete every problem.
4 ▸ M6 ▸ TB ▸ Lesson 7 EUREKA MATH2 Florida B.E.S.T. Edition © Great Minds PBC 158
© Great Minds PBC 159 This page may be reproduced for classroom use only. EUREKA MATH2 Florida B.E.S.T. Edition 4 ▸ M6 ▸ TB ▸ Lesson 7 ▸ Geometric Figures Game 1 2 3 4 5 6 7 8 9 10 11 12 13 14 15 16
© Great Minds PBC 160 This page may be reproduced for classroom use only. 4 ▸ M6 ▸ TB ▸ Lesson 7 ▸ Dot Paper EUREKA MATH2 Florida B.E.S.T. Edition
© Great Minds PBC 161 This page may be reproduced for classroom use only. EUREKA MATH2 Florida B.E.S.T. Edition 4 ▸ M6 ▸ TB ▸ Lesson 7 ▸ Sample Floor Plans Kitchen Closet Entrance Living R oom Bathroom Bedroom Dining R oom Closet Master Bathroom Master Bedroom Bathroom Bedroom P atio Storag e W alk-In Closet W alk-In Closet Laundr y Living/Dining R oom Kitchen
Explore angles as fractional turns through a circle.
Lesson at a Glance
Students construct an angle-maker tool by using two cardstock circles. They use the tool to make angles of various sizes and see that an angle can be understood as a fractional turn through a circle. This lesson formalizes the term reflex angle.
Key Question
• How are angles and fractions of a circle related?
Achievement Descriptor
FL.4.Mod6.AD2 Classify angles as acute, right, obtuse, straight, or reflex. (MA.4.GR.1.1)
© Great Minds PBC 8 LESSON 8
EUREKA MATH2 Florida B.E.S.T. Edition 4 ▸ M6 ▸ TB ▸ Lesson 8 © Great Minds PBC 71 8 Name Date Complete the table. Figure Fraction of 1 Whole Turn Angle Type 1 4 or 2 8 Right 3 8 Obtuse 1 2 or 2 4 or 4 8 Straight 7 8 Reflex
Agenda
Fluency 10 min
Launch 5 min
Learn 35 min
• Construct an Angle-Maker Tool
• A Turn Through a Fraction of a Circle
• Name Angle Types
• Problem Set
Land 10 min
Materials Teacher
• Cardstock circles, 4ʺ diameter, red
• Cardstock circles, 4ʺ diameter, white
• Scissors
• Marker
• Straightedge Students
• Scissors
• Marker
• Straightedge
Lesson Preparation
• Prepare enough cardstock circles for one red circle and one white circle for each student and the teacher.
• Save the angle-maker tools, made from the cardstock circles during the lesson, for use in lesson 9.
© Great Minds PBC 163 EUREKA MATH2 Florida B.E.S.T. Edition 4 ▸ M6 ▸ TB ▸ Lesson 8
Fluency
Whiteboard Exchange: Add or Subtract Whole Numbers
Students add or subtract whole numbers to maintain procedural fluency with the operations.
Display 754,454 + 39,218 = .
Complete the equation.
Give students time to work. When most students are ready, signal for students to show their whiteboards. Provide immediate and specific feedback. If students need to revise, briefly return to validate their corrections.
Display the answer.
Repeat the process with the following sequence:
4 ▸ M6 ▸ TB ▸ Lesson 8 EUREKA MATH2 Florida B.E.S.T. Edition © Great Minds PBC 164
108,215 + 524,379 = 839,099 – 27,160 = 959,943 – 368,872 = 591,071 811,939 632,594 10 754,454 + 39,218 =793,672
Whiteboard Exchange: Geometric Terms and Notations
Students say and write names for a point, line segment, line, or ray to build familiarity with geometric figures.
Display point A.
What is the name of the figure? Raise your hand when you know.
Wait until most students raise their hands, and then signal for students to respond. point A
Display the name of the figure.
Record the notation for point A.
Give students time to work. When most students are ready, signal for students to show their whiteboards. Provide immediate and specific feedback. If students need to revise, briefly return to validate their corrections.
Display the answer.
Repeat the process with the following sequence:
EUREKA MATH2 Florida B.E.S.T. Edition 4 ▸ M6 ▸ TB ▸ Lesson 8 © Great Minds PBC 165
BC DE J K G H FG Q R S P N L M T U line segment BC or line segment CB BC or CB line DE or line ED DE or ED line JK or line KJ JK or KJ line PQ or line QP PQ or QP point N N ray ML ML line segment GH or line segment HG GH or HG ray FG FG ray TU TU line segment RS or line segment SR RS or SR A point A A
Show Me Geometric Figures: Angles
Students use gestures for acute angle, right angle, obtuse angle, and straight angle to build kinesthetic memory for geometric figures.
Let’s use our hands and arms to show types of angles. Remember, to show a right angle, we do this. (Hold one arm straight out to the side, parallel to the floor, and the other arm straight overhead. Keep hands open and fingers straight.)
Show me a right angle. (Shows gesture for right angle)
Arms down. (Lowers arms down to sides)
Use the gestures provided to continue the process with the following sequence:
Right Angle
Teacher Note
Consider asking students to show different variations of each type of angle. For example, if you say, “Show me another right angle,” students can switch the position of their arms so that the angle opens in the opposite direction.
• Students may adjust the distance between their arms to show obtuse or acute angles with different measurements.
• Students may tilt their arms and body to show straight angles in different orientations.


Alternate playfully among the four types of angles.

4 ▸ M6 ▸ TB ▸ Lesson 8 EUREKA MATH2 Florida B.E.S.T. Edition © Great Minds PBC 166
Obtuse Angle Acute Angle Straight Angle
Launch
Students study a model of a fraction and consider its relationship to angles.
Display the picture of the fraction circle.
What do you notice about the picture?
It is a circle that is partitioned into 8 parts.
1 of the parts is shaded and 7 are not.
1 8 of the circle is shaded.
Display the picture with an arc at the vertex of the shaded part.
What do you notice about the picture now?
There is an arc in the shaded part of the circle.
Now I notice that each eighth has an angle.
What type of angle is shown in the shaded part? How do you know?
An acute angle. It is smaller than a right angle.
Invite students to think–pair–share about other angles they see in the picture.
I see the same acute angle repeated 8 times.
If you combine two of the parts, it makes a right angle.
I can see an obtuse angle if you put 3 8 together.
Half of the circle makes a straight angle.
Invite students to turn and talk about how they think angles and fractions of a circle could be related.
Transition to the next segment by framing the work.
Today, we will learn about the relationship between angles and fractions of a circle.
EUREKA MATH2 Florida B.E.S.T. Edition 4 ▸ M6 ▸ TB ▸ Lesson 8 © Great Minds PBC 167
5
Learn Construct an Angle-Maker Tool
Materials—T/S: Circles, scissors, marker, straightedge Students construct an angle-maker tool and use it to show angles.
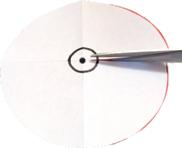
Distribute 1 white circle and 1 red circle to each student. Guide students to create an angle-maker tool by using the following sequence:
Let’s create a tool that we can use to show different angles. Guide students to fold the white circle in half and then in half again, forming a right-angle tool. Unfold the paper and draw a dot in the center of the circle. Direct students to do the same.
What type of angle do you see on the circle?
I see 4 right angles.
Let’s draw a circle, about the size of a quarter, around the center of the circle. It will help us see angles when our tool is complete. Draw the circle and have students do the same. Direct students to stack their circles together with the white circle on top. Then have them cut through both circles along one of the fold lines from the outside edge just to the center of the circle.
4 ▸ M6 ▸ TB ▸ Lesson 8 EUREKA MATH2 Florida B.E.S.T. Edition © Great Minds PBC 168
35
Then use a straightedge and marker to trace the top edge of each cut. Have students do the same.
Hold the red circle in your left hand and the white circle in your right hand with the cuts facing each other. Join the two circles by sliding the white circle toward the red circle so their cuts overlap. Direct students to do the same.
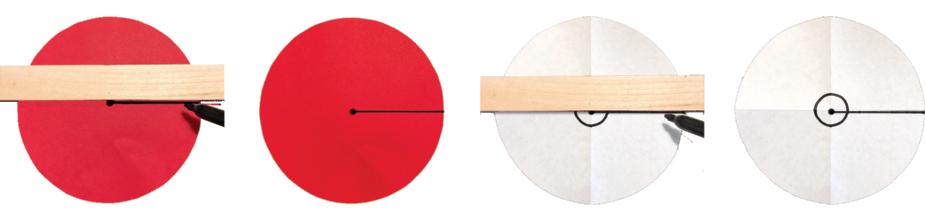
Demonstrate how to show an angle by pinching the white circle and turning it counterclockwise through the cut in the red circle. Show an acute angle.
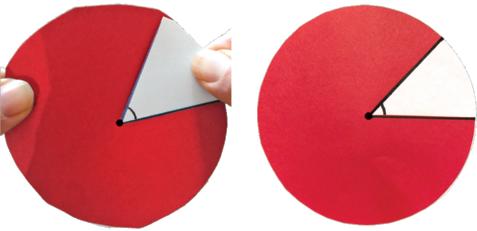
What type of angle did I make?
Acute angle
Prompt students to use their angle-maker tool to make an angle similar in size to your angle. Then invite them to make angles of various sizes. Invite students to turn and talk about how to make a right, an obtuse, and a straight angle with their tool.
EUREKA MATH2 Florida B.E.S.T. Edition 4 ▸ M6 ▸ TB ▸ Lesson 8 © Great Minds PBC 169
A Turn Through a Fraction of a Circle
Materials—T/S: Angle-maker tool
Students reason about the number of fractional turns needed to make 1 whole turn.
Turn the white circle to make a right angle and display it for students.
What fraction of the circle is white?
1
4
We just made a quarter turn because the angle turned, or rotated, through 1 quarter of the circle. Use your tool to show a 1 _ 4 turn.
What type of angle do we make with a 1 _ 4 turn?
Right angle
Let’s show a 2 _ 4 turn and see what type of angle we make.
Demonstrate a 2 4 turn and have students do the same.
What fraction of the circle is white?
Teacher Note
The whole turn to make a complete circle is sometimes referred to as a full turn.
Teacher Note
As students turn the white circle, the fold lines should guide them as they make each 1 __ 4 turn. It is not necessary for students to manipulate these tools with absolute precision. The tool is intended for students to begin to recognize an angle as a fraction of a whole turn through a circle.
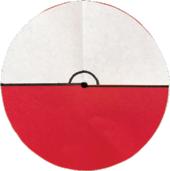
Differentiation: Support
2
_ 4 or 1 _ 2
What type of angle do we have after a 2 _ 4 turn?
Straight angle
Let’s show a 3 _ 4 turn and see what type of angle we make.
Demonstrate a 3 4 turn and have students do the same.
What fraction of the circle is white?
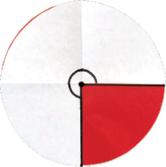
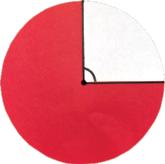
Do we know the name of this type of angle? Explain.
No. It’s not an acute angle, a right angle, or a straight angle.
No. It can’t be an obtuse angle because it is larger than a straight angle.
Consider cocreating a chart with students that has circles shaded to represent the fractional turns they make with the angle-maker tool. This will allow students to have a visual reference of each turn and the type of angle that is formed.
4 ▸ M6 ▸ TB ▸ Lesson 8 EUREKA MATH2 Florida B.E.S.T. Edition © Great Minds PBC 170
3 4
This is an example of another type of angle. It is a reflex angle. A reflex angle is an angle that is larger than a straight angle and smaller than a full rotation through the circle.
Invite students to think–pair–share about what they think a full rotation through the circle looks like and how they could show that with their angle-maker tool.
We could keep turning the white circle until it rotates all the way around.
The whole circle will be white.
Demonstrate a 4 4 turn and have students do the same.
What fraction of the circle is white?
4
4
How many 1 _ 4 turns did it take to complete 1 whole turn, or rotation?
4
Invite students to turn and talk about why it takes four 1 _ 4 turns to complete 1 whole turn.
Direct students to remove the white circle from their angle-maker tool and fold it again to make 8 equal parts. Demonstrate the folding for students by folding to make a right-angle tool and then folding one more time.
Language Support
Consider adding reflex angle to the anchor chart created in lesson 5.
A reflex angle is an angle that is larger than a straight angle and smaller than a full rotation, or whole turn.
Direct students to recreate the angle-maker tool by sliding the white circle and the red circle back together.
Do you think a 1 _ 8 turn has a bigger or smaller angle than a 1 _ 4 turn? Why?
Smaller because 1 8 is a smaller fraction than 1 4 .
Teacher Note
Students may be curious about how to name an angle that makes a whole circle. These angles are often referred to as complete angles or full angles. However, it is not necessary to formally introduce this term.
EUREKA MATH2 Florida B.E.S.T. Edition 4 ▸ M6 ▸ TB ▸ Lesson 8 © Great Minds PBC 171
RS P
Demonstrate a 1 8 turn and have students do the same. Prompt students to name the angle as an acute, a right, an obtuse, a straight, or a reflex angle. Repeat the process for 2 8 , 3 8 , 4 8 , 5 8 , 6 8 , 7 8 , and 8 8 .

Differentiation: Challenge
Consider inviting students to show an angle that is formed by a 1 3 turn and then a 2 3 turn. Prompt them to explain how they know each turn represents 1 3 . Have students consider whether it is possible to show an acute angle by using a 1 3 turn and have them explain their reasoning.
Does it take more 1 _ 8 turns or 1 _ 4 turns to make 1 whole turn?
It takes more 1 8 turns to make 1 whole turn.
How many 1 _ 8 turns does it take to make 1 whole turn? 8
Prompt students to work with a partner to show what they think a 1 100 turn would look like.
How many 1 ___ 100 turns would it take to make 1 whole turn? 100
Invite students to turn and talk about other fractional turns they could show.
Promoting the Mathematical Thinking and Reasoning Standards
Students use patterns and structure (MTR.5) when they apply their understanding of the relationship between fractional turns and angles to identify angle types and determine how many fractional turns make 1 whole turn.
Ask the following questions to promote MTR.5:
• How are fractional turns and angles related? How can this relationship help you identify acute and obtuse angles?
• How can you use what angles and fractional turns have in common to help you identify acute and obtuse angles?
4 ▸ M6 ▸ TB ▸ Lesson 8 EUREKA MATH2 Florida B.E.S.T. Edition © Great Minds PBC 172
Name Angle Types
Students use the angle-maker tool to show angles of various sizes and name them as acute, right, obtuse, straight, or reflex angles.
Show an acute angle by using the angle-maker tool.
What type of angle is this?
Acute angle
Prompt students to show their partners a different acute angle.
Where on the angle-maker tool do we see acute angles? Use your finger to show your partner.
Allow time for students to point.
Then show an obtuse angle.
What type of angle is this?
Obtuse angle
Prompt students to show a different obtuse angle to their partners.
Where on the angle-maker tool do we see obtuse angles? Use your finger to show your partner.
Allow time for students to point.
Then show a reflex angle.
What type of angle is this?
Reflex angle
Prompt students to show a different reflex angle to their partners.
Where on the angle-maker tool do we see reflex angles? Use your finger to show your partner.
Allow time for students to point.
UDL: Representation
Consider creating a visual as a reference to help students identify types of angles based on their location on the angle-maker tool. Label the location of acute, obtuse, and reflex angles and encourage students to reference the chart as they confirm angle types.
EUREKA MATH2 Florida B.E.S.T. Edition 4 ▸ M6 ▸ TB ▸ Lesson 8 © Great Minds PBC 173
As I make an angle, you say the type of angle you see by stretching out the word, then stop when the type of angle changes. It should sound like, acuuuute, right. When we make a complete rotation, we will say whole turn.
Begin slowly turning the angle counterclockwise and stop at a right angle, as students say the following:
Acuuuute, right
Continue slowly turning the angle and stop at a straight angle, as students say the following:
Obtuuuuse, straight
Continue slowly turning the angle and stop at 1 whole turn, as students say the following: Refleeeex, whole turn
Repeat the process, this time turning clockwise from a whole turn back to an acute angle, as students say the following:
Whole turn, Refleeeex, Straight, Obtuuuuse, Right, Acuuuute
Invite students to turn and talk about which angle type is represented the most on the circle: acute, right, straight, obtuse, or reflex.
Problem Set
Differentiate the set by selecting problems for students to finish independently within the timeframe. Problems are organized from simple to complex.
4 ▸ M6 ▸ TB ▸ Lesson 8 EUREKA MATH2 Florida B.E.S.T. Edition © Great Minds PBC 174
Land
Debrief 5 min
Objective: Explore angles as fractional turns through a circle.
Use the following prompts to guide a discussion about the relationship between an angle and a fraction of a turn through a circle. Display an angle-maker tool that shows a quarter turn.
What type of angle do we make with a quarter turn? Right
How many quarter turns do we need to make to equal 1 whole turn? 4
How many eighth turns do we need to make to equal 1 whole turn?
8
Which turn has a larger angle, a 3 _ 8 turn or a 3 _ 4 turn? Why?
A 3 _ 4 turn has a larger angle because 3 _ 4 is a larger fraction than 3 _ 8 .
Which turn has a reflex angle, a 3 _ 8 turn or a 3 _ 4 turn? How do you know?
A 3 4 turn has a reflex angle because 3 4 is larger than 1 2 but less than 1.
How are angles and fractional turns related?
The angle-maker tool helps us make a fractional turn and shows us an angle. The bigger the fractional turn, the bigger the angle. The smaller the fractional turn, the smaller the angle.
They are related because when you make a fractional turn, you have an angle. Thinking about the fractional turn helps us identify the type of angle.
Exit Ticket 5
min
Provide up to 5 minutes for students to complete the Exit Ticket. It is possible to gather formative data even if some students do not complete every problem.
EUREKA MATH2 Florida B.E.S.T. Edition 4 ▸ M6 ▸ TB ▸ Lesson 8 © Great Minds PBC 175
10
Sample Solutions
Expect to see varied solution paths. Accept accurate responses, reasonable explanations, and equivalent answers for all student work.
4. Can you make an obtuse angle when you turn by fourths? How do you know? No. 1 4 turn makes a right angle. 2 4 turn makes a straight angle. 3 4 turn makes a reflex angle.
1. The blue figure turns 1 4 of 1 whole turn each time. Count by fourths to label the fraction of 1 whole turn.
5. Draw and shade to show each fraction of 1 whole turn. Then write the type of angle. The first one is done for you.
2. The blue figure turns 1 8 of 1 whole turn each time. Count by eighths to label the fraction of 1 whole turn.
6. Carla says that
of 1 whole turn are the same angle. Do you agree? Use the circles to help explain your answer.
3. What fractional turn makes a straight angle? Use problems 1 and 2 to help you.
fourths:
Yes, I agree with Carla. Both 3 4 and 6 8 are the same angle because they both represent the same fraction of 1 whole turn. They are equivalent fractions.
4 ▸ M6 ▸ TB ▸ Lesson 8 EUREKA MATH2 Florida B.E.S.T. Edition © Great Minds PBC 176
EUREKA MATH2 Florida B.E.S.T. Edition 4 ▸ M6 ▸ TB ▸ Lesson 8 © Great Minds PBC 67 8 Name Date
1 4 2 4 3 4 4 4
1 8 2 8 3 8 4 8 5 8 6 8 7 8 8 8
2 4
4 8 4 ▸ M6 ▸ TB ▸ Lesson 8 EUREKA MATH2 Florida B.E.S.T. Edition © Great Minds PBC 68 PROBLEM SET
eighths:
Fraction of 1 Whole Turn 1 4 3 4 1 8 4 8 Figure Angle Type Right Reflex Acute Straight
3 4
6 8
6 8 3 4
and
7. Are there more quarter turns or eighth turns in 1 whole turn? How do you know?
There are more eighth turns. There are 8 eighth turns and 4 quarter turns in 1 whole turn.
EUREKA MATH2 Florida B.E.S.T. Edition 4 ▸ M6 ▸ TB ▸ Lesson 8 © Great Minds PBC 177 EUREKA MATH2 Florida B.E.S.T. Edition 4 ▸ M6 ▸ TB ▸ Lesson 8 © Great Minds PBC 69 PROBLEM SET
Use a circular protractor to recognize a 1° angle as a turn through 1 ___ 360 of a circle.
Lesson at a Glance
Students use their angle-maker tools and circular protractors to make and measure angles of various sizes. They use a protractor to see that a turn through 1 360 of a circle is the same measure as a 1° angle. Students begin to recognize benchmark angles and describe them as a number of degrees and as a fraction of a turn through a circle. This lesson formalizes the term degree.
Key Questions
• What is a protractor used for?
• How are 1° and a turn through 1 360 of a circle related?
Achievement Descriptors
FL.4.Mod6.AD2 Classify angles as acute, right, obtuse, straight, or reflex. (MA.4.GR.1.1)
FL.4.Mod6.AD5 Measure and draw angles in degrees. (MA.4.GR.1.2)
© Great Minds PBC 9 LESSON 9
EUREKA MATH2 Florida B.E.S.T. Edition 4 ▸ M6 ▸ TB ▸ Lesson 9 © Great Minds PBC 83 9 Name Date 1. What fraction of a turn is 1 degree? 1 360 2. Use the angle shown on the protractor to complete parts (a) and (b). 170 160 150 140 130 120 110 100 90 80 70 60 50 40 30 20 10 0 1 8 0 1 90 200 210 220 230 240 250 260 270 280 290 300 310 320 330 340 350 a. What is the measure of the angle? 90° b. What fraction of a whole turn is shown? Explain how you know. 1 4 of a whole turn is shown. The angle is a right angle. There are 4 right angles in a whole turn, so each right angle is 1 4 of a whole turn.
Agenda
Fluency 10 min
Launch 5 min
Learn 35 min
• What is a Protractor?
• Use a Protractor to Measure Angles
• Benchmark Angles
• Problem Set
Land 10 min
Materials Teacher
• Circular Protractor (in the teacher edition)
• Angle-maker tool Students
• Circular Protractor (in the student book)
• Angle-maker tool.
Lesson Preparation
• Consider whether to remove Circular Protractor from the student books in advance or have students tear them out during the lesson.
• Gather the angle-maker tools created in lesson 8.
© Great Minds PBC 179 EUREKA MATH2 Florida B.E.S.T. Edition 4 ▸ M6 ▸ TB ▸ Lesson 9
Fluency
Whiteboard Exchange: Add or Subtract Whole Numbers
Students add or subtract whole numbers to maintain procedural fluency with the operations.
Display 758,194 + 35,478 = .
Complete the equation.
Give students time to work. When most students are ready, signal for students to show their whiteboards. Provide immediate and specific feedback. If students need to revise, briefly return to validate their corrections.
Display the answer.
Repeat the process with the following sequence:
Whiteboard Exchange: Geometric Terms and Notations
Students say and write the names for an angle to build familiarity with geometric figures.
After each prompt for a written response, give students time to work. When most students are ready, signal for students to show their whiteboards. Provide immediate and specific feedback. If students need to revise, briefly return to validate their corrections.
4 ▸ M6 ▸ TB ▸ Lesson 9 EUREKA MATH2 Florida B.E.S.T. Edition © Great Minds PBC 180
438,615 + 193,979 = 839,014 – 27,075 = 960,043 – 368,972 = 632,594 811,939 591,071
10 758,194 + 35,478 = 793,672
Display ∠BAC.
Write the name of the angle using 1 point.
Display the answer.
Write the name of the angle two other ways using all 3 points.
Display the answer.
Repeat the process with following sequence:
Show Me Geometric Figures: Point, Ray, Line Segment, and Line
Students use gestures for point, ray, line segment, and line to activate kinesthetic memory for geometric figures.

Let’s use our hands and arms to show a point, a ray, a line segment, and a line. Remember, to show a point, we do this. (Make a fist with one hand.)
Show me a point. (Shows gesture for point)
Arms down. (Lowers arms down to sides)
EUREKA MATH2 Florida B.E.S.T. Edition 4 ▸ M6 ▸ TB ▸ Lesson 9 © Great Minds PBC 181
XY Z N L P S R T S Q R ∠T ∠STR ∠RTS ∠N ∠PNL ∠LNP ∠Y ∠ZYX ∠XYZ ∠S ∠RSQ ∠QSR B AC ∠A ∠BAC ∠CAB
Point
Use the gestures provided to continue the process with the following sequence:

Line Segment Ray Line
Alternate playfully among the four figures. Encourage students to show different variations of each type of figure each time.


Launch
Students study pictures of various protractors and notice and wonder about them.
Display the picture of the three protractors.
4 ▸ M6 ▸ TB ▸ Lesson 9 EUREKA MATH2 Florida B.E.S.T. Edition © Great Minds PBC 182
90 100 110 120 130 140 150 160 170 18 0 019 020 021 022 023 024 052 026 027 028 029 030 031 203 033 034 035 0 10 20 30 40 50 60 70 80 36 0 90 100 110 120 130 140 150 160 170 18 0 019 020 021 022 023 024 025 026 027 802 029 030 031 032 033 034 035 0 10 20 30 40 50 60 70 80 90 010 011 201 013 014 015 601 017 18 0 190 200 210 220 230240 250 260 270 280 290 300 310 320 330 340 350 0 10 20 30 40 50 60 70 80 027 026 052 024 032 022 021 020 019 18 0 170 160 150 140 130 120 110 100 90 80 70 60 50 40 30 20 10 0 035 034 033 032 031 003 092 028 5
Invite students to turn and talk about what they notice and wonder about the pictures. Then lead a discussion that elicits student thinking about the pictures.
What do you notice?
They all have numbers that wrap around the edge, but the numbers are a little different. The third one has two sets of numbers and the first one has both 0 and 360 at the same location.
In the first picture, the numbers 0, 90, 180, and 270 are larger than the other numbers.
In the first and third picture, the whole circle is partitioned into fourths. The circle in the second picture is partitioned into many more parts.
The second and third pictures both have tick marks in between each number.
The numbers and lines remind me of a number line.
What do you wonder?
I wonder what these things are called.
I wonder what they are used for.
I wonder why one of them has two sets of numbers.
They look like rulers. I wonder if they are used to measure.
Transition to the next segment by framing the work.
These objects are measurement tools. Today, we will learn what these tools measure and we will use them to measure.
EUREKA MATH2 Florida B.E.S.T. Edition 4 ▸ M6 ▸ TB ▸ Lesson 9 © Great Minds PBC 183
Learn
What is a Protractor?
Materials—T/S: Circular Protractor, angle-maker tool
Students recognize a protractor as a tool for measuring angles.
Invite students to think–pair–share about familiar tools they use when they want to measure something.
We use a ruler to measure the length of something.
We use a thermometer to measure how hot or cold something is.
We use a scale to measure the weight of an object.
We use a clock to measure an amount of time.
Display the circular protractor.
This is another tool used for measuring. It is called a protractor. A protractor is a tool used to measure angles.
Direct students to remove Circular Protractor from their books. Invite them to study the protractor and then turn and talk about how a protractor is similar to and different from other tools used for measuring.
Set your protractors down to match mine so the 90 on top is the farthest away from you.
Prompt students to put their fingers at the center of the protractors where the perpendicular line segments meet, then drag their fingers to the right, along the line segment.
What number do you see at the end of this line segment?
Let’s call this the zero line of our protractor. It is going to help us when we measure angles.
Consider creating an anchor chart with familiar tools for measuring, and then add the protractor to it. As different types of protractors are introduced in subsequent lessons, add pictures to the anchor chart.
4 ▸ M6 ▸ TB ▸ Lesson 9 EUREKA MATH2 Florida B.E.S.T. Edition © Great Minds PBC 184
0
35 Language Support
100 90 80 70 60 50 40 30 20 10 0
Prompt students to put their fingers back on the zero line, at the right near the 0. Direct students to trace left along the zero line, back to where the perpendicular line segments meet, and then up along the line segment moving to the top of the protractor.
What type of angle did you draw with your finger?
A right angle
What number do you see at the top of the line segment?
90
Prompt students to put their fingers back on the zero line, at the right near the 0. Direct students to trace along the zero line all the way to the left of the protractor.
What type of angle did you draw with your finger?
A straight angle
What number do you see at the left of the line segment?
180
Prompt students to point to 0 and slowly drag their fingers counterclockwise, around the protractor. As they move their fingers, have students count by tens from 0 to 350 in their heads.
What is the smallest number that is labeled on the protractor? What is the largest?
0, 350
350 is the last number that is printed on the protractor, but what numbers do the tick marks after the 350 represent?
Those tick marks represent numbers larger than 350, such as 351, 352, and 353.
Point to the tick mark labeled 350.
Let’s count on from 350 to determine the largest number represented on the protractor. Count with me.
Chorally count from 351 to 359, pointing to each tick mark as you say the number. Pause at 359.
Differentiation: Support
Support students who count up or down in the wrong direction when naming angle measures. Consider using the following prompts from this example:
• Which two tens is the tick mark between?
• Is it more than halfway or less than halfway to 9 tens?
• Does it make sense to identify this tick mark as 93? Why?
EUREKA MATH2 Florida B.E.S.T. Edition 4 ▸ M6 ▸ TB ▸ Lesson 9 © Great Minds PBC 185
170 160 150 140 130 120 110 100 90 80 70 60 50 40 30
What number is represented by this last tick mark?
359
What is one more than 359?
360
Do you see 360 on the protractor?
No.
What is the label on the next tick mark after 359? 0
Direct students to point to the tick mark labeled as 0.
The tick mark labeled as 0 represents two numbers. It represents 0, but it also represents 360. When we start counting, we use 0. When we count on from 359, we use 360.
Display the protractor and use a pointed object to point to various numbers. Ask students what number you are pointing to. Begin with multiples of 10, then multiples of 5, and then ones. Consider a sequence with numbers similar to the following:
30, 120, 195, 25, 87
Then say a number and direct students to use their pencil tips to point to the number on their protractor. As students point, circulate and check for understanding. Consider a sequence of numbers similar to the following:
50, 190, 235, 46, 9
Prompt students to place their angle-maker tools on top of their circular protractors. Support students in centering the angle-maker tool on the protractor so that the center of the anglemaker tool is directly above the center of the protractor and the black line of the red circle is on top of the zero line and next to the 0 on the protractor.
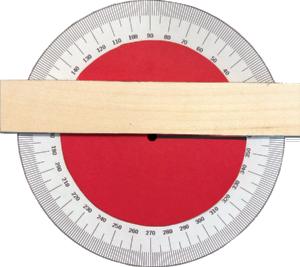
Direct students to show their partners where on the red circle all the acute angles are. Then invite students to turn and talk about the numbers on the protractor that represent the acute angles (i.e., numbers between 0 and 90). Repeat the process for obtuse angles (i.e., numbers between 90 and 180) and reflex angles (i.e., numbers between 180 and 360).
Teacher Note
Aligning the angle-maker tool in the correct location on the circular protractor can be challenging. Consider using a straightedge, laid on top, to help line up the black line of the angle-maker tool with the zero line of the protractor.
Alternatively, you can fold both the angle-maker tool and the protractor in half, from top to bottom. This way the fold marks can be lined up with one another to align the tools correctly.
Teacher Note
The Circles and Angles interactive allows students to represent angles and their measures in terms of degrees and as a fraction of a turn through a circle.
Consider demonstrating the activity for the whole class or allowing students to experiment with the tool individually.
4 ▸ M6 ▸ TB ▸ Lesson 9 EUREKA MATH2 Florida B.E.S.T. Edition © Great Minds PBC 186
Use a Protractor to Measure Angles
Students use a protractor to recognize a turn through 1 ___ 360 of a circle as a 1° angle and determine the measure of different angles.
In our last lesson, how did we show a 1 _ 4 turn?
We turned the circles so that the white part was covering 1 4 of the red circle.
How many 1 _ 4 turns does it take to make 1 whole turn?
4
Repeat the question for a 1 8 turn, a 1 12 turn, and a 1 100 turn.
What would a 1 ___ 360 turn look like?
Just a tiny sliver of the white part would be showing. It would be an even smaller angle than a 1 100 turn.
How many 1 ___ 360 turns are in 1 whole turn?
360
We have a special name for an angle that is 1 ___ 360 of 1 whole turn. It is called a 1 degree angle. A 1 degree angle turns through 1 ___ 360 of a circle.
Direct students to use their angle-maker tools and protractors to try to make a 1 degree angle.
Were you able to make a 1 degree angle, or 1 ___ 360 of 1 whole turn?
No, the angle is too small.
Invite students to use the angle-maker tools to make a 20 degree angle.
How many degrees are in this angle?
20 degrees
Teacher Note
Anticipate that students could be confused by the idea that both temperatures and angles are measured with a unit of the same name, degrees.
On the temperature scale, in Celsius, a degree is the difference between the freezing and boiling points of water, divided into 100 equal parts (i.e., 1 100 of the difference between freezing and boiling). Likewise, a 1 degree angle is the same size as 1 360 of a whole turn.
It is not necessary for students to understand the specific distinction between the units. In both cases, a degree represents a fraction of something.
Language Support
Consider creating a chart for students to refer to during the lesson.
EUREKA MATH2 Florida B.E.S.T. Edition 4 ▸ M6 ▸ TB ▸ Lesson 9 © Great Minds PBC 187
°
Write 20° as you say the following explanation.
A degree is the unit we use to measure angles. Each tick mark on the protractor represents 1 degree or 1 ___ 360 of 1 whole turn. We can record the number of degrees by writing the number and then writing the degree symbol.
Trace along the edge of the angle-maker tool from 0° to 20° as you say the following:
One way we can see the fraction of the whole turn is by looking at the part of the circle between the rays.
Prompt students to put their fingers near the tick mark representing 1°.
1° is the same as what fraction of a turn through a circle? 1 360
Draw a two-column chart with the headings Angle Measure and Turn Through a Circle. Write 1° and 1 360 in the chart. Repeat for 2°, 3°, 4°, 5°, and 20°.
Direct students to use their protractors and angle-maker tools to show a 90 360 turn. Invite students to trace the fraction of the circle that represents the angle with their fingers.
What type of angle did you make?
A right angle
A 90° angle
A right angle measures exactly 90°.
How many degrees are in an acute angle?
Less than 90°
An acute angle measures less than 90°.
Language Support
Consider modifying the anchor chart created in lesson 5 to include a more precise description of each angle, using its degree measure.
A right angle measures 90°
An acute angle measures less than 90°.
An obtuse angle measures greater than 90° but less than 180°.
A straight angle measures 180°.
A reflex angle measures greater than 180° but less than 360°.
4 ▸ M6 ▸ TB ▸ Lesson 9 EUREKA MATH2 Florida B.E.S.T. Edition © Great Minds PBC 188
° ° ° ° ° °
Invite students to use their protractors and angle-maker tools to show a 180 360 turn. Invite students to trace the fraction of the circle that represents the angle with their fingers.
What angle did you make?
A straight angle
A 180° angle
A straight angle measures exactly 180°. Direct students to study their protractors.
How many degrees are in an obtuse angle?
Greater than 90° but less than 180°
An obtuse angle measures greater than 90° but less than 180°.
Prompt students to use their protractors and angle-maker tools to show a 360 360 turn. Invite students to trace the fraction of the circle that represents the angle with their fingers.
How many degrees are in 1 whole turn?
360°
How many degrees are in a reflex angle?
Greater than 180° but less than 360°.
A reflex angle measures greater than 180° but less than 360°.
Describe an angle by using a number of degrees or a fraction of a turn. After you say each measure, prompt the students to point to that location on their protractors and to determine the type of angle you described. Consider the following sequence:
30°, 140 360 of a turn, 290°, 90 360 of a turn
Invite students to turn and talk about other examples of acute, obtuse, and reflex angles using angle measure or fractions of a turn.
UDL: Representation
To help students more easily identify an angle type, consider color-coding and labeling the location of each angle type on the protractor.
EUREKA MATH2 Florida B.E.S.T. Edition 4 ▸ M6 ▸ TB ▸ Lesson 9 © Great Minds PBC 189
170 160 150 140 130 120 110 100 90 80 70 60 50 40 30 20 10 0 1 8 0 1 90 200 210 220 230 240 250 260 270 280 290 300 310 320 330 340 35 0 Reflex angles Obtuseangles Acuteangles
Benchmark Angles
Students make, measure, and recognize benchmark angles.
Display ∠B and ask what type of angle students think ∠B is.
Display ∠L and ask what type of angle students think ∠QLP is.
Right angles and straight angles are two examples of benchmark angles. Benchmark angles are familiar and recognizable.
Direct students to use their angle-maker tools to show a 1 8 turn and then to use their protractors to determine the measure of the angle.
What is the measure of a 1 _ 8 turn?
45 degrees
A 45° angle is another benchmark angle.
Direct students to the first row of problem 1 in their books.
How many 1 ___ 360 turns are in a 45° angle?
45
What type of angle is the 45 ___ 360 turn?
An acute angle
Prompt students to complete the first row of the table. Guide students to use the intersecting lines in the second column to help them sketch the angle.
4 ▸ M6 ▸ TB ▸ Lesson 9 EUREKA MATH2 Florida B.E.S.T. Edition © Great Minds PBC 190
A C B QL P
1. Use your angle-maker tool and protractor to make and measure each benchmark angle. Then complete the table.
Promoting the Mathematical Thinking and Reasoning Standards
When students make and then measure benchmark angles, they are using patterns and structure (MTR.5)
Ask the following questions to promote MTR.5:
• When you make benchmark angles, does anything repeat? How can that help you?
• What patterns do you notice as you make and measure benchmark angles? How can that help you find the angle measures of these angles?
EUREKA MATH2 Florida B.E.S.T. Edition 4 ▸ M6 ▸ TB ▸ Lesson 9 © Great Minds PBC 191
Turn Sketch of Angle Angle Measure Fraction of 1 Whole Turn Angle Type 1 8 45° 45 360 Acute angle 2 8 90° 90 ______ 360 Right angle 3 8 135° 135 ______ 360 Obtuse angle 4 _ 8 180° 180 ______ 360 Straight angle
4 ▸ M6 ▸ TB ▸ Lesson 9 EUREKA MATH2 Florida B.E.S.T. Edition © Great Minds PBC 192 Turn Sketch of Angle Angle Measure Fraction of 1 Whole Turn Angle Type 5 _ 8 225° 225 360 Reflex angle 6 8 270° 270 ______ 360 Reflex angle 7 8 315° 315 360 Reflex angle 8 8 360° 360 360 Whole turn
Then direct students to work with a partner and use their angle-maker tools and protractors to create the remaining benchmark angles and complete the table. As students work, circulate and check for understanding.
After students finish working, direct them to look at the Angle Measure column.
Do you notice a pattern?
Yes, every angle measures 45° more than the previous angle.
Invite students to turn and talk about other things they notice about the table.
Problem Set
Differentiate the set by selecting problems for students to finish independently within the timeframe. Problems are organized from simple to complex.
Land
Debrief 5 min
Objective: Use a circular protractor to recognize a 1° angle as a turn through
___ 360 of a circle.
Initiate a class discussion using the prompts below. Encourage students to restate their classmates’ responses in their own words.
What is a protractor used for?
A protractor is used to measure angles.
Use your protractor to explain to your partner what a degree is.
Each tick mark on the protractor represents 1 degree.
A degree is the unit used to measure angles.
EUREKA MATH2 Florida B.E.S.T. Edition 4 ▸ M6 ▸ TB ▸ Lesson 9 © Great Minds PBC 193
1
10
How are 1° and a turn through 1 ___ 360 of a circle related?
1° is the same size as a 1 ___ 360 turn.
Each time you make a 1 ___ 360 turn, an angle becomes 1° larger.
Exit Ticket 5 min
Provide up to 5 minutes for students to complete the Exit Ticket. It is possible to gather formative data even if some students do not complete every problem.
Language Support
To support students in participating in the debrief and restating their classmates’ responses, direct their attention to the Say It Again portion of the Talking Tool.
4 ▸ M6 ▸ TB ▸ Lesson 9 EUREKA MATH2 Florida B.E.S.T. Edition © Great Minds PBC 194
Sample Solutions
Expect to see varied solution paths. Accept accurate responses, reasonable explanations, and equivalent answers for all student work.
EUREKA MATH2 Florida B.E.S.T. Edition 4 ▸ M6 ▸ TB ▸ Lesson 9 © Great Minds PBC 195
EUREKA MATH2 Florida B.E.S.T. Edition 4 ▸ M6 ▸ TB ▸ Lesson 9 © Great Minds PBC 77 9 Name Date Use the protractor to fill in the blanks. 1. 170 160 150 140 130 120 110 100 90 80 70 60 50 40 30 20 10 0 1 8 0 1 90 200 210 220 230 240 250 260 270 280 290 300 310 320 330 340 350 Fraction of 1 turn: 1 4 Angle measure: 90 ° Type of angle: Right 2. 170 160 150 140 130 120 110 100 90 80 70 60 50 40 30 20 10 0 1 8 0 1 90 200 210 220 230 240 250 260 270 280 290 300 310 320 330 340 350 Fraction of 1 turn: 2 4 Angle measure: 180 ° Type of angle: Straight 4 ▸ M6 ▸ TB ▸ Lesson 9 EUREKA MATH2 Florida B.E.S.T. Edition © Great Minds PBC 78 PROBLEM SET 3. 170 160 150 140 130 120 110 100 90 80 70 60 50 40 30 20 10 0 1 8 0 1 90 200 210 220 230 240 250 260 270 280 290 300 310 320 330 340 350 Fraction of 1 turn: 3 4 Angle measure: 270 ° Type of angle: Reflex 4. 170 160 150 140 130 120 110 100 90 80 70 60 50 40 30 20 10 0 1 8 0 1 90 200 210 220 230 240 250 260 270 280 290 300 310 320 330 340 350 Fraction of 1 turn: 1 8 Fraction of 1 circle: 45 360 Angle measure: 45° Type of angle: Acute
4 ▸ M6 ▸ TB ▸ Lesson 9 EUREKA MATH2 Florida B.E.S.T. Edition © Great Minds PBC 196 EUREKA MATH2 Florida B.E.S.T. Edition 4 ▸ M6 ▸ TB ▸ Lesson 9 © Great Minds PBC 79 PROBLEM SET 5. 170 160 150 140 130 120 110 100 90 80 70 60 50 40 30 20 10 0 1 8 0 1 90 200 210 220 230 240 250 260 270 280 290 300 310 320 330 340 350 Fraction of 1 turn: 3 8 Fraction of 1 circle: 135 360 Angle measure: 135° Type of angle: Obtuse 6. 170 160 150 140 130 120 110 100 90 80 70 60 50 40 30 20 10 0 1 8 0 1 90 200 210 220 230 240 250 260 270 280 290 300 310 320 330 340 350 Fraction of 1 turn: 7 8 Fraction of 1 circle: 315 360 Angle measure: 315° Type of angle: Reflex 4 ▸ M6 ▸ TB ▸ Lesson 9 EUREKA MATH2 Florida B.E.S.T. Edition © Great Minds PBC 80 PROBLEM SET 7. 170 160 150 140 130 120 110 100 90 80 70 60 50 40 30 20 10 0 1 8 0 1 90 200 210 220 230 240 250 260 270 280 290 300 310 320 330 340 350 Angle measure: 60° Type of angle: Acute 8. 170 160 150 140 130 120 110 100 90 80 70 60 50 40 30 20 10 0 1 8 0 1 90 200 210 220 230 240 250 260 270 280 290 300 310 320 330 340 350 Angle measure: 160° Type of angle: Obtuse
11. An angle turns through 3 4 of a circle. What is the measure of the angle in degrees?
12. Zara draws an angle that turns through 55 360 of a circle. What type of angle does Zara draw? How do you know?
Zara draws an acute angle because it is 55° and acute angles are less than 90°
10. How many 1° angles make 1 turn?
13. How many 30° angles make 1 turn?
EUREKA MATH2 Florida B.E.S.T. Edition 4 ▸ M6 ▸ TB ▸ Lesson 9 © Great Minds PBC 197 EUREKA MATH2 Florida B.E.S.T. Edition 4 ▸ M6 ▸ TB ▸ Lesson 9 © Great Minds PBC 81 PROBLEM SET 9. 170 160 150 140 130 120 110 100 90 80 70 60 50 40 30 20 10 0 1 8 0 1 90 200 210 220 230 240 250 260 270 280 290 300 310 320 330 340 350 Angle measure: 325° Type of angle: Reflex
4 ▸ M6 ▸ TB ▸ Lesson 9 EUREKA MATH2 Florida B.E.S.T. Edition © Great Minds PBC 82 PROBLEM SET
360
270°
12
4 ▸ M6 ▸ TB ▸ Lesson 9 ▸ Circular Protractor EUREKA MATH2 Florida B.E.S.T. Edition © Great Minds PBC 198 This page may be reproduced for classroom use only. 170 160 150 140 130 120 110 100 90 80 70 60 50 40 30 20 10 0 1 8 0 1 90 200 210 220 230 240 250 260 270 280 290 300 310 320 330 340 350
Identify and measure angles as turns and recognize them in various contexts.
Lesson at a Glance
Name Date
1. David is doing a handstand. Describe how many degrees his body will turn to stand straight up again.
Students relate the turns made by clock hands to angles, which can be measured by using degrees. Similarly, students see that turning their body to face different directions can also be described by using degrees. Students use degrees in relation to directions.
Key Questions
• How can we measure turns?
• How is turning your body similar to the hands turning on a clock?
David’s body will turn 180°
2. Gabe starts riding his bike at the point represented by the star. He rides north for 3 blocks, then turns 90° clockwise and rides for 2 blocks. What direction is he facing after the turn?
a. Sketch Gabe’s route on the grid. Each square represents 1 block.
Achievement Descriptor
This lesson is foundational to the work of MA.4.GR.1.2. Its content is intended to serve as a formative assessment and is therefore not included on summative assessments in grade 4.
© Great Minds PBC 10 LESSON 10
EUREKA MATH2 Florida B.E.S.T. Edition 4 ▸ M6 ▸ TB ▸ Lesson 10 © Great Minds PBC 89 10
N S E W
b. Gabe is facing east after the turn.
Agenda
Fluency 10 min
Launch 5 min
Learn 35 min
• Turns on a Clock
• Turns in a Room
• Degrees of Turning
• Problem Set
Land 10 min
Materials
Teacher
• Prepared signs
Students
• None
Lesson
Preparation
Prepare four signs—North, South, East, and West. Hang the signs up in four different locations in the classroom.
© Great Minds PBC 201 EUREKA MATH2 Florida B.E.S.T. Edition 4 ▸ M6 ▸ TB ▸ Lesson 10
Fluency
Whiteboard Exchange: Geometric Terms and Notations
Students say and write names for parallel and perpendicular lines and line segments to build familiarity with the geometric figures.
Display parallel line segments AB and CD.
What word can we use to complete the statement and describe the relationship of the line segments? Raise your hand when you know.
Wait until most students raise their hands, and then signal for students to respond.
Parallel
Display the completed statement.
On my signal, read the statement.
Line segment AB is parallel to line segment CD.
Use proper notation to rewrite the statement.
Display the sample answer.
4 ▸ M6 ▸ TB ▸ Lesson 10 EUREKA MATH2 Florida B.E.S.T. Edition © Great Minds PBC 202
10 A C D B Line segment AB is to line segment CD AB || CD parallel
Repeat the process with following sequence:
Counting on the Protractor
Students count by 90° or 30° on a circular protractor to develop familiarity with the tool from lesson 9.
Display the image of the circular protractor with a ray pointing at 0°.
Use the angle on the protractor to count forward and back by 90°. The first measurement you say is 0°. Ready?
Display the angle measure increasing in 90° intervals to 360° and then back down to 0°. 0°, 90°, 180°, 270°, 360°
360°, 270°, 180°, 90°, 0°
Repeat the process with 30° intervals.
Teacher Note
Listen to student responses and be mindful of errors, hesitation, or lack of full class participation. If needed, adjust the tempo.
EUREKA MATH2 Florida B.E.S.T. Edition 4 ▸ M6 ▸ TB ▸ Lesson 10 © Great Minds PBC 203
GH KJ R T US Line segment RT is to line segment US. L M N P E Z F G W X Y Z B N Q W M A V C Line GH is to line KJ. Line LN is to line PM Line EF is to line ZG. Line VC is to line MA Line segment WY is to line segment XZ line segment QW Line segment BN is to parallel perpendicular perpendicular perpendicular GH || KJ LN ⊥ PM RT ⊥ US WY ⊥ XZ perpendicular parallel parallel EF ⊥ ZG VC || MA BN || QW
Choral Response: Classify and Measure Angles
Students classify an angle and use a circular protractor to determine the angle measure to develop fluency with the skill from lesson 9.
After asking each question, wait until most students raise their hands, and then signal for students to respond.
Raise your hand when you know the answer to each question. Wait for my signal to say the answer.
Display the acute angle.
How would you classify the angle?
Acute
Display the answer.
Estimate the angle measure. Whisper your estimate to your partner.
Provide time for students to think and share with their partner.
25°. It looks like it’s less than halfway to 90°.
40°. It looks like it’s almost halfway between 0° and 90°.
Display the protractor.
What is the angle measure?
30°
Display the angle measure.
4 ▸ M6 ▸ TB ▸ Lesson 10 EUREKA MATH2 Florida B.E.S.T. Edition © Great Minds PBC 204
Acute 30°
Launch
Students identify 90° clockwise and counterclockwise turns as right angles.
Display the picture of the robots with one dial pointing to Off and the other dial pointing to Lights.
Amy switches on her robot’s lights by turning the dial clockwise, the way the hands on a clock turn.
Invite a student to demonstrate how the dial turned from the off position to the lights position by tracing around the edge of the dial with their finger.
Language Support
Consider using a picture to support students in using the terms clockwise and counterclockwise.
Clockwise
Counterclockwise
EUREKA MATH2 Florida B.E.S.T. Edition 4 ▸ M6 ▸ TB ▸ Lesson 10 © Great Minds PBC 205
the process with the following sequence: Straight 180° Reflex 240° Obtuse 150° Right 90° Obtuse 120° Acute 60° Reflex 270°
Repeat
5 Off Sound Both Lights Off Sound Both Lights
What type of angle is made when Amy turns the dial to switch on the lights?
Right angle
How many degrees does the dial turn?
90°
Tell students that Amy switches the robot’s lights off by turning the dial counterclockwise, or the opposite way from how the hands on a clock turn. Invite a student to demonstrate how the dial turned from the lights position to the off position by tracing around the edge of the dial with their finger.
What type of angle is made when Amy turns the dial to switch the lights off?
Right angle
How many degrees does the dial turn?
90°
Did the direction of the turn affect the size of the angle? How do you know?
No. Amy turned the dial in opposite directions, but I can see that the angles are the same size.
No. I think how big the turn is will affect the angle measure. Transition to the next segment by framing the work. Today, we will identify and measure angles as turns.
Differentiation: Support
Consider inviting students to use their angle-maker tools from lesson 8 and their circular protractors from lesson 9 to make an angle that matches the angle shown by the marks on the dial.
4 ▸ M6 ▸ TB ▸ Lesson 10 EUREKA MATH2 Florida B.E.S.T. Edition © Great Minds PBC 206
Learn
Turns on a Clock
Students explore angle measure as turning hands on a clock. Display the analog clock showing 12:00. Invite students to think about the movement of the hour hand from 12:00 to 3:00.


Trace your finger around the edge of the clock from 12:00 to 3:00. Then display the picture of the clocks showing 12:00 and 3:00.
What fraction of the circle did the hour hand turn?
1 4 of the circle
How many degrees did the hour hand turn?
90°
Invite students to think about the hour hand moving from 3:00 to 6:00. Display the picture of the clock showing 6:00.
Invite students to think–pair–share about what fraction of the circle the hour hand has moved in total from 12:00 to 6:00 and the number of degrees that is.
It turned 1 2 of the circle. That’s 180°.
It turned 1 4 of the circle 2 times, so it is like saying 90° + 90° = 180°.
When we made angles with our angle-maker tool, we rotated through a fraction of the circle. How did we describe the turn when we made a right angle? A straight angle?
1 4 turn; 1 2 turn
We can use the words quarter turn to describe a turn of 90° and half turn to describe a turn of 180°.
UDL: Representation
Consider showing the turns by using a demonstration clock and providing students the opportunity to physically move the hour hand.
Language Support
Consider making an anchor chart to support students during the lesson.
EUREKA MATH2 Florida B.E.S.T. Edition 4 ▸ M6 ▸ TB ▸ Lesson 10 © Great Minds PBC 207
35
° ° ° °
Display the clock showing 12:00 Invite students to think about the hour hand moving from 12:00 to 9:00.
How many quarter turns would the hour hand move?
3 quarter turns
Is there another way we can think of the hand moving?
We can think of it as a half turn and a quarter turn. Display the clock showing 9:00.
How many degrees did the hour hand move from 12:00 to 9:00? How do you know?
It moved 270°. When the hour hand moves from 12:00 to 6:00, it turns through 180°, and when it moves from 6:00 to 9:00, it turns through 90° more.
I know it’s 270° because a half turn is 180° and another quarter turn is 90°.
Display the clock showing 12:00. As you trace your finger around the entire clock, invite students to think about the minute hand making one whole turn around the clock. Direct students to turn and talk with a partner about how they can use quarter turn, half turn, three-quarter turn, and whole turn to describe the movement of the minute hand.
Turns in a Room
Students relate angle measures with turning to face different directions in a room.
Invite students to stand up and face the front of the room. Tell students that they will use their bodies to represent turns. Invite students to use their bodies to show 1 whole turn.
How many degrees did you turn?
360°
UDL: Representation
When students turn, they are demonstrating the same movement as the angle-maker tool and the hands on a clock. To support students in making this connection to the physical movement, have students put one arm out in front of them to mimic a ray or hand of a clock. As they turn, they can visualize their arms moving like a ray or hand of a clock. As students move their bodies, ensure that their arms stay stationary.
4 ▸ M6 ▸ TB ▸ Lesson 10 EUREKA MATH2 Florida B.E.S.T. Edition © Great Minds PBC 208
Invite students to make a half turn to face the back of the room. Ask them how many degrees they turned.
What other turns can we show?
We can show a quarter turn.
We can show a three-quarter turn. We can show many different turns.
Invite students to face the front of the room again and make a quarter turn. Allow students to turn clockwise or counterclockwise.
If you turned clockwise, how many degrees did you turn?
90°
If you turned counterclockwise, how many degrees did you turn?
90°
Invite students to turn and talk about why the turn was 90° whether they turned clockwise or counterclockwise.
When we make a quarter turn, we turn 90°. We can turn in either direction, but we still turn the same number of degrees. We see this happen with angles, too. A right angle can face different directions but still measure 90°.
Direct students to face the front of the room again and invite them to make 2 quarter turns, each in the same direction.
How many degrees did you turn?
We turned 180°.
Did everyone turn the same direction?
No, some people turned clockwise, and some people turned counterclockwise.
Why is everyone facing the back of the room?
When we make a half turn, we face in the opposite direction, no matter which way we turn.
Invite students to name turns for a partner to make. After making the turn, the partner says the degrees they turned.
Teacher Note
When students are asked whether angles turn the same way, remind them of the dial in Launch. Turning the lights on and off resulted in the same-size angle even though the dial moved in different directions.
Promoting the Mathematical Thinking and Reasoning Standards
When students explore turns on a clock and turns in the room and relate them to angles and their measure, they are applying mathematics to real-world contexts (MTR.7)
Ask the following questions to promote MTR.7:
• How does a fractional turn represent the clock’s minute hand moving from 9 to 12?
• What does a clockwise half turn tell you about the angle you turned?
EUREKA MATH2 Florida B.E.S.T. Edition 4 ▸ M6 ▸ TB ▸ Lesson 10 © Great Minds PBC 209
Degrees of Turning
Materials—T: Prepared signs
Students use degrees in relation to directions.
Display the directional signs (i.e., North, East, South, West) on the correct walls in the classroom. Have students stand and face north.
Turn 90° to the right. What direction are you facing? Look at the sign to see. East
Repeat the process until students see each of the directions posted around the room.
Direct students to face north. Display the following instructions and say them aloud one at a time to students.
• Walk four small steps forward.
• Make a quarter turn counterclockwise.
• Walk five small steps forward.
• Make a half turn clockwise.
Then ask what direction students are facing and how many degrees they need to turn to face south.
Pair students and invite them to give three or four walking and turning instructions to a partner. Invite students to write the instructions on their whiteboards before saying them to their partners.
When students are finished, invite them to reflect on the activity.
How did you know how many degrees you needed to turn to face a certain direction?
I knew that turning around in the opposite direction was 180°.
I knew that making a quarter turn was 90°. I could add up the number of quarter turns needed, then repeatedly add 90 the same number of times.
Differentiation: Challenge
When working with partners, direct students to say the number of degrees instead of the type of turn. Consider using the following example.
Face . Walk four steps. Turn 90° clockwise. Walk five steps. Turn 180°. What direction are you facing? How many degrees do you have to turn to face ?
4 ▸ M6 ▸ TB ▸ Lesson 10 EUREKA MATH2 Florida B.E.S.T. Edition © Great Minds PBC 210
Display the compass rose. Invite students to think–pair–share about how the compass rose represents the turns they made in the room. The same directions are labeled. I see the first letter of each direction.
I can see that the turn from one direction to the next direction is 90°.
Display the pictures of the protractor and the clock alongside the compass rose.
What do you notice about these three tools?
They are all circular. We can use them to show turns.
How is turning our bodies to face a direction similar to the turn of a hand on a clock or an angle turning?
When we turn our bodies to face a direction, we are turning a number of degrees, just like a hand on a clock turns to a different time or an angle turns through a circle.
Invite students to think–pair–share about more real-world examples of turning.
When you turn an oven on, you turn the knob some degrees. A basketball player turns when making a 360° dunk.
We turn the handle of a door when opening it.
Problem Set
Differentiate the set by selecting problems for students to finish within the timeframe. Problems are organized from simple to complex.
Teacher Note
A context video for problem 5 in the Problem Set is available. It may be used to remove language or cultural barriers and provide student engagement. Before providing the problem to students, consider showing the video and facilitating a discussion about what students notice and wonder. This supports students in visualizing the situation before being asked to interpret it mathematically. Alternatively, consider showing the video during Land to facilitate students confirming their solutions. Consider inviting students to reflect on how the video helped them see how the parts of the scene are related. Invite them to describe how this helped them solve the problem and how they can apply the thinking to other situations.
EUREKA MATH2 Florida B.E.S.T. Edition 4 ▸ M6 ▸ TB ▸ Lesson 10 © Great Minds PBC 211
Land
Debrief 5 min
Objective: Identify and measure angles as turns and recognize them in various contexts.
Use the following prompts to facilitate a discussion about angles as turns in real-world contexts.
Display the picture of the robots. Invite students to think–pair–share about how many degrees the dial turns when Amy turns it all the way around and how they know.
360°. The dial is pointing the same way as when she started.
360°. She makes a whole turn.
How can we measure angles by using turns?
We can think of turning as an angle and just say the degrees.
A quarter turn is a 90° angle and a half turn is a 180° angle.
How is turning your body similar to the hands turning on a clock?
The hands of the clock turn too. When we turn our bodies, it is like when the hands of the clock move.
We can turn clockwise or counterclockwise.
Exit Ticket 5 min
Provide up to 5 minutes for students to complete the Exit Ticket. It is possible to gather formative data even if some students do not complete every problem.
4 ▸ M6 ▸ TB ▸ Lesson 10 EUREKA MATH2 Florida B.E.S.T. Edition © Great Minds PBC 212
10 Off Sound Both Lights Off Sound Both Lights
Sample Solutions
Expect to see varied solution paths. Accept accurate responses, reasonable explanations, and equivalent answers for all student work.
3. Adam is in the seat at the top of the Ferris wheel. The Ferris wheel turns 270° clockwise.
a. Circle where Adam’s seat is after the turn.
1.
2. A plane takes off flying west. The plane turns and is now flying east. How many degrees does the plane turn?
b. What turn brings Adam back to the top of the Ferris wheel?
Sample:
Clockwise 90°
4. Liz plays a game. She wants the green piece to fit into the white space. Which button should she press to make the piece fit? How do you know?
Buttons
Turn 90˚ Turn 180˚
The
Liz should press the Turn 90° button. If she turns it 180°, the piece will still face the same direction.
© Great Minds PBC 213 EUREKA MATH2 Florida B.E.S.T. Edition 4 ▸ M6 ▸ TB ▸ Lesson 10
EUREKA MATH2 Florida B.E.S.T. Edition 4 ▸ M6 ▸ TB ▸ Lesson 10 © Great Minds PBC 85 10 Name Date
How many degrees does the minute hand turn from 2:15 to 3:00?
The minute hand turns 270°
4 ▸ M6 ▸ TB ▸ Lesson 10 EUREKA MATH2 Florida B.E.S.T. Edition © Great Minds PBC 86 PROBLEM SET
plane turns 180°
b. Mia turns 180°. What part of the park is she facing? Mia is facing the parking lot.
c. James now faces the pool. Use degrees and the words clockwise or counterclockwise to describe how he turned.
Sample:
James turned clockwise 90°
© Great Minds PBC 214 4 ▸ M6 ▸ TB ▸ Lesson 10 EUREKA MATH2 Florida B.E.S.T. Edition EUREKA MATH2 Florida B.E.S.T. Edition 4 ▸ M6 ▸ TB ▸ Lesson 10 © Great Minds PBC 87 PROBLEM SET
5. Luke, Mia, and James are at the park. They are standing on the star. They are facing the basketball court. garden parking lot
basketball court pool
a. Luke turns 90° counterclockwise. What part of the park is he facing? Luke is facing the garden.
© Great Minds PBC 11 LESSON 11
protractors
measure
EUREKA MATH2 Florida B.E.S.T. Edition 4 ▸ M6 ▸ TB ▸ Lesson 11 © Great Minds PBC 99 11 Name Date Use a protractor to measure the angles. 1. 135 degrees 2. 37 degrees 4 ▸ M6 ▸ TB ▸ Lesson 11 EUREKA MATH2 Florida B.E.S.T. Edition © Great Minds PBC 100 EXIT TICKET 3. 150 degrees 4. 90 degrees
Use 180°
to
angles.
Lesson at a Glance
Students identify angles as right, acute, obtuse, or straight and use a 180° protractor to find the angle measure. They use their knowledge of types of angles to reason about which scale on the protractor to use for the given angle.
Key Question
• How do we use a 180° protractor to measure angles?
Achievement Descriptor
FL.4.Mod6.AD5 Measure and draw angles in degrees. (MA.4.GR.1.2)
Agenda
Fluency 10 min
Launch 5 min
Learn 35 min
• Relate the Protractor Scale to a Number Line
• Measure Angles
• Measure Angles with Precision
• Problem Set
Land 10 min
Materials
Teacher
• 4″ protractor (180°)
Students
• 4″ protractor (180°)
Lesson Preparation
Review the Math Past resource to support delivery of Land.
© Great Minds PBC 217 EUREKA MATH2 Florida B.E.S.T. Edition 4 ▸ M6 ▸ TB ▸ Lesson 11
Fluency
Whiteboard Exchange: Compose 90
Students complete an addition equation with an unknown addend to prepare for finding unknown angle measures within right angles beginning in topic C.
Display 80 + = 90.
Write and complete the equation.
Give students time to work. When most students are ready, signal for students to show their whiteboards. Provide immediate and specific feedback. If students need to revise, briefly return to validate their corrections.
Display the answer.
Repeat the process with the following sequence:
Consider showing each equation in a number bond if students need additional support.
4 ▸ M6 ▸ TB ▸ Lesson 11 EUREKA MATH2 Florida B.E.S.T. Edition © Great Minds PBC 218
50 += 90 75 += 90 45 += 90 + 20 = 90 + 38 = 90 17 += 90 62 += 90 + 25 = 90 40 15 45 70 52 73 28 65 10 80 + = 90 10 Teacher Note
90 80 ?
Counting on the Protractor
Students count by 90° or 45° on a circular protractor to develop familiarity with the tool from lesson 9.
Display the image of the circular protractor with a ray pointing at 0°.
Use the angle on the protractor to count forward and back by 90°. The first measurement you say is 0°. Ready?
Display the angle measure increasing in 90° intervals to 360° and then back down to 0°.
0°, 90°, 180°, 270°, 360°
360°, 270°, 180°, 90°, 0°
Repeat the process with 45° intervals.
Choral Response: Classify and Measure Angles
Students classify an angle and use a circular protractor to determine the angle measure to develop fluency with the skill from lesson 9.
After asking each question, wait until most students raise their hands. Then signal for students to respond.
Raise your hand when you know the answer to each question. Wait for my signal to say the answer.
Display the right angle.
How would you classify the angle?
Right
Display the answer.
Estimate the angle measure. Whisper your estimate to your partner.
Provide time for students to think and share with their partner.
90°. A right angle is 90°.
EUREKA MATH2 Florida B.E.S.T. Edition 4 ▸ M6 ▸ TB ▸ Lesson 11 © Great Minds PBC 219
90°
Right
Display the protractor.
What is the angle measure?
90°
Display the angle measure. Repeat the process with the following sequence:
Launch
Students compare two angles.
Display the pictures of the angles.
What do you notice about these two angles?
∠ A has a longer arc than ∠C.
They are both acute angles.
∠ A is facing a different direction than ∠C.
4 ▸ M6 ▸ TB ▸ Lesson 11 EUREKA MATH2 Florida B.E.S.T. Edition © Great Minds PBC 220
Obtuse 120° Acute 45° Acute 30° Straight 180° Obtuse 135° Reflex 225° Reflex 315°
5 AC
What do you wonder about these two angles?
I wonder if they are the same size.
I wonder if the longer arc in ∠ A means it is a bigger angle.
How can we find out if these angles have the same measure?
We can use a protractor.
Invite students to turn and talk about how they would use a protractor to find the measure of these angles.
Transition to the next segment by framing the work.
Today, we will measure angles by using a different kind of protractor.
Learn
Relate the Protractor Scale to a Number Line
Materials—T/S: Protractor
Students relate the scale on the protractor to a number line. Display the picture of the two protractors.
Invite students to think–pair–share about what is the same and what is different about the two protractors.
The numbers increase by 10° on both of them.
The whole circle protractor has one set of numbers and the half circle protractor has two sets of numbers.
They both have 90° at the top.
EUREKA MATH2 Florida B.E.S.T. Edition 4 ▸ M6 ▸ TB ▸ Lesson 11 © Great Minds PBC 221
35
What relationship do you see between the two protractors?
They both have numbers that show angle measures.
The whole circle protractor goes up to 360°. The half circle protractor only goes up to 180°.
Distribute the 180° protractors and provide students with 1 minute to study them.
We can think of the scales on this protractor as two number lines.
Invite students to think–pair–share about the similarities and differences between the scales on the protractor and a number line.
I see that there is 0° on the bottom right that begins one scale. The scale ends at 180° on the bottom left. A number line could also have numbers from 0 to 180, but it would be set up left to right.
There is another scale that begins at the bottom left and increases from 0° to 180° from left to right, which looks a lot like a number line.
I can tell what each tick mark represents by thinking about a number line. I can count up or down from the measures that are labeled.
Trace your finger along the scales of the 180° protractor to show students the two scales.
Why do you think there are two scales on this protractor?
To measure angles that face different directions
This reminds me of the angles we saw earlier. We can measure angles facing in any direction.
Measure Angles
Students use a 180° protractor to determine the measures of angles when the measures are multiples of 5 or 10.
Direct students to problems 1 and 2 in their books. Invite students to think–pair–share about the type of angle they see and how they know it is an angle of that type.
They are both acute angles because they are smaller than a right angle.
They are both acute angles. I can see that ∠ A is less than 90° and ∠C looks like it is the same measure as ∠ A.
UDL: Representation
To emphasize the two scales on the 180° protractor, consider displaying a picture that highlights each 0° label and each 180° label in a different color.
To help students distinguish the two scales on their protractors, have students find and put their finger on 0° on the left end of the protractor. Have students trace with their finger along the scale as you count by tens to 180° on the outer scale. Repeat the process beginning at 0° on the right side of the protractor and counting on the inner scale.
4 ▸ M6 ▸ TB ▸ Lesson 11 EUREKA MATH2 Florida B.E.S.T. Edition © Great Minds PBC 222
Do these angles look like they have the same measure? How can you be sure?
They look like they have the same measure. We can use a protractor to measure ∠C to make sure.
Identify the type of angle. Then use a protractor to measure the angle.
1. Type of Angle: Acute Measure: 40°
2. Type of Angle: Acute Measure: 40°
Language Support
Consider adding 180° protractor to the anchor chart from lesson 9.
Guide students to find the measure of ∠ A on the protractors. Think aloud as you use the printed protractor to measure the angle.
In the picture, the protractor is already lined up with one of the angle’s rays. The vertex of the angle is at the point where the zero line and the 90° line meet. The ray on the bottom is lined up along the zero line and crosses through the 0° tick mark. Now I can read the number on the scale to find the measure of the angle.
I see that the other ray crosses through the scales where there are two numbers labeled 40 and 140. Which measure makes sense for this angle? How do you know?
It makes sense that the angle is 40° because it is an acute angle. An acute angle is smaller than 90°.
We lined up the bottom ray at 0° on the inner scale of the protractor, so we should use the inner scale to find the measure of the angle. The measure of the angle is 40°.
EUREKA MATH2 Florida B.E.S.T. Edition 4 ▸ M6 ▸ TB ▸ Lesson 11 © Great Minds PBC 223
° A C
Confirm that ∠ A measures 40° and trace the arc of the protractor from 0° to 40° so students see which scale is used to measure the angle. Model finding the measure of ∠C as you think aloud. Invite students to do the same.
I need to line up the protractor with one of the angle’s rays. I need to make sure the vertex of the angle is at the point where the zero line and the 90° line meet, and I need to make sure the bottom ray is lined up along the zero line and crosses through the 0° tick mark.
Now I can see where the other ray crosses through the scales. What numbers are labeled where the ray crosses the scales?
40 and 140
Which measure makes sense for this angle? How do you know?
It makes sense that the angle is 40° because it is an acute angle. An acute angle is smaller than 90°.
We lined up the bottom ray at 0° on the outer scale of the protractor, so we should use the outer scale to find the measure of the angle. The measure of the angle is 40°.
What is different about how we used protractors to measure ∠C and ∠ A?
The protractor we used to measure ∠ A was printed on the paper with the angle. We used our own protractors to measure ∠C.
We used the inner scale of the protractor to measure ∠ A and the outer scale to measure ∠C.
Some protractors have two scales and either scale can be used to measure angles.
What did we find out about the measures of ∠ A and ∠C?
∠C has the same measure as ∠ A.
4 ▸ M6 ▸ TB ▸ Lesson 11 EUREKA MATH2 Florida B.E.S.T. Edition © Great Minds PBC 224
C
We wondered whether the larger arc in ∠ A meant the angle was larger than ∠C. Was that true? How do you know?
No. We measured the angles with protractors and learned they were the same size. The size of the arc didn’t matter.
The arc in an angle may be larger because it is drawn further away from the vertex. Where the arc is drawn does not tell us about the size of the angle.
Direct students to work with a partner to complete problem 3. As partners work, circulate and support them in measuring the angle by asking the following sample questions:
• What part of the protractor is the vertex lined up with?
• Where is 0° represented on the protractor? Place your finger at 0° on the protractor.
• What part of the angle is lined up with the 0° tick mark?
• What numbers on the scales on the protractor can help you find the measure of the angle? How do the numbers help you?
3. Type of Angle: Obtuse
Measure: 125°
EUREKA MATH2 Florida B.E.S.T. Edition 4 ▸ M6 ▸ TB ▸ Lesson 11 © Great Minds PBC 225
D
Guide students in a discussion about how they determined the angle measure when the angle did not cross through a labeled tick mark on the scale.
The ray crosses through the scale on the protractor at a point between two numbers. How did you determine the measure of the angle?
I saw that the ray crosses through the scale halfway between 120° and 130°, so the angle measure is 125°.
Does 125° make sense as the angle measure?
Yes. ∠D is an obtuse angle, so it makes sense that it is 125° and not 55°.
Direct partners to complete problems 4 and 5. Then invite students to turn and talk about how they used their protractors to find the measure of each angle.
4. Type of Angle: Acute
Measure: 75°
Promoting the Mathematical Thinking and Reasoning Standards
As students turn and talk to discuss how they used their protractors to find the measure of each angle, they are engaging in discussions that reflect on mathematical thinking (MTR.4).
Ask the following questions to promote MTR.4:
• Why does your method work? Convince your partner.
• What details are important to think about when using your protractor to measure an angle?
4 ▸ M6 ▸ TB ▸ Lesson 11 EUREKA MATH2 Florida B.E.S.T. Edition © Great Minds PBC 226
F
5. Type of Angle: Obtuse
Measure: 150°
EUREKA MATH2 Florida B.E.S.T. Edition 4 ▸ M6 ▸ TB ▸ Lesson 11 © Great Minds PBC 227
L
Measure Angles with Precision
Students measure angles with precision.
Display the picture of ∠ M. Invite students to identify the type of angle and estimate its measure.
Display the picture of the protractor placed over ∠M.
How is the measure of ∠M different from the angles in problems 1 through 5?
The ray doesn’t cross through the scale on a tick mark that shows a ten or a five.
The measure of the angle is not a multiple of 5 or 10.
What 2 tens is the angle measure between?
110 and 120
How can we use the scale on the protractor to find the measure of ∠M?
We can start at 110 and count on until we get to the tick mark that the ray crosses through. We can start at 120 and count back.
We can start at the halfway mark, 115, and count back 1.
What is the exact angle measure? How do you know?
114°. I can see that the ray crosses through the scale 1 tick mark before halfway.
Teacher Note
As students measure the angles, there may be some variation in the angle measures they find. Consider allowing measures that are within 2° or 3° of the given answer.
Teacher Note
The Measuring Angles with a Protractor interactive allows students to determine angle measures. Consider demonstrating the activity for the whole class or allowing students to experiment with the tool individually.
4 ▸ M6 ▸ TB ▸ Lesson 11 EUREKA MATH2 Florida B.E.S.T. Edition © Great Minds PBC 228
M M
Direct partners to complete problems 6 and 7.
6. Type of Angle: Acute Measure: 71°
EUREKA MATH2 Florida B.E.S.T. Edition 4 ▸ M6 ▸ TB ▸ Lesson 11 © Great Minds PBC 229
P
7. Type of Angle: Obtuse
Measure: 128°
When students are finished, invite them to share their answers. Display the angles with a protractor over the angles during the discussion.
Invite students to turn and talk about how identifying the type of angle helps to determine which scale to use on the protractor.
Problem Set
Differentiate the set by selecting problems for students to finish within the timeframe. Problems are organized from simple to complex.
4 ▸ M6 ▸ TB ▸ Lesson 11 EUREKA MATH2 Florida B.E.S.T. Edition © Great Minds PBC 230
T
Land
Debrief 5 min
Objective: Use 180° protractors to measure angles.
Gather students and display the picture of the angle and the protractor to facilitate a discussion about measuring angles with a 180° protractor.
Is the measure of this angle between 50° and 60° or between 120° and 130°?
How do you know?
It is between 120° and 130°. The angle is obtuse.
The measure is between 120° and 130°. The protractor is placed correctly. The vertex of the angle is at the point where the zero line and the 90° line meet, and the ray is lined up along the zero line.
How do we use what we know about right, acute, and obtuse angles to read the angle measure on the protractor?
We know that obtuse angles are greater than 90° and acute angles are less than 90°, so that helps us know which scale to use on the protractor.
Why are there two sets of numbers on a 180° protractor?
Angles can face different directions and we need to be able to measure them. The protractor can be read from either side depending how the angle is drawn.
EUREKA MATH2 Florida B.E.S.T. Edition 4 ▸ M6 ▸ TB ▸ Lesson 11 © Great Minds PBC 231
10
Display the picture of the torquetum, a medieval astronomical instrument used to measure the locations of the moon and other celestial objects in our solar system. Tell students that protractors have been used for thousands of years. Briefly explain that the torquetum used a 180° protractor to find the measures of angles between the earth and moon or other objects in space. Direct students to the 180° protractor in the picture.
What do you notice about the protractor on the torquetum?
What do you wonder?
It’s upside down from how we use the protractor. I wonder if it works the same way.
There seems to be a circular protractor next to it. I wonder if they used the 180° protractor to measure angles less than 180° and the circular protractor to measure angles greater than 180°.
There are partitioned circles below the protractor. I wonder if the partitioned circles show fractions of turns similar to our angle-maker tool.
Consider displaying other pictures of historical protractors from the Math Past. Discuss the culture in which and purpose for which they were developed. Invite students to compare the historical protractors to their protractors.
Exit Ticket 5 min
Provide up to 5 minutes for students to complete the Exit Ticket. It is possible to gather formative data even if some students do not complete every problem.
Math Past
The Math Past resource includes more information about the history of protractors and how different types of protractors have been used.

4 ▸ M6 ▸ TB ▸ Lesson 11 EUREKA MATH2 Florida B.E.S.T. Edition © Great Minds PBC 232
Sample Solutions
Expect to see varied solution paths. Accept accurate responses, reasonable explanations, and equivalent answers for all student work.
© Great Minds PBC 233 EUREKA MATH2 Florida B.E.S.T. Edition 4 ▸ M6 ▸ TB ▸ Lesson 11
EUREKA MATH2 Florida B.E.S.T. Edition 4 ▸ M6 ▸ TB ▸ Lesson 11 © Great Minds PBC 95 11 Name Date Classify the angle as right, acute, obtuse, or straight. Then write the angle measure.
Type of Angle: Acute Measure: 70 ° 2. Type of Angle: Obtuse Measure: 145 °
Measure: 90 °
Obtuse Measure: 127 ° 4 ▸ M6 ▸ TB ▸ Lesson 11 EUREKA MATH2 Florida B.E.S.T. Edition © Great Minds PBC 96 PROBLEM SET Use a protractor to measure the angle. Record the measurement in degrees. 5. Measure: 50 ° 6. Measure: 50 ° 7. Measure: 90 ° 8. Measure: 115 °
1.
3. Type of Angle: Right
4. Type of Angle:
13. Gabe says the measure of the angle shown is 75°. Use a protractor to measure the angle. Then explain Gabe’s mistake.
The angle is 105°, which is an obtuse angle. Gabe looked at the wrong set of numbers on the protractor.
© Great Minds PBC 234 4 ▸ M6 ▸ TB ▸ Lesson 11 EUREKA MATH2 Florida B.E.S.T. Edition EUREKA MATH2 Florida B.E.S.T. Edition 4 ▸ M6 ▸ TB ▸ Lesson 11 © Great Minds PBC 97 PROBLEM SET 9. Measure: 148 ° 10. Measure: 35 ° 11. Measure: 83 ° Z 4 ▸ M6 ▸ TB ▸ Lesson 11 EUREKA MATH2 Florida B.E.S.T. Edition © Great Minds PBC 98 PROBLEM SET
Measure: 172 ° C
12.
Estimate and measure angles with a 180° protractor.
Lesson at a Glance
Students determine that angles can have rays of different lengths and still have the same angle measure. They use estimation to make sense of the measure of an angle and then precisely measure angles by using 180° protractors, extending the rays if needed.
Key Questions
• Why is estimation helpful when measuring angles?
• How can two angles that look different have the same measure?
Achievement Descriptors
FL.4.Mod6.AD4 Estimate angle measures by using the benchmark angles of 30°, 45°, 60°, 90°, and 180°. (MA.4.GR.1.2)
FL.4.Mod6.AD5 Measure and draw angles in degrees. (MA.4.GR.1.2)
© Great Minds PBC 12 LESSON 12
EUREKA MATH2 Florida B.E.S.T. Edition 4 ▸ M6 ▸ TB ▸ Lesson 12 © Great Minds PBC 111 12 Name Date Complete the table. Angle Angle Measure Estimate Actual Angle Measure a. About 40 ° 30° b. About 125 ° 120° c. About 90 ° 90° d. About 175 ° 172°
Agenda
Fluency 10 min
Launch 5 min
Learn 35 min
• Angle Measure Sort
• Extend Rays to Measure Angles
• Measure Angles with Precision
• Problem Set
Land 10 min
Materials
Teacher
• Angle Measure Sort (in the teacher edition)
• Paper Circles (in the teacher edition)
• 4ʺ protractor (180°)
• Straightedge Students
• Angle Measure Sort (in the student book)
• Scissors
• 4ʺ protractor (180°)
• Straightedge
Lesson Preparation
• Print or copy Paper Circles and cut out the circles. Prepare enough for one circle per student and one circle for the teacher.
• Consider whether to remove Angle Measure Sort from the student books and cut out the cards in advance or have students prepare them during the lesson.
© Great Minds PBC 237 EUREKA MATH2 Florida B.E.S.T. Edition 4 ▸ M6 ▸ TB ▸ Lesson 12
Fluency
Whiteboard Exchange: Compose 90
Students complete an addition equation with an unknown addend to prepare for finding unknown angle measures within right angles beginning in topic C.
Display 70 + = 90.
Write and complete the equation.
Give students time to work. When most students are ready, signal for students to show their whiteboards. Provide immediate and specific feedback. If students need to revise, briefly return to validate their corrections.
Display the answer.
Repeat the process with the following sequence:
4 ▸ M6 ▸ TB ▸ Lesson 12 EUREKA MATH2 Florida B.E.S.T. Edition © Great Minds PBC 238
40 + = 90 + 10 = 90 + 37 = 90 + 15 = 90 65 + = 90 53 + = 90 35 + = 90 16 + = 90 50 80 53 75 25 37 55 74 10 70 + = 90 20
Counting on the Protractor
Students count by a unit of 20° on a 180° protractor to develop familiarity with the tool from lesson 11.
Display the image of the 180° protractor with a ray pointing to 0° on the outer scale. Look at the outer scale of the protractor. Which tick mark does the ray cross through? Raise your hand when you know.
Wait until most students raise their hands, and then signal for students to respond.
Use the angle on the protractor to count forward by 20°. The first measurement you say is 0°. Ready?
Display the angle measure increasing in 20° intervals to 180°.
0°, 20°, … , 160°, 180°
Display the image of the 180° protractor with a ray pointing to 0° on the inner scale.
Now look at the inner scale of the protractor. Which tick mark does the ray cross through? Raise your hand when you know.
Wait until most students raise their hands, and then signal for students to respond.
Use the angle on the protractor to count forward by 20°. The first measurement you say is 0°. Ready?
Display the angle measure increasing in 20° intervals to 180°. 0°, 20°, … , 160°, 180°
EUREKA MATH2 Florida B.E.S.T. Edition 4 ▸ M6 ▸ TB ▸ Lesson 12 © Great Minds PBC 239
0°
0°
Choral Response: Classify and Measure Angles
Students classify an angle and use a 180° protractor to determine the angle measure to develop fluency with the skill from lesson 11.
After asking each question, wait until most students raise their hands, and then signal for students to respond.
Raise your hand when you know the answer to each question. Wait for my signal to say the answer.
Display the acute angle.
How would you classify the angle?
Acute
Display the answer.
Estimate the angle measure. Whisper your estimate to your partner.
Provide time for students to think and share with their partner.
45°. It looks like it’s halfway between 0 and 90.
60°. It looks like it’s more than halfway to 90.
Display the protractor.
What is the angle measure?
50°
4 ▸ M6 ▸ TB ▸ Lesson 12 EUREKA MATH2 Florida B.E.S.T. Edition © Great Minds PBC 240
Acute 50°
Display the angle measure.
Repeat the process with the following sequence:
EUREKA MATH2 Florida B.E.S.T. Edition 4 ▸ M6 ▸ TB ▸ Lesson 12 © Great Minds PBC 241
Right 90° Obtuse 145° Acute 35° Obtuse 130° Obtuse 135° Obtuse 157° Acute 62°
Students estimate angle measures within real-world pictures by discussing the closest benchmark angle.
Display the pictures of the real-world examples of angles one at a time.
UDL: Representation
Before revealing the pictures, activate prior knowledge by asking students what they know about benchmark angles. Record benchmark angles such as 45°, 90°, 135°, and 180°. Have students represent the benchmark angles with their arms.
Consider creating an anchor chart to use as a reference throughout the lesson.
For each picture, invite students to think–pair–share about what angles they see and use benchmark angles to describe what the measures of the angles might be.
I see an angle made by the partly opened door. If the door was closed, it would be 0°. If it was perpendicular to the wall, it would form a 90° angle. It’s about halfway between 0° and 90°, so it is probably 45°.
I see that the road going up the hill makes an angle. If the road was flat, it would be 0°. If it was straight up, it would be 90°. It looks about halfway between straight up and flat, so it might be 45°.

The child stretching their arm all the way up makes it look like a straight line from their legs to their arms. That is going to be around 180°.

The opening in the alligator’s mouth makes an angle. It is definitely less than 45°. It is probably around 25°.

Teacher Note
Given the perspective of the pictures, the angles students see may differ from the actual measures of the angles. Estimates based on what is seen in the pictures are acceptable.
4 ▸ M6 ▸ TB ▸ Lesson 12 EUREKA MATH2 Florida B.E.S.T. Edition © Great Minds PBC 242
Launch
5
How could we find the exact angle measure?

We could draw rays on top of the images and then use protractors to check. Transition to the next segment by framing the work.
Today, we will estimate and measure angles with the 180° protractor.
Learn Angle Measure Sort
Materials—S: Angle Measure Sort, scissors
Students use benchmark angles to estimate the measure of an angle and match angles with rays of varying lengths and orientations to their angle measurement.
Display the picture of the four benchmark angles. Invite students to turn and talk about what they notice about these angles.
Differentiation: Support
To support students in recognizing angles in the pictures, consider using a drawing tool to outline the angles or displaying additional pictures with some of the different angles outlined.
These angles are benchmark angles that we can use to estimate the measure of other angles.
Display the picture of the angle and present the following situation.

Pablo says that this angle looks like it is closest to the benchmark angle 90°.

EUREKA MATH2 Florida B.E.S.T. Edition 4 ▸ M6 ▸ TB ▸ Lesson 12 © Great Minds PBC 243
180° 135° 90° 45°
35
Invite students to think–pair–share about whether they agree with Pablo or whether they think the angle looks like it is closer to another benchmark angle.
I do not agree with Pablo. This angle looks closer to a 45° angle.
The angle is too small to be 90°, but it looks larger than a 45° angle. I think it’s somewhere between 45° and 90°.
Guide students to estimate the measure of the angle. Consider asking the following questions.
Which two benchmark angles could this angle be between?
45° and 90°
Is it closer to 45° or closer to 90°?
It looks closer to 45°.
If the angle is larger than 45°, but not close to 90°, what might an estimate of its measure be?
Around 55° or 60°
Repeat the process for the other two angles.
Invite students to remove Angle Measure Sort from their books and cut apart the cards. Direct them to sort the cards by matching the angle cards with the correct angle measures. Circulate as they work and ask the following questions to assess and advance their thinking.
• Is this angle acute? Obtuse?
• What benchmark angle is this angle close to? Which measurement card is closest to the benchmark angle that you are thinking of?
Differentiation: Support
Consider supporting students in matching the angle to its measure or to other angles. To match the angle to its measure, provide students with labeled benchmark angles. Students can trace the angles on their cards with their fingers and trace the benchmark angles. This helps students determine which benchmark angle feels the closest to their angles.
To see that two angles have the same measure, stack the cards to align the angles. Students may need to hold the cards toward a light to be able to see the angles through the paper.
4 ▸ M6 ▸ TB ▸ Lesson 12 EUREKA MATH2 Florida B.E.S.T. Edition © Great Minds PBC 244
• How did you determine your estimate?
• How is it possible for both angles to have the same measurement even though they look different?
Facilitate a brief discussion about the students’ thought processes and the strategies they used to estimate angle measures. Invite two or three students to share their strategies. I looked at each angle measure and thought about what benchmark angle it was close to. Then I found angles that looked like they were close to each angle measure.
First, I grouped all the angle cards together that looked like they had the same angle measure. Then I looked at the measure cards and I figured out which cards would be a good match for each group.
How is it possible for angles that look different to have the same angle measure?
Angles can look different because they are facing different directions, but that does not change the size of the angle.
Extend Rays to Measure Angles
Materials—T/S: Circle, protractor, straightedge
Students extend the rays in angles to find their measure by using a protractor.
Display the picture of the angles and invite students to study them.
What looks similar and different about these angles?
They all have rays of different lengths.
They are facing different directions. They are all acute angles.
EUREKA MATH2 Florida B.E.S.T. Edition 4 ▸ M6 ▸ TB ▸ Lesson 12 © Great Minds PBC 245
A B C D E
Direct students to problem 1 in their books.
1. Find the measure of each angle.
a. Measure of ∠ A : 45°
b. Measure of ∠ B : 45°
c. Measure of ∠C : 45°
d. Measure of ∠ D : 45°
e. Measure of ∠ E : 45°
4 ▸ M6 ▸ TB ▸ Lesson 12 EUREKA MATH2 Florida B.E.S.T. Edition © Great Minds PBC 246
A B C D E
Distribute one paper circle to each student. Guide students to fold the paper circles into eighths.
Model fitting the folded paper to align with ∠ A and invite students to do the same. Direct students to repeat the process with the other angles in problem 1.
What do you notice?
The paper angle fits exactly into all the angles.
What does that tell us about the angles?
The angles are the same size.
How could we find the precise measure of each angle?
We could use a protractor.
Align the protractor to ∠ A and invite students to do the same.
What is the measure of ∠A?
45°
Align the protractor to ∠ B and invite students to do the same.
What do you notice?
It’s hard to see the measure of the angle because the rays are not long enough to cross through the scale on the protractor.
The rays are different lengths, but we determined the angles are the same size. What does that tell us?
The length of the rays can change, but the angle stays the same measure.
We can extend the length of the rays without changing the size of the angle.
Language Support
Extend may be an unfamiliar term to students. Consider previewing the term and relating it to similar words that may be more familiar such as increase or lengthen.
EUREKA MATH2 Florida B.E.S.T. Edition 4 ▸ M6 ▸ TB ▸ Lesson 12 © Great Minds PBC 247
A
Model extending the rays for ∠ B by lining up the rays with the straightedge and drawing longer rays. Invite students to do the same and to use their protractors to measure ∠ B.
B B B B
Direct students to find the measure of the remaining angles, extending rays as necessary. Circulate as students work and provide support as needed. Then facilitate a class discussion.
What about these angles is different from the other angles we measured with the protractor?
The rays were not long enough to reach the scale on the protractor.
What did we do to precisely measure each angle?
We extended the rays so they were long enough to reach the scale on the protractor. Invite students to check that the folded paper angle still fits inside each angle.
Did extending the rays change the measure of the angle? How do you know?
No, extending the rays did not change the angle measurement. The folded paper angle fit inside all the angles at the beginning, and then after we extended the rays, it still fit perfectly inside.
4 ▸ M6 ▸ TB ▸ Lesson 12 EUREKA MATH2 Florida B.E.S.T. Edition © Great Minds PBC 248
Some of the angles had longer rays than other angles. Did the length of the rays affect the size of the angle? Why?
No, the length of the rays did not affect the angle measurement. The size of angle stays the same.
Did the direction the angle was facing affect its measure? Explain. No. We saw that the direction didn’t matter. The measure was still the same amount.
Measure Angles with Precision
Materials—S: Protractor, straightedge
Students practice extending rays to precisely measure angles.
Direct students to problem 2 and read the problem chorally with the class.
Invite students to turn and talk about the types of angles they see and their estimates of the angle measures.
Direct students to work with a partner to complete problem 2, extending the rays of the angles as needed. Circulate as partners work, and provide support.
Promoting the Mathematical Thinking and Reasoning Standards
Students are assessing the reasonableness of solutions (MTR.6) when they estimate an angle measure and use their protractors to measure the angles.
Ask the following questions to promote MTR.6:
• How can you estimate the angle measure? Does your estimate sound reasonable?
• Does your angle measure make sense? Why?
EUREKA MATH2 Florida B.E.S.T. Edition 4 ▸ M6 ▸ TB ▸ Lesson 12 © Great Minds PBC 249
2. Identify the angle type and estimate the measure. Then use a protractor to find the actual angle measure.
Angle Type and Angle Measure Estimate Angle
a. Angle type: Acute Angle measure estimate: 70 ° 60°
UDL: Action & Expression
To support students in monitoring their own progress, consider providing questions that guide self-monitoring and reflection. For example, post the following for students to refer to as they work with a partner:
• Did I picture the benchmark angles in my head before I estimated the angle measure?
• Did I extend the rays so they are drawn long enough to cross through the scale on the protractor?
• Did I rotate the protractor so the zero line is lined up with one of the rays and the vertex is where the zero line and 90° line meet?
b. Angle type: Obtuse Angle measure estimate: 125 ° 120°
• Did I read the correct scale on the protractor? Did I count in the correct direction?
Teacher Note
This lesson focuses on the benchmark angles of 45°, 90°, 135°, and 180°. Students already have familiarity with 90° angles and 180° angles. Angles of 45° and 135° are used as benchmarks because 45° is halfway between 0° and 90°, and 135° is halfway between 90° and 180°. As students become comfortable with the benchmarks in this lesson, consider introducing the benchmarks of 30° and 60°.
4 ▸ M6 ▸ TB ▸ Lesson 12 EUREKA MATH2 Florida B.E.S.T. Edition © Great Minds PBC 250
Actual Angle Measure
c. Angle type: Acute
d. Angle type: Obtuse
After students have finished, invite them to turn and talk about how thinking about the angle type and estimating an angle measure can help them find the precise angle measure.
EUREKA MATH2 Florida B.E.S.T. Edition 4 ▸ M6 ▸ TB ▸ Lesson 12 © Great Minds PBC 251 Angle Type and Angle Measure Estimate Angle Actual Angle Measure
Angle measure estimate:
85°
80 °
Angle measure estimate: 150
143°
°
Problem Set
Differentiate the set by selecting problems for students to finish independently within the timeframe. Problems are organized from simple to complex.
Land
Debrief 5 min
Objective: Estimate and measure angles with a 180° protractor.
Use the following prompts to facilitate a discussion about extending rays to measure angles.
How did estimation help you think about whether your angle measure made sense?
I thought about whether the angle was acute or obtuse. That helped me think about the angle measure.
Benchmark angles gave me an idea of whether my angle measure made sense.
How can two angles that look different have the same measure?
Sometimes the angles look different because they face different directions or because the lengths of the rays are different, but the angle measure can still be the same amount.
When the rays were not long enough to cross through the scale on the protractor, how were you able to precisely measure the angles?
I extended the rays so that they would cross through the scale on the protractor.
Exit Ticket 5 min
Provide up to 5 minutes for students to complete the Exit Ticket. It is possible to gather formative data even if some students do not complete every problem.
4 ▸ M6 ▸ TB ▸ Lesson 12 EUREKA MATH2 Florida B.E.S.T. Edition © Great Minds PBC 252
10
Sample Solutions
Expect to see varied solution paths. Accept accurate responses, reasonable explanations, and equivalent answers for all student work.
© Great Minds PBC 253 EUREKA MATH2 Florida B.E.S.T. Edition 4 ▸ M6 ▸ TB ▸ Lesson 12
EUREKA MATH2 Florida B.E.S.T. Edition 4 ▸ M6 ▸ TB ▸ Lesson 12 © Great Minds PBC 107 12 Name Date Complete the table. Angle Type and Angle Measure Estimate Angle Actual Angle Measure 1. Angle type: Acute Angle measure estimate: 40 ° 30° 2. Angle type: Obtuse Angle measure estimate: 130 ° 140° 3. Angle type: Obtuse Angle measure estimate: 100 ° 95° 4 ▸ M6 ▸ TB ▸ Lesson 12 EUREKA MATH2 Florida B.E.S.T. Edition © Great Minds PBC 108 PROBLEM SET Angle Type and Angle Measure Estimate Angle Actual Angle Measure 4. Angle type: Obtuse Angle measure estimate: 130 ° 122° 5. Angle type: Acute Angle measure estimate: 50 ° 65° 6. Angle type: Obtuse Angle measure estimate: 160 ° 153°
9. Deepa says the angle shown is an acute angle. Ivan says it is an obtuse angle. Use a protractor to measure the angle. Then explain who is correct.
Ivan is correct. The angle measure is 112° which means that it is an obtuse angle because it is greater than 90° and less than 180°
© Great Minds PBC 254 4 ▸ M6 ▸ TB ▸ Lesson 12 EUREKA MATH2 Florida B.E.S.T. Edition EUREKA MATH2 Florida B.E.S.T. Edition 4 ▸ M6 ▸ TB ▸ Lesson 12 © Great Minds PBC 109 PROBLEM SET Angle Type and Angle Measure Estimate Angle Actual Angle Measure 7. Angle type: Acute Angle measure estimate: 80 ° 87° 8. Angle type: Obtuse Angle measure estimate: 175 ° 168° 4 ▸ M6 ▸ TB ▸ Lesson 12 EUREKA MATH2 Florida B.E.S.T. Edition © Great Minds PBC 110 PROBLEM SET
EUREKA MATH2 Florida B.E.S.T. Edition 4 ▸ M6 ▸ TB ▸ Lesson 12 ▸ Angle Measure Sort © Great Minds PBC 255 This page may be reproduced for classroom use only. 36° 87° 112° 172° 138°
4 ▸ M6 ▸ TB ▸ Lesson 12 ▸ Paper Circles EUREKA MATH2 Florida B.E.S.T. Edition © Great Minds PBC 256 This page may be reproduced for classroom use only.
Use a protractor to draw angles up to 180° .
Lesson at a Glance
Students draw angles by using a protractor. Before drawing an angle, students think about the type of the angle and the size of the angle in relation to a benchmark angle. They sketch the angle and then use a protractor and a straightedge to accurately draw the angle.
Key Questions
• What tools can help us draw angles accurately?
• How can estimating an angle measure help determine whether a drawing is reasonable?
Achievement Descriptors
FL.4.Mod6.AD2 Classify angles as acute, right, obtuse, straight, or reflex. (MA.4.GR.1.1)
FL.4.Mod6.AD5 Measure and draw angles in degrees. (MA.4.GR.1.2)
© Great Minds PBC 13
13
LESSON
EUREKA MATH2 Florida B.E.S.T. Edition 4 ▸ M6 ▸ TB ▸ Lesson 13 © Great Minds PBC 125 13 Name Date Construct a 130°
angle. Draw an arc to show the angle.
Agenda
Fluency 10 min
Launch 5 min
Learn 35 min
• Use a Protractor to Draw Angles
• Sketch and Draw Angles
• Problem Set
Land 10 min
Materials
Teacher
• Straightedge
• 4ʺ protractor (180°)
Students
• Compose 90 Sprint (in the student book)
• Straightedge
• 4ʺ protractor (180°)
Lesson Preparation
Consider tearing out the Sprint pages in advance of the lesson.
EUREKA MATH2 Florida B.E.S.T. Edition 4 ▸ M6 ▸ TB ▸ Lesson 13 © Great Minds PBC 259
Fluency
Sprint: Compose 90
Materials—S: Compose 90
Students complete an addition equation with an unknown addend to prepare for finding unknown angle measures within right angles beginning in topic C.
Sprint
Have students read the instructions and complete the sample problems.
Complete the equations.
1. 60 + = 90 30
2. + 45 = 90 45
Direct students to Sprint A. Frame the task:
I do not expect you to finish. Do as many problems as you can, your personal best.
Take your mark. Get set. Think!
Time students for 1 minute on Sprint A.
Stop! Underline the last problem you did.
I’m going to read the answers. As I read the answers, call out “Yes!” if you got it correct. If you made a mistake, circle the answer.
Read the answers to Sprint A quickly and energetically.
Count the number you got correct and write the number at the top of the page. This is your personal goal for Sprint B.
Celebrate students’ effort and success.
4 ▸ M6 ▸ TB ▸ Lesson 13 EUREKA MATH2 Florida B.E.S.T. Edition © Great Minds PBC 260
EUREKA MATH2 Florida B.E.S.T. Edition 4 ▸ M6 ▸ Sprint ▸ Compose 90
10
Provide about 2 minutes to allow students to complete more problems or to analyze and discuss patterns in Sprint A. If students are provided time to complete more problems on Sprint A, reread the answers but do not have them alter their personal goals.
Lead students in one fast-paced and one slow-paced counting activity, each with a stretch or physical movement.
Point to the number you got correct on Sprint A. Remember, this is your personal goal for Sprint B.
Direct students to Sprint B.
Take your mark. Get set. Improve!
Time students for 1 minute on Sprint B.
Stop! Underline the last problem you did.
I’m going to read the answers. As I read the answers, call out “Yes!” if you got it correct. If you made a mistake, circle the answer.
Read the answers to Sprint B quickly and energetically.
Count the number you got correct and write the number at the top of the page.
Determine your improvement score and write the number at the top of the page.
Celebrate students’ improvement.
Teacher Note
Consider asking the following questions to discuss the patterns in Sprint A:
• What do you notice about problems 1–4? 11–15?
• How do problems 1–4 compare to problems 11–14?
Teacher Note
Count forward by 10 degrees from 0° to 90° for the fast-paced counting activity.
Count backward by 10 degrees from 90° to 0° for the slow-paced counting activity.
EUREKA MATH2 Florida B.E.S.T. Edition 4 ▸ M6 ▸ TB ▸ Lesson 13 © Great Minds PBC 261
Launch
Students watch a video and discuss the importance of accuracy in angle drawings. Play Building a Birdhouse. If necessary, replay the video and ask students to note any details. Give students 1 minute to turn and talk about what they noticed. Engage students in a brief conversation about the video. Discuss student observations and any relevant questions they have. Guide the conversation toward how making accurate measurements made a difference in the final product. Consider the following possible sequence of questions.
What did you notice?
I noticed that one character was very careful with their materials and one character was not.
The character who took their time and used their tools correctly was able to build a birdhouse successfully. The other character’s birdhouse just collapsed.
The characters had protractors and straightedges like we do, but they were drawing on wood and cutting out boards.
What did you wonder?
I wondered what kinds of angles you need to draw to make a birdhouse like that.
I wondered why the measurements made a difference in how well the birdhouse stayed together.
What was different about how the characters measured and drew their angles? How did the accuracy of their work affect their birdhouse?
The second character used a protractor and a straightedge. Their birdhouse stayed together.
The first character drew an angle without measuring it and without making sure the rays were straight. Their birdhouse didn’t fit together and fell apart.
Transition to the next segment by framing the work.
Today, we will accurately draw angles by using a 180° protractor.
UDL: Representation
Presenting the birdhouse situation in a video format supports students in understanding the context by removing barriers associated with written and spoken language.
4 ▸ M6 ▸ TB ▸ Lesson 13 EUREKA MATH2 Florida B.E.S.T. Edition © Great Minds PBC 262
5
Learn
Use a Protractor to Draw Angles
Materials—T/S: Straightedge, protractor
Students estimate the size of an angle, draw the angle by using a protractor and a straightedge, and use their estimate to determine whether their drawing is reasonable.
Invite students to turn and talk about how they could use their tools to accurately measure and draw an angle.
Write 40°. Then lead students in a discussion about the relationship between a 40° angle and the measure of a benchmark angle. Consider using the following sequence of questions.
Before we draw an angle, it can be helpful to think about the type of angle we will draw and the size of the angle compared to a benchmark angle.
What type of angle is a 40° angle? Acute
What benchmark angle is 40° close to?
45°
Let’s estimate what a 40° angle looks like. How can I sketch what it would look like? Draw an angle a little bit smaller than a 45° angle.
Sketch an angle that is a bit smaller than a 45° benchmark angle by thinking about the size of a 45° angle.
Language Support
Sketch is a familiar term from previous grades. Consider reviewing the term with students. A sketch is a quick drawing that may not exactly match the accurate drawing. It is intended to be an estimate that helps us assess the reasonableness of our accurate drawing.
EUREKA MATH2 Florida B.E.S.T. Edition 4 ▸ M6 ▸ TB ▸ Lesson 13 © Great Minds PBC 263
35
Direct students to problem 1 in their books. Read the problem chorally with the class.
1. Use a protractor and a straightedge to draw a 40° angle.
Model drawing a 40° angle. Support students by describing how to use a protractor and a straightedge as you model the process. Invite students to measure and draw along with you.
I use my straightedge to draw a ray. Next, I line up the protractor with the ray as if I were going to measure an angle. I find the tick mark that represents 40° on the scale of the protractor, and then I draw a tick mark on my paper that lines up with the tick mark on the protractor.
I remove the protractor and use my straightedge to draw the second ray from the endpoint of the first ray to the tick mark that I drew. I draw an arrowhead at the end of the second ray. I draw an arc to indicate the angle.
Does a measure of 40° for this angle seem reasonable? Why?
Yes, the measure seems reasonable. It is an acute angle just like we estimated. Yes, the measure seems reasonable. The measure of the angle looks like the angle you sketched.
4 ▸ M6 ▸ TB ▸ Lesson 13 EUREKA MATH2 Florida B.E.S.T. Edition © Great Minds PBC 264
Demonstrate using the protractor to check that the drawn angle measures 40°.
Display the picture showing a 40° angle that is drawn incorrectly.
Look at this student’s drawing of a 40° angle.
Have students think–pair–share about what mistake the student made. The student used the wrong scale. They should have used the inner scale on the protractor, but they used the outer scale.
Their angle is an obtuse angle, so it can’t be a 40° angle.
Why do you think the student made this mistake and thought this was a 40° angle?
Maybe the student just looked at the numbers on the protractor and used the 40 they saw first instead of thinking about whether the angle would be acute or obtuse.
How can thinking about the angle type and estimating an angle measure help us draw angles accurately?
It helps to know whether our angle is reasonable because we can think about what that type of angle should look like and about how big our angle should be.
Sketch and Draw Angles
Students sketch a given angle and then use a 180° protractor to draw the angle.
Direct students to problems 2–6. Read the directions chorally with the class.
EUREKA MATH2 Florida B.E.S.T. Edition 4 ▸ M6 ▸ TB ▸ Lesson 13 © Great Minds PBC 265
Create a sketch of each angle. Then use a protractor and a straightedge to draw the angle. Draw an arc to show the angle.
Angle Sketch Accurate Drawing
Differentiation: Challenge
Consider challenging students to draw reflex angles such as 190° or 285° by using a 180° protractor. Students may think about benchmark angles or reason that they may be able to create reflex angles by combining acute, right, and obtuse angles.
Differentiation: Support
Consider providing a template with several pairs of perpendicular line segments for students to use as they sketch angles.
4 ▸ M6 ▸ TB ▸ Lesson 13 EUREKA MATH2 Florida B.E.S.T. Edition © Great Minds PBC 266
2. 97°
3. 174°
EUREKA MATH2 Florida B.E.S.T. Edition 4 ▸ M6 ▸ TB ▸ Lesson 13 © Great Minds PBC 267
Angle Sketch Accurate Drawing
4. 151°
5. 29°
Angle Sketch Accurate Drawing
Promoting the Mathematical Thinking and Reasoning Standards
When students sketch an angle and then use their protractor to draw the angle more accurately, they are completing tasks with mathematical fluency (MTR.3).
Ask the following questions to promote MTR.3:
• How exact do you need to be when using a protractor to draw an angle?
• When using a protractor to draw a 100° angle, what steps do you need to be extra careful with? Why?
Direct students to problem 2. Invite students to turn and talk about the benchmark angle that is close to 97° and what type of angle 97° is.
Direct students to sketch the angle and to compare their sketch to their partner’s sketch. Then have students draw the 97° angle by using a protractor and a straightedge. Circulate as students work and provide support as needed.
When students are finished, lead them in a discussion about the accuracy of their drawings.
How does your drawing of the angle compare to the sketch that you made?
They look very similar. A ray is pointing in a slightly different direction.
The angle in my sketch is a bit smaller than the angle in the accurate drawing.
Do you think your drawing of the angle is reasonable? Why?
Yes. I think it is reasonable. We predicted that it would look like a right angle and it is really similar to one.
Invite students to use their protractors to check the measures of their angles. Direct students to revise their drawings as necessary.
Teacher Note
The Construct an Angle interactive allows students to make angles of given measures.
Consider demonstrating the activity for the whole class or allowing students to experiment with the tool individually.
4 ▸ M6 ▸ TB ▸ Lesson 13 EUREKA MATH2 Florida B.E.S.T. Edition © Great Minds PBC 268
6. 83°
Direct students to complete problems 3–6. Provide support as needed.
Invite students to turn and talk about the accuracy of their drawings. Use questions similar to the following to guide students:
• How accurate were your drawings?
• How can you make the drawings more accurate?
• Were your final drawings close to your sketches?
• If your sketches were not very close to your accurate drawings, how can you improve your sketches?
Problem Set
Differentiate the set by selecting problems for students to finish independently within the timeframe. Problems are organized from simple to complex.
Land
Debrief 5 min
Objective: Use a protractor to draw angles up to 180°.
Use the following prompts to facilitate a discussion about creating precise drawings of angles.
What tools can help us draw angles accurately?
Protractors and straightedges
The numbers and tick marks on the protractors help us to locate exact measures.
How can estimating an angle measure help determine whether a drawing is reasonable?
Estimating and drawing a sketch gives me something to compare my drawing to so I know whether my drawing is reasonable. I can think about the type of angle.
UDL: Engagement
Students may feel frustrated or unsure as they sketch drawings and gain comfort with the use of the protractor. Facilitate personal coping skills by discussing strategies for persevering and dealing with frustration:
• Use self-talk with statements such as, “I can do this.”
• Have a growth mindset: Instead of thinking “I just can’t draw it,” think “I can’t draw it yet.”
• Pause to take deep breaths and calm down before working again.
• Ask a classmate or the teacher a clarifying question.
Teacher Note
Sketching angles before constructing them is a scaffold to support students in thinking about what the completed drawings of the angles will look like. Students are not required to sketch angles before making accurate drawings in the Problem Set, but they can continue to sketch the angles if it is helpful.
EUREKA MATH2 Florida B.E.S.T. Edition 4 ▸ M6 ▸ TB ▸ Lesson 13 © Great Minds PBC 269
10
If the drawing is very different from the sketch, or it looks like an obtuse angle when it should have been acute, then I know there is probably a mistake. Display Tahkt-I-Sulayman Variation II, 1969, by Frank
Stella.
The painting on the cover of your book is called Tahkt-I-Sulayman Variation II. The artist, Frank Stella, named the painting after an ancient city in what is now the country of Iran. The ancient city was shaped like a circle. He painted more than 100 paintings like this one.
Use the following questions to help students engage with the art:
• What do you notice in the painting?
• What do you wonder?
Guide students to think about the painting in terms of a protractor.
The painting is from a group of paintings called the Protractor series. The artist put the protractor on display in many paintings. Where in the painting do you see shapes that remind you of a protractor?
When I look at two squares that are side by side, I can see a half circle that looks like a protractor.
It looks like he traced the edge of a protractor from 0° to 90° to make each quarter circle.
The rainbows look like quarter turns, which we can show with 90° on a protractor. Invite students to turn and talk about how the colors in the painting help them see the protractor shapes in the painting and how the precision in the painting reminds them of being precise in mathematics.

Exit Ticket 5 min
Provide up to 5 minutes for students to complete the Exit Ticket. It is possible to gather formative data even if some students do not complete every problem.
4 ▸ M6 ▸ TB ▸ Lesson 13 EUREKA MATH2 Florida B.E.S.T. Edition © Great Minds PBC 270
Sample Solutions
Expect to see varied solution paths. Accept accurate responses, reasonable explanations, and equivalent answers for all student work.
EUREKA MATH2 Florida B.E.S.T. Edition 4 ▸ M6 ▸ TB ▸ Lesson 13 © Great Minds PBC 271
4 ▸ M6 ▸ Sprint ▸ Compose 90 EUREKA MATH2 Florida B.E.S.T. Edition © Great Minds PBC 114
ANumber Correct: Complete the equations. 1. 80 + = 90 10 2. 70 + = 90 20 3. 60 + = 90 30 4. 50 + = 90 40 5. 90 + = 90 0 6. + 20 = 90 70 7. + 40 = 90 50 8. + 10 = 90 80 9. + 30 = 90 60 10. + 0 = 90 90 11. 85 + = 90 5 12. 75 + = 90 15 13. 65 + = 90 25 14. + 55 = 90 35 15. + 45 = 90 45 16. + 15 = 90 75 17. 25 + = 90 65 18. 45 + = 90 45 19. 35 + = 90 55 20. + 5 = 90 85 21. + 65 = 90 25 22. + 55 = 90 35 23. 86 + = 90 4 24. 76 + = 90 14 25. + 66 = 90 24 26. + 56 = 90 34 27. 56 + = 90 34 28. 57 + = 90 33 29. + 67 = 90 23 30. + 77 = 90 13 31. 87 + = 90 3 32. 88 + = 90 2 33. + 70 = 90 20 34. + 60 = 90 30 35. 10 + 70 + = 90 10 36. 30 + 10 + = 90 50 37. 10 + + 50 = 90 30 38. 10 + + 55 = 90 25 39. + 55 + 20 = 90 15 40. + 20 + 45 = 90 25 41. 32 + 45 + = 90 13 42. 25 + + 32 = 90 33 43. + 41 + 25 = 90 24 44. 33 + + 41 = 90 16 4 ▸ M6 ▸ Sprint ▸ Compose 90 EUREKA MATH2 Florida B.E.S.T. Edition © Great Minds PBC 116 B Number Correct: Improvement: Complete the equations. 1. 80 + = 90 10 2. 70 + = 90 20 3. 60 + = 90 30 4. 50 + = 90 40 5. 90 + = 90 0 6. + 10 = 90 80 7. + 30 = 90 60 8. + 40 = 90 50 9. + 20 = 90 70 10. + 0 = 90 90 11. 85 + = 90 5 12. 75 + = 90 15 13. 65 + = 90 25 14. + 55 = 90 35 15. + 45 = 90 45 16. + 5 = 90 85 17. 15 + = 90 75 18. 45 + = 90 45 19. 55 + = 90 35 20. + 35 = 90 55 21. + 65 = 90 25 22. + 25 = 90 65 23. 87 + = 90 3 24. 77 + = 90 13 25. + 67 = 90 23 26. + 57 = 90 33 27. 57 + = 90 33 28. 58 + = 90 32 29. + 68 = 90 22 30. + 78 = 90 12 31. 88 + = 90 2 32. 89 + = 90 1 33. + 80 = 90 10 34. + 70 = 90 20 35. 70 + 10 + = 90 10 36. 10 + 30 + = 90 50 37. 50 + + 10 = 90 30 38. 55 + + 10 = 90 25 39. + 20 + 55 = 90 15 40. + 45 + 20 = 90 25 41. 45 + 32 + = 90 13 42. 32 + + 25 = 90 33 43. + 25 + 41 = 90 24 44. 41 + + 33 = 90 16
Use the ray, a protractor, and a straightedge to construct the angle. Draw an arc to show the angle.
4 ▸ M6 ▸ TB ▸ Lesson 13 EUREKA MATH2 Florida B.E.S.T. Edition © Great Minds PBC 272 EUREKA MATH2 Florida B.E.S.T. Edition 4 ▸ M6 ▸ TB ▸ Lesson 13 © Great Minds PBC 121 13 Name Date
1. 40° 2. 75° 3. 125° 4. 165° 4 ▸ M6 ▸ TB ▸ Lesson 13 EUREKA MATH2 Florida B.E.S.T. Edition © Great Minds PBC 122 PROBLEM SET 5. 63° 6. 148°
angle. 7. 10° 8. 115° 9. 37° 10. 128°
Construct the angle. Draw an arc to show the
Jayla can start at 90° and then count 40° to the left or to the right on the protractor. She can make a tick mark at 50 or 130 and use her straightedge to draw a ray from the endpoint of the original ray to the tick mark she made. Then she can draw the arc to show the angle.
EUREKA MATH2 Florida B.E.S.T. Edition 4 ▸ M6 ▸ TB ▸ Lesson 13 © Great Minds PBC 273 EUREKA MATH2 Florida B.E.S.T. Edition 4 ▸ M6 ▸ TB ▸ Lesson 13 © Great Minds PBC 123 PROBLEM SET 11. 82° 12.
173°
13. Jayla places a protractor over a ray. Show and explain how she can make a 40° angle.
Topic C Determine Unknown Angle Measures
In topic C, students apply their understanding of angle measurement from topic B and recognize that angle measure is additive. They then use their new understanding to determine the unknown measures of angles.
Students begin decomposing angles concretely by using pattern blocks and paper. They decompose larger angles with unknown measures by using pattern blocks and find the measures of the larger angles by adding together the known measures of the angles of the pattern blocks. They fold paper to show composition and decomposition of angles with known measures, including the benchmark angles of 90° and 180°. Students then move to labeled drawings containing known and unknown angle measures. They use part–total relationships to write equations with letters for the unknown angle measures. They find the unknown angle measures by using addition or subtraction.
Developing familiarity with benchmark angles and their relationships is an important aspect of the topic. Students work with right angles and straight angles decomposed into benchmark angles including, as applicable, those measuring 30°, 45°, 60°, 90°, and 120°.
© Great Minds PBC 275
Progression of Lessons
Lesson 14
Decompose angles by using pattern blocks.
Lesson 15
Find unknown angle measures within right and straight angles.
Lesson 16
Find unknown angle measures within a decomposed angle of up to 180°.
The measure of ∠FGH is 75°.
I can find the unknown measure of a larger angle by using the known measures of angles in pattern blocks. I use pattern blocks to decompose the larger angle and then add the smaller known angle measures to find the larger unknown angle measure. I can decompose acute, right, obtuse, straight, and reflex angles.
x + 60 = 90
x = 30
The measure of ∠CAD is 30˚.
When I decompose a right angle into two angles, I know the sum of the two angle measures is 90°. I can find one angle measure if I know the other angle measure. I can use the same thinking to find an unknown angle measure when a straight angle is decomposed into smaller angles. The difference is that the sum of the angle measures in a straight angle is 180°.
I can find an unknown angle measure when an angle of any size is decomposed into two or more angles by using what I know about the part–total relationships. The unknown angle measure can be the measure of one of the parts or it can be the measure of the total angle.
4 ▸ M6 ▸ TC EUREKA MATH2 Florida B.E.S.T. Edition © Great Minds PBC 276
L
AB x° 60° D C
36° b° H I F G
Decompose angles by using pattern blocks.
Lesson at a Glance
Students use known angle measures of pattern blocks to find other angle measures in pattern blocks. They decompose angles into smaller known angles by using pattern blocks and then add the measures of smaller angles to find the unknown measure of a larger angle.
Key Questions
• How can angles be decomposed?
• How can decomposing an angle help find the measure of the angle?
Achievement Descriptor
FL.4.Mod6.AD6 Solve for unknown angle measures by using addition and subtraction. (MA.4.GR.1.2) (MA.4.GR.1.3)
© Great Minds PBC 14 LESSON 14
EUREKA MATH2 Florida B.E.S.T. Edition 4 ▸ M6 ▸ TC ▸ Lesson 14 © Great Minds PBC 137 14 Name Date Use the pattern blocks to answer the question. 30˚ 30˚ 150 150 60˚ 60˚ 60 60 60˚ 120 120 120 120 120 120 120 120 What is the measure of the angle shown by the arc? 120°
Agenda
Fluency 10 min
Launch 5 min
Learn 35 min
• Pattern Block Angles
• Find Angle Measures
• Decompose an Angle
• Problem Set
Land 10 min
Materials Teacher
• Pattern Block Cutouts (in the teacher edition)
• Scissors Students
• Straightedge
• Pattern Block Cutouts (in the student book)
• Scissors
Lesson Preparation
• Prepare one set of Pattern Block Cutouts in advance for teacher use.
• Consider whether to remove Pattern Block Cutouts from the student books and cut out the five pattern blocks in advance or to have students prepare them during the lesson.
© Great Minds PBC 279 EUREKA MATH2 Florida B.E.S.T. Edition 4 ▸ M6 ▸ TC ▸ Lesson 14
Fluency
Whiteboard Exchange: Relate Division and Multiplication
Students complete a division equation by using a related multiplication equation to build multiplication and division fluency within 144.
After each prompt for a written response, give students time to work. When most students are ready, signal for students to show their whiteboards. Provide immediate and specific feedback. If students need to revise, briefly return to validate their corrections.
Display 28 ÷ 4 = .
Write a related multiplication equation that would help you complete the division equation.
Display the sample multiplication equation: 4 × 7 = 28.
Write and complete the division equation.
Display the completed division equation.
Repeat the process with the following sequence:
4 ▸ M6 ▸ TC ▸ Lesson 14 EUREKA MATH2 Florida B.E.S.T. Edition © Great Minds PBC 280
40 ÷ 8 = 99 ÷ 9 = 120 ÷ 12 = 72 ÷ 12 = 84 ÷ 12 = 0 ÷ 12 = 56 ÷ 7 = 81 ÷ 9 = 8 ÷ 8 = 10 28 ÷ 4 = 4 × 7 = 28 7
Whiteboard Exchange: Draw Geometric Figures
Materials—S: Straightedge
Students draw an example of a specified point, ray, or angle to build familiarity with the geometric figures and notations.
Display point A.
On my signal, read the name of the figure. Ready? point A
Draw an example of point A.
Point A A
Give students time to work. When most students are ready, signal for students to show their whiteboards. Provide immediate and specific feedback. If students need to revise, briefly return to validate their corrections.
Show the sample image of the geometric figure.
Repeat the process with the following sequence:
Show Me: Fractional Turns
Students use their bodies to show turns and relate the turns to angle measures to build kinesthetic memory for terms and measures from topic B.
Invite students to stand up and make sure they have enough space to turn in a circle.
Let’s use our bodies to show turns. Face the front of the room.
Show me a whole turn.
(Turns clockwise or counterclockwise and ends facing the front of the room)
How many degrees did you turn?
360°
Teacher Note
Validate all correct responses that may not exactly match the image displayed in the sample answer. For example, for angle D , a student may choose to draw an obtuse or right angle when the angle shown is acute. Note which attributes of the figure are required to constitute a correct answer.
EUREKA MATH2 Florida B.E.S.T. Edition 4 ▸ M6 ▸ TC ▸ Lesson 14 © Great Minds PBC 281
Ray BC B C Angle D D Angle EFG FE G AB A B ED C H ∠B B ∠EDC Point H
Show me a half-turn.
(Turns clockwise or counterclockwise and ends facing the back of the room)
How many degrees did you turn?
180°
Face the front of the room. Turn clockwise to show a quarter-turn.
(Turns to their right)
How many degrees did you turn?
90°
Face the front of the room again. Turn counterclockwise to show a quarter-turn.
(Turns to their left)
How many degrees did you turn?
90°
Repeat to show a three-quarter turn twice, first by turning clockwise and then by turning counterclockwise.
4 ▸ M6 ▸ TC ▸ Lesson 14 EUREKA MATH2 Florida B.E.S.T. Edition © Great Minds PBC 282
Launch
Students notice and wonder about angles composed of pattern block angles.
Display the picture of the right angles and pattern blocks.
What do you notice about the two angles shown?
They are both right angles.
The pattern blocks fit inside the angles.
One right angle matches the right angle in the square. The other right angle matches the angle made by putting 3 tan rhombuses together.
What do you wonder about the angles in the tan rhombus?
I wonder if smaller angles can be used to create larger angles.
I wonder what the measure of the angle in the rhombus is.
I wonder if the right angle can help us find the measure of the angle in the rhombus.
Display the picture of the acute angles and pattern blocks.
How are these angles different from the angles we just looked at?
They are acute angles instead of right angles.
One of the angles in the blue rhombus matches the angle made by putting two tan rhombuses together.
What do you wonder about the angles in these shapes?
I wonder what the measure of the angle in the blue rhombus is.
I wonder if we can use the angles in one shape to determine the measures of the angles in another shape.
Transition to the next segment by framing the work.
Today, we will decompose larger angles into smaller angles and use the smaller angles to find the measures of larger angles.
Language Support
Consider creating a word bank of pattern block names and descriptions for students to reference when giving explanations in the lesson. Consider using color-coding in the word bank to connect the picture and term.
• orange square
• blue rhombus
• tan rhombus
• yellow hexagon
• green triangle
EUREKA MATH2 Florida B.E.S.T. Edition 4 ▸ M6 ▸ TC ▸ Lesson 14 © Great Minds PBC 283
5
Learn
Pattern Block Angles
Materials—T/S: Pattern Block Cutouts, scissors
Students find the measures of larger angles by using a pattern block with a 30° angle measure.
Invite students to remove Pattern Block Cutouts from their books and to cut out the five pattern block shapes. Pair students and direct them to share their shapes for the following segment.
Direct students to ∠ A in their books.
What do you know about the measure of ∠ A? How do you know?
It is 90° because it is labeled with a small square.
It is a right angle, or 90°.
Let’s decompose the right angle by using a different shape.
1. Decompose each angle to find its measure.
If available, gather wooden or plastic pattern blocks for students to use in place of the paper cutouts. Teacher Note
Throughout the lesson, students decompose larger angles into smaller angles and then use the measures of the smaller angles to find the measure of the larger angle. Finding the measure of a larger angle by adding the measures of smaller angles could also be viewed as composition. Ultimately, the objective is for students to know that the angle measure of the larger angle (i.e., the whole) is the sum of the angle measures of the smaller angles (i.e., the parts).
4 ▸ M6 ▸ TC ▸ Lesson 14 EUREKA MATH2 Florida B.E.S.T. Edition © Great Minds PBC 284
A B 30° 35
Teacher Note
Guide students in overlaying one tan rhombus at a time to show the decomposition of the right angle into three acute angles from three rhombuses.
How many acute angles of a tan rhombus did we use to decompose the right angle?
We know the right angle is 90°. How can we find the measure of each acute angle?
We can think about 3 × = 90.
We can find 90 ÷ 3 because there are three angles that have the same measure.
What is the measure of each acute angle?
30°
Invite students to label the measure of ∠B as 30° in their books.
Direct students to ∠C.
How can we use the 30° angle to find the measure of ∠C?
We can see how many it takes to decompose the angle.
EUREKA MATH2 Florida B.E.S.T. Edition 4 ▸ M6 ▸ TC ▸ Lesson 14 © Great Minds PBC 285
3
A C 60° D 60° E 60°
Guide students in overlaying one tan rhombus at a time to decompose the acute angle.
How many acute angles did we use to decompose ∠C?
What is the measure of ∠C? How do you know?
It is 60° because 2 × 30 = 60.
Invite students to label the measure of ∠C as 60°.
∠D and ∠ E represent the other angles of the green triangle. What is your estimate for the measure of each angle? Why?
They are acute, so they are less than 90°.
They look like the same measure as ∠C. I estimate 60°.
Invite students to use the same process to find the measures of ∠D and ∠E. Then record the angle measures as a class.
What do you notice about the measure of each angle in the green triangle?
They are all equal. All the angles measure 60°.
Direct students to ∠F and ∠G.
Do you think the measures of the angles in the blue rhombus are also equal? Explain.
I don’t think they are equal because ∠F is an acute angle and ∠G is an obtuse angle.
4 ▸ M6 ▸ TC ▸ Lesson 14 EUREKA MATH2 Florida B.E.S.T. Edition © Great Minds PBC 286
2
C F 60° 60° G 120° 120°
Repeat the process used to decompose ∠ A, ∠B, ∠C, ∠D, and ∠E by directing students to use the tan rhombuses to decompose and then find and record the measures of ∠ F and ∠G.
We decomposed two of the angles in the blue rhombus. How many other angles does the blue rhombus have that we didn’t decompose?
Invite students to trace the other acute and obtuse angles in the blue rhombus with their fingers.
How can we find the measures of these angles?
We can use the same process.
We can decompose the angles by using the acute angle in the tan rhombus. The angles in the blue rhombus look like they are the same measure as ∠F and ∠G.
Direct students to find and record the measures of the other angles in the blue rhombus.
How do the other angles in the blue rhombus compare to ∠ F and ∠G?
The acute angle is 60°, the same measure as ∠F.
The obtuse angle is 120°, the same measure as ∠G.
Give students 1 minute to find the measures of ∠H and the other angles in the yellow hexagon.
What do you notice about the measures of the angles in the pattern block shapes?
Many of the angles have the same measure, either 60° or 120°.
The angle measures are all multiples of 30.
EUREKA MATH2 Florida B.E.S.T. Edition 4 ▸ M6 ▸ TC ▸ Lesson 14 © Great Minds PBC 287
2
H 120° 120° 120° 120° 120° 120°
Invite students to turn and talk about how they used the acute angle in the tan rhombus to find the angle measures of the other angles in the pattern block shapes.
Find Angle Measures
Students add angle measures to find the measure of a larger angle. Direct students to problem 2 in their books.
Find the measure of the angle represented by the arc. 2.
UDL: Action & Expression
Consider referring students back to the work from the last segment where they recorded angle measures in their books. The recorded measures of angles can be used to help complete problems 2–4.
I
30 + 90 = 120
The measure of ∠I is 120° .
Which angles of the pattern block shapes show how ∠I is decomposed?
The right angle in the square and the acute angle in the tan rhombus.
What type of angle is ∠I?
Obtuse
What does that tell us about the angle measure?
It’s larger than 90° and less than 180°.
4 ▸ M6 ▸ TC ▸ Lesson 14 EUREKA MATH2 Florida B.E.S.T. Edition © Great Minds PBC 288
Invite students to think–pair–share about an equation they could write to determine the measure of ∠I.
We can add the measure of each angle that we used to show how ∠I can be decomposed.
30 + 90 = 120
Direct students to complete the equation in problem 2.
Is the measure of ∠I that we found reasonable for the type of angle that it is?
Yes, 120° is the measure of an obtuse angle.
Invite students to turn and talk about how they used smaller angles to find the measure of ∠I.
Repeat the process to complete problems 3 and 4.
60 + 120 = 180
The measure of ∠J is 180° .
EUREKA MATH2 Florida B.E.S.T. Edition 4 ▸ M6 ▸ TC ▸ Lesson 14 © Great Minds PBC 289
J
3.
120 + 120 = 240
The measure of ∠K is 240° .
Invite students to turn and talk about how the measures of smaller angles can be added to find the measure of a larger angle.
Differentiation: Challenge
Consider challenging students by asking them to use three or more pattern blocks to decompose ∠ J and ∠K. Invite them to record the related addition equation.
4 ▸ M6 ▸ TC ▸ Lesson 14 EUREKA MATH2 Florida B.E.S.T. Edition © Great Minds PBC 290 4. K
Decompose an Angle
Materials—S: Pattern blocks
Students use pattern blocks to decompose an angle and find the measure. Give students 2 minutes to use pattern blocks to complete problem 5.
5. Use pattern blocks to decompose ∠L.
a. Write an equation to find the measure of ∠ L. 30 + 120 = 150
b. The measure of ∠L is 150° .
Sample:
Direct students to discuss their decompositions and equations with a partner. Circulate and listen as they talk. Identify two or three students to share their thinking. Purposefully choose work that allows for rich discussion about connections between strategies used to find the measure of ∠ L.
Promoting the Mathematical Thinking and Reasoning Standards
Students apply mathematics to real-world contexts (MTR.7) as they compose and decompose angles by using the various pattern blocks and determine the measure of an angle by using what is known about the pattern block angles.
Ask the following questions to promote MTR.7:
• What does using a tan rhombus and a yellow hexagon to compose an angle tell you about its angle measure?
• How does a blue rhombus represent an acute or an obtuse angle?
EUREKA MATH2 Florida B.E.S.T. Edition 4 ▸ M6 ▸ TC ▸ Lesson 14 © Great Minds PBC 291
L
L
Then facilitate a class discussion. Invite students to share their work with the whole group. Ask questions that invite students to make connections and encourage them to ask questions of their own. Consider questions such as the following:
• How did you decompose the angle?
• How did decomposing the angle help you find the measure of the angle?
As students discuss, highlight thinking that shows connections between strategies.
Invite students to turn and talk about how a classmate’s strategy was similar to or different from their own.
Problem Set
Differentiate the set by selecting problems for students to finish independently within the timeframe. Problems are organized from simple to complex.
4 ▸ M6 ▸ TC ▸ Lesson 14 EUREKA MATH2 Florida B.E.S.T. Edition © Great Minds PBC 292
L L L 30 + 120 = 150 60 + 30 + 60 = 150 60 + 90 = 150
Land
Debrief 5 min
Objective: Decompose angles by using pattern blocks.
Use the following prompts to facilitate a discussion about decomposing angles.
How can we decompose angles?
We can decompose angles into smaller angles and use pattern blocks to find their measure.
We can decompose an angle into smaller angle measures that are the same or smaller angle measures that are different.
How can decomposing an angle help you find the measure of the angle?
If you know the measures of the smaller angles, you can add them together to find the measure of the larger angle.
Exit Ticket 5 min
Provide up to 5 minutes for students to complete the Exit Ticket. It is possible to gather formative data even if some students do not complete every problem.
EUREKA MATH2 Florida B.E.S.T. Edition 4 ▸ M6 ▸ TC ▸ Lesson 14 © Great Minds PBC 293
10
Sample Solutions
Expect to see varied solution paths. Accept accurate responses, reasonable explanations, and equivalent answers for all student work.
4 ▸ M6 ▸ TC ▸ Lesson 14 EUREKA MATH2 Florida B.E.S.T. Edition © Great Minds PBC 294
EUREKA MATH2 Florida B.E.S.T. Edition 4 ▸ M6 ▸ TC ▸ Lesson 14 © Great Minds PBC 133 14 Name Date Use the pattern blocks to complete problems 1–4. 30 30 150 150 60 60 60 60 60 120 120˚ 120˚ 120˚ 120˚ 120 120 120 1. Find the measures of ∠ A and ∠B. Then add to find the measure of ∠C A The measure of ∠ A is 60° B The measure of ∠B is 30° C Addition equation: 60 + 30 = 90 The measure of ∠C is 90° 2. Find the measures of ∠D and ∠ E. Then add to find the measure of ∠ F D The measure of ∠D is = 90° E The measure of ∠ E is 120° . F Addition equation: 120 + 90 = 210 The measure of ∠F is 210° 4 ▸ M6 ▸ TC ▸ Lesson 14 EUREKA MATH2 Florida B.E.S.T. Edition © Great Minds PBC 134 PROBLEM SET 3. Write an equation and find the measure of the angle represented by the arc. Angle Equation Measure 30 + 120 = 150 150° 60 + 120 = 180 180° 90 + 150 + 90 = 330 330°
4. The measure of ∠Z is 120°. Describe two ways you could use pattern blocks to decompose ∠Z
Sample:
I can use 2 green triangles. 120 = 60 + 60
I can use an orange square and a tan rhombus. 120 = 90 + 30
EUREKA MATH2 Florida B.E.S.T. Edition 4 ▸ M6 ▸ TC ▸ Lesson 14 © Great Minds PBC 295 EUREKA MATH2 Florida B.E.S.T. Edition 4 ▸ M6 ▸ TC ▸ Lesson 14 © Great Minds PBC 135 PROBLEM SET
Z
© Great Minds PBC 296 This page may be reproduced for classroom use only. 4 ▸ M6 ▸ TC ▸ Lesson 14 ▸ Pattern Block Cutouts EUREKA MATH2 Florida B.E.S.T. Edition
Find unknown angle measures within right and straight angles.
Lesson at a Glance
Students fold paper to decompose right and straight angles and then write related addition equations. They find an unknown angle measure when the total angle measure and one part is known. This lesson formalizes the terms adjacent angles, complementary angles, and supplementary angles.
Key Question
• What strategies can we use to find an unknown angle measure when a right angle or straight angle is decomposed into smaller angles?
Achievement Descriptor
FL.4.Mod6.AD6 Solve for unknown angle measures by using addition and subtraction. (MA.4.GR.1.2) (MA.4.GR.1.3)
© Great Minds PBC 15 LESSON 15
EUREKA MATH2 Florida B.E.S.T. Edition 4 ▸ M6 ▸ TC ▸ Lesson 15 © Great Minds PBC 145 15 Name Date ∠ ABC is a straight angle. The measure of ∠ DBC is 53°. Write and solve an equation to find the measure of ∠ ABD. 53° AB C D x° Equation: 53 + x = 180 Measure of ∠ ABD: 127°
Agenda
Fluency 15 min
Launch 5 min
Learn 30 min
• Decompose Benchmark Angles
• Angle Measures with a Sum of 90°
• Angle Measures with a Sum of 180°
• Problem Set
Land 10 min
Materials
Teacher
• Geometric Figures Game (in the teacher edition)
• Blank paper
• Straightedge
• 4″ protractor (180°)
Students
• Geometric Figures Game (in the student book)
• Blank paper
• Straightedge
• 4″ protractor (180°)
Lesson Preparation
Consider whether to remove Geometric Figures Game from student books and place them into personal whiteboards in advance or have students assemble them during the lesson.
© Great Minds PBC 299 EUREKA MATH2 Florida B.E.S.T. Edition 4 ▸ M6 ▸ TC ▸ Lesson 15
Fluency
Guess My Geometric Figure
Materials—S: Geometric Figures Game
Students ask questions by using precise geometric terminology to identify a geometric figure to build familiarity with the geometric figures and associated terminology.
Have students form pairs. Make sure students have a personal whiteboard with the Geometric Figures Game removable inside. Remind students of the rules of the game.
• The object of the game is to guess the figure your partner is thinking about.
• Partner A secretly circles one of the figures on their whiteboard.
• Partner B asks a question that can be answered with “yes” or “no” about the figures.
• Partner A answers the question with “yes” or “no,” and partner B uses the answer to cross out the figures that they determine cannot be partner A’s figure.
• Partner B continues to ask questions until they are left with just one figure that is not crossed out.
• Partner B circles the figure they think partner A chose, and then both partners show their whiteboards. If the circled figures do not match, partner A and partner B discuss what may have gone wrong.
• Then the two partners switch roles.
Circulate as students play and provide support as needed.
Does your figure have parallel lines?
4 ▸ M6 ▸ TC ▸ Lesson 15 EUREKA MATH2 Florida B.E.S.T. Edition © Great Minds PBC 300
15
No.
Show Me: Fractional Turns
Students turn their bodies 90, 180, 270, or 360 degrees and relate the movement to fractional turns to build kinesthetic memory for terms and measures from topic B.
Invite students to stand up and make sure they have enough space to turn in a circle.
Let’s use our bodies to show turns. Face the front of the room.
Show me a 360° turn.
(Turns clockwise or counterclockwise and ends facing the front of the room)
What term can we use to describe a 360° turn?
A whole turn
Show me a 180° turn.
(Turns clockwise or counterclockwise and ends facing the back of the room)
What term can we use to describe a 180° turn?
A half-turn
Face the front of the room. Turn clockwise 90°.
(Turns to their right)
What term can we use to describe your 90° turn?
A quarter-turn
Face the front of the room again. Turn counterclockwise 90°.
(Turns to their left)
What term can we use to describe your 90° turn?
A quarter-turn
Repeat to show a 270° three-quarter turn twice, first by turning clockwise and then by turning counterclockwise.
EUREKA MATH2 Florida B.E.S.T. Edition 4 ▸ M6 ▸ TC ▸ Lesson 15 © Great Minds PBC 301
Whiteboard Exchange: Compose 180
Students complete an addition equation with an unknown addend to prepare for finding unknown angle measures within straight angles.
Display 100 + = 180.
Write and complete the equation.
Give students time to work. When most students are ready, signal for students to show their whiteboards. Provide immediate and specific feedback. If students need to revise, briefly return to validate their corrections.
Show the answer.
Repeat the process with the following sequence:
4 ▸ M6 ▸ TC ▸ Lesson 15 EUREKA MATH2 Florida B.E.S.T. Edition © Great Minds PBC 302
+ 115 = 180 = 180 73 + + 40 = 180 135 += 180 95 += 180 + 128 = 180 70 + = 180 65 107 140 45 85 52 110 100 += 180 80
Launch
Students add various measurement units.
Display the picture of the pattern blocks.
Which angles look like they combine to make a 180°, or straight, angle?
The angle in the green triangle and the angle in the yellow hexagon.
The angle in the green triangle and the obtuse angle in the blue rhombus.
The acute angle in the blue rhombus and the angle in the yellow hexagon.
Display the picture of the straight angle.
Which angles’ measures look like they combine to make a 90° angle?
∠1 and ∠2
∠3 and ∠4
Display the picture of the four right angles.
Which angles’ measures look like they combine to make a 180° angle?
∠5 and ∠6
∠7 and ∠8
∠6 and ∠7
∠5 and ∠8
Transition to the next segment by framing the work.
Today, we will use what we know about right angles and straight angles to find the unknown measures of other angles.
UDL: Representation
Consider presenting the information in another format. Engage students in a kinesthetic activity to support them in differentiating a straight angle from other angles. Invite them to run their fingers along the angle or place a straightedge along the angle as they describe which angles look like they compose to make a straight angle.
Teacher Note
Students may recognize there are nonadjacent angles with measures that add up to 90° or 180°. Responses indicating those angles are also correct and will be a focus later in the lesson.
EUREKA MATH2 Florida B.E.S.T. Edition 4 ▸ M6 ▸ TC ▸ Lesson 15 © Great Minds PBC 303
5 4 1 23 5 8 6 7
Learn
Decompose Benchmark Angles
Materials—T/S: Blank paper, straightedge, protractor
Students show that angle measure is additive by folding paper.
Distribute a piece of paper to each student. Demonstrate the following sequence of tearing, folding, and labeling the piece of paper as students do the same:
Tear one piece of paper in half and then fold one of the pieces in half from bottom to top. Run your finger along the fold.
This fold will represent an angle. Let’s mark a vertex in the middle.
Fold the paper from left to right to find the middle and then unfold. Draw a dot along the bottom edge at the crease.


What benchmark angle did we make?
A straight angle
A 180° angle
Refold the paper from left to right at the vertex.
What angle have we made now?
A right angle
A 90° angle
Unfold the paper and use a straightedge to draw a ray along the crease.
How many right angles has the straight angle been decomposed into?
Two right angles
UDL: Action & Expression
Consider the following suggestions to support students during the folding task:
• Provide paper in a variety of sizes to accommodate student preferences and fine motor needs.
• Partner students to share the task of folding and labeling.
• Provide a written version of the oral directions with visuals for students to reference. To sustain focus on the step being modeled, direct students to use a blank piece of paper to cover up the remaining steps.
4 ▸ M6 ▸ TC ▸ Lesson 15 EUREKA MATH2 Florida B.E.S.T. Edition © Great Minds PBC 304
30
What equation can we write to show that the measures of two right angles is the same measure as a straight angle?
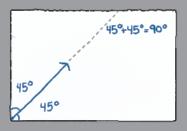
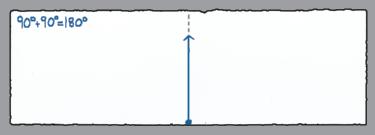
90° + 90° = 180°
Invite students to write the equation at the top of their papers.
Refold the paper from left to right, this time folding the left side under the right side so the drawn ray is visible.
Let’s decompose the right angle.
Fold the vertical side of the right angle down to meet the horizontal side and create two angles of equal size. Unfold one time to show the crease and use a straightedge to draw a ray along the crease. Draw arcs to identify each new angle.
What do you notice about the two angles?
They look like they are the same size. Their measures add up to 90°.
How can we tell they are the same size?
They match up when they are folded on top of each other.
Invite students to think–pair–share about how to find the measure of each angle.
We can find 90 ÷ 2.
45 + 45 = 90, so each angle measures 45°.
We can measure with a protractor.
Label the two 45° angles on the paper. Then invite students to record the addition equation.
Teacher Note

EUREKA MATH2 Florida B.E.S.T. Edition 4 ▸ M6 ▸ TC ▸ Lesson 15 © Great Minds PBC 305
Clearly draw the two arcs, one for each angle, so the angles are distinguishable.
Flip the paper to the other side, draw a ray along the crease, and draw arcs to identify each angle.
Do the two angles also measure 45°? How do you know?
Yes, because they were made with the same fold as the other two 45° angles.
Yes, because they are the same size and make a 90° angle together.
Label the two 45° angles. Then unfold the paper to make the 180° angle visible.
What do you notice?
The straight angle is decomposed into four angles. All four angles are equal in size. They have the same measure.
What equation can we write to show the total of the angle measures?
45° + 45° + 45° + 45° = 180°
Invite students to record the equation. Ask students to turn and talk about how they added the smaller angle measures to compose the larger angle measure.
Use the other half of the torn blank paper and repeat the process to create a 90° angle.

Let’s decompose the right angle into two different angles this time.
Fold the vertical side of the right angle down without meeting the horizontal side. Unfold the paper, draw a ray along the crease, and draw arcs to identify each new angle.
How did we decompose the right angle differently this time?
The two angles are not equal in size this time.
We each folded to decompose differently.
4 ▸ M6 ▸ TC ▸ Lesson 15 EUREKA MATH2 Florida B.E.S.T. Edition © Great Minds PBC 306
Use a protractor to measure and label each angle within the right angle.
What should the measures of the angles add up to? Why?
90° because together they form a right angle.
Let’s check. What is 22° + 68°?
90°
Record the addition equation: 22° + 68° = 90°.
Invite students to record the addition equation to match their angles.
Unfold the paper to make the straight angle visible and turn the paper over to the blank side.
Let’s show the straight angle decomposed into two angles that do not measure 90°.
Draw a dot for the vertex and draw a ray along one crease. Draw two arcs to identify the two angles that the straight angle was decomposed into.
How did we decompose the straight angle differently this time?
Instead of decomposing into two right angles, we decomposed it into an acute angle and an obtuse angle.
The two angles aren’t equal in size this time. Repeat the process to measure and label the angles and write a corresponding addition equation.
Invite students to think–pair–share about how their addition equations are similar and different.
Both of our equations have a sum of 180°.
We are adding the measures of one acute and one obtuse angle.
Our two angles have different measures.
Invite students to turn and talk about how their addition equations show how the right angle and the straight angle were decomposed.
Teacher Note
This is the first time students use a protractor to measure an angle that shares a side with another angle. Consider guiding students in rotating their protractor to align the zero line of the protractor with the edge of the paper or the drawn ray.
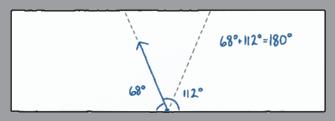
Teacher Note
If the measures of students’ angles do not add up to 90°, invite them to consider how folding, drawing, and measuring can become imprecise. Then ask them to measure again and see if they can find measurements with a sum of 90°.
EUREKA MATH2 Florida B.E.S.T. Edition 4 ▸ M6 ▸ TC ▸ Lesson 15 © Great Minds PBC 307
Angle Measures with a Sum of 90°
Materials—T/S: Folded paper with drawn angles, protractor
Students write equations and find an unknown angle measure when the sum is 90°.
Display the picture of the right angle.
What do we know about the angles in the picture?
∠CMB is a right angle.
The right angle measures 90°.
The right angle is decomposed into two angles.
∠DMB measures 60°.
Where do you see an unknown in the picture?
There is an x in the picture where the angle measure is supposed to go.
Instead of an angle measure, there is an x.
What is unknown in the picture?
The measure of ∠CMD
The value of x
C
Teacher Note
To determine the unknown angle measure, students may write equations with or without the degree symbol. However, the use of the degree symbol must be consistent within an equation.
What addition equation can we write to show how the measures of the smaller angles compose to make the measure of the right angle?
x° + 60° = 90°
Record the equation and invite students to think–pair–share about the unknown measure of ∠CMD.
The measure of ∠CMD is 30° because I counted up from 60 and found 30 + 60 = 90.
I found 90 − 60 = 30, so the measure of ∠CMD is 30°.
The sum of the two angle measures is 90°. We say the two angles are complementary angles.
4 ▸ M6 ▸ TC ▸ Lesson 15 EUREKA MATH2 Florida B.E.S.T. Edition © Great Minds PBC 308
M B x° 60° D
Direct students to their folded paper with drawn angles. What other complementary angles did we make when we folded our paper to make angles?
Two 45° angles
A 22° angle and a 68° angle
So far, we have only seen examples of complementary angles that are adjacent angles, or angles that are next to each other and share a side. Angles that are nonadjacent, or that do not share a side, can also be complementary. Display the picture of the shape pieces.
Are the angles that are labeled in the red and yellow shapes adjacent angles or nonadjacent angles?
Nonadjacent angles
What is the sum of the two labeled angle measures? 90°
The two angles are not adjacent, but they are complementary.
Pair students and direct partner A to draw an acute angle. Invite partner B to measure the angle partner A drew and then to draw a complementary angle that is nonadjacent. Ask partner A to measure the angle drawn by partner B and to confirm the two angles are complementary.
Invite students to think–pair–share about how knowing that two angles are complementary can help them find the angle measures.
If we know two angles are complementary, we know the sum of the angle measures is 90°.
If we know the measure of one angle, we can find the measure of a complementary angle by figuring out what will add up to 90°.
Language Support
Consider creating a chart to show the relationships among the new terms. In one row, draw and label examples of adjacent angles and nonadjacent complementary angles. In a second row, draw and label examples of adjacent and nonadjacent supplementary angles.
Differentiation: Challenge
Consider challenging students by asking them to measure and identify more complementary angles in the picture of the shape pieces. Once supplementary angles are introduced, consider displaying the picture again and asking students to identify supplementary angles as well.
EUREKA MATH2 Florida B.E.S.T. Edition 4 ▸ M6 ▸ TC ▸ Lesson 15 © Great Minds PBC 309
45° 45°
°. °. ° ° ° ° ° ° ° °
Angle Measures with a Sum of 180°
Students write equations and find an unknown angle measure when the sum of the angle measures is 180°.
Display the picture of the straight angle. Give partners 2 minutes to find the unknown measure of the angle. Circulate as students work. Look for students who write an addition equation and find the value of y to highlight in the discussion.
What addition equation can we write to show how the smaller angles’ measures combine to make a straight angle?
43° + y° = 180°
What is the value of y? How do you know?
137° because the measure of both angles adds up to 180°.
What is the measure of ∠HFG?
137°
The sum of the two angle measures is 180°. We say the two angles are supplementary angles.
Direct students to their folded paper with drawn angles.
What other supplementary angles did we make when we folded our paper to make angles?
Two 90° angles
A 112° angle and a 68° angle
Supplementary angles do not have to be adjacent angles, but their measures need to have a sum of 180°.
Promoting the Mathematical Thinking and Reasoning Standards
Students use patterns and structure (MTR.5) when they find unknown angle measures that result from decomposing a 180° angle.
Ask the following questions to promote MTR.5:
• How are the problems involving decomposition of a 180° angle similar to the problems involving decomposition of a 90° angle?
• What is another way to use either addition or subtraction to find the unknown angle measure?
Teacher Note
Two angles are complementary when the sum of their measures is 90°.
Two angles are supplementary when the sum of their measures is 180°.
Students may think that if the sum of three or more angle measures is 90° or 180° that they can be complementary or supplementary angles. Help to avoid student misconceptions by emphasizing that it is the sum of the measures of two angles.
4 ▸ M6 ▸ TC ▸ Lesson 15 EUREKA MATH2 Florida B.E.S.T. Edition © Great Minds PBC 310
43° y° E H FG
Display the picture of the staircase railing.
The two angles shown are supplementary angles.
What equation can we write to show the sum of the two angle measures?
125° + z° = 180°
Give students 1 minute to find the unknown angle measure.
What is the value of z?
55
What is the unknown measure of the angle?
55°
Pair students and direct partner A to draw an acute or obtuse angle. Invite partner B to measure the angle partner A drew and then to draw a supplementary angle that is nonadjacent. Ask partner A to measure the angle drawn by partner B and to confirm the two angles are supplementary.
Invite students to think–pair–share about how knowing two angles are supplementary can help them find the angle measures.
If we know two angles are supplementary, we know the sum of the angle measures is 180°.
If we know the measure of one angle, we can find the measure of a supplementary angle by figuring out what will add up to 180°.
Problem Set
Differentiate the set by selecting problems for students to finish independently within the timeframe. Problems are organized from simple to complex.
EUREKA MATH2 Florida B.E.S.T. Edition 4 ▸ M6 ▸ TC ▸ Lesson 15 © Great Minds PBC 311
125° z°
Land
Debrief 5 min
Objective: Find unknown angle measures within right and straight angles. Use the following prompts to guide a discussion about adding angle measures.
Display the picture of the straight angle.
At the start of the lesson, you looked at a picture like this one and identified angles that looked like they composed to make 90°. You identified complementary angles. What other complementary angles do you see now that maybe you did not see before?
The pairs of 65° and 25° angles that are nonadjacent are also complementary.
Display the picture of four right angles from Launch.
You also identified angles that looked like they composed to 180°. You identified supplementary angles. What other supplementary angles do you see now that maybe you did not see before?
The pairs of angles that are nonadjacent are also supplementary. What strategies can you use to find an unknown angle measure when a right angle or straight angle is decomposed into smaller angles?
If I know an angle is a right angle, I know its measure is 90°. If it’s decomposed, I know the sum of the angle measures is 90°. If I know the measure of one angle, I can add on or subtract to find the measure of the other angle.
If I know an angle is a straight angle, I know its measure is 180°. If it’s decomposed, I know the sum of the angle measures is 180°. If I know the measure of one angle, I can add on or subtract to find the measure of the other angle.
4 ▸ M6 ▸ TC ▸ Lesson 15 EUREKA MATH2 Florida B.E.S.T. Edition © Great Minds PBC 312
10 65° 65° 25° 25° 5 8 6 7
How can you use addition or subtraction to find an unknown angle measure?
If I know the sum of two angle measures is 90° and one angle measure is 45°, I can think about adding on to 45° to make 90°. Or I can subtract because subtracting is like adding on.
Exit Ticket 5 min
Provide up to 5 minutes for students to complete the Exit Ticket. It is possible to gather formative data even if some students do not complete every problem.
EUREKA MATH2 Florida B.E.S.T. Edition 4 ▸ M6 ▸ TC ▸ Lesson 15 © Great Minds PBC 313
Sample Solutions
Expect to see varied solution paths. Accept accurate responses, reasonable explanations, and equivalent answers for all student work.
4 ▸ M6 ▸ TC ▸ Lesson 15 EUREKA MATH2 Florida B.E.S.T. Edition © Great Minds PBC 314
EUREKA MATH2 Florida B.E.S.T. Edition 4 ▸ M6 ▸ TC ▸ Lesson 15 © Great Minds PBC 141 15 Name Date Complete the equations and find the unknown angle measure. Check the measurement by using a protractor. 1. ∠ ABC is a right angle. B C x° 40° D A 40 + x = 90 x = 50 The measure of ∠DBC is 50° 2. ∠FQH is a right angle. H Q x° 65° S F 65 + x = 90 x = 25 The measure of ∠SQH is 25° 4 ▸ M6 ▸ TC ▸ Lesson 15 EUREKA MATH2 Florida B.E.S.T. Edition © Great Minds PBC 142 PROBLEM SET 3. ∠OTM is a right angle. T Y x° 46° M O 46 + x = 90 x = 44 The measure of ∠YTM is 44° 4. ∠LGJ is a right angle. J G N L x° 12° 12 + x = 90 x = 78 The measure of ∠LGN is 78° 5. ∠EFG is a straight angle. EG B F x° 100° 100 + x = 180 x = 80 The measure of ∠BFG is 80° 6. ∠UCR is a straight angle. RU D C x° 135° 135 + x = 180 x = 45 The measure of ∠DCR is 45° .
9. Robin builds a cat by using the shape pieces. Find the value of x Explain your thinking.
The sum of the measurements of the two angles is 90°, so the
of x is 45
10. A fan is open as shown below. How many more degrees does the fan need to open to make a straight angle?
Write an equation to find the unknown angle measure. Explain your thinking.
+ x = 180
The fan needs to open 33° more to open to a straight angle. A straight angle is 180° 147 + 33 = 180
EUREKA MATH2 Florida B.E.S.T. Edition 4 ▸ M6 ▸ TC ▸ Lesson 15 © Great Minds PBC 315 EUREKA MATH2 Florida B.E.S.T. Edition 4 ▸ M6 ▸ TC ▸ Lesson 15 © Great Minds PBC 143 PROBLEM SET
∠KVR is a straight angle. R K x° 52° E V 52 + x = 180 x = 128 The measure of ∠KVE is 128°
7.
YJH is a straight angle. YH P J x° 27° 27 + x = 180 x = 153 The measure of ∠YJP is 153° 4 ▸ M6 ▸ TC ▸ Lesson 15 EUREKA MATH2 Florida B.E.S.T. Edition © Great Minds PBC 144 PROBLEM SET
8. ∠
45
x
+ x = 90
= 45
value
147
x
= 33
45° x° 147°
4 ▸ M6 ▸ TC ▸ Lesson 15 ▸ Geometric Figures Game EUREKA MATH2 Florida B.E.S.T. Edition © Great Minds PBC 316 This page may be reproduced for classroom use only. 1 2 3 4 5 6 7 8 9 10 11 12 13 14 15 16
Find unknown angle measures within a decomposed angle of up to 180° .
Lesson at a Glance
Students fold paper to decompose right and straight angles into three parts and write related addition equations. They find unknown angle measures when benchmark and nonbenchmark angles are decomposed into two or more parts.
Key Questions
• How can we use addition or subtraction to find an unknown angle measure?
• How can we use the decomposed parts of an angle to find the total angle measure?
Achievement Descriptor
FL.4.Mod6.AD6 Solve for unknown angle measures by using addition and subtraction. (MA.4.GR.1.2) (MA.4.GR.1.3)
© Great Minds PBC 16
LESSON 16
EUREKA MATH2 Florida B.E.S.T. Edition 4 ▸ M6 ▸ TC ▸ Lesson 16 © Great Minds PBC 153 16 Name Date ∠TUV is a straight angle. Write and solve an equation to find the measure of ∠WUX 67° 53° x° T X W V U Equation: 53 + x + 67 = 180 Measure of ∠WUX: 60°
Agenda
Fluency 10 min
Launch 5 min
Learn 35 min
• Decompose into Three Parts
• Strategies to Find Unknown Angle Measures
• Decomposed Angles and Angle Measures
• Problem Set
Land 10 min
Materials
Teacher
• Blank paper
• Straightedge
• 4″ protractor (180°)
Students
• Straightedge
• Blank paper
• 4″ protractor (180°)
Lesson Preparation
None
© Great Minds PBC 319 EUREKA MATH2 Florida B.E.S.T. Edition 4 ▸ M6 ▸ TC ▸ Lesson 16
Fluency
Whiteboard Exchange: Draw Geometric Figures
Materials—S: Straightedge
Students draw an example of a specified line or line segment, including parallel and perpendicular, to build familiarity with the geometric figures and notations.
Display line segment AB.
On my signal, read the name of the geometric figure. Ready?
Line segment AB
Draw an example of line segment AB.
line segment AB
AB
Give students time to work. When most students are ready, signal for students to show their whiteboards. Provide immediate and specific feedback. If students need to revise, briefly return to validate their corrections.
Display the sample image of the geometric figure.
Repeat the process with the following sequence:
Teacher Note
Students are not expected to draw perfectly parallel or perpendicular lines and line segments with only a straightedge. Instead they should estimate the position of the figures and use arrow marks to indicate parallel and small squares to indicate perpendicular.
4 ▸ M6 ▸ TC ▸ Lesson 16 EUREKA MATH2 Florida B.E.S.T. Edition © Great Minds PBC 320
RS || TU DY BN Perpendicular lines JK and LM QX ⊥ NS Line CD Parallel lines EF and GH Y D B N CD F E H G RS TU J M K L N Q S X 10
Whiteboard Exchange: Compose 180
Students complete an addition equation with an unknown addend to develop fluency with finding unknown angle measures within straight angles.
Display 120 + = 180.
Write and complete the equation.
Give students time to work. When most students are ready, signal for students to show their whiteboards. Provide immediate and specific feedback. If students need to revise, briefly return to validate their corrections.
Display the answer.
Repeat the process with the following sequence:
EUREKA MATH2 Florida B.E.S.T. Edition 4 ▸ M6 ▸ TC ▸ Lesson 16 © Great Minds PBC 321
30 + 115 + = 180 35 + 90 + 62 = 180 28 + 54 = 180 126 145 + = 180 35 95 43 = 180 + 85 = 180137 + 120 + = 180 60
Launch
Students use a protractor and addition or subtraction to find the unknown measures of angles.
Display the picture of the protractor and angles and use the Math Chat routine to engage students in mathematical discourse.
Give students 1 minute of silent think time to find the measure of any angle they can find and name in the picture. As time allows, invite them to find the measure of more than one angle. Have students give a silent signal to indicate they are finished.
Have students discuss their thinking with a partner. Circulate and listen as they talk. Identify three to four students to share their thinking. Purposely choose work that allows for rich discussion about connections between strategies.
Then facilitate a class discussion. Invite students to share their thinking with the whole group and record their reasoning.
As students discuss, highlight thinking that shows flexible use of the protractor and addition or subtraction of angle measures.
The measure of ∠ CDE is 30° because I can see on the protractor the angle opens from 0° to 30°.
I know the measure of ∠ BDC is 20° because I see the angle is between 30° and 50° on the protractor. I can subtract to find the difference. 50° − 30° = 20°.
The measure of ∠ ADB is 40°. I can think of ∠ ADB as the unknown part of ∠ ADE, a right angle. The known part of the right angle is ∠ BDE which is 50°. I can add 40° to make 90°.
The measure of ∠ ADC is 60° because the angle is a combination of ∠ ADB and ∠ BDC and 40° + 20° = 60°.
4 ▸ M6 ▸ TC ▸ Lesson 16 EUREKA MATH2 Florida B.E.S.T. Edition © Great Minds PBC 322
5 E D C B A
Ask questions that invite students to make connections and encourage them to ask questions of their own.
There are many ways to use addition and subtraction to find the unknown angle measures.
Transition to the next segment by framing the work.
Today, we will choose strategies to find the unknown measures of angles.
Learn
Decompose into Three Parts
Materials—T/S: Blank paper, straightedge, protractor
Students fold paper to decompose benchmark angles into three parts.
Distribute a piece of paper to each student. Demonstrate the following sequence of tearing, folding, and labeling the piece of paper as students do the same.
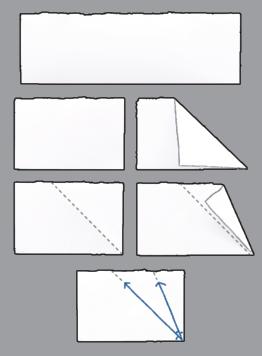
Tear one piece of paper in half, then fold one of the pieces in half from bottom to top. Fold the piece again from right to left to create a right angle.
Let’s see how we can decompose a right angle into more than two angles.
Fold the vertical side of the right angle down to meet the horizontal side and create two angles of equal size.
Unfold one time, and then fold the vertical side down to meet the previous fold and create a second fold within the right angle.
Unfold one time, and then use a straightedge to draw a ray along each crease. Draw an arc to identify each of the three angles the right angle is decomposed into.
EUREKA MATH2 Florida B.E.S.T. Edition 4 ▸ M6 ▸ TC ▸ Lesson 16 © Great Minds PBC 323
35
What do you notice?
We decomposed a right angle into three smaller angles. Two of the angles look like they are the same size. The third angle looks bigger than the other two.
Use a protractor to measure each angle, and then record each angle measure. Watch for students to correctly align the protractor with one of the angle’s rays and vertex each time.
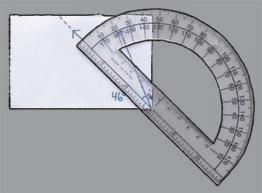
What should the sum of the three angle measures be? Why?
The sum of the three angle measures should be 90° because together they form a right angle.
Write an equation on the paper to add the three angle measures. Allow one or two students to share their equations.
What is similar and different about decomposing a right angle into two angles and three angles?
The angle measures can still be added. You either add two or three angle measures.
The sum of the angle measures is still 90°.
Let’s decompose a straight angle into three angles. Fold the other half of the torn paper from the bottom to the top and create a straight angle.
The fold represents the straight angle. Let’s draw a vertex on the straight angle.
Draw a dot to represent the vertex in the middle of the fold.
Begin to decompose the straight angle by folding the bottom side of the paper that is to the right of the vertex up so the fold of the paper is vertical to the vertex.
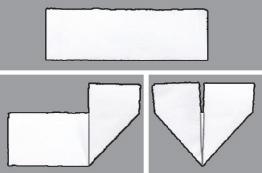
Fold the bottom side of the paper that is to the left of the vertex up to meet the right side.
Teacher Note
If the measures of students’ angles do not add up to 90°, invite them to consider how folding, drawing, and measuring can become imprecise. Then ask them to measure again to see if they can find measurements with a sum of 90°.
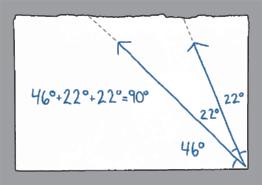
4 ▸ M6 ▸ TC ▸ Lesson 16 EUREKA MATH2 Florida B.E.S.T. Edition © Great Minds PBC 324
Open the paper to make the straight angle visible and use the straightedge to draw a ray along each crease. Draw an arc to identify each angle the straight angle was decomposed into.
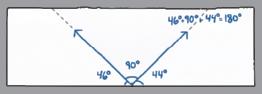
What do you notice?
The straight angle is decomposed into three angles.
The angles on the left and right look similar in size.
Measure each angle with a protractor and record the angle measures.
What equation can you write to show how the straight angle was decomposed?
46° + 90° + 44° = 180°
Invite students to record the equations that represent their angles.
Direct students to turn and talk about how to write an addition equation to show how a right angle or straight angle was decomposed.
Strategies to Find Unknown Angle Measures
Students choose a strategy to find the unknown measure of an angle when a straight angle is decomposed into multiple angles.
Display the picture of the tiles.
What is known about the angles?
The two white angles each measure 30°.
The blue angle on the left measures 60°.
Together all four angles look like they form a straight angle.
What is unknown?
The value of y and the angle measure are unknown.
UDL: Representation
Consider presenting the information in another mode by providing a verbal description of the picture after it is displayed. Support students in interpreting the multiple angles and measures as angles are decomposed into more parts.
EUREKA MATH2 Florida B.E.S.T. Edition 4 ▸ M6 ▸ TC ▸ Lesson 16 © Great Minds PBC 325
30° 30° 60° y°
Tell students that the four angles together form a straight angle. Give students 2 minutes to find the value of y and the measure of the angle in the star without using a protractor. Circulate as students work. Look for students to add the angle measures up to 180°, subtract from 180°, or use a combination of addition and subtraction.
Invite two or three students to share their work. As each student shares, ask questions to elicit their thinking and clarify the strategy used to find the unknown angle measure. Ask the class questions to make connections between the different strategies and their own work.
Count On (Pablo’s Way)
How did you use addition to find the unknown angle measure?
I knew all the angle measures would add up to 180 because together they make a straight angle. I added the known angle measures, 60 + 30 + 30 = 120. Then I thought about what to add to 120 to reach 180, and I got 60. So, the unknown angle measure is 60°.
Subtract from the Total (Deepa’s Way)
How did you use subtraction to find the unknown angle measure?
I knew the total of all the angle measures was 180. Then I subtracted each known angle measure and I was left with the unknown angle measure, 60°.
Add then Subtract (Shen’s Way)
How did you use a combination of addition and subtraction to find the unknown angle measure?
First, I added all the known angle measures. Then I subtracted that from the total angle measure, 180. The unknown angle measure was left over.
Promoting the Mathematical Thinking and Reasoning Standards
As students find the unknown angle measure in the picture of the tiles, share their strategies, and make connections between their own work and their peers’ strategies, they are representing problems in multiple ways (MTR.2).
Ask the following questions to promote MTR.2:
• What equation can you write that could help you find the unknown angle measure?
• How can you use a number line to help you find the unknown angle measure?
UDL: Action & Expression
To support students in monitoring their own progress, consider providing questions that guide self-monitoring and reflection. For example, post the following questions for students to refer to as they work independently:
• Did I think about the total number of degrees represented by the composed angles?
• Did I represent each part in my equation?
• Did I use an efficient addition or subtraction strategy?
4 ▸ M6 ▸ TC ▸ Lesson 16 EUREKA MATH2 Florida B.E.S.T. Edition © Great Minds PBC 326
60 + 30 + y + 30 = 18 0 + 30 + 30 + 60 60 90 12 0 18 0 The measu re of th e th unkn ow n angle is 60°. y = 60 The measu re of th e The unkn ow n angle is 60° . 12 0 30 90 –90 30 60 –18 0 60 12 0 –60 + 30 + y + 30 = 18 0 y = 60 The measu re of th e unkn ow n angle is 60° 18 0 12 0 60 –60 30 30 12 0 + 60 + 30 + y + 30 = 18 0 y = 60
Invite students to turn and talk about how their strategy was different from a strategy that was shared.
Display the picture of the straight angle and repeat the process.
Give students 2 minutes to find the unknown angle measure. Identify two or three students to share their work. Facilitate a discussion to clarify the strategy used to find the unknown angle measure and make connections.
Invite students to turn and talk about how they can use either addition or subtraction to find an unknown angle measure.
EUREKA MATH2 Florida B.E.S.T. Edition 4 ▸ M6 ▸ TC ▸ Lesson 16 © Great Minds PBC 327
x + 3 8 + 3 5 = 18 0 x = 107 The measu re of ∠ AB D is 107 7°. 35 38 68 73 80 18 0 + 30 + 5 + 10 0 +7 107 x + 3 8 + 3 5 = 18 0 18 0 35 145 –145 7 10 3 15 38 107 –x = 107 The measu re of The ∠ AB D is 107 7°. 38 35 73 + 18 0 7 10 73 107 –1 x + 3 8 + 3 5 = 18 0 x = 107 The measu re of The ∠ AB D is 107 7°.
35° 38° E AB C D x°
Decomposed Angles and Angle Measures
Students find unknown angle measures in nonbenchmark angles that are decomposed into two or more angles.
Use the Numbered Heads routine. Organize students into groups of three and assign each student a number, 1 through 3.
Display the picture of ∠ FGH.
How is the problem shown in the picture different from the others we have worked on?
The angle that was decomposed is not a right angle or a straight angle.
Give students 1 minute to find the unknown angle measure as a group. Remind students that any one of them could be the spokesperson for the group, so they should be prepared to answer.
Call a number, 1 through 3. Have the students assigned that number share their group’s findings.
We found 75 − 36 = b and b = 39. The measure of ∠ FGI is 39°.
Present the picture of ∠ JKL.
How is the problem shown in the picture different from the previous problem?
The unknown angle measure is the total of the parts. Give students 1 minute to find the unknown angle measure as a group. Remind students that any one of them could be the spokesperson for the group, so they should be prepared to answer.
Call a different number, 1 through 3. Have students assigned that number share their group’s findings.
We found 23 + 85 + 42 = c and c = 150. The measure of ∠ JKL is 150°.
Invite students to turn and talk about how finding an unknown angle measure is different when the unknown is the total instead of one of the parts.
Language Support
Before having students work together to find an unknown total angle measure or an unknown part of an angle measure, consider previewing the terms part and total. Present a visual to relate the terms to students’ prior knowledge of tape diagrams and an unknown part or an unknown total in a tape diagram.
4 ▸ M6 ▸ TC ▸ Lesson 16 EUREKA MATH2 Florida B.E.S.T. Edition © Great Minds PBC 328
36° b° H I F G
75°.
measure of ∠JKL is c°. J 85° 23° 42° M KL N
The measure of ∠FGH is
The
Problem Set
Differentiate the set by selecting problems for students to finish independently within the timeframe. Problems are organized from simple to complex.
Land
Debrief 5 min
Objective: Find unknown angle measures within a decomposed angle of up to 180°.
Initiate a class discussion using the prompts below. Encourage students to restate their classmates’ responses in their own words.
How can we use addition or subtraction to find an unknown angle measure?
The known angle measures can be subtracted from the known total angle measure. The known measures of the parts can be added first. Then the sum can be subtracted from the known total measure.
We can start with the measure of the known angle and then count on until we reach the measure of the total angle.
How can we use the decomposed parts of an angle to find the total angle measure? If the total angle measure is unknown, the measures of the parts can be added.
Exit Ticket
5 min
Provide up to 5 minutes for students to complete the Exit Ticket. It is possible to gather formative data even if some students do not complete every problem.
EUREKA MATH2 Florida B.E.S.T. Edition 4 ▸ M6 ▸ TC ▸ Lesson 16 © Great Minds PBC 329
10
Sample Solutions
Expect to see varied solution paths. Accept accurate responses, reasonable explanations, and equivalent answers for all student work.
4 ▸ M6 ▸ TC ▸ Lesson 16 EUREKA MATH2 Florida B.E.S.T. Edition © Great Minds PBC 330
EUREKA MATH2 Florida B.E.S.T. Edition 4 ▸ M6 ▸ TC ▸ Lesson 16 © Great Minds PBC 147 16 Name Date Write and solve an equation to find the unknown angle measure. 1. ∠LMN is a straight angle. 70° x° A LM N B 90 + 70 + x = 180 x = 20 The measure of ∠BMN is 20° . 2. ∠QLP is a straight angle. 80° 40° x° J T QL P 40 + x + 80 = 180 x = 60 The measure of ∠JLT is 60° 4 ▸ M6 ▸ TC ▸ Lesson 16 EUREKA MATH2 Florida B.E.S.T. Edition © Great Minds PBC 148 PROBLEM SET 3. ∠TNH is a straight angle. 55° x° W H N T F x + 55 + 90 = 180 x = 35 The measure of ∠WNT is 35° 4. ∠SVM is a straight angle. 23° x° MS E V Y 23 + 90 + x = 180 x = 67 The measure of ∠SVY is 67°
EUREKA MATH2 Florida B.E.S.T. Edition 4 ▸ M6 ▸ TC ▸ Lesson 16 © Great Minds PBC 331 EUREKA MATH2 Florida B.E.S.T. Edition 4 ▸ M6 ▸ TC ▸ Lesson 16 © Great Minds PBC 149 PROBLEM SET 5. ∠CZD is a straight angle. 37° 125° x° Z C D W U 125 + x + 37 = 180 x = 18 The measure of ∠UZW is 18° 6. ∠EFG is a straight angle. 96° 28° x° F G E P O 96 + x + 28 = 180 x = 56 The measure of ∠OFP is 56° 4 ▸ M6 ▸ TC ▸ Lesson 16 EUREKA MATH2 Florida B.E.S.T. Edition © Great Minds PBC 150 PROBLEM SET 7. The measure of ∠YJH is 75° 40° x° J H T Y x + 40 = 75 x = 35 The measure of ∠YJT is 35° 8. The measure of ∠ENB is 150° 55° x° V E N B x + 55 = 150 x = 95 The measure of ∠VNB is 95°
4 ▸ M6 ▸ TC ▸ Lesson 16 EUREKA MATH2 Florida B.E.S.T. Edition © Great Minds PBC 332 EUREKA MATH2 Florida B.E.S.T. Edition 4 ▸ M6 ▸ TC ▸ Lesson 16 © Great Minds PBC 151 PROBLEM SET
30° E F G 13° x° CH 13 + x + 30 = 82 x = 39
of ∠FCG
39°
9. The measure of ∠HCE is 82°
The measure
is
54° R Z U T S 17° x° x + 17 + 54 = 137 x = 66
of ∠RZS
10. The measure of ∠RZU is
137°
The measure
is 66°
x =
20° 35° 35° 20° x°
11. Pablo draws a design. The bottom of his design is a straight angle. Find the measure of the unknown angle.
20 + 35 + x + 35 + 20 = 180
70 The measure of the unknown
angle is 70°
Standards
B.E.S.T. Standards
Measure the length of objects and solve problems involving measurement.
MA.4.M.1.1 Select and use appropriate tools to measure attributes of objects. Draw, classify and measure angles.
MA.4.GR.1.1 Informally explore angles as an attribute of two-dimensional figures. Identify and classify angles as acute, right, obtuse, straight or reflex.
MA.4.GR.1.2 Estimate angle measures. Using a protractor, measure angles in whole-number degrees and draw angles of specified measure in whole-number degrees. Demonstrate that angle measure is additive.
MA.4.GR.1.3 Solve real-world and mathematical problems involving unknown whole-number angle measures. Write an equation to represent the unknown.
Collect, represent and interpret data and find the mode, median and range of a data set.
MA.4.DP.1.1 Collect and represent numerical data, including fractional values, using tables, stem-and-leaf plots or line plots.
MA.4.DP.1.2 Determine the mode, median or range to interpret numerical data including fractional values, represented with tables, stem-and-leaf plots or line plots.
MA.4.DP.1.3 Solve real-world problems involving numerical data.
© Great Minds PBC 334
Mathematical Thinking and Reasoning Standards
MA.K12.MTR.1.1 Actively participate in effortful learning both individually and collectively.
MA.K12.MTR.2.1 Demonstrate understanding by representing problems in multiple ways.
MA.K12.MTR.3.1 Complete tasks with mathematical fluency.
MA.K12.MTR.4.1 Engage in discussions that reflect on the mathematical thinking of self and others.
MA.K12.MTR.5.1 Use patterns and structure to help understand and connect mathematical concepts.
MA.K12.MTR.6.1 Assess the reasonableness of solutions.
MA.K12.MTR.7.1 Apply mathematics to real-world contexts.
ELA Expectations
ELA.K12.EE.1.1 Cite evidence to explain and justify reasoning.
ELA.K12.EE.2.1 Read and comprehend grade-level complex texts proficiently.
ELA.K12.EE.3.1 Make inferences to support comprehension.
ELA.K12.EE.4.1 Use appropriate collaborative techniques and active listening skills when engaging in discussions in a variety of situations.
ELA.K12.EE.5.1 Use the accepted rules governing a specific format to create quality work.
ELA.K12.EE.6.1 Use appropriate voice and tone when speaking or writing.
EUREKA MATH2 Florida B.E.S.T. Edition 4 ▸ M6 © Great Minds PBC 335
Achievement Descriptors: Proficiency Indicators
FL.4.Mod6.AD1 Measure the length of an object by using a ruler.
RELATED B.E.S.T.
MA.4.M.1.1 Select and use appropriate tools to measure attributes of objects.
Partially Proficient Proficient
Measure the length of an object to the nearest eighth inch by using a ruler.
Use a ruler to measure and record the length of the pencil to the nearest eighth inch. inches
Measure the length of an object to the nearest sixteenth inch by using a ruler.
Use a ruler to measure and record the length of the pencil to the nearest sixteenth inch. inches
Highly Proficient
© Great Minds PBC 336
FL.4.Mod6.AD2 Classify angles as acute, right, obtuse, straight, or reflex.
RELATED B.E.S.T.
MA.4.GR.1.1 Informally explore angles as an attribute of two-dimensional figures. Identify and classify angles as acute, right, obtuse, straight or reflex.
Partially Proficient Proficient Highly Proficient
Identify angles as acute, right, obtuse, straight, or reflex. Which figure shows an acute angle?
Classify angles as acute, right, obtuse, straight, or reflex.
Classify each of the following angles as acute, right, obtuse, straight, or reflex.
Draw an acute, right, obtuse, straight, or reflex angle. Draw an acute angle.
EUREKA MATH2 Florida B.E.S.T. Edition 4 ▸ M6 © Great Minds PBC 337
A.
B.
C.
D.
FL.4.Mod6.AD3 Describe angle attributes in two-dimensional figures.
RELATED B.E.S.T.
MA.4.GR.1.1 Informally explore angles as an attribute of two-dimensional figures. Identify and classify angles as acute, right, obtuse, straight or reflex.
Partially Proficient Proficient
Identify angle attributes in two-dimensional figures. Which statement correctly describes the figure?
Describe angle attributes in two-dimensional figures. Write a true statement that describes the angle attributes in this figure.
Highly Proficient
Draw a two-dimensional figure with a specific set of angle attributes.
Draw a quadrilateral with two obtuse angles.
Figure A
A. Figure A has 4 acute angles.
B. Figure A has 4 obtuse angles.
C. Figure A has 2 right angles and 2 acute angles.
D. Figure A has 2 acute angles and 2 obtuse angles.
4 ▸ M6 EUREKA MATH2 Florida B.E.S.T. Edition © Great Minds PBC 338
FL.4.Mod6.AD4 Estimate angle measures by using the benchmark angles of 30°, 45°, 60°, 90°, and 180°.
RELATED B.E.S.T.
MA.4.GR.1.2 Estimate angle measures. Using a protractor, measure angles in whole-number degrees and draw angles of specified measure in whole-number degrees. Demonstrate that angle measure is additive.
Partially Proficient Proficient Highly Proficient
Estimate angle measures by using the benchmark angles of 30°, 45°, 60°, 90°, and 180°.
Estimate the measure of the following angle.
A. 30°
B. 45°
C. 60°
D. 90°
E. 180°
EUREKA MATH2 Florida B.E.S.T. Edition 4 ▸ M6 © Great Minds PBC 339
FL.4.Mod6.AD5 Measure and draw angles in degrees.
RELATED B.E.S.T.
MA.4.GR.1.2 Estimate angle measures. Using a protractor, measure angles in whole-number degrees and draw angles of specified measure in whole-number degrees. Demonstrate that angle measure is additive.
Partially Proficient Proficient Highly Proficient
Measure angles by using a protractor aligned with zero.
What is the measure of the angle shown?
Measure and draw angles in degrees by using a protractor
Use a protractor to draw an angle having a measure of 59°.
Measure angles by using a protractor not aligned with zero
What is the measure of the angle shown?
4 ▸ M6 EUREKA MATH2 Florida B.E.S.T. Edition © Great Minds PBC 340
FL.4.Mod6.AD6 Solve for unknown angle measures by using addition and subtraction.
RELATED B.E.S.T.
MA.4.GR.1.2 Estimate angle measures. Using a protractor, measure angles in whole-number degrees and draw angles of specified measure in whole-number degrees. Demonstrate that angle measure is additive.
MA.4.GR.1.3 Solve real-world and mathematical problems involving unknown whole-number angle measures. Write an equation to represent the unknown.
Determine the measure of an angle that is the sum of two adjacent angles.
The measure of ∠ ABD is 42°. The measure of ∠ DBC is 34°. What is the measure of ∠ ABC?
Solve for unknown angle measures by using addition and subtraction.
∠ JRF is a straight angle. Write and solve an equation to find the value of x.
EUREKA MATH2 Florida B.E.S.T. Edition 4 ▸ M6 © Great Minds PBC 341
Partially Proficient Proficient Highly Proficient
42˚ 34˚ A B C D A. 8° B. 34°
42° D. 76°
C.
80° 49° x° G H FR J
FL.4.Mod6.AD7 Create a line plot or stem-and-leaf plot and solve real-world problems involving numerical data.
RELATED B.E.S.T.
MA.4.DP.1.1 Collect and represent numerical data, including fractional values, using tables, stem-and-leaf plots or line plots.
MA.4.DP.1.3 Solve real-world problems involving numerical data.
Partially Proficient Proficient Highly Proficient
Solve real-world problems involving numerical data when provided with a line plot or stem-and-leaf plot
The lengths of 8 pencils are recorded in a stem-and-leaf plot. Lengths of Pencils (inches)
Create a line plot or stem-and-leaf plot and solve real-world problems involving numerical data.
The lengths of 8 pencils in inches are shown below.
Part A
Create a line plot to represent the data set.
Part B
What is the difference between the lengths of the longest and shortest pencils?
What is the sum of the 8 pencil lengths?
4 ▸ M6 EUREKA MATH2 Florida B.E.S.T. Edition © Great Minds PBC 342
4 5 6 1 2 3 4 1 4 1 4 1 2 1 2 3 4 1 2 1 2
4 means 4 0
Stem Leaf
Key:
6 1 2 , 4 1 4 , 6 1 2 , 6 3 4 , 6, 5 1 2 , 5 1 2 , 4 3 4
FL.4.Mod6.AD8 Determine the mode, median, or range of a data set.
RELATED B.E.S.T.
MA.4.DP.1.2 Determine the mode, median or range to interpret numerical data including fractional values, represented with tables, stem-and-leaf plots or line plots.
Partially Proficient Proficient Highly Proficient
Determine the mode, median, or range of a data set.
The line plot below shows the lengths in inches of the insects in Oka’s collection.
Lengths of Insects in Oka’s Collection
Determine the mode, median, or range of a data set when not provided with a table, stem-and-leaf plot, or line plot.
The lengths in inches of 11 pencils are shown below.
Length (inches)
What is the mode of the data set?
Part A
Create a line plot to represent the data set.
Part B
What is the mode of the data set?
What is the median of the data set?
What is the range of the data set?
EUREKA MATH2 Florida B.E.S.T. Edition 4 ▸ M6 © Great Minds PBC 343
× × × × × × × × × × × × × 0
1 2 3
4 1 2 , 5 1 2 , 3 1 4 , 5 1 2 , 3 1 2 , 5, 4 3 4 , 5 1 4 , 4 1 2 , 5, 4 1 2
Terminology
The following terms are critical to the work of grade 4 module 6. This resource groups terms into categories called New, Familiar, and Academic Verbs. The lessons in this module incorporate terminology with the expectation that students work toward applying it during discussions and in writing.
Items in the New category are discipline-specific words that are introduced to students in this module. These items include the definition, description, or illustration as it is presented to students. At times, this resource also includes italicized language for teachers that expands on the wording used with students.
Items in the Familiar category are discipline-specific words introduced in prior modules or in previous grade levels.
Items in the Academic Verbs category are high-utility terms that are used across disciplines. These terms come from a list of academic verbs that the curriculum strategically introduces at this grade level.
New
acute angle
An acute angle is an angle that is smaller than a right angle; its measure is less than 90°. (Lesson 5, Lesson 9)
adjacent angles
Two angles with the same vertex that share a ray and do not overlap are called adjacent angles. (Lesson 15)
complementary angles
Two angles are complementary angles if the sum of the two angle measures is 90°. (Lesson 15)
degree
A degree is the unit used to measure angles. An angle that turns through 1 360 of a circle is a one-degree (1°) angle. (Lesson 9)
median
The median is the middle value in a data set when the data values are ordered from least to greatest (or greatest to least). The data sets in grade 4 have an odd number of values, so the median is one of the data values. In grade 5, data sets may have even numbers of values. When a data set has an even number of values, the median is the average of the two middle values. (Lesson 2)
obtuse angle
An obtuse angle is an angle that is larger than a right angle and smaller than a straight angle; its measure is greater than 90° and less than 180°. (Lesson 5, Lesson 9)
reflex angle
A reflex angle is an angle that is larger than a straight angle and smaller than a full rotation, or whole turn; its measure is greater than 180° and less than 360°. (Lesson 8)
right angle
A right angle measures 90°. (Lesson 9)
stem-and-leaf plot
A stem-and-leaf plot is a display of data in which the data values are decomposed into two parts: the larger part is represented as a stem, and the smaller part is represented as a leaf. Typically, the decomposition is by place value: the digit that represents the smallest place value unit of a data value is the leaf, and the remaining digits of the data value are the stem. If the data values include whole numbers and fractional units, the whole number part is the stem, and the fractional part is the leaf. (Lesson 1)
© Great Minds PBC 344
straight angle
A straight angle is formed by two rays, with a common endpoint, that together make a line. (Lesson 5)
supplementary angles
Two angles are supplementary angles if the sum of the two angle measures is 180°. (Lesson 15)
vertex
A vertex is a point where two lines or segments or rays intersect. The common endpoint of rays making an angle is referred to as the vertex of the angle. Vertex is also used to refer to any point of intersection of two sides of a polygon. (Lesson 5)
EUREKA MATH2 Florida B.E.S.T. Edition 4 ▸ M6 © Great Minds PBC 345
Familiar angle benchmark decompose figure intersect line line segment mode parallel perpendicular point range ray sum Academic Verb classify
Math Past
History of Protractors
How are protractors used outside the math classroom? How have protractors evolved over the centuries?
Imagine it is two centuries ago and you are the captain of your own ship out at sea. You are headed to the port of a foreign land and have carefully kept track of your location on your charts. You know where you need to go to reach the port, but there are dangerous reefs just north and south of the port entry. Your bearing of travel must be precise to avoid hitting the reefs. At what angle from the magnetic North Pole must you steer your ship for a safe arrival?
Navigators of the time used a simple tool to save the day: the protractor. It might surprise your students to know that this instrument has been of vital use for hundreds of years to map out safe courses for travel.
In 1801, a US naval captain named Joseph Huddart designed the three-arm protractor, also called a station
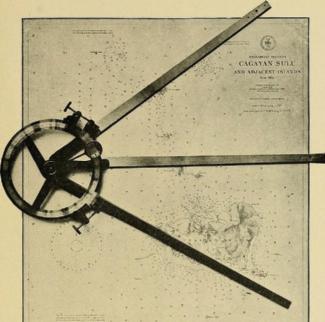
pointer, to determine directions of travel between locations at sea, and even, with calculation, to determine distances between locations. Combined with the use of a magnetic compass, ship crews could then follow a fixed direction of travel by maintaining a fixed angle bearing from the magnetic North Pole.
But of course, people needed to accurately measure angles centuries before these relatively recent seafaring days.
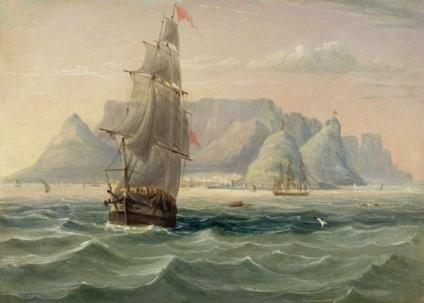
Although the inventor of the first protractor is unknown, we do know that the protractor has been around since at least the 13th century.
This medieval astronomical instrument, called the torquetum, was used to measure the angles of elevation of the moon and other celestial objects in our solar system at fixed times of day and night. The torquetum is equipped with a semicircular protractor, meaning that it measures angles between 0° and 180°.
Italian physicist Amelia Sparavigna believes that people were using versions of the protractor long before the invention of the torquetum.
The tomb of Kha, chief builder of Pharaoh Amenhotep II, dates back to about 1400 BCE and was discovered near the Valley of the Kings in 1906 by archaeologist Ernesto Schiaparelli. (Read more about Kha in grade 2 module 1.) Kha’s measuring instruments lay
© Great Minds PBC 346
in the tomb: cubit rods, a leveling device, and a wooden disc that resembles a possible great ancestor of the protractor.
While some archaeologists believe this tool may simply have been a decorative case, Sparavigna thinks it may have had a mathematical purpose.
Sparavigna noticed that the design on the wooden disc is composed of 16 evenly spaced petals within a ring of zigzags forming 36 points. She surmised that when this disc and the attached rod are laid on a slope, the designs on the disc reveal the angle of its incline.
Ask your students whether they can imagine using Kha’s instrument to determine angles of incline. Perhaps a schematic image might help.
Also ask your students to think about the measure of the angle between any two of the 36 evenly spaced zigzag points. Could Kha have easily measured an angle of inclination of 20°? What angles of inclination could he measure by using the 16 evenly spaced petals?
One early written description of the protractor was given in 1589 by English mathematician Thomas Blundeville. His book Briefe Description of Universal Mappes & Cardes was geared toward travelers on land and at sea and described the protractor as a tool for drawing and measuring angles. Blundeville used a protractor to prepare maps and navigational charts.
By the early 17th century, protractors were commonly used by surveyors, people who measure land and identify boundaries. Surveyors used the protractor, along with tape measures, rulers, and set squares, to measure angles and calculate the distance between points.
The location of a point can be found through a mathematical process called triangulation by first finding the angles of known surrounding points. This process allows surveyors to calculate accurate measurements between locations on a map. Similar measurements can be used to find the height of a tree and even the distance from Earth to the moon.
By the 18th century, the protractor was designed to be more portable and was widely used in mathematics.
By the 20th century, the protractor became the common school item we are familiar with today. These protractors are typically semicircular, are made of heavy-duty plastic or metal, and are devoid of ornamental design and decoration that was once popular. They might have a swing arm to help create straight lines as well as inch and centimeter ruler marks.
EUREKA MATH2 Florida B.E.S.T. Edition 4 ▸ M6 © Great Minds PBC 347
θ
20 0 m d = ? 50°41°
Early 17th-century full-circle protractor
17th-century semicircular protractor made by Italian scientist Giacomo Lusverg
Protractors continue to be made with more advanced designs and features. The bevel protractor, for instance, is equipped with a beam, graduated dial, and a blade. This might not be a bad survival tool to take next time you’re alone on an island: You can measure angles and calculate the distance to the nearest body of land in sight and cut open a coconut, all with one device!
4 ▸ M6 EUREKA MATH2 Florida B.E.S.T. Edition © Great Minds PBC 348
Materials
The following materials are needed to implement this module. The suggested quantities are based on a class of 24 students and one teacher.
25 4″ protractors (180°)
75 Blank paper, sheets
1 Cardstock circles, 4″ diameter, red (set of 25)
1 Cardstock circles, 4″ diameter, white (set of 25)
25 Dry-erase markers
24 Learn books
25 Markers
25 Pencils
Visit http://eurmath.link/materials to learn more.
25 Personal whiteboards
25 Personal whiteboard erasers
1 Projection device
25 Rulers
25 Scissors
1 Teach book
1 Teacher computer or device
© Great Minds PBC 350
Works Cited
Boaler, Jo, Jen Munsen, and Cathy Williams. Mindset Mathematics: Visualizing and Investigating Big Ideas: Grade 3. San Francisco, CA: Jossey-Bass, 2018.
Carpenter, Thomas P., Megan L. Franke, and Linda Levi. Thinking Mathematically: Integrating Arithmetic and Algebra in Elementary School. Portsmouth, NH: Heinemann, 2003.
Carpenter, Thomas P., Megan L. Franke, Nicholas C. Johnson, Angela C. Turrou, and Anita A. Wager. Young Children’s Mathematics: Cognitively Guided Instruction in Early Childhood Education. Portsmouth, NH: Heinemann, 2017.
CAST. Universal Design for Learning Guidelines version 2.2. Retrieved from http://udlguidelines.cast.org, 2018.
Clements, Douglas H. and Julie Sarama. Learning and Teaching Early Math: The Learning Trajectories Approach. New York: Routledge, 2014.
Danielson, Christopher. Which One Doesn’t Belong?: A Teacher’s Guide. Portland, ME: Stenhouse, 2016.
Danielson, Christopher. Which One Doesn’t Belong?: Playing with Shapes. Watertown, MA: Charlesbridge, 2019.
The Editors of Encyclopaedia Britannica. “Protractor,” Encyclopaedia Britannica Inc., August 18, 2013, https://www.britannica.com/technology/protractor.
Empson, Susan B. and Linda Levi. Extending Children’s Mathematics: Fractions and Decimals. Portsmouth, NH: Heinemann, 2011.
Florida Department of Education. Florida’s B.E.S.T. Standards: Mathematics. Tallahassee, FL: Florida Department of Education, 2019.
Flynn, Mike. Beyond Answers: Exploring Mathematical Practices with Young Children. Portsmouth, NH: Stenhouse, 2017.
Fosnot, Catherine Twomey, and Maarten Dolk. Young Mathematicians at Work: Constructing Number Sense, Addition, and Subtraction. Portsmouth, NH: Heinemann, 2001.
Franke, Megan L., Elham Kazemi, and Angela Chan Turrou. Choral Counting and Counting Collections: Transforming the PreK-5 Math Classroom. Portsmouth, NH: Stenhouse, 2018.
Hattie, John, Douglas Fisher, and Nancy Frey. Visible Learning for Mathematics, Grades K–12: What Works Best to Optimize Student Learning. Thousand Oaks, CA: Corwin Mathematics, 2017.
Huinker, DeAnn and Victoria Bill. Taking Action: Implementing Effective Mathematics Teaching Practices. Kindergarten–Grade 5, edited by Margaret Smith. Reston, VA: National Council of Teachers of Mathematics, 2017.
Kelemanik, Grace, Amy Lucenta, Susan Janssen Creighton, and Magdalene Lampert. Routines for Reasoning: Fostering the Mathematical Practices in All Students. Portsmouth, NH: Heinemann, 2016.
© Great Minds PBC 352
Ma, Liping. Knowing and Teaching Elementary Mathematics: Teachers’ Understanding of Fundamental Mathematics in China and the United States. New York, NY: Routledge, 2010. Marchant, Jo. “Egyptian Tomb Mystery May Be World’s First Protractor,” New Scientist, July 29, 2011, https://www.newscientist.com/article/dn20748-egyptian -tomb-mystery-may-be-worlds-first-protractor/.
National Museum of American History. “Navigation,” Smithsonian Institution, accessed June 12, 2020, https://www.si.edu /spotlight/protractors/navigation.
National Museum of American History. “Protractors,” Smithsonian Institution, accessed June 12, 2020, https://americanhistory.si.edu/collections/object -groups/protractors.
Parker, Thomas and Scott Baldridge. Elementary Mathematics for Teachers. Okemos, MI: Sefton-Ash, 2004.
Shumway, Jessica F. Number Sense Routines: Building Mathematical Understanding Every Day in Grades 3–5. Portland, ME: Stenhouse Publishing, 2018.
Smith, Margaret S. and Mary K. Stein. 5 Practices for Orchestrating Productive Mathematics Discussions, 2nd ed. Reston, VA: National Council of Teachers of Mathematics, 2018.
Smith, Margaret S., Victoria Bill, and Miriam Gamoran Sherin. The 5 Practices in Practice: Successfully Orchestrating Mathematics Discussions in Your Elementary Classroom, 2nd ed. Thousand Oaks, CA: Corwin Mathematics; Reston, VA: National Council of Teachers of Mathematics, 2020.
Sparavigna, Amelia Carolina. “Kha’s Protractor,” Stretching the Boundaries (blog), August 1, 2011, https://stretchingtheboundaries.blogspot.com/2011/08 /khas-protractor.html.
Van de Walle, John A. Elementary and Middle School Mathematics: Teaching Developmentally. New York: Pearson, 2004.
Van de Walle, John A., Karen S. Karp, LouAnn H. Lovin, and Jennifer M. Bay-Williams. Teaching Student-Centered Mathematics: Developmentally Appropriate Instruction for Grades 3–5, 3rd ed. New York: Pearson, 2018.
Zwiers, Jeff, Jack Dieckmann, Sara Rutherford-Quach, Vinci Daro, Renae Skarin, Steven Weiss, and James Malamut. Principles for the Design of Mathematics Curricula: Promoting Language and Content Development. Retrieved from Stanford University, UL/SCALE website: https:// ul.stanford.edu/resource/principles-design-mathematics -curricula, 2017.
© Great Minds PBC 353 EUREKA MATH2 Florida B.E.S.T. Edition 4 ▸ M6
Credits
Great Minds® has made every effort to obtain permission for the reprinting of all copyrighted material. If any owner of copyrighted material is not acknowledged herein, please contact Great Minds for proper acknowledgment in all future editions and reprints of this module.
All United States currency images Courtesy the United States Mint and the National Numismatic Collection, National Museum of American History.
For a complete list of credits, visit http://eurmath.link/media-credits.
Cover, page 270, Frank Stella (b. 1936), Tahkt-I-Sulayman Variation II, 1969, acrylic on canvas. Minneapolis Institute of Arts, MN. Gift of Bruce B. Dayton/Bridgeman Images. © 2020 Frank Stella/Artists Rights Society (ARS), New York; page 27, Kazakova Maryia/Shutterstock; page 45, WR7/Shutterstock; page 49, Mary Long/Shutterstock; pages 122, 125, Demuth, Charles (1883–1935). My Egypt. 1927. Oil, fabricated chalk, and graphite
pencil on composition board. Overall: 35 15/16 x 30 in. (91.3 x 76.2 cm). Purchase, with funds from Gertrude Vanderbilt Whitney. Inv. N.: 31.172 Digital image © Whitney Museum of American Art/Licensed by Scala/Art Resource, NY; pages 232, 346, Public Domain via Wikimedia Commons; pages 242, 243, (door), David Papazian/Shutterstock, (street), jumis/Shutterstock, (children), jumis/Shutterstock, (alligator), Viktor Thaut/ Shutterstock; page 346, (top left), Table Mountain, Cape Town, from the Sea, 1820 (oil on card) © Michael Graham-Stewart/ Bridgeman Images, (bottom left), The Reading Room/Alamy Stock Photo; page 347, (top left), Egyptian civilization, New Kingdom, Dynasty XVIII. Carved wooden box for scale belonged to architect Kha. From Deirel-Medina, Tomb of Kha eMerit. G. Dagli Orti/ De Agostini Picture Library/Bridgeman Images, (top right), Historic Images/Alamy Stock Photo, (bottom right), Christie’s Images/ Bridgeman Images; page 348, Fouad A. Saad/Shutterstock; All other images are the property of Great Minds.
© Great Minds PBC 354
Acknowledgments
Kelly Alsup, Leslie S. Arceneaux, Lisa Babcock, Adam Baker, Christine Bell, Reshma P. Bell, Erik Brandon, Joseph T. Brennan, Leah Childers, Mary Christensen-Cooper, Jill Diniz, Janice Fan, Scott Farrar, Ryan Galloway, Krysta Gibbs, Danielle Goedel, Torrie K. Guzzetta, Kimberly Hager, Jodi Hale, Karen Hall, Eddie Hampton, Andrea Hart, Rachel Hylton, Travis Jones, Laura Khalil, Jennifer Koepp Neeley, Liz Krisher, Courtney Lowe, Bobbe Maier, Ben McCarty, Ashley Meyer, Pat Mohr, Bruce Myers, Marya Myers, Victoria Peacock, Maximilian Peiler-Burrows, Marlene Pineda, Jay Powers, Elizabeth Re, Jade Sanders, Deborah Schluben, Colleen Sheeron-Laurie, Jessica Sims, Tara Stewart, Theresa Streeter, Mary Swanson, James Tanton, Julia Tessler, Jillian Utley, Saffron VanGalder, Rafael Velez, Jackie Wolford, Jim Wright, Jill Zintsmaster
Trevor Barnes, Brianna Bemel, Adam Cardais, Christina Cooper, Natasha Curtis, Jessica Dahl, Brandon Dawley, Delsena Draper, Sandy Engelman, Tamara Estrada, Soudea Forbes, Jen Forbus, Reba Frederics, Liz Gabbard, Diana Ghazzawi, Lisa Giddens-White, Laurie Gonsoulin, Nathan Hall, Cassie Hart, Marcela Hernandez, Rachel Hirsh, Abbi Hoerst, Libby Howard, Amy Kanjuka, Ashley Kelley, Lisa King, Sarah Kopec, Drew Krepp, Crystal Love, Maya Márquez, Siena Mazero, Cindy Medici, Ivonne Mercado, Sandra Mercado, Brian Methe, Patricia Mickelberry, Mary-Lise Nazaire, Corinne Newbegin, Max Oosterbaan, Tamara Otto, Christine Palmtag, Andy Peterson, Lizette Porras, Karen Rollhauser, Neela Roy, Gina Schenck, Amy Schoon, Aaron Shields, Leigh Sterten, Mary Sudul, Lisa Sweeney, Samuel Weyand, Dave White, Charmaine Whitman, Nicole Williams, Glenda Wisenburn-Burke, Howard Yaffe
© Great Minds PBC 355
Exponentially Better
Knowledge2 In our tradition of supporting teachers with everything they need to build student knowledge of mathematics deeply and coherently, Eureka Math2 provides tailored collections of videos and recommendations to serve new and experienced teachers alike.
Digital2 With a seamlessly integrated digital experience, Eureka Math2 includes hundreds of clever illustrations, compelling videos, and digital interactives to spark discourse and wonder in your classroom.
Accessible2 Created with all readers in mind, Eureka Math2 has been carefully designed to ensure struggling readers can access lessons, word problems, and more.
Joy2 Together with your students, you will fall in love with math all over again—or for the first time—with Eureka Math2.
Module 1
Place Value Concepts for Addition and Subtraction
Module 2
Place Value Concepts for Multiplication and Division
Module 3
Multiplication and Division of Multi-Digit Numbers
Module 4
Foundations for Fraction Operations
Module 5
Place Value Concepts for Decimal Fractions
Module 6
Geometric Measurement and Data
What does this painting have to do with math?
American abstract painter Frank Stella used a compass to make brightly colored curved shapes in this painting. Each square in this grid includes an arc that is part of a design of semicircles that look like rainbows. When Stella placed these rainbow patterns together, they formed circles. What fraction of a circle is shown in each square?
On the cover
Tahkt-I-Sulayman Variation II, 1969
Frank Stella, American, born 1936
Acrylic on canvas
Minneapolis Institute of Art, Minneapolis, MN, USA
ISBN 978-1-63642-524-5
Frank Stella (b. 1936), Tahkt-I-Sulayman Variation II, 1969, acrylic on canvas. Minneapolis Institute of Art, MN. Gift of Bruce B. Dayton/Bridgeman Images. © 2020 Frank Stella/Artists Rights Society (ARS), New York
9 7 8 1 6 3 6 4 2 5 2 4 5
A