MICHIGAN’S GREAT INFLECTION
A STRATEGY FOR THE AGE OF TECHNOLOGY AND TALENT

Richard Florida and the Creative Class Group May 2023


TABLE OF CONTENTS 2 www.creativeclass.com - @creative_class A STRATEGY FOR THE AGE OF TECHNOLOGY AND TALENT Executive Summary 3 Michigan’s Inflection Point 7 The Underlying Economic Transformation 9 The Shift to Knowledge 12 Creative Destruction 14 The Innovation Challenge 18 The Age of Talent 22 College Towns and Tech Talent 30 A Strategy for Michigan’s Future 33 Research, Data, and Methodology 40 Acknowledgments 43 Team Background and Bios 44 References 45
MICHIGAN’S GREAT INFLECTION
EXECUTIVE SUMMARY


Michigan stands at a historical inflection point. For more than a century, it has led the world in automotive production. But today the industry is in the midst of an epochal technological transformation, shifting from the production of analog or mechanical vehicles powered by fossil fuels and driven by human beings to a new and highly innovative advanced mobility industry where vehicles are powered by electric batteries, driving is digitally assisted or autonomous, and cars and trucks have operating systems that are connected to and continuously upgraded by software.
This once-in-a-century transformation is both an enormous opportunity and an existential challenge for the state as it faces growing competition in these critical new technologies from high-tech hubs across the United States and the world. To ensure the long-run prosperity of its industries, communities, and people, Michigan must focus its economic development strategy on bolstering and aligning the capabilities of its leading corporations, universities, and startups in critical transformational technologies. As importantly, if not more so, the state must enhance its strategies for generating, retaining, and attracting the talent required to compete in this new economic environment.
3 www.creativeclass.com - @creative_class
Moving forward, Michigan has many assets from which to build such a winning strategy.
■ Michigan’s automotive sector is knowledge intensive—despite the common perception that it is a legacy industry—and employment in it has bounced back considerably from its low point during the economic crisis of 2007–2008.
■ Employment in Michigan’s transportation equipment sector has increased by more than 50 percent since the Great Recession. And today, a greater share of its automotive workforce is employed in knowledge, professional, and creative occupations than in production occupations. Nearly a quarter of Michigan’s automotive workers are computer scientists and engineers.
■ Michigan remains the global epicenter of automotive research, design, and innovation. The state accounts for nearly half of U.S. corporate R&D spending in the transportation equipment industry and two-thirds of corporate R&D spending in the motor vehicles, bodies, trailers, and parts sector.
■ Michigan leads nationally when it comes to manufacturing investments in electric vehicle technology with more than $16 billion in such investments since 2015, tied with Tennessee for first place.

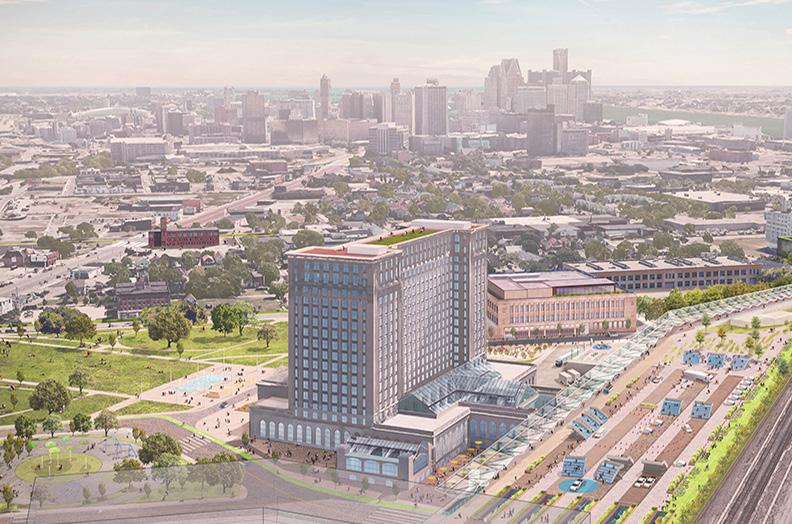
■ Michigan-based companies are investing heavily in the new technologies that are reshaping the automotive sector. The state leads the nation in three of the most disruptive technologies that are transforming the global economy: hybrid vehicles/electric cars, lane-departure warning, and radio frequency identification. The Michigan Central Innovation District in downtown Detroit is on its way to becoming a global hub for innovation in advanced mobility technology and a catalyst for a broad ecosystem of startups.
■ Michigan’s universities are a huge source of top-level talent. Its University Research Corridor, an alliance of the University of Michigan, Michigan State, and Wayne State University, produces more talent than leading academic clusters such as Boston-Cambridge, the San Francisco Bay Area, or the North Carolina Research Triangle.
■ The perception that the state does not retain talent is a myth. Michigan ranks seventh nationally for its percentage of college and university graduates who stay in the state. The greater Detroit metro has the highest retention rate for two- and four-year college grads of any metro in the country.
EXECUTIVE SUMMARY (CONTINUED) 4 www.creativeclass.com - @creative_class
But Michigan also faces key challenges that it must address so it can successfully navigate the ongoing technological transformation. This will help ensure that its economy continues to thrive, its workers continue to have family-supporting jobs, and its residents continue to see their living standards rise.
■ While it is still the global center for automotive production, design, technology, and R&D, Michigan’s capabilities are skewed toward technologies and skills of the past. It must pivot from its historical focus on analog, mechanical, and petroleum-oriented technologies toward the new digital, connected, electric vehicle technologies of the future.
■ Though Michigan does well on talent retention overall, too much of the most crucial talent it generates leaves the state. For example, just a quarter of University of Michigan’s computer-related majors are working in the state five years after graduation; indeed, a significantly larger percentage (36 percent) of them are working on the West Coast.
■ Part of the reason Michigan loses so much of the tech talent it generates is the fact that Silicon Valley and Austin have thicker labor markets for computer scientists and engineers. But Michigan has put itself at a further disadvantage by paying substantially lower wages and salaries than they do. In 2022, the state ranked 19th in average wages for computer programmers.
■ Talent attraction is an even bigger challenge. Michigan lags badly in attracting young, college-educated tech talent from elsewhere.
■ While Michigan has seen a significant uptick in high-tech startups and venture capital investment—Detroit was named the world’s leading “emerging startup ecosystem” in 2022—it accounts for less than 1 percent of all U.S. venture capital investment.
EXECUTIVE SUMMARY (CONTINUED) 5 www.creativeclass.com - @creative_class
Michigan has many, if not most, of the assets it needs to reset its growth trajectory. But time is of the essence. Today’s speed and scale of change is unprecedented and will require rapid and agile action across government agencies at all levels, closely aligned with the efforts of the private and civic sectors.
To better position the state to succeed, we propose the creation of a Michigan Economic Transformation Alliance. Organized as a blue-chip, multi-sector panel spanning relevant cabinet and departmental agencies and including leaders from the state’s business, startup, higher education, labor, and civic communities and other relevant stakeholders, its work should be organized around three key pillars:
■ TRANSFORMATIONAL TECHNOLOGY
The future of the automotive industry will turn on innovations in software, artificial intelligence, and digital technology; electric power and batteries; and more. Michigan must act now to engage in today’s transformation by better aligning the research and development assets of its world-class universities with its leading industries.
■ TALENT
The key resource of the knowledge economy is talent. But while the state retains much of the overall talent it produces, it continues to lose critical talent in key fields like computer science and electrical engineering and fails to attract talent from elsewhere. Michigan must double down on its efforts to create, attract, and retain talent.
■ PLACEMAKING
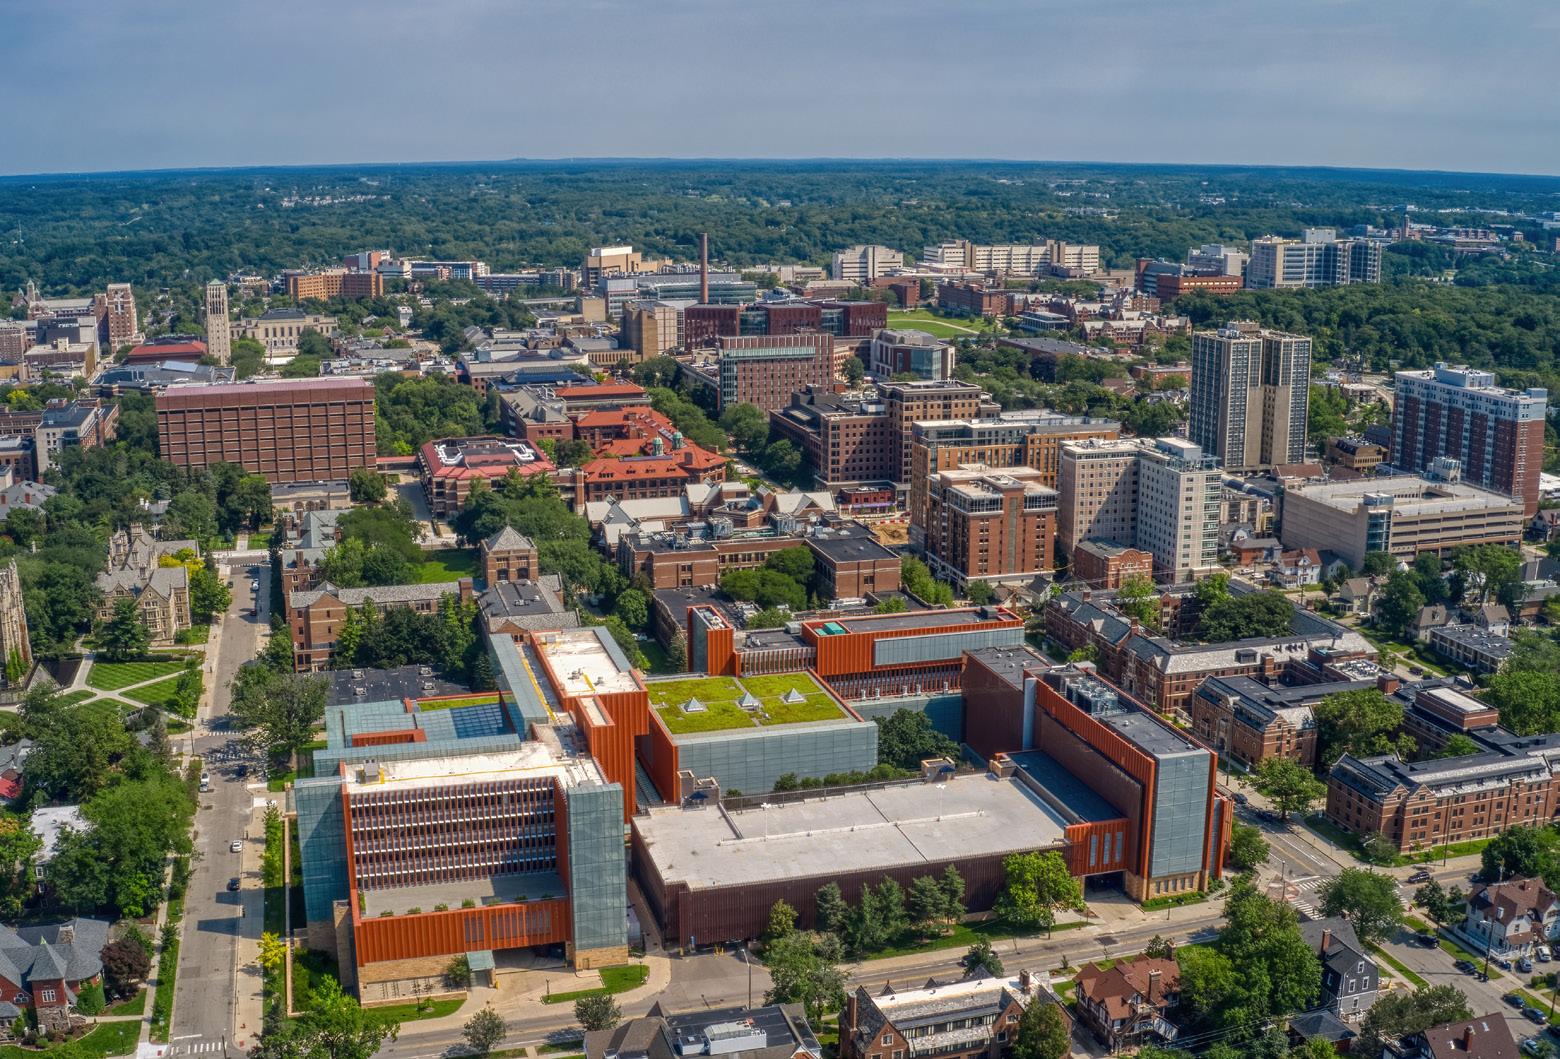
Educated, skilled, and talented people are mobile and can choose where they live. Fortunately, Michigan has an incredibly diverse portfolio of places to attract and retain them—gritty urban centers, affordable suburbs, verdant rural areas, and lakefront communities. But one advantage that the state has not leveraged nearly enough is its college towns. From Palo Alto and Cambridge to Austin and Boulder, college towns not only produce top talent; they are where young tech workers often choose to live. Michigan must act now to grow and scale Ann Arbor, East Lansing, and its other college towns and strengthen their connections to Detroit and other economic centers across the state.
By moving forward on this agenda, Michigan can create a stronger 21st century economy, one that generates opportunities for residents across all its many and varied communities. In doing so, it can forge a new model of sustainable and inclusive economic growth—for the nation and the world.

EXECUTIVE SUMMARY (CONTINUED) 6 www.creativeclass.com - @creative_class
MICHIGAN’S INFLECTION POINT


Our economy and society are in the throes of an epochal transformation— from an industrial system based on extraction, physical labor, and manufacturing to a knowledge economy powered by technology, talent, ideas, and creativity.1 That older system underpinned a broad middle class and provided immense benefits to Michigan, its people, and its communities. 2 While the new knowledge economy has spurred crucial advances in productivity and innovation, it has failed to deliver sufficient opportunity and rising living standards to large parts of the country. Income inequality has risen to levels not seen since the 1920s, and much of the nation’s industrial heartland has been hollowed out. Michigan bore much of the brunt of this economic transformation. Over the past several decades, its population growth has faltered and its incomes and living standards have declined.
Michigan now stands at a historic inflection point, one that could be every bit as pivotal as the invention of the internal combustion engine was nearly a century and a half ago. The automotive industry is being transformed by three major technological developments: the rise of assisted and eventually autonomous driving, the shift to connected software-assisted vehicles with operating systems that can be continuously upgraded, and the move from gas-powered engines to fully electric vehicles.3 Manufacturing broadly is being transformed from factories manned by blue-collar production workers to automated facilities powered by digital technology, robotics, and clean energy. These fundamental shifts pose an existential challenge to the state, which faces competition in these new technologies from high-tech hubs in Silicon Valley, across the United States, in Asia, and around the world.
It is sometimes said that Michigan’s biggest competition comes from southern states with their lower taxes, lower wages, lighter regulations, and more business-friendly environments. But competitiveness in the knowledge economy turns on much more than costs. Michigan neither can nor should try to compete with the Sunbelt for low-wage manufacturing jobs. Those are not the jobs and technologies that are crucial to the state’s economic future. Nobody wins in a race to the bottom.
7 www.creativeclass.com - @creative_class
INFLECTION POINT (CONTINUED)
The key factor driving economic competitiveness today is talent—the capacity to develop, retain, and attract talent of every description, from the digital cloud to the production floor. A truly business-friendly climate requires public investments in great universities to develop top talent; in great places that attract and retain talent; and in a well-developed talent pipeline of high schools, vocational training, and community colleges to align homegrown talent to the needs of the economy. And it requires flexibility—the capacity to respond quickly and nimbly to new economic challenges and industry needs. Talent, technology, and place, not cost per se, is the new nexus of competition.
To better understand the key challenges facing the state and to better position it to succeed and prosper in this new economic reality, we analyzed quantitative data on Michigan’s industrial strengths and weaknesses, its talent base, and more. We reviewed and built on a wide range of studies conducted by researchers at universities, government agencies, consultancies, and think tanks. And we conducted interviews with leaders from business, technology, startup, academic, civic, and related communities across the state to provide deeper insights into opportunities and obstacles. (The Appendix provides more detail on our research and analysis.)
Michigan’s great inflection poses enormous challenges, but it also presents great opportunities. Michigan is still the global epicenter of automotive research and production, and its companies are investing heavily in new technologies. Its universities are turning out leading-edge research and worldclass talent in computer science, artificial intelligence, and engineering, which are central to the automotive transition. And Michigan can navigate this economic and technological transformation in a new way. Historically, states, nations, and regions have followed one of two paths when it comes to harnessing new technologies and the broader economic structures they give rise to.4
The first path is “shifting”—applying new technologies to generate wholly new industries—the basic pattern followed by the U.S. over the past half century. Its growth model is premised on inventing and investing in new technologies like semiconductors, computers, software, biotechnology, and the Internet, while pivoting away from older industries like steel, autos, and consumer electronics, which were declining and moving offshore. Shifting is also the path adopted by older U.S. regions seeking to cope with their own economic transitions. With their leading industries decimated, they had little choice but to build self-standing innovation ecosystems along the lines of the so-called Silicon Valley model.
After World War II, when Boston-Cambridge’s textile and footwear industries declined, business and technology leaders in the region launched the nation’s first organized venture capital fund, American Research and Development (ARD), to commercialize the new technology coming out of MIT and create one of the world’s first high-tech startup hubs. Pittsburgh followed a similar path decades later when its steel and other heavy industries declined, reorienting and rebuilding its economy around the new computer and robotics technologies generated by Carnegie Mellon and the biomedical capabilities of the University of Pittsburgh and its medical center. More than 30 years ago, my book The Breakthrough Illusion cautioned about the limits of this approach as it essentially ceded the nation’s industrial base and the high-paying jobs and crucial technical know-how it provided to overseas competitors. 5
The second path is “deepening,” which involves using advanced technologies to upgrade incumbent industries. This is the path that Germany, Japan, and Korea have taken by investing in and upgrading their steel, auto, chemical, consumer electronics, and related industries.
Today, Michigan has the unique opportunity to follow both paths—shifting and deepening simultaneously by using its high-tech innovation capabilities to accelerate the transformation of its leading industry. In doing so, it can avoid the pitfalls of trying to become yet another “Silicon Somewhere” and remain true to its character, heritage, and values.
MICHIGAN’S
8 www.creativeclass.com - @creative_class
THE UNDERLYING ECONOMIC TRANSFORMATION


The economic transformation that we are experiencing is as deep and far-reaching as the transition from agriculture to industry was back in the late 18th and early 19th centuries. The chart below (see Figure 1) captures its essence by plotting the changing shares of the U.S. workforce employed in manufacturing versus knowledge-based activities since 1939. The line for manufacturing is nearly straight down, while the line for knowledge-based activities is nearly straight up. The U.S. economy had changed irrevocably by the mid-1980s, when the share of the workforce in knowledge-based occupations surpassed the share in manufacturing jobs for the first time.
Source: U.S. Bureau of Labor Statistics, Current Employment Statistics. https://www.bls.gov/data/home.htm
0% 5% 10% 15% 20% 25% 30% 35% 40% 1939 1950 1960 1970 1980 1990 2000 2010 2020 Percentage of U.S. To tal Nonfarm Employmen t Professional & Business Services, Information, and Financial Activities Manufacturing
Figure 1: Economic Transformation from the Industrial to Knowledge Economy, 1939-2022 Source: U.S. Bureau of Labor Statistics, Current Employment Statistics. https://www.bls.gov/data/home.htm
Figure 1: Economic Transformation from the Industrial to Knowledge Economy, 1939–2022
Percentage of U.S. Total Nonfarm Employment 9 www.creativeclass.com - @creative_class
THE UNDERLYING ECONOMIC TRANSFORMATION (CONTINUED)
As manufacturing waned, the once dominant working class shrunk to literally half its size, from 40 percent or more of the workforce during the early and middle parts of the 20th century to just over 20 percent. Today, just 8 percent of the U.S. workforce is employed in manufacturing.
America’s largest class is now made up of knowledge, professional, and creative workers. It has grown from 18 percent of the workforce in 1960 to more than 40 percent today (60 million-plus workers),6 nearly double the size of the working class and slightly larger than the class of routine service workers in clerical, healthcare, personal services, and related occupations, who number 59 million, or 38 percent of the workforce.7
Source: U.S. Bureau of Economic Analysis, SAINC1 State Annual Personal Income Summary. https://www.bea.gov/data/income-saving/personal-income-by-state
Source: U.S. Bureau of Economic Analysis, SAINC1 State Annual Personal Income Summary. https://www.bea.gov/data/income-saving/personal-income-by-state
Source: U.S. Bureau of Labor Statistics, Current Employment Statistics. https://www.bls.gov/data/home.htm
Source: U.S. Bureau of Labor Statistics, Current Employment Statistics. https://www.bls.gov/data/home.htm
This transition has been especially wrenching for Michigan, which ranked among the nation’s fastest growing and most prosperous states until the mid-20th century. From the end of World War II to the early 1980s, its population grew at a faster rate than the nation’s, after which its growth rate fell substantially below it (see Figure 2). The same basic pattern can be seen in Michigan’s job growth, which roughly tracked the national benchmark until the late 1970s but fell substantially below it in more recent decades (see Figure 3).
Michigan
relative
U.S. employment change relative to 1956
employment change
to 1956
Figure 3: Employment Growth Rate for Michigan vs. the United States, 1957-2022
-50% 0% 50% 100% 150% 200% 250% 1957 1970 1980 1990 2000 2010 Employment Growth Rate Relative to 1956 2020 -20% 0% 40% 20% 60% 80% 100% 120% 140% 160% 180% 200% 1930 1945 1960 1975 1990 2005 2020 U.S. population change relative to 1929 Michigan population change relative to 1929
Figure 2: Population Growth Rate for Michigan vs. the United States, 1929-2022
Population Growth Rate Relative to 1929
Figure 2: Population Growth Rate for Michigan vs. the United States, 1929–2022
Figure 3: Employment Growth Rate for Michigan vs. the United States, 1957–2022
Population Growth Rate Relative to 1929 Employment Growth Rate Relative to 1956 10 www.creativeclass.com - @creative_class
THE UNDERLYING ECONOMIC TRANSFORMATION (CONTINUED)
The most telling trend is for income and wages—fundamental barometers of economic health. As Figure 4 shows, Michigan’s per-capita personal income average surpassed the U.S. average for an astounding 41 of the 46 years between 1939 and 1985, the period when manufacturing employment exceeded employment in knowledge work.8 For members of the working and middle classes, Michigan exemplified the American Dream. With a population of 1.85 million, Detroit was America’s fourth largest city in 1950, home to nearly 300,000 (296,000) manufacturing jobs, many of them unionized, that paid family-supporting wages. But the state’s per capita income has eclipsed the nation’s in only four of the 37 years since knowledge work overtook manufacturing, and by 2021, Michigan’s per capita income, which was the 11th highest in the nation in 1950, had plummeted to 35th.9
In 1979, median wages for Michigan workers were nearly 20 percent higher than for the nation as a whole. Today, that trend has been reversed, and wages in Michigan are roughly 10 percent below the U.S. benchmark, according to data analyzed by Lou Glazer of Michigan Future Inc. and Donald Grimes of the University of Michigan. If Michigan workers still enjoyed the wage premium they did back then, they would be earning nearly $20,000 more today, with median wages of $80,695 rather than $61,178. 10

Perhaps no city was harder hit than Detroit, where the effects of deindustrialization were compounded by decades of white flight, declining unions, globalization, urban crime, and more. Since 1960, Detroit has lost more than one million residents. 11 Between 1969 and today, Detroit’s ranking for per-capita personal income fell from the 10th highest of U.S. metros with populations of one million or more to 29th.12 And the trauma was not confined to Detroit. Between 2000 and 2021, the metropolitan areas of Battle Creek, Bay City, Flint, Niles, and Saginaw all experienced employment declines of 10 percent or more.13 Over this same period, statewide employment fell by 1 percent while employment across the U.S. experienced a robust growth rate of 22 percent.
Source: U.S. Department of Commerce, Bureau of Economic Analysis, SAINC1 State Annual Personal Income Summary. https://www.bea.gov/data/income-saving/personal-income-by-state
Source: U.S. Department of Commerce, Bureau of Economic Analysis, SAINC1 State Annual Personal Income Summary https://www.bea.gov/data/income-saving/personal-income-by-state
$0 $10,000 $20,000 $30,000 $40,000 $50,000 $60,000 $70,000 $80,000 1929 1940 1950 1960 1970 1980 1990 2000 2010 2020 140% 120% 100% 80% 60% 40% 20% 0% Per-Capita Personal Income in Michigan Relative to U.S. (Dashed Line ) Per-Capita Personal Income in Michigan (Blue) to U.S. (Black) , Adjusted to 2022 Dollars Michigan Relative to U.S. Michigan Michigan U.S.
Figure 4: Income Growth in Michigan vs. the United States, 1929-2022
Figure 4: Income Growth in Michigan vs. the United States, 1929–2022
Per-Capita Personal Income in Michigan (Blue) to U.S. (Black), Adjusted to 2022 Dollars Per-Capita Personal Income in Michigan Relative to U.S. (Dashed Line) 11 www.creativeclass.com - @creative_class
THE SHIFT TO KNOWLEDGE

One of the first thinkers to identify the shift from manufacturing to knowledge-based industry was the late, great management theorist Peter Drucker. Much of his thinking was informed by his detailed research on Michigan’s own General Motors. Based on the success of his 1942 book, The Future of Industrial Man, Drucker was invited by GM to undertake a two-year study of the company, which was America’s largest corporation at the time and a leader in research, technology, and management. In his 1946 book, Concept of the Corporation, Drucker theorized that GM and the economy as a whole were shifting from a system based on natural resources, physical labor, and manufacturing to one powered by science and technology, in which knowledge was the basic factor of production. In his 1969 book, The Age of Discontinuity, he laid out his theory at greater length, writing: “Productive work in today’s society and economy is work that applies vision, knowledge and concepts—work that is based on the mind rather than the hand.” His conceptualization of knowledge work is even more relevant today, as the automotive industry faces a new round of technological disruption.14
12 www.creativeclass.com - @creative_class
The data bears out Drucker’s insights. Today, 42 percent of Michigan’s automotive workers do knowledge, professional, and creative work, compared to 38 percent who work in production occupations, a good many of whom also use their brainpower on the factory floor. Nearly a quarter of Michigan’s automotive workers (24 percent) are computer scientists, engineers, or other scientific or technical workers. And the share of automotive knowledge workers is even higher in Detroit. Fully half of Greater Detroit’s automotive workforce (50 percent) do knowledge, professional, or creative work, compared to 31 percent who work in production occupations—just slightly more than the share of Detroit’s automotive workforce that is made up of computer scientists, engineers, or other scientific/technical workers (29 percent). The automotive workforce in both Michigan and Detroit is much more knowledge intensive than for the nation as a whole, where production occupations account for nearly half (48 percent) of the automotive workforce, with just 28 percent engaged in knowledge work.15
The shift to knowledge work also means better-paying jobs. For example, the broad category of computer and mathematical occupations in Michigan had average annual wages almost double the average annual wages of production jobs, $90,400 compared to $45,450.16 As noted earlier, jobs in Michigan no longer pay the premium they once did. Two decades or so ago, back in 2000, production jobs in the state paid a 25 percent premium over production jobs nationally. As of 2022, that premium had shrunk to less than 1 percent, clocking in at 0.2 percent.17 Economic development efforts that are solely focused on bringing back production jobs can no longer provide the economic boost they once did.
Knowledge, professional, and creative workers also outnumber blue-collar workers by a significant margin across the state’s workforce as a whole, accounting for 1.8 million workers, 38 percent of the state’s workforce. This compares to 25 percent for the blue-collar working class (1.1 million workers) and 37 percent (1.7 million workers) for routine service workers in fields like hospitality, clerical work, and personal services.
Michigan is home to some of America’s leading clusters of knowledge work and knowledge workers. Ann Arbor ranks fourth out of all 380-plus U.S. metros on that score, with a massive 54 percent of its workforce belonging to the ranks of knowledge, professional, and creative workers, behind only San Jose (the heart of Silicon Valley), Washington, D.C., and Boulder, Colorado.18 Grand Rapids’ knowledge and creative workforce clocked the fourth fastest growth rate for large metros between 2005 and 2017, driven by its high-end office furniture, medical devices, and biopharmaceuticals clusters.19 Also, the Traverse City area has witnessed a significant influx of remote creative-class workers.
All of this reveals a simple but profound story for the state. The transformation from the manufacturing economy to the new knowledge economy has rattled Michigan’s economy to the core, leading to declines in population, employment, and wages. Production work is no longer the highly paid, family-supporting work it once was. The future, including a good chunk of the future for factory jobs, lies in more highly paid knowledge work. Michigan is caught up in this transformation with a job base and a workforce that is over-concentrated in production and under-concentrated in knowledge work.
The only viable path for the future is to shift the state’s economy away from lower-paying manufacturing plants, which are ultimately going the way of the proverbial horse-and-buggy, and to leverage and build on the state’s assets and capabilities to compete for the higher-value-added, knowledge-based industries of the future.
Indeed, Michigan now has the opportunity to fuse its innovative knowledge economy to its leading industry and complete the economic transformation Drucker outlined more than a half a century ago.

SHIFT
THE
TO KNOWLEDGE (CONTINUED)
13 www.creativeclass.com - @creative_class
CREATIVE DESTRUCTION

Innovation and advanced technologies are sometimes thought to be the exclusive province of technology and biomedical companies like Apple, Microsoft, Genentech, and Google. But the reality is that new technologies can be even more powerful and transformative when they are applied to existing industries. The great theorist of innovation, Joseph Schumpeter, dubbed this process “Creative Destruction.” It proceeds as new technologies and innovations sweep across economies, remaking old industries and ways of working. Schumpeter famously described it as “the same process of industrial mutation—if I may use that biological term—that incessantly revolutionizes the economic structure from within, incessantly destroying the old one, incessantly creating a new one. This process of Creative Destruction is the essential fact about capitalism.”20 These periods can be disruptive and painful. Firms decline, jobs are eliminated, and the places that are home to laggard industries stagnate. While certain policies can soften the blow and give industries, workers, and places time to adapt, attempts to shield lagging firms from competition often just forestall the inevitable. The only way to reset industries and places for a new round of growth is to embrace those transformative technologies.

This is not the first time the transportation industry has been upturned by the process of creative destruction. It has been transformed several times in the past, as horses and mules and canals were replaced by streetcars, subways, and trains, and then again as the internal combustion engine helped to power Michigan’s and America’s economy in the 20th century. In fact, transportation is the illustrative example used by two economists, Richard Alm and W. Michael Cox, to describe the process of creative destruction. “Each new mode of transportation took a toll on existing jobs and industries,” they wrote. “In 1900, the peak year for the occupation, the country employed 109,000 carriage and harness makers. In 1910, 238,000 Americans worked as blacksmiths. Today, those jobs are largely obsolete. After eclipsing canals and other forms of transport, railroads lost out in competition with cars, long-haul trucks, and airplanes. In 1920, 2.1 million Americans earned their paychecks working for railroads, compared with fewer than 200,000 today.”21
The process of creative destruction is playing out once more as new technologies like software, artificial intelligence, assisted driving, autonomous vehicles, and electric batteries and power plants upturn the industry yet again.22 As Klaus Stricker, who heads up Bain & Company’s automotive industry consulting practice, told the New York Times in April, 2023, “In order to win in what we call the automotive endgame, traditional companies need to change fundamentally, basically now. We currently see the industry facing quite a lot of pressure over the next two years.”23
14 www.creativeclass.com - @creative_class
CREATIVE DESTRUCTION (CONTINUED)
The stakes are high. A recent report from World Resources Institute assesses the potential impacts on Michigan’s employment base as the automotive industry shifts to electric vehicle manufacturing. If the state successfully navigates this transition under what the study dubs the “High Competitiveness case,” it would add 56,000 jobs in 2030, including 17,000 direct jobs in vehicle manufacturing, 12,000 indirect jobs in the supply chain, and 27,000 more induced jobs coming from increased demand in the economy. However, if the state fails to make this transition under what the study calls the “Low Competitiveness case,” Michigan would end up with 47,000 fewer jobs in 2030, broken out as 4,000 fewer direct jobs in vehicle manufacturing, 15,000 fewer indirect supply chain jobs, and 28,000 fewer induced jobs in the broader economy. 24
Success will ultimately depend on actions the state takes now. Indeed, Michigan faces significant competition in these new and emerging automotive technologies, both from other regions of the United States and from overseas.25 Tesla, arguably the leader in electric vehicles, has doubled down on its R&D center in the San Francisco Bay Area, even as it has established new plants in Austin, Texas, and elsewhere. The electric vehicle maker Rivian, which moved its headquarters from Florida to Michigan in 2015, later shifted its R&D and advanced technology development in software, propulsion, and battery systems to Irvine, California, and manufactures its vehicles in Normal, Illinois.26 And since 2015, major domestic and international corporations have established new electric vehicle and related plants in the Sunbelt with $16.6 billion in EV-related investments going to Tennessee, $15.2 billion to Georgia, $13 billion to Nevada, $10.8 billion to Kentucky, $8.9 billion to South Carolina, $6.2 billion to North Carolina, $3.7 billion to Arizona, $2.4 billion to Alabama, and $2.1 billion to Texas.27 And China and Korea are the global leaders in electric battery technology as well as strong competitors in electric vehicles broadly.
That said, Michigan has considerable assets to compete. For one, the state is making significant investments in new technology and production facilities. It is tied with Tennessee with $16.6 billion for EV-related investments. “Prior to about 2020, software-defined vehicles were a research project,” Stephanie Brinley, a leading industry analyst, told Newsweek in February 2023. “Now the focus in Michigan is on commercial development and deployment more than theory, whether that’s battery technology, digital services, software development or autonomous vehicle development.”28 Figure 5 lists some of the larger automotive industry investments that have been made in the state since 2019.
May 2019 Stellantis, new plant in Detroit, 6,000 jobs
December 2019 Ford, $1.45 billion to produce electric F-150, 3,000 jobs
October 2020 GM, $2.2 billion to build Factory Zero, 2,000 jobs
January 2022
GM, $7 billion to convert Orion Township assembly plant to build full-size electric vehicle pickups and build Ultium’s third U.S. battery plant in Lansing
March 2022
LG Energy Solutions, $1.7 billion expansion of Holland battery manufacturing plant, 1,200 jobs
June 2022
Ford, $2 billion to support electric vehicle manufacturing growth and secure internal combustion engine portfolio in the state
June 2022
FLO, Canadian electric vehicle charging network operator, $3 million for manufacturing facility in Auburn Hills
October 2022
Our Next Energy, $1.6 billion to establish its first cell and electric vehicle battery pack gigafactory in Van Buren Township, 2,112 jobs
October 2022
Gotion, $2.36 billion for a new manufacturing facility in Big Rapid, 2,350 jobs
January 2023
Ford, $3.5 billion investment for new EV battery manufacturing facility in Marshall, 2,500 jobs
Figure 5: Recent Automotive-Related Investments in Michigan
Source: Michigan Economic Development Corporation, “Michigan a Top State for Electric Vehicle & Battery Investments, Bringing Home $16.6 Billion, Creating 16,300 Good-Paying Jobs,” March 14. 2023. https://www. michiganbusiness.org/press-releases/2023/03/top-state-for-ev-battery/
15 www.creativeclass.com - @creative_class
CREATIVE DESTRUCTION (CONTINUED)
Michigan retains a substantial manufacturing base and a large automotive sector. It still accounts for nearly a fifth (18 percent) of automotive industry employment.29 And since 2009 its automotive industry has been growing at a faster pace than that of the nation. Despite the common perception of it as an older, declining industry, employment in the automotive sector has bounced back considerably since its low point during the Great Recession. Across the United States, automotive industry employment grew by 53 percent from a low of roughly 664,000 workers in 2009 to one million by 2022 (see Figure 6). Over the same period, employment in the broader transportation equipment sector increased by 28 percent across the country, from 1.35 million workers in 2009 to 1.73 million in 2022. Michigan’s growth significantly exceeded that pace, increasing by 55 percent, from 119,000 workers in 2009 to 185,000 in 2022.30 The state has been bringing back manufacturing and blue-collar jobs, adding over 250,000 working-class jobs between 2010 and 2021, a growth rate of nearly 30 percent.
0% 10% 20% 30% 40% 50% 60% Total nonfarm employment Manufacturing Transportation equipment manufacturing Motor vehicles and parts 16% 8% 28% 53%
Figure 6: Employment Growth in Selected Industries, 2009-2022
U.S. Employment Growth, 2009-202 2
Source: U.S. Bureau of Labor Statistics, Current Employment Statistics https://bls.gov/data/home.htm
Figure 6: Employment Growth in Selected Industries, 2009–2022
U.S. Employment Growth, 2009-2022 16 www.creativeclass.com - @creative_class
Source: U.S. Bureau of Labor Statistics, Current Employment Statistics. https://www.bls.gov/data/home.htm
CREATIVE DESTRUCTION (CONTINUED)

The state’s considerable manufacturing capability can be seen in a metric called a Location Quotient (LQ). An LQ is basically a ratio that compares the relative concentration of an economic activity in a location to its overall concentration in the U.S. An LQ greater than 1.0 means the share of that activity in that location is higher than that of the U.S. as a whole, while an LQ of less than 1.0 means the share is lower. Michigan’s LQ for manufacturing is 1.7, which means that its share of employment in manufacturing is 70 percent greater than the national average. Michigan’s manufacturing LQ actually increased from 1.5 to 1.7 between 2000 and 2021 (see Figure 7). 31 This high specialization in manufacturing is the case in almost all of the state’s metropolitan areas.32 Although the Detroit metro has by far the largest number of manufacturing workers, 10 of the state’s metros have manufacturing LQs that are higher than Detroit’s LQ of 1.5. The Grand Rapids metro has a manufacturing LQ of 2.5; Muskegon’s is 2.6.
Michigan Industry Location Quotients in 2021(blue) and 2000(grey)
Figure 7: Michigan’s Leading Economic Sectors, 2021 and 2000
Michigan Industry Location Quotients in 2021(top) and 2000(bottom)
Figure 8: Michigan’s Leading Manufacturing Sectors, 2021 and 2000
Source: U.S. Bureau of Economic Analysis, SAEMP25N Total Full-time and Part-time Employment by NAICS Industry https://bea.gov/data/employment/employment-by-state
Source: U.S. Bureau of Economic Analysis. SAEMP25N. Total Full-time and Part-time Employment by NAICS industry. https://www.bea.gov/data/employment/employment-by-state
Michigan has even higher concentrations in key areas of automotive manufacturing (see Figure 8). The state’s LQ for motor vehicles, bodies, and trailers is a whopping 6.5, meaning this sector is more than six times larger than the national average. In addition, Michigan has LQs of roughly 2 in the machinery, plastics, and primary metal manufacturing sectors. Grand Rapids is home to a world-class cluster of office furniture manufacturers, with an LQ of about 8.5 in 2021.
and 2000
Source: U.S. Bureau of Economic Analysis, SAEMP25N Total Full-time and Part-time Employment by NAICS Industry.
Source: U.S. Bureau of Economic Analysis, SAEMP25N Total Full-time and Part-time Employment by NAICS Industry. https://www.bea.gov/data/employment/employment-by-state
https://bea.gov/data/employment/employment-by-state
Manufacturing Utilities Retail Trade Healthcare / Social Assistance Management Wholesale Trade Other Services Professional, Scientific, and Technical Services Administrative and Support Services Real Estate Accommodation and Food Services Construction Finance and Insurance Transportation and Warehousing Arts, Entertainment, and Recreation Educational Services Information Forestry, Fishing, and Related Activities Mining, Quarrying, and Oil and Gas Extraction
Michigan Industry Location Quotients in 2021 (blue) and 2000 (grey) 0.0 0.2 0.4 0.6 0.8 1.0 1.2 1.4 1.6 1.8 2.0 0.0 1.0 2.0 3.0 4.0 5.0 6.0 7.0 8.0 Motor Vehicles Machinery Plastics and Rubber Primary Metal Furniture Fabricated Metal Miscellaneous Paper Electrical Equipment Chemical Printing Beverage and Tobacco Nonmetallic Mineral Product Wood Leather Food Apparel Computer and Electronic Textile Mills Petroleum and Coal Other Transportation Equipment Textile Mills Michigan Industry Location Quotients in 2021 (top) and 2000 (bottom)
Figure 7: Michigan’s Leading Economic Sectors, 2021
Figure 8: Michigan’s Leading Manufacturing Sectors, 2021 and 2000
17 www.creativeclass.com - @creative_class
THE INNOVATION CHALLENGE


The knowledge economy is powered by innovation. And while we tend to think of innovation as the exclusive province of high-tech industries, the automotive industry is also highly R&D-intensive—and getting more so. It invests roughly $150 billion in R&D annually, behind only the biotech and pharmaceutical industry, on par with the high-tech hardware industry, and more than software and computer services.33
Michigan has substantial innovative capabilities. It is a leader in both corporate and university R&D, especially in automotive and related technologies. The state accounts for 45 percent of U.S. corporate R&D expenditures ($14.2 billion) in the transportation equipment industry, and 67 percent of corporate R&D ($14.0 billion) in the motor vehicles, bodies, trailers, and parts sector.34 Overall, Michigan spent more than $20 billion on corporate R&D in 2019, comprising 4.3 percent of the U.S. total and placing it fifth nationally behind only California, Washington, Massachusetts, and Texas (see Figure 9).35
Figure 9: Leading States for Corporate R&D Spending, 2019
Source: National Center for Science and Engineering Statistics (NCSES), 2020. Business Enterprise Research and Development, 2019. NSF 22-329. National Science Foundation. https://ncses.nsf.gov/pubs/nsf22329
California Washington Massachusetts Texas Michigan New Jersey New York Pennsylvania Illinois North Carolina $172 $37.3 $30.8 $23.9 $21.3 $20.4 $20.2 $15.2 $14.1 $13.2
Figure 9: Leading States for Corporate R&D Spending, 2019
Domestic R&D Paid for by the Company and Others and Performed by the Company Billions of Dollars in 2019 $0 $50B $100B $150B $200B
Source: National Center for Science and Engineering Statistics (NCSES), 2020. Business Enterprise Research and Development, 2019. NSF 22-329. National Science Foundation. https://ncses.nsf.gov/pubs/nsf22329
R&D
for
18 www.creativeclass.com - @creative_class
Domestic
Paid
by the Company and Others and Performed by the Company, Billions of Dollars in 2019
At the metro level, companies in Detroit spent $16.2 billion on corporate R&D, more than all cities except San Jose, San Francisco, Seattle, New York City, Boston, and Los Angeles. Kalamazoo-Portage spent $1.2 billion, ranking 48th nationally; Grand Rapids-Kentwood spent $883 million, ranking 57th nationally; and Ann Arbor spent $614 million, ranking 72nd.36 Ann Arbor’s auto and mobility technology sector has grown substantially in recent years and now has over 20,000 employees. 37
Leading firms are increasing their investments in R&D, technology, and design, all of which are central to the transformation of the automotive industry. Two major battery research centers recently opened in suburban Romulus outside Detroit: GM’s Wallace Battery Cell Innovation Center and Ford’s Ion Park.

The Michigan Central Innovation District is a nearly $1 billion, 30-acre, mixed-use initiative in and around Detroit’s historic Corktown neighborhood. It spans a mix of revitalized historic buildings—among them the Michigan Central rail station and the Detroit Book Depository designed by Alfred Kahn—as well as new buildings and revived public spaces. Josh Sirefman, who leads Michigan Central, recently told the New York Times: “Increasingly, there’s a real blurring between spaces for physical hardware and software. For us, that means having the kinds of spaces where you can simultaneously have vehicles you’re testing while also having a team of software engineers do their work.”38 The project also provides support for a wide range of innovative and entrepreneurial ventures. On this front, it has partnered with Newlab, an innovation collaborative of entrepreneurs and venture capitalists originally based in Brooklyn’s Navy Yard, to provide space and support in the Book Depository for new startups.
Michigan’s robust automotive production and supplier infrastructure provides yet another advantage. It is beneficial for companies to be able to test, tweak, and deploy new technologies in places where vehicles are actually produced, and Michigan produces more cars than California or any other state. Moving forward, Michigan can also capitalize on a streamlined process for permitting research labs and pilot production facilities, an important factor for businesses when selecting locations for R&D.
Figure 10: Leading States for University R&D, 2021
Source: National Center for Science and Engineering Statistics (NCSES), 2022. Higher Education Research and Development: Fiscal Year 2021. NSF 23-304. National Science Foundation. https://ncses.nsf.gov/pubs/ nsf23304
THE INNOVATION CHALLENGE (CONTINUED)
California New York Texas Pennsylvania Maryland Massachusetts North Carolina Georgia Illinois Michigan $11.2 $7.6 $6.9 $5.0 $4.9 $4.6 $3.5 $3.0 $2.9 $2.8
Higher Education R&D Expenditures, Billions of Dollars in FY 2021 $0 $2B $4B $6B $8B $10b $12B Higher Education R&D Expenditures, Billions of Dollars in FY 2021 19 www.creativeclass.com - @creative_class
Figure 10: Leading States for University R&D, 2021 Source: National Center for Science and Engineering Statistics (NCSES), 2022. Higher Education Research and Development: Fiscal Year 2021. NSF 23-304. National Science Foundation. https://ncses.nsf.gov/pubs/nsf23304
In addition, the state’s leading research universities provide critical innovative capability overall and in many of the fields that are key to the auto industry’s transformation. Michigan’s universities accounted for nearly $3 billion ($2.8 billion) in R&D expenditures in 2021, ranking 10th in the nation (see Figure 10).39 The University of Michigan accounted for $1.6 billion of that, or 58 percent; Michigan State University accounted for another $710 million, or 25 percent; and Wayne State had $236 million, 8 percent of the state’s total. Collectively, these three institutions accounted for over 90 percent of university R&D spending in Michigan. The University of Michigan consistently ranks in the top three universities in R&D nationally and among the world’s leaders in computer science, software, electrical and chemical engineering, and artificial intelligence technology.
Aligning that research to the state’s industrial capabilities is critically important. There is a good deal to build on here. In 2013, the University of Michigan, along with 25 industry partners and affiliates—including Ford, GM, Toyota, Nissan, Subaru, Denso, Lear Corporation, Amazon AWS, and Deloitte—worked together to create Mcity, an interdisciplinary research center focused on advanced mobility.40 And in 2017, the American Center
Figure 12: Growth in Venture Capital Investment in Michigan, 2006-2021
Source: PitchBook-NVCA Venture Monitor. https://pitchbook.com/news/reports/q1-2023-pitchbook-nvca-venture-monitor
12: Growth in Venture Capital Investment in Michigan, 2006–2021

Source: PitchBook-NVCA Venture Monitor. https://pitchbook.com/news/reports/q1-2023-pitchbook-nvca-venture-monitor
for Mobility was established as a joint initiative of state government, the University of Michigan, Business Leaders for Michigan, and local economic development groups. It is sited in a 500-acre campus with an advanced mobility proving ground and test track for developing and testing automated vehicles, mobility technology, and infrastructure.41 More recently, in 2022, the state approved $130 million in funding for an electric vehicle research center at the University of Michigan.42
Michigan has considerable innovation assets, ranking eighth in the U.S. for patents per capita, a conventional measure of innovation (see Figure 11). Between 2000 and 2020, the state increased its patenting per 100,000 people from 41 to 74.43
The state is also a leader in several of the most advanced and critical breakthrough technologies. A 2021 study by Stanford University economist Nicholas Bloom and colleagues identified 29 key disruptive technologies. Michigan was a leading “pioneer” location for three of them: hybrid vehicles/electric cars, lane departure warning, and radio frequency identification (RFID). 44
Note: Data are for patents per 100,000 people.
Source: U.S. Patent and Trademark Office, Patent Technology Monitoring Team. https://www.uspto.gov/ web/offices/ac/ido/oeip/taf/st_co_20.htm
THE INNOVATION CHALLENGE (CONTINUED)
Figure 11: Leading States for Innovation, 2020
California Massachusetts Washington Connecticut Oregon Minnesota New Hampshire Michigan Idaho Colorado 128 126 118 97 96 83 80 74 66 65 Figure 11: Leading States for Innovation, 2020 Note: Data are for patents per 100,000 people. Source: U.S. Patent and Trademark Office, Patent Technology Monitoring Team
Total Patents per 100,000 Population, 2020 0306090 120 150
https://www.uspto.gov/web/office/ac/ido/oeip/taf/st_co_20.htm
Figure
$0 $200m $400m $500m $800m $1,000m $1,200m 2006 2009 2015 2021
Ve nture Capital Investment in Michigan, Adjusted to Millions of Dollars in 2021 2012 2018 Venture Capital
Total Patents per 100,000 Population, 2020 20 www.creativeclass.com - @creative_class
Investment in Michigan, Adjusted to Millions of Dollars in 2021
But to leverage its innovation capabilities to the fullest, Michigan must develop and grow more startup enterprises. The state has seen a significant uptick in high-tech startups—Startup Genome named Detroit the world’s leading “emerging startup ecosystem” for 2022.45 The state has also seen a substantial uptick in venture capital investment (See Figure 12). Between 2006 and 2021, venture capital investment grew seven-fold, from $147 million to $1.0 billion. But this amounts to less than half of 1 percent (0.3%) of all U.S. venture capital investment, and Michigan is well behind the leading states in the dollar amounts of its investments (see Figure 13). Even when adjusted for employment and calculated per worker, the pattern is similar. Venture capital per employee in Michigan increased from $27 to $179 between 2006 and 2021. But despite that seven-fold increase, Michigan ranked just 32nd nationally on this metric. The vast majority of venture capital investment in Michigan, roughly $800 million, is concentrated in the Detroit–Ann Arbor corridor, with $452 million in Detroit and another $359 million in Ann Arbor.46
Despite its prominence for automotive production and technology, Michigan and its Detroit-Ann Arbor corridor failed to make the list of the world’s leading advanced mobility startup hubs, which include the San Francisco Bay Area (with 135 startups), New York City (76 startups), London (63), Paris (53), and Los Angeles (47), and smaller but still significant hubs in Berlin (21), Amsterdam (20), and Toronto (17). Indeed, the state and the Detroit-Ann Arbor corridor are punching beneath their weight on startup innovation generally as well as on startup innovation related to advanced mobility.47
Various communities across the state—from Detroit and Ann Arbor to Grand Rapids and Traverse City—are undertaking efforts to better organize their startup communities. But bolstering the state’s startup ecosystems remains a pressing policy priority.

Source: PitchBook-NVCA Venture Monitor. https://pitchbook.com/news/reports/q1-2023-pitchbook-nvca-venture-monitor
Source: PitchBook-NVCA Venture Monitor. https://pitchbook.com/news/reports/ q1-2023-pitchbook-nvca-venture-monitor
CHALLENGE (CONTINUED)
THE INNOVATION
Figure 13: Leading States for Venture Capital Investment, 2021
$0 $20B $40B $60B $80B $100B $120B$140B$160B$180B$200B
Figure 13: Leading States for Venture Capital Investment, 2021
Venture Capital Investment in
of Dollars California New York Massachusetts Texas Washington Colorado Florida Illinois New Jersey Pennsylvania Utah Georgia North Carolina Delaware Minnesota Virginia Ohio Connecticut Maryland Nevada Arizona Oregon Missouri Tennessee Michigan $163 $49.4 $35.1 $12.1 $8.5 $7.0 $6.8 $6.7 $6.3 $5.4 $4.2 $4.0 $3.8 $3.1 $2.7 $2.6 $2.4 $2.3 $2.2 $2.2 $2.1 $1.8 $1.2 $1.2 $1.0 Venture
21 www.creativeclass.com - @creative_class
2021, Billions
Capital Investment in 2021, Billions of Dollars
THE AGE OF TALENT
Talent is the key resource of the knowledge economy as it is human capability that produces the innovative technologies that drive growth. The state’s ability to successfully address and navigate its technological and economic transformation will turn on its ability to develop, retain, and attract talent.48 Fortunately, Michigan has the university and industry base that is needed to create talent in such key fields as computer science, software, artificial intelligence, electrical engineering, and chemical engineering.

Percentage of College Graduates Who Stayed in State
Percentage of College Graduates Who Stayed in State
Figure 14: Retention of College Grads by State
Source: Andrew Van Dam, “States with the Worst Brain Drain—and More!” The Washington Post, September 9, 2022. Data are from Johnathan G. Conzelmann, Steven W. Hemelt, Brad Hershbein, Shawn M. Martin, Andrew Simon & Kevin M. Stange, “Grads on the Go: Measuring College-Specific Labor Markets for Graduates,” NBER Working Paper, 3088, May 2022. https://www.nber.org/papers/w30088

25% 0% 50% 75% 100% California Texas Florida New York Minnesota Washington Michigan Georgia Colorado Alaska Tennessee Ohio Nevada Illinois New Jersey North Carolina Louisiana Nebraska Oregon Missouri Kentucky Wisconsin Utah Oklahoma Arkansas Arizona Alabama South Dakota New Mexico Montana Pennsylvania South Carolina Hawaii Massachusetts Indiana Idaho Iowa Maryland North Dakota Maine District of Columbia Delaware Connecticut Mississippi Wyoming Virginia Kansas Mew Hampshire Rhode Island West Virginia Vermont
22 www.creativeclass.com - @creative_class
We can begin by dispelling the persistent myth that Michigan is not retaining talent. In truth, the state does very well in retaining the talent it produces. Michigan ranks seventh nationally for its percentage of college and university graduates who stay in the state, behind only California, Texas, Florida, New York, Minnesota, and Washington (see Figure 14).49 And greater Detroit has the highest retention rate of any metro in the country for two- and four-year college grads (see Figure 15).50

The bigger and more challenging issue for the state is talent attraction. Michigan needs to add to its talent base by attracting educated workers from elsewhere. On this score, there is plenty of room for improvement. The state lags badly in attracting college grads from other states. Just 3 percent of Michigan’s college-educated adults moved from other states annually in recent years.51 At the same time, an average of 2 percent of Michigan’s college educated adults moved to a different state.52 Although the net effect is slightly positive, Michigan ranks in the middle of the pack, as 24 states did better than it on this metric (see Figure 16).
Figure 15: Detroit Leads Large Metros in the Retention of College Grads
Note: Includes 2-and 4-year
Note: Includes 2- and 4-year institutions.
Source: Richard Florida, “The U.S. Cities Winning the Battle Against Brain Drain,” CityLab, March 15, 2016. https://www.bloomberg.com/news/articles/2016-03-15/which-u-s-metros-are-best-at-keeping-their-college-grads
Source: Richard Florida, “The U.S. Cities Winning the Battle Against Brain Drain,” CityLab, March 15, 2016.https://www.bloomberg.com/news/articles/2016-03-15/which-u-s-metros-are-best-atkeeping-their-college-grads
Figure 16: How States Stack Up on Net Inflow/Outflow of College Grads
Source: U.S. Census Bureau, American Community Survey. https://data.census.gov/table?q=migration+by+educational+attainment&tid=ACSDT1Y2021.B07009 https://data.census.gov/table?q=migration+by+educational+attainment&tid=ACSDT1Y2021.B07409

THE AGE OF TALENT (CONTINUED)
64% 68% 72% 76% 80% Detroit Houston New York Seattle Atlanta Dallas Riverside, CA Portland, OR Chicago Minneapolis-St. Paul Retention Rate
Figure 15: Detroit Leads Large Metros in the Retention of College Grads
institutions
Florida Arizona Wa shington Nevada Colorad o T exa s South Carolina Idaho Oregon North Carolina Montan a New Hampshir e California Maine Georgia Hawaii Te nnessee Rhode Island Utah Delaware Vi rginia Marylan d Massachusetts Minnesota Michiga n Alabama Pennsylvania Ohio Arkansa s Kentucky New Jersey Connecticut Iowa Indiana New Mexico Wisconsin Missour i Kansas Louisiana South Dakota Oklahom a Nebrask a Ve rmont New Yo rk Illinois Wy oming Mississippi Alask a We st Vi rginia North Dakota % College Educated Adults Who Moved Into State Minus % Who Moved Out, Past 12 Months (A verage 2015 to 2019) -1.5% 0.0% 1.5% 3.0% Figure 16: How States Stack Up on Net Inflow/Outflow of College Grads
U.S. Census Bureau, American Community Survey https://data.census.gov/table?q=migration+by+educational+attainment&tid=ACSDT1Y2021.B07009 https://data.census.gov/table?q=migration+by+educational+attainment&tid=ACSDT1Y2021.B07409 Retention Rate % College Educated Adults Who Moved Into State Minus % Who Moved Out, Past 12 Months (Average 2015 to 2019) 23 www.creativeclass.com - @creative_class
Source:
Worse, just 9 percent of the state’s 26-year-olds moved to Michigan from another state than where they lived when they were 16 years old. On this measure, Michigan ranks dead last in the nation (see Figure 17). And Michigan ranks 48th nationally for net inflows of people ages 16 to 26 (see Figure 18).53 The state is failing to attract—and retain—the quantities of young talent it needs.
And while Michigan does retain a large share of its college grads overall, that is not the case with its most crucial talent. Detroit continues to lose skilled talent in technology and the professions to Los Angeles and the San Francisco Bay Area, New York City, Dallas and Austin, Seattle, Miami and Tampa, Charlotte, and Chicago, according to data on talent flows compiled in LinkedIn’s Economic Graph (see Figure 19).54
Figure 18: Michigan Lags on Net Inflow of Young Adults
Figure 18: Michigan Lags on Net Inflow of Young Adults
Source: Young Adult Migration Data Tables, Center for Economic Studies, U.S. Census Bureau; and Opportunity Insights. https://www.census.gov/programs-surveys/ces/data/public-use-data/young-adult-migration-data-tables.html
Source: Young Adult Migration Data Tables, Center for Economic Studies, U.S. Census Bureau; and Opportunity Insights. https://www.census.gov/programs-surveys/ces/data/public-use-data/young-adult-migration-data-tables.html
Figure 17: Share of 26-Year-Olds That Moved from Another State
Source: Young Adult Migration Data Tables, Center for Economic Studies, U.S. Census Bureau; and Opportunity Insights. https://www.census.gov/programs-surveys/ces/data/public-use-data/ young-adult-migration-data-tables.html
Figure
Figure 19: Metros Gaining Talent from Detroit
Source: LinkedIn, Workforce Report: Detroit, April 6, 2023. https://www.linkedin.com/jobs/blog/ linkedin-workforce-report-april-2023-detroit-mi

THE AGE OF TALENT (CONTINUED)
Michiga n Ohio Pennsylvania California New Jersey Mississippi Wisconsin Louisiana Indiana Illinois Minnesota T exas Alabama Connecticut Kentucky W est Vi rginia Maine Missour i Iowa Arkansas New Yo rk Rhode Island Nebraska Oklahom a Florida Georgia Kansas Te nnessee Massachusetts Marylan d New Hampshir e New Mexico Delaware South Carolina Utah North Carolina South Dakota Vi rginia V ermont W ashington Oregon Arizona Idaho Montan a Hawai i Alaska North Dakota Wy oming Colorad o Nevad a % of People Aged 26 Who Lived in Different State When 16 Y ears Old Figure 17: Share of 26-Year-Olds That Moved from Another State Source: Young Adult Migration Data Tables, Center for Economic Studies, U.S. Census Bureau; and Opportunity Insights. https://www.census.gov/programs-surveys/ces/data/public-use-data/young-adult-migration-data-tables.htm 0% 5% 10% 15% 20% 25% 30% 35% 40% 45% Colorad o North Dakota Nevad a Utah North Carolina Arizona W ashington Hawai i Te nnessee Oregon Alaska South Carolina T exas Oklahom a Georgia Florida Montan a Vi rginia Wy oming Massachusetts Kentucky Marylan d Idaho New Yo rk California Louisiana South Dakota Delaware Missour i Nebraska Alabama Arkansas Minnesota New Mexico W est Vi rginia Indiana Kansas Rhode Island Iowa Illinois Wisconsin Pennsylvania V ermont Ohio Mississippi Maine New Hampshir e Michiga n Connecticut New Jersey Net Inflow of People Between Ages 16 and 26
-20% -15% -10% -5% 0% 5% 10% 15% 20% 0 1234 Los Angeles San Francisco Bay Area Dallas-Fort Worth New York City Austin Seattle Miami-Fort Lauderdale Tampa Bay Charlotte Chicago
19: Metros Gaining Talent from Detroit
LinkedIn, Workforce Report: Detroit, April 6, 2023. https://www.linkedin.com/jobs/blog/linkedin-workforce-report-april-2023-detroit-mi 3.9 3.6 1.35 1.22 0.96 0.9 0.72 0.71 0.61 0.57 Net Migration Rate per 10,000 LinkedIn Members April 2023: Population Loss per 10,000 Workforce Members Detroit % of People Aged 26 Who Lived in Different State When 16 Years Old Net Inflow of People Between Ages 16 and 26 Net Migration Rate per 10,000 LinkedIn Members 24 www.creativeclass.com - @creative_class
Source:
The state also lags in its base of college graduates, which reflects its older population and its history as a manufacturing economy. Less than a third (32 percent) of the state’s adults (ages 25 and older) have bachelor’s degrees, placing it 31st among all 50 states and far off the 40 percent-plus rates of leading states (see Figure 20).

Overall, the state’s talent base is skewed to old economy skills and occupations. This can be seen in the LQs for the state’s major occupational categories (see Figure 21). Michigan’s highest LQs are for architecture and engineering (1.80) and production occupations (1.75). But the state lags in the key occupational categories that are central to its ongoing economic transformation. Its LQs in computer and mathematical (0.83) and life, physical, and social sciences (0.78) are considerably beneath the national average. That said, Michigan does have pockets of computer and mathematical capability. Ann Arbor’s LQ in computer and mathematical occupations is 1.21.
Source:
Source: U.S. Bureau of Labor Statistics, Occupational Employment and Wage Statistics. https://www. bls.gov/oes/current/oes_mi.htm
Figure 20: Share of Adults Who Are College Grads by State
Source: U.S. Census Bureau, American Community Survey. https://data.census.gov/all?q=educational+attainment
THE AGE OF TALENT (CONTINUED)
Figure 21: Michigan’s Leading Occupations
Massachusetts Colorad o V ermont New Jersey Marylan d Connecticut Vi rginia New Hampshir e New Yo rk W ashington Minnesota Illinois Utah Rhode Island Oregon California Maine Delaware Kansas Hawai i North Carolina Montan a Georgia Pennsylvania Nebraska Florida T exas Alaska Wisconsin Arizona Michiga n Missour i North Dakota South Dakota South Carolina Idaho Ohio Iowa Te nnessee New Mexico Wy oming Indiana Oklahom a Nevad a Alabama Kentucky Louisiana Arkansas 0% 10% 20% 30% 40% 50% Figure 20: Share of Adults Who Are College Grads by State Percent Population 25 Y ears and Older wit h Bachelor ’s Degree or Highe r, 2021 0.0 0.4 0.8 1.2 1.6 2.0
Leading Occupations
Figure 21: Michigan’s
Michigan Occupational Location Quotients
Architecture and Engineering Production Healthcare Installation, Maintenance, and Repair Community and Social Service Transportation and Material Moving Office and Administrative Support Sales and Related Occupations Building and Grounds Cleaning Food Preparation Management Healthcare Support Personal Care and Service Business and Financial Operations Construction and Extraction Arts, Media, and Entertainment Computer and Mathematical Education Legal Life, Physical, and Social Science Protective Service Farming, Fishing, and Forestry Michigan Occupational Location Quotients in 2022 Percent Population 25 Years and Older with Bachelor’s Degree or Higher, 2021 25 www.creativeclass.com - @creative_class
U.S. Bureau of Labor Statistics, Occupational Employment and Wage Statistics https://www.bls.gov/oes/current/oes_mi.htm
in 2022
The skew is even more pronounced for leading STEM (science, technology, engineering, and math) occupations.55 While Michigan ranked 10th nationally on the share of its workforce in STEM occupations as of 2021,56 it lags in the most important and fastest growing STEM occupations of the future (see Figure 22). The left side of the chart lists Michigan’s top 10 STEM occupations by LQ. These include mechanical engineering technologists (with an LQ of 7.0), mechanical engineers (LQ of around 4.0), and industrial engineers (LQ of roughly 3.0). All of these occupations are projected to decline or at best to experience modest growth over the next decade. The right side of the chart shows the top 10 STEM occupations by projected employment growth between 2021 and 2031. These include web developers, data scientists, and computer and information research scientists. All of them are now underrepresented in Michigan (with LQs of close to or below 1.0).

Michigan also lags in occupations of critical importance to the transformation of its automotive industry. A recent study by the U.S. Bureau of Labor Statistics lists four key occupations that are central to the design and development of electric vehicles: software developers, electrical engineers, electronics engineers, and chemical engineers.57 Based on comparisons of state-level LQs, Michigan ranked 17th for software developers (out of 49 states with data) and 14th for chemical engineers (out of 46 states). 58 It did better for electronics engineers, ranking fifth nationally, and it ranked highest for electrical engineers, second out of all 50 states. The BLS report also identified occupations important to electric battery manufacturing. Michigan had the 22nd highest LQ (out of 48 states with data) for electrical, electronic, and electromechanical assemblers.
Source: U.S. Bureau of Labor Statistics, Occupational Employment and Wage Statistics. https://www.bls.gov/oes/additional.htm

THE AGE OF TALENT (CONTINUED) Occupation LQ in Michigan, 2022 (shown as bars) 0.00 1.00 2.00 3.00 4.00 5.00 6.00 7.00 8.00 40% 35% 30% 25% 20% 15% 10% -15% 5% 0% -5% -10% Mechanical Engineering T echnicians Mechanical Engineers Industrial Engineers Industrial Engineering Te chnicians Architectural and Engineering Managers Engineers, All Othe r Environmental Engineers Electrical Engineers Mechanical Drafters Animal Scientists Data Scientists Information Security Analyst s Statisticians We b Developers Software Developers Epidemiologists Operations Research Analyst s Computer / Information Scientists Actuaries Software Quality Analysts & T esters Projected U.S. Employment Change 2021-2031 (shown as solid squares) Figure 22: How Michigan Stacks Up in STEM Occupations Source: U.S. Bureau of Labor Statistics, Occupational Employment and Wage Statistics https://www.bls.gov/oes/additional.htm Top STEM occupations by projected U.S. growth Top STEM occupations by LQ in Michigan
Figure 22: How Michigan Stacks Up in STEM Occupations
Occupation LQ in Michigan, 2022 (shown as
Projected U.S. Employment Change
(shown as solid squares) 26 www.creativeclass.com - @creative_class
bars)
2021-2031
Michigan has a tremendous asset in its higher education system, which spans such institutions as the University of Michigan, Michigan State, Wayne State University, Michigan Technological University, Grand Valley State University, and Central Michigan University, to name just a few. As of 2021, nearly 625,000 students were enrolled in colleges and universities in the state, placing it 12th of the 50 states. That year, the state awarded roughly 125,000 degrees and certificates—8,500 or so of which were in engineering, seventh highest of all the states. And Michigan granted nearly 60,000 bachelor’s degrees, 11th highest in the nation.59
The talent-generating capacity of the state’s three leading research universities—the University of Michigan, Michigan State, and Wayne State University, which comprise the University Research Corridor—stand out when comparing them to other leading university clusters. With over 150,000 students enrolled— nearly 110,000 undergraduates and almost 45,000 graduate students—the University Research Corridor turns out more talent than world-class clusters like Harvard, MIT, and Boston University in the greater Boston area; Stanford, University of California-Berkeley, and the University of California-San Francis-
co in the San Francisco Bay Area; UCLA, USC, and the University of California-San Diego in Southern California; and Duke, the University of North Carolina-Chapel Hill, and North Carolina State University in North Carolina’s Research Triangle. The University Research Corridor also tops peer clusters in the production of talent for the advanced mobility industry, generating 15,000 graduates per year in the fields of greatest relevance to it. 60 Yet, despite the relatively large numbers of students in its colleges and universities, the growth rate for postsecondary degrees and certificates in Michigan is well below national trends (see Figure 23). The number of degrees and certificates granted in Michigan grew at a rate of 10 percent between 2002 and 2021 (from 113,000 to roughly 125,000). Over the same period, the growth rate for the nation was 60 percent (from 3.3 million to 5.2 million).
There are also troubling gaps in the key categories of talent that Michigan needs the most to enable its transformation. The state lags the nation in its growth in computer-related degrees and certificates, 17 percent between 2002 and 2021 versus 47 percent for the nation (see Figure 24). 61

Figure 23: Growth in Degrees and Certificates: Michigan vs. the United States, 2002–2021
Source: U.S. Department of Education, National Center for Education Statistics (IPEDS). https://nces. ed.gov/ipeds/trendgenerator/
Figure 24: Growth in Computer-Related Degrees and Certificates: Michigan vs. the U.S., 2002-2021
Source: U.S. Department of Education, National Center for Education Statistics (IPEDS). https://nces.ed.gov/ipeds/trendgenerator
Source: U.S. Department of Education, National Center for Education Statistics (IPEDS). https://nces.ed.gov/ ipeds/trendgenerator
(CONTINUED) 2003 2005 2007 2009 2011 2013 2015 2017 2019 -50% -40% -30% -20% -10% 0% 10% 20% 30% 40% 50% 60% 70% U.S. growth relative to 2002-2003 Michigan growth relative to 2002-2003 % Change in Number of Degrees and Certificates in Computer an d Information Sciences, Relative to 2002-2003
THE AGE OF TALENT
Figure 24: Growth in Computer-Related Degrees and Certificates: Michigan vs. the U.S., 2002–2021
2003 2005 2007 2009 2011 2013 2015 2017 2019 0% 10% 20% 30% 40% 50% 60% 70% U.S. growth relative to 2002-2003 Michigan growth relative to 2002-2003 % Change in Number of Degrees and Certificates Aw arded at Postsecondary institutions, Relative to 2002-2003 Figure 23: Growth in Degrees and Certificates: Michigan vs. the United States, 2002-2021 Source: U.S. Department of Education,
Center for Education Statistics (IPEDS).
National
https://nces.ed.gov/ipeds/trendgenerator
% Change in Number of Degrees and Certificates Awarded at Postsecondary institutions, Relative to 2002-2003 % Change in Number of Degrees and Certificates in Computer and Information Sciences, Relative to 2002-2003 27 www.creativeclass.com - @creative_class
And while Michigan does well in talent retention overall, too much of the most crucial talent it generates leaves the state.62 For instance, just onethird of University of Michigan undergraduates are working in Michigan five years after graduation (see Figure 25).63 Similarly, only 28 percent of the University of Michigan’s four-year graduates in mathematics and statistics and 36 percent of those in engineering are working in Michigan five years after graduating. An even smaller percentage of four-year graduates in computer-related majors (25 percent) are working in the state five years after graduation. Indeed, a significantly larger percentage (36 percent) of them are working on the West Coast.64
Part of the problem is that places like Silicon Valley have much larger hightech clusters and thus more job opportunities. But Michigan also offers significantly less in terms of wages and salaries. Michigan ranked 19th (out of 46 states with data) in annual average wages for computer programmers ($94,500) in 2022, while Detroit ranked 67th ($97,510) out of about 250 U.S. metros, with Ann Arbor 74th ($96,320), Flint 81st ($95,900), Saginaw 117th ($90,450), Lansing-East Lansing 118th ($90,430), and Grand Rapids 128th ($89,920).65 This compares to $149,080 for Boulder (ranked first), $146,900 for San Jose (second), and $134,960 in San Francisco (third).
To make up for these shortfalls, Michigan must do more to attract and retain foreign-born talent, especially foreign students who have chosen to study at its major universities. A huge body of research shows that immigrants are significantly overrepresented in the U.S. fields of science, research, technology, and startups.66 While the foreign-born share of the U.S. population is less than 15 percent, immigrants account for nearly two-thirds of all Nobel Prizes given for U.S.-based research, make up 40 percent of the country’s software engineers, and comprise nearly a quarter of the nation’s science and technology workforce. In 2021, 44 percent of foreign-born adults in Michigan had at least a four-year college degree, versus 32 percent of Michiganders overall.67
But as critical as young high-tech grads may be for Michigan’s economic transformation, the state needs a talent strategy that is inclusive across the entire demographic spectrum. Michigan lags on its engagement of women and minorities in knowledge, professional, and creative fields. It ranks 39th on its share of Black talent, just over 26 percent of whom are in management, business, science, and arts occupations, compared to 32 percent for the nation as a whole. The state ranks 40th on its share of women in these same occupations, 42 percent compared to 45 percent for the nation.68 Greater and more proactive efforts are required here to attract and retain women and minorities in key professional fields.
In addition, while high-end engineering and management talent is key to Michigan’s transformation, it is far from sufficient. Michigan needs talent across the full spectrum of skills—from the shopfloor to the digital cloud—to staff its existing production facilities and the new ones that will be coming online. Since the U.S. is basically a full-employment economy, that means pulling untapped talent off the proverbial sidelines and into the labor force by, among other things, providing childcare and better transportation.69
THE AGE OF TALENT (CONTINUED)
Figure
University
Michigan Graduates
in Michigan
Source: U.S. Census Bureau, Postsecondary Employment Outcomes. https://lehd.ces.census.gov/data/ pseo_experimental.html 0% 10% 20% 30% 40% 50% 60% 70% Health Professions Education Liberal Arts & Sciences Biological & Biomedical Sciences Area, Ethnic, & Gender Studies Recreation & Fitness Natural Resources & Conservation Psychology Physical Sciences Foreign Languages Architecture Engineering English Language History Multi/Interdisciplinary Studies Mathematics & Statistics Social Sciences Philosophy & Religious Studies Visual & Performing Arts Computer & Information Sciences Communication & Journalism Public Administration Business All Programs Figure 25: University of Michigan Graduates Working in Michigan Five Years after Graduation Source: U.S. Census Bureau, Postsecondary Employment Outcomes. https://lehd.ces.census.gov/data/pseo_experimental.htm % of University of Michigan BA/BS Grads Who Work in Michigan 5 Years After Graduation % of University of Michigan BA/BS Grads Who Work in Michigan 5 Years After Graduation 28 www.creativeclass.com - @creative_class
25:
of
Working
Five Years after Graduation
The state and its communities have already launched impressive initiatives on these fronts, of which the following are just some examples:
■ Michigan set an ambitious goal of “Sixty by 30,” which aims to have at least 60 percent of its adults holding skill certificates or college degrees by 2030.70
■ The state has invested $10 million in the Michigan Economic Opportunity Fund, which supports the endeavors of women and entrepreneurs of color.71
■ The Michigan Achievement Scholarship lowers the cost of education for students attending community colleges and public and private universities. 72
■ To help non-traditional students increase their skills, the Michigan Reconnect program gives free or reduced community college tuition to Michigan residents aged 25 and older who do not already have degrees.

■ The pioneering Kalamazoo Promise provides full tuition scholarships to Michigan’s public colleges or universities to graduates of the Kalamazoo public school system.73
■ The Wayne State Guarantee offers free tuition to children from families with incomes of less than $70,000.
■ The University of Michigan’s Go Blue Guarantee provides full tuition scholarships to Michigan students with family incomes of $65,000 or less and assets below $50,000.
■ The Electric Vehicle Jobs Academy is a collaborative effort of employers, workers, educational institutions, and other industry stakeholders to provide education and training related to automotive mobility and electrification.74
■ Digital Lakes is an effort of leading CIOs and human resources executives to attract talent to digital fields through internships and by bolstering the talent ecosystem.75

■ The Talent Action Team is a $30 million-plus partnership of public universities, community colleges, and 15 of Michigan’s largest corporations to bolster the talent pipeline in key technology fields such as semiconductors and electric vehicle technologies.76 Its activities run the gamut from providing scholarships to engineering and computer science graduates who work for in-state companies, partnering with higher education institutions to create and scale programs to retain high value jobs, and investing in initiatives to improve labor force participation in crucial production occupations.
These programs and initiatives are impressive and encouraging. But even more will need to be done to increase the state’s workforce and generate more inclusive economic development across race and class lines.
THE AGE OF TALENT (CONTINUED) 29 www.creativeclass.com - @creative_class
COLLEGE TOWNS AND TECH TALENT
Michigan’s college towns will be key to the state’s efforts to attract and retain talent. Simply put, Michigan cannot fulfill its potential unless its college towns change from places that simply educate students to full contributors to the state’s technological and economic transformation. In other words, they must become tech hubs and talent magnets in their own right. The state has many attractive college towns of various shapes and sizes, but the two that stand out the most are Ann Arbor, home of the University of Michigan, and East Lansing with Michigan State.
Young tech grads prefer startups over established companies because of the flexibility and excitement they offer. And they are attracted to college towns like Austin, Palo Alto, Cambridge, and Boulder—places where startups cluster—because they are smaller, less daunting, and in many cases more affordable than big cities like New York and San Francisco. Often, they find jobs or start companies in the same cities where they went to college. Kalamazoo’s Bell’s Brewery, to name just one low-tech example, was founded by Larry Bell, who started brewing beer when he was a student at Kalamazoo College.77
Twenty years ago, when I was writing Rise of the Creative Class, the most favored destination for Carnegie Mellon computer science and engineering grads was neither San Francisco nor New York City but Austin, because as a smaller metro with a large student population, it was an easier place for newly graduated techies to navigate and fit into. In addition to being relatively affordable, it boasted a worldclass music and bar scene (hence its famous slogan, “Keep Austin Weird”).
30 www.creativeclass.com - @creative_class
Since then, Austin has experienced one of the fastest growth rates in the country. Some of that is because Michael Dell, a student at the University of Texas at Austin, liked the town so much he founded his eponymous company there. But the city also owes much of its success to a deliberate strategy to focus on bolstering its innovation and startup ecosystems, starting in the late 1970s with the creation of the IC2 Institute by the legendary tech entrepreneur George Kozmetsky, and continuing in the 1980s with successful efforts to land major federal research and tech transfer institutions, including MCC and SEMATECH. Another factor is the great success local business and political leaders have had in attracting offices and branch facilities for leading Silicon Valley corporations.78
Austin’s approach was premised on strategies employed by even more influential college towns. Earlier in these pages, we read about how Boston created American Research and Development (ARD) to help reset the region around high technology. Around the same time, Stanford University formed its legendary Research Park, the original hub of Silicon Valley, under the leadership of Frederick Terman, its transformative engineering dean and later provost, whose students included William Hewlett and David Packard of HP.79
For Michigan to become a leading tech talent hub, Ann Arbor and East Lansing will need to undergo similar transformations. The next two charts provide some perspective. The first compares population growth in Ann Arbor and Austin over the last half century. The second compares the growth in total personal income in the two metros over the same period.

Figure 26: Growth in Total Population: Ann Arbor vs. Austin, 1969-2021
Source: U.S. Bureau of Economic Analysis, CAINC1 County and MSA Personal Income Summary. https://www.bea.gov/data/income-saving/personal-income-county-metro-and-other-areas
Figure 26: Growth in Population: Ann Arbor vs. Austin, 1969–2021
Source: U.S. Bureau of Economic Analysis, CAINC1 County and MSA Personal Income Summary. https:// www.bea.gov/data/income-saving/personal-income-county-metro-and-other-areas
0 500,000 1,000,000 1,500,000 2,000,000 2,500,000 1969 1975 1981 1987 1991 1997 2003 2009 2015 2021
Population Size of Metropolitan Area Austin Ann Arbor
COLLEGE TOWNS AND TECH TALENT (CONTINUED) Population Size of Metropolitan Area 31 www.creativeclass.com - @creative_class
Austin’s metro population grew from about 400,000 in 1970 to more than a million by the mid-1990s, to 1.5 million by the early 2000s, and nearly 2.5 million today, a growth rate of 485 percent (see Figure 26). Over the same period, Ann Arbor’s population grew from about 230,000 to 370,000, a growth rate of 58 percent. 80 As for total personal income growth, Austin went from 22 percent more than Ann Arbor in 1969 to over six times more in 2021, growing from $9.5 billion to $168 billion, a growth rate of 1,666 percent, while total personal income in Ann Arbor grew from $7.8 billion to $25.4 billion, a growth rate of 226 percent (see Figure 27). 81 For Michigan to successfully navigate its economic inflection, Ann Arbor and East Lansing must become full-blown tech and talent hubs.
This is not to say that Michigan’s college towns are its only talent magnets or that they can somehow supplant or replace the role of its larger cities. When college towns work to drive innovation and economic development, they do it in combination with bigger cities and metro areas. Palo Alto is part of a broader innovation ecosystem that spans San Jose, San Francisco, and Oakland. Cambridge works together with Boston, Boulder does the same with Denver, and Austin does so with Dallas and other Texas cities. Similarly, as Ann Arbor and East Lansing scale into tech/talent hubs, they will help to strengthen Detroit and Michigan’s other cities and the state as a whole.
This vision applies as well to the many other college towns in the state, all of which can benefit from better alignment of college and community. These include greater Grand Rapids with Grand Valley State University, Calvin College, Kuyper College, Aquinas College, and others; Kalamazoo with Western Michigan University; Mount Pleasant with Central Michigan University; Marquette with Northern Michigan University; Houghton with Michigan Technological University; Traverse City with Northwestern Michigan College; Sault Ste. Marie with Lake Superior State University; Flint with Kettering University and the University of Michigan-Flint; Hillsdale with Hillsdale College; Albion with Albion College; not to mention Detroit with Wayne State University, Detroit Mercy, and the Detroit Center for Innovation that is being developed downtown with the University of Michigan.


The growth of these college towns will have a positive effect on the rest of the state, for as young talent matures, they often look for different kinds of places to live. Think of it as a geographic division of labor, where people seek out different kinds of communities depending on their age, lifestyle, and family situations. Fortunately, Michigan has a large and varied enough portfolio of communities to appeal to all of them. Those who thrive amid the hustle and bustle of big cities will be attracted to Detroit, whose downtown has enjoyed a substantial revival over the last decade.82 As others settle down and form families, they will seek out the good schools, leafy streets, and affordable houses that the state’s many suburbs offer. And, of course, the state has wonderful rural communities and waterfront locations.
27: Growth in Total Personal Income: Ann Arbor vs. Austin, 1969–2021
Source: U.S. Bureau of Economic Analysis, CAINC1 County and MSA Personal Income Summary. https://www.bea.gov/data/income-saving/personal-income-county-metro-and-other-areas
COLLEGE TOWNS AND TECH TALENT (CONTINUED) 0 $20B $40B $60B $80B $100B $120B $140B $160B $180B 1969 1975 1981 1987 1991 1997 2003 2009 2015 2021 Total personal income of metropolitan area, adjusted to 2021 dollars Austin Ann Arbor Figure
Total personal income of metropolitan area, adjusted to 2021 dollars 32 www.creativeclass.com - @creative_class
A STRATEGY FOR MICHIGAN’S FUTURE
Michigan stands at a critical inflection point. For better or for worse, the transformation and disruption of the automotive and broader mobility sectors through digital technology, robotics, and electrification will be as pivotal to the future of the state as the rise of the internal combustion engine and the mass production assembly line were a century and more ago. Michigan already has many of the assets and capabilities it needs to navigate this transformation and reset its growth, and it will benefit from the sweeping initiatives coming out of Washington to reshore critical industries and technologies, rebuild the Midwest and the industrial heartland, and upgrade and restructure major portions of the economy.
But time is of the essence; the window of opportunity is now. Unless bold and decisive actions are taken, the state will be left behind. The speed and scale of change needed requires an effort that is unlike anything state government or traditional economic development agencies have ever seen. They will have to find new ways to fuse university research, corporate R&D, and startup innovation; create better mechanisms for developing, attracting, and retaining talent; and align essential investments in placemaking and connective infrastructure. Navigating this transformation will require rapid and agile action across government agencies and the private and civic sectors.
Governor Whitmer’s MI New Economy initiative lays essential groundwork here with its plans for growing the middle class, supporting small business, and building strong communities. 83 Business Leaders for Michigan also recognizes the need for such a shift with its call for a new economic development framework focused on innovation/entrepreneurship, talent, place, competitive incentives, and customer service.84 But the challenges facing the state cut across government agencies, functions, and levels and go far beyond what we traditionally think of as economic development.
To position the state to succeed and prosper in this great economic inflection, we propose the creation of a Michigan Economic Transformation Alliance. This should be organized as a blue-chip, multi-sector panel spanning relevant cabinet and departmental agencies and including leaders from the state’s business, startup, higher education, labor, and civic communities, as well as other relevant stakeholders. It would respect the needs of the state’s different regions, working to marshal state resources and support for regional and local efforts and partnerships, while also competing for and leveraging federal dollars. And given the urgency and importance of this time, the alliance should be contained within Governor Whitmer’s MI New Economy initiative.
The work of this new statewide alliance would be organized around three key pillars:
TRANSFORMATIONAL TECHNOLOGY
Use advanced technology to develop innovative new businesses and transform existing ones, especially in the automotive and transportation sectors, the state’s largest and most important industries.
MICHIGAN’S FUTURE TURNS ON TALENT
Develop and deploy cutting-edge initiatives to create, attract, and retain talent.

THE PLACEMAKING ADVANTAGE
Key to this effort to attract and retain talent and build more vibrant tech hubs is placemaking—creating communities of all types and sizes where talented people from different backgrounds will want to live.
33 www.creativeclass.com - @creative_class
Transformational Technology


Innovation and technology are the most significant drivers of growth, productivity, and rising living standards in today’s economy. This is even more the case in Michigan than in most other states, as its largest and most important industry is poised on the brink of a massive technological transformation. Software, artificial intelligence, connectivity, electric power plants, battery technology, and more, all stand to disrupt the ways that vehicles are manufactured, marketed, sold, maintained, and driven. If Michigan seizes the opportunity to further develop and adapt these technologies, using them to reinvigorate its incumbent businesses and create innovative new ones, it will retain its status as the global center of automotive R&D and management. But to do that, it must attract and retain far more computer, software, electrical engineering, and related digital talent than it does.
The stakes are existential. When it comes to factories and battery plants, Michigan faces stiff competition from foreign producers and right-to-work states in the Sunbelt. The best opportunities for growth lie upstream in more knowledge-intensive, higher-pay, higher-skill jobs in everything from research, development, and design to advanced manufacturing jobs on factory floors.
With its world-class universities and leading-edge industries, Michigan has incredible assets to build on. But it faces enormous challenges from domestic and foreign competitors, who are investing massively in the technologies of the future. Up until now, the state has underperformed when it comes to turning its industry and university R&D into high-tech startups. The state’s political, business, and academic leadership must focus both on developing its innovation and startup ecosystems and on bolstering technology transfer and commercialization from its major universities.
A STRATEGY FOR MICHIGAN’S FUTURE (CONTINUED)
34 www.creativeclass.com - @creative_class
This entails much more than increasing venture capital funding. Venture capital flows to “good deals,” meaning companies with innovative technology developed by capable management and tech talent. Much can be done to ensure that the state and its communities— especially its research universities and college towns—will be the source of more good deals going forward. A key missing ingredient is often seasoned management talent, the so-called “serial entrepreneurs” who build and steward great startup companies. There are various ways to build up or supplement this capability. One way is to partner startups with successful entrepreneurial talent from other industries and fields. Another is to focus on recruiting such talent from other regions, particularly those who originally hailed from Michigan or attended its schools.
The Creative Destruction Lab (CDL) was launched at the University of Toronto to do just this by organizing panels of successful entrepreneurs, technologists, and venture capitalists to screen and assist budding startups (it now operates hubs in Berlin, Paris, Oxford, Seattle, Atlanta, Vancouver, and more, as well as in Toronto).85 Michigan’s leading research universities can play a similar role by maximizing their technology transfer and commercialization efforts; providing incentives for faculty, research staff, and students to form or participate in startups; acting to create mechanisms to supplement startups with management talent; and working closely with local companies and startups, venture capitalists, and community leaders to build up their surrounding startup ecosystems.
A good model to learn from and build upon is the Grand Rapids Tech Strategy. Led by the region’s economic development organization in partnership with leading business and community leaders, entrepreneurs, educators, and stakeholders, its goal is to bolster Grand Rapids as a tech/talent hub and create 20,000 new technology jobs. To do so, it charts an ambitious strategy for technology- and talent-based economic development by strengthening the startup ecosystem, expanding broadband access, supporting incubators and accelerators, working to generate, retain, and attract talent, and better aligning education and training initiatives to business needs and priorities, from K–12 through higher education.86
Few places in the country can match the university R&D and commercial innovation assets of Detroit, Ann Arbor, and East Lansing. It makes sense to organize them in an innovation corridor. The speed of movement or velocity of flow of knowledge, talent, and ideas is a key factor in the success of innovation clusters. The corridor would benefit from greater connectivity in the form of faster rail and transit connections that could shrink both the real and “time” distance between them. This innovation corridor should have a global dimension as well. Detroit’s international airport is a huge asset in the global circulation of people and ideas, which is essential for success in the knowledge economy.87 The corridor also abuts Windsor, Canada, one of the largest border crossings in North America and a key route for cross-border flows of goods. In fact, the U.S. and Canada recently announced a new binational electric vehicle corridor that would stretch 872 miles from Kalamazoo and Detroit across the border through Windsor to Toronto and ultimately to Quebec City.88 The global innovation corridor we envision could leverage and build upon the Detroit-Windsor joint submission for Amazon HQ2, which showed the power that such a cross-border approach for technology and talent could unleash.89
New federal programs that combine innovation and technology with placemaking, such as the Build Back Better and Regional Innovation Hubs initiatives, can act as catalysts for new partnerships, collaborations, and initiatives and help leverage state and local funding.90 For example, in September 2022, a partnership of organizations, including the Detroit Regional Partnership, the University of Michigan, Tech Town, Southeast Michigan Community Alliance, and the Michigan Office of Future Mobility and Electrification secured a $52 million federal Build Back Better grant for advanced mobility technology. 91 But organizing and competing for these federal initiatives is about more than just securing dollars. These programs can help spur state and local political, higher education, business, and economic development leaders to better organize their own efforts, forge new partnerships, and focus on creating more fully formed innovation and entrepreneurial ecosystems.
Michigan has a wide range of communities with different capabilities and needs. The state can most effectively use its resources by partnering with them, as they understand their own challenges and opportunities best. A good model here is Pennsylvania’s Ben Franklin Innovation program, which channeled funding into four distinct regions of the state.92
A STRATEGY FOR MICHIGAN’S FUTURE (CONTINUED) 35 www.creativeclass.com - @creative_class
The even bigger and more pressing technological challenge is to apply advanced technology to upgrade and transform Michigan’s existing industries. The state is still the global center for automotive production, design, technology, and R&D. But as we have seen, it needs to evolve from the analog, mechanical, and fossil-fuel technologies of the past to the digital, connected, assisted-driving, and electric vehicle technologies of the future.
Numerous efforts to accelerate this transformation are already under way, funded by the private sector, universities, and the government, and as partnerships among all three. Detroit’s Michigan Central Station project, as we have seen, will provide a state-of-the-art hub for automotive and mobility technology that will enable the region to compete for the best talent in the world. The MI Future Mobility Plan will spur the state’s repositioning from automobiles to the broader mobility sector through investments in workforce development and R&D in electrification and related technologies; physical infrastructure such as charging stations; and initiatives to attract venture capital to startups in these fields.93 The big challenge for the state is how to best align its many assets—its extensive manufacturing and supplier base, its leading-edge corporate R&D, its startup ecosystems, and its world-class university research—to the ongoing economic and technological transformation of its leading industries.
While Michigan should continue to compete for new manufacturing facilities in the electric vehicle space, it must direct its investments to the technologies and facilities of the future as opposed to the past. Costs and benefits should be weighed carefully to ensure that the state is not expending more dollars on incentives than they are likely to see in increased wages, taxes, and long-term growth. More to the point, it must use its recruitment dollars strategically, focusing on projects that bolster its competitive position the best.

A STRATEGY FOR MICHIGAN’S FUTURE (CONTINUED) 36 www.creativeclass.com - @creative_class
Michigan’s Future Turns on Talent
Talent is the most important factor of production in today’s economy. Michigan must continue its efforts to deepen, attract, and retain talent across all facets of the workforce, from software development and artificial intelligence to production on the shop floor. As we have seen, Michigan retains a lot of the talent that graduates from its two- and four-year higher education institutions. But at the same time, it is losing too much of the high-end software and computing talent it produces to other regions of the country. Michigan can learn from initiatives like Campus Philly, an on-line effort to engage and retain talent from Philadelphia-area colleges and universities.94 And it can do more to capture boomerang talent who moved away after college but may be looking for a more affordable place to raise their children. Colleges do a good job of tracking alumni for donations. They and the state as a whole can benefit from creating broader and more enduring relationships with alumni, including helping them with career placement in the state.
Immigrants are a critical source of technology talent, and Michigan needs to do all it can to attract and retain them, many of whom attend its great universities. To paraphrase the Silicon Valley venture capitalist John Doerr, it should figuratively staple visas or green cards to the diplomas of every foreign-born student it graduates by finding them employment in the state.95


Michigan’s talent shortage is not just in the areas of high-end engineering, computer science, and management. As the national economy nears full employment, Michigan needs to capture talent at every level. This means providing training and job pathways to bring displaced workers—including women, disadvantaged groups from urban and rural areas, and even retirees—back into the workforce.
The state and its communities are already undertaking many ambitious initiatives on this front, as we have seen. But they can do more to increase the participation of workers from disadvantaged communities. One promising approach is the creation of neighborhood employment hubs in disadvantaged areas, as outlined by economist Timothy Bartik of Michigan’s Upjohn Institute. These would provide a full suite of services to upgrade skills, match workers to jobs, and increase workforce participation, while helping to combat economic, racial, and geographic inequality.96 Michigan cannot afford to waste any of its precious talent.
A STRATEGY FOR MICHIGAN’S FUTURE (CONTINUED) 37 www.creativeclass.com - @creative_class
The Placemaking Advantage
Michigan must put placemaking at the very forefront of its economic development strategy.97 In doing so, it should remember that place is not a one-size-fits-all proposition. Different types of people wish to live in different types of places at different stages of their lives, and Michigan is blessed with a wide variety of places. Detroit is a revitalizing urban center that has captured the imagination of the nation with its unique makerspaces, restaurants, galleries, performance spaces, and other urban amenities. Grand Rapids is leveraging its waterfront, historic architecture and neighborhoods, and creative and food scenes to reinforce its ambitions as a tech/talent hub. Its Art Prize, a globally acclaimed art competition and festival, is bolstering its growing arts and creative scenes. With Grand Valley State University, it is leveraging its capability as a college town. And the home improvement television show The Established Home, which showcases Grand Rapids’ abundant stock of historic homes and vibrant neighborhoods, is growing its brand as a community that offers affordable quality of place. Michigan also has a number of walkable suburbs, such as Birmingham, Ferndale, and Royal Oak, which offer a wide mix of good public and private schools and affordable housing. In addition, the state has an abundance of quirky college towns, verdant rural areas, and stunning lakefront communities.
Smaller communities across the state are charting pioneering strategies for combining placemaking with economic development. Marquette’s Outdoor Venture Innovation Center works with entrepreneurs to apply technology to recreation and leisure.98 Traverse City has been cited by the Brookings Institution as a model for using placemaking to attract remote workers.99 Its Creative Coast initiative targets remote workers and entrepreneurial startups who are drawn to its waterfront, natural amenities, outdoor recreation, food scene, wineries, cultural offerings, and overall quality of life.100 The state’s Revitalization and Placemaking Program, or so-called RAP 2.0 Program, provides $100 million in funding to rehab vacant buildings, invest in public spaces, and otherwise revitalize downtowns and neighborhoods that were hard hit by the pandemic.101
A STRATEGY FOR MICHIGAN’S FUTURE (CONTINUED) 38 www.creativeclass.com - @creative_class
Michigan should bolster these efforts and undertake new ones to ensure that it has a full range of vibrant, inclusive, and sustainable communities that are great places to live, work, and raise families. This means working alongside its communities to invest in denser, more walkable neighborhoods and transform lagging downtown commercial districts and neighborhood corridors into vibrant livework neighborhoods. A good idea for doing so is the $500 million Neighborhood Talent Concentration Initiative proposed by Lou Glazer of Michigan Future Inc., which would invest in 20 transformational projects across the state to build more rail and bus rapid transit, develop mixed-income housing, and create mixed-use districts around amenities like parks, open spaces, greenways, and outdoor recreation.102
Michigan’s cold winters make it that much harder for the state to compete with the Sunbelt. But climate scientists say that the state’s relative attractiveness as a place to live and work may improve in the future due to the deleterious effects of climate change on warmer, more vulnerable places.
Michigan’s college towns are an incredible economic development asset. College towns such as Palo Alto, Cambridge, Austin, Boulder, and the North Carolina Research Triangle are key anchors of startup and innovation ecosystems, and they are precisely the kinds of places where young graduates in computing, software, artificial intelligence, and related technology fields want to live. Ann Arbor and East Lansing can and should play an analogous role in Michigan, developing the industry and related capabilities that they need to retain larger shares of their graduates in key technology fields and attract graduates from other places. To do this, they will have to grow while developing tighter linkages and connections to large cities like Detroit and other communities across the state. On this front, the state must make it a priority to improve connectivity, whether via rail or other forms of transit, between its college towns and cities.
Right now, Michigan enjoys an affordability advantage. Housing prices and rents remain such that working- and middle-class families can enjoy a relatively high quality of life. But Michigan is not immune to housing inflation. Perhaps the biggest impact of the pandemic has been to spread the housing affordability crisis from superstar cities like New York and San Francisco to aspiring tech hubs like Austin, Nashville, and Miami, the last of which now ranks as the least affordable city in the nation.103 Economic success by its very nature brings with it increased housing prices. As it works to bolster its technology- and talent-based economic growth, Michigan must also undertake proactive efforts to preserve its affordable quality of life.
These three pillars—Technology, Talent, and Placemaking—are all of a piece. Each one builds upon and reinforces the others, while lending additional structure, logic, and strength to the many important initiatives already underway in the state.

By moving forward on this agenda, Michigan can create a stronger and more sustainable 21st century economy—one that generates opportunities for residents across all of its many and varied communities. In doing so, it can forge a new model of inclusive growth for the nation and the world.
A STRATEGY FOR MICHIGAN’S FUTURE (CONTINUED) 39 www.creativeclass.com - @creative_class
RESEARCH, DATA, AND METHODOLOGY

This report is based on a combination of quantitative and qualitative analysis. In structuring the project and conducting the analysis, we reviewed and built upon a wide range of research and studies on Michigan’s economy, its industrial strengths and weaknesses, its talent base, and more. We analyzed quantitative data on Michigan’s population, employment, and income trends; its industrial and occupational structure, research and development, innovativeness, startups and venture capital investment; talent attraction and retention, college enrollments and graduates; and more. We conducted interviews with leaders from business, technology, startup, academic, civic, and related communities across the state and beyond to provide deeper insight into opportunities and obstacles.
Quantitative Data Analysis
We developed and analyzed the following key data and indicators, comparing Michigan and/or its major metropolitan areas to other states and metropolitan areas and to the United States as a whole. We used data up to the most current year available (in most cases for 2021 or 2022). Some of the indicators are used to compare places at a single point in time, while other indicators are used to look at trends that occur over decades. These trend analyses sometimes cover different periods because of the indicators being examined and also because of data availability. Some of the indicators and variables are tracked by different sources and data series, such as the data for employment. And some of the data used in the report are subject to future updates and could change based on these updates.
■ Knowledge versus Manufacturing Sector Growth: Data span the 1930s to the present. Source: Current Employment Statistics, U.S. Bureau of Labor Statistics. https://www.bls.gov/data/home.htm
■ Population: Data span the late 1920s to the present. Source: SAINC1 State annual personal income summary, U.S. Bureau of Economic Analysis. https://www.bea.gov/data/income-saving/personal-income-by-state
■ Employment/Jobs: Data span the late 1950s to the present. Source: Current Employment Statistics, U.S. Bureau of Labor Statistics. https://www. bls.gov/data/home.htm
■ Income: Data span the late 1920s to the present. Source: SAINC1 State annual personal income summary, U.S. Bureau of Economic Analysis. https://www.bea.gov/data/income-saving/personal-income-by-state
■ Employment Growth for Selected Industries: Data span 2009 to the present. Source: Current Employment Statistics, U.S. Bureau of Labor Statistics. https://www.bls.gov/data/home.htm
■ Industry Location Quotients: Data are for 2000 and 2021. Source: SAEMP25N Total full-time and part-time employment by NAICS industry, U.S. Bureau of Economic Analysis. https://www.bea.gov/data/employment/ employment-by-state
■ Corporate R&D: Data are from 2019. Source: National Center for Science and Engineering Statistics (NCSES), 2020. Business Enterprise Research and Development: 2019. NSF 22-329. Alexandria, VA: National Science Foundation. https://ncses.nsf.gov/pubs/nsf22329
■ University R&D: Data are from 2021. Source: National Center for Science and Engineering Statistics (NCSES), 2022. Higher Education Research and Development: Fiscal Year 2021. NSF 23-304. Alexandria, VA: National Science Foundation, December 15, 2022. https://ncses.nsf.gov/pubs/ nsf23304
■ Patents: Data are for 2020. Source: Patent Technology Monitoring Team, U.S. Patent and Trademark Office. https://www.uspto.gov/web/offices/ ac/ido/oeip/taf/st_co_20.htm
■ Venture Capital: Data span 2006 to the present. Source: PitchBook-NVCA Venture Monitor. https://pitchbook.com/news/reports/q1-2023-pitchbook-nvca-venture-monitor
■ College Graduates: Data are for inflows and outflows of graduates from 2015 to 2019. Source: American Community Survey, U.S. Census Bureau. https://data.census.gov/table?q=migration+by+educational+attainment&tid=ACSDT1Y2021.B07409
40 www.creativeclass.com - @creative_class
■ Young Adult Migration: Based on the movement of people between the ages of 16 and 26, as compiled by Opportunity Insights and Policy Impacts. Source: Young Adult Migration Data Tables, Center for Economic Studies, U.S. Census Bureau; and Opportunity Insights. https://www.census.gov/ programs-surveys/ces/data/public-use-data/young-adult-migration-data-tables.html
■ College Attainment: Based on the share of adults with a four-year college degree or more advanced education. Data are for 2021. Source: American Community Survey, U.S. Census Bureau. https://data.census.gov/all?q=educational+attainment
■ Occupational Location Quotients: Data are from 2022. Source: Occupational Employment and Wage Statistics, U.S. Bureau of Labor Statistics. https://www.bls.gov/oes/current/oes_mi.htm
■ STEM Occupations: Data are from 2022, and also cover projected employment growth from 2021 to 2031. U.S. Bureau of Labor Statistics. Source: Occupational Employment and Wage Statistics, U.S. Bureau of Labor Statistics. https://www.bls.gov/oes/additional.htm
■ Postsecondary Degrees and Certificates: Data span 2002 to the present. Source: National Center for Education Statistics (IPEDS), U.S. Department of Education. https://nces.ed.gov/ipeds/trendgenerator/
■ Location of University Graduates Post-Graduation: Based on the locations of college graduates five years after graduation. Source: Post-Secondary Employment Outcomes, U.S. Census Bureau. https://lehd.ces.census.gov/ data/pseo_experimental.html
■ Population and Income Growth Ann Arbor versus Austin: Data span the late 1960s to the present. Source: CAINC1 County and MSA personal income summary, U.S. Bureau of Economic Analysis. https://www.bea.gov/data/ income-saving/personal-income-county-metro-and-other-areas
Qualitative Research
We reviewed a wide range of studies and research reports conducted by experts at universities, government agencies, economic development groups, consultants, and think tanks like Michigan Future Inc. and Detroit Future City.104

41 www.creativeclass.com - @creative_class
RESEARCH, DATA, AND METHODOLOGY (CONTINUED)
RESEARCH, DATA, AND METHODOLOGY (CONTINUED)
Interviews Conducted
Interviews were conducted with the following people:
■ Timothy Bartik, Senior Economist, W.E. Upjohn Institute for Employment Research, and Co-Director of Research, Kalamazoo, Michigan
■ Sandy K. Baruah, President & Chief Executive Officer, Detroit Regional Chamber
■ Peter Gajdoš, Partner, Co-Lead, Climate Tech at Fifth Wall, Investor in Our Next Energy

■ Khalilah Burt Gaston, Executive Director, The Song Foundation, Detroit, Michigan
■ Susan Dundon, Director, Young Adults & Working Families, Ralph C. Wilson, Jr. Foundation, Detroit, Michigan
■ Kerry Ebersole Singh, Executive Vice President, Chief Talent Solutions & Engagement Officer, Michigan Economic Development Corporation, East Lansing, Michigan
■ David Egner, President & Chief Executive Officer, Ralph C. Wilson, Jr. Foundation, Detroit, Michigan
■ Lou Glazer, President & Co-Founder, Michigan Future Inc., Ann Arbor, Michigan
■ Tejus Kothari, Managing Director & Partner in Public Sector and Social Impact practices, Boston Consulting Group
■ Spencer Lucker, Director, Strategic Talent Initiatives, Michigan Economic Development Corporation, Detroit, Michigan
■ Claudia Newman-Martin, Partner in Public Sector, Social Impact and Consumer practices, Boston Consulting Group
■ Doug Ross, Senior Advisor for Michigan Prosperity to Governor Whitmer; former Michigan State Senator, Michigan Commerce Director, and U.S. Assistant Secretary of Labor for Employment and Training
■ Josh Sirefman, Chief Executive Officer, Michigan Central Innovation District

■ Ned Staebler, Vice President, Economic Development, Wayne State University; President & Chief Executive Officer, TechTown, Detroit, Michigan.
■ Dug Song, Cofounder, Duo Security Board Member; Co-Founder & President, The Song Foundation; Board Member, National Advisory Council on Innovation and Entrepreneurship, U.S. Economic Development Administration; Executive Board Member, Detroit Regional Chamber, Ann Arbor, Michigan
■ Randy Thelen, President & CEO, The Right Place, Inc., Grand Rapids, Michigan
■ Trista Van Tine, Co-Founder & Executive Director, Michigan Founders Fund, Ann Arbor, Michigan
42 www.creativeclass.com - @creative_class
ACKNOWLEDGMENTS
A project like this turns on the collective intelligence and creativity of a talented team. Thanks are due to the members of the project team: Rana Florida for managing and stewarding all facets of the project, Todd Gabe for research, Arthur Goldwag for editing, Rivvy Neshama and John Wilcockson for copyediting and proofreading, Mark Block for logistic support, and Roman Pietrs for graphics and design.
We are especially grateful to Sandy Baruah and Glenn Stevens for their support of this project. We also thank Rami Fakhoury, Carmen Fakhoury, and Ronia Kruse for their support. We are grateful for the team at MICHauto, particularly Drew Coleman, for assistance with research, interviews, and project management. We thank Britany Affolter-Caine, Sandy Baruah, Rami Fakhoury, Lou Glazer, Ronia Kruse, Tejus Kothari, Claudia Newman-Martin, Doug Ross, Josh Sirefman and his Michigan Central colleagues, Ned Staebler, and Glenn Stevens for helpful comments on the report. And we express our deep appreciation to everyone who took time out of their busy schedules to participate in interviews.
This project is funded by a grant through the State of Michigan’s Mobility Futures Initiative and is part of a partnership to support MICHauto’s High-Tech Talent Strategy to strengthen Michigan’s global competitiveness in the automotive, mobility, and technology industries.

43 www.creativeclass.com - @creative_class
TEAM BACKGROUND AND BIOS
Richard Florida led the research. The founder of the Creative Class Group and a University Professor at the University of Toronto’s Rotman School of Management and School of Cities, he has previously taught at Carnegie Mellon University and has been a visiting professor at Harvard and MIT and a fellow at the Brookings Institution. He is best known as the author of The Rise of the Creative Class and The New Urban Crisis. His earlier work focused on the transformation of the automotive industry and the remaking of the industrial heartland as featured in his books The Breakthrough Illusion and Beyond Mass Production. The co-founder of CityLab, the world’s leading publication for cities and urbanism, he is a strategic advisor to the boards of several leading real estate development firms, venture capital firms, and investment funds.
Rana Florida guided and managed all aspects of the project. As CEO of the Creative Class Group, she has worked with a diverse array of private and public sector clients around the world. She has decades of experience in corporate strategy, communications, and marketing, having directed global strategic communications for HMSHost, the world’s largest provider of retail services for travelers, and having served as Vice President of Communications for Disney on Ice, Disney Live, and Ringling Brothers. Rana holds a BA in communications and an MBA with a double major in marketing and management from Wayne State University. Her book Upgrade: Taking Your Work and Life from Ordinary to Extraordinary was named a “Business Best Seller” by Tattered Cover, the largest independent bookstore retailer in the U.S., and an “Editor’s Pick” for The Globe and Mail.
Todd Gabe is Professor of Economics at the University of Maine. He conducts research on state and local economic development with a focus on the role of occupations and industries in the knowledge economy. Professor Gabe attended Furman University and holds graduate degrees from Ohio State University and the University of Minnesota. He has published articles in the Journal of Economic Geography, Journal of Regional Science, Regional Studies, and Urban Studies, among others, and has completed dozens of technical reports and economic impact studies. Gabe was awarded the University of Maine Presidential Public Service Award in 2004 and the College of Natural Sciences, Forestry and Agriculture Outstanding Public Service Award in 2005.
Arthur Goldwag served as editor for this project. Senior Writer and Editor for the Creative Class Group, he held positions at Random House, The New York Review of Books, and the Book-of-theMonth Club and is the author of several books, including The New Hate and Isms & Ologies.


Mark Block is Director of Events for the Creative Class Group. Block’s senior leadership roles within the U S. Senate and in the corporate sector prepared him for producing large-scale events in the media sector. Block began his career in the Senate in 1990, working in every major position in the Senators’ Capitol Hill Office, culminating in his role as Deputy Chief of Staff for four years. Block joined Newsweek as Director of External Relations in 2003, after receiving his MBA Degree from Johns Hopkins University. At Newsweek, he created the Newsweek Executive Forum concept, which became the standard Q&A event series at the magazine.


REFERENCES
1. See Richard Florida, The Rise of the Creative Class (New York: Basic Books, 2002 and 2019).
2. See Lou Glazer and Donald Grimes, “A New Path to Prosperity? Manufacturing and Knowledge-Based Industries As Drivers of Economic Growth,” Michigan Future, Inc., July 2004. https://www.michiganfuture.org/cms/assets/ uploads/2014/07/Prosperity.pdf; Glazer and Grimes, “Michigan’s Transition to a Knowledge-Based Economy,2007–2014,” Michigan Future, Inc., November 2015. https://michiganfuture.org/cms/assets/uploads/2015/11/ Michigan-Future_2015-Report.pdf
3. See, Eric J. Savitz, “The Car of the Future,” Barron’s, April 24, 2023. https://www.barrons.com/articles/applecarplay-gm-future-car-8542281f
4. Henry Ergas, “Does Technology Policy Matter?” in Technology and Global Industry: Companies and Nations in the World Economy (Washington, D.C.: The National Academies Press, 1987).
5. Richard Florida and Martin Kenney, The Breakthrough Illusion: Corporate America’s Failure to Move from Innovation to Mass Production (New York: Basic Books, 1990).
6. See Florida, The Rise of the Creative Class. The creative class employment share of 40 percent is based on data from the 2021 American Community Survey of the U.S. Census Bureau, which covers the civilian employed population 16 years and older. The creative class includes the super-creative core occupational categories of computer and mathematical; architecture and engineering; life, physical, and social science; education, training, and library; arts, design, entertainment, sports, and media; and the creative professional occupations of management, business and financial operations, legal, and healthcare practitioners and technical.
7. Current workforce figures are from the 2021 American Community Survey of the U.S. Census Bureau. Historical figures are from Florida, The Rise of the Creative Class.
8. State per-capita personal income figures are from the U.S. Department of Commerce, Bureau of Economic Analysis, SAINC1 State annual personal income summary. https://www.bea.gov/data/income-saving/personal-income-by-state.
9. State per-capita personal income figures are from the U.S. Department of Commerce, Bureau of Economic Analysis, SAINC1 State annual personal income summary. From 1929 to the present, Michigan’s best ranking for state per-capita income was 8th nationally in 1953 and its worst ranking was 38th nationally in 2007, 2009, 2010 and 2012. https://www. bea.gov/data/income-saving/personal-income-by-state.
10. Lou Glazer, “Michigan Median Wages: From Nineteen Percent Above to Nine Percent Below,” Michigan Future Inc, April 6, 2023. Data analysis is by Donald Grimes. https:// michiganfuture.org/2023/04/michigan-median-wagesfrom-nineteen-percent-above-to-nine-percent-below
11. See Jeff Green and Mark Clothier, “U.S. Automakers Fleeing Detroit Thrive Amid Motor City’s Decline,” Bloomberg, July 19, 2013 Bhttps://www.bloomberg.com/ news/articles/2013-07-19/u-s-automakers-thrive-as-detroit-goes-bankrupt#xj4y7vzkgd and Brad Plumer, “We Saved the Automakers: How Come That Didn’t Save Detroit?” Washington Post, July 19, 2013. https://www. washingtonpost.com/news/wonk/wp/2013/07/19/wesaved-the-automakers-how-come-that-didnt-save-detroit/
12. U.S. metropolitan area per-capita personal income figures are from the U.S. Department of Commerce, Bureau of Economic Analysis, CAINC1 County and MSA personal income summary. For these comparisons of Detroit’s per-capita income from 1969 to the present, we use only those U.S. metropolitan areas with over 1 million people as of 1969. https://www.bea.gov/data/income-saving/personal-income-county-metro-and-other-areas.
13. 2000 to 2021 employment growth figures are from the U.S. Department of Commerce, Bureau of Economic Analysis, CAINC4 Personal income and employment by major component. https://www.bea.gov/data/employment/employment-county-metro-and-other-areas
14. Drucker, who immigrated to the United States in 1937, published The Future of Industrial Man in 1942 (New York: John Day, 1942) and The Concept of the Corporation (New York: John Day, 1946) four years later. He further developed his concept of knowledge work, the knowledge worker, and the knowledge economy in Landmarks of Tomorrow (New York: Harper & Row, 1959), The Effective Executive (New York: Harper & Row, 1966), The Age of Discontinuity (New York: Harper & Row, 1969), and Post-Capitalist Society (New York: Harper Business, 1993).
15. These data are for the motor vehicles and motor vehicle equipment manufacturing industry. Occupational shares are calculated using micro-level (IPUMS) data from the 2021 American Community Survey. Steven Ruggles, Sarah Flood, Matthew Sobek, Danika Brockman, Grace Cooper, Stephanie Richards, and Megan Schouweiler. IPUMS USA: Version 13.0 [dataset]. Minneapolis, MN: IPUMS, 2023. https://doi.org/10.18128/D010.V13.0.
16. Average annual wage data are from the U.S. Bureau of Labor Statistics, Current Employment Statistics. https:// www.bls.gov/ces/
17. These data on the wage premiums for production occupations are from Donald Grimes.
18. Metropolitan area creative class shares are from the 2021 American Community Survey of the U.S. Census Bureau. The current workforce figures for Michigan are from the 2021 American Community Survey of the U.S. Census Bureau. https://www.census.gov/programs-surveys/acs

19. For more information, see Richard Florida, “Maps Reveal Where the Creative Class Is Growing,” CityLab, July 9, 2019. https://www.bloomberg.com/news/articles/2019-07-09/maps-reveal-where-the-creative-class-isgrowing
20. Joseph Schumpeter, Capitalism, Socialism, and Democracy (New York: Harper & Brothers, 1942).
21. See Richard Alm and W. Michael Cox, “Creative Destruction,” no date provided. https://www.econlib.org/library/ Enc/CreativeDestruction.html
22. See Brett C. Smith, Edgar Faler, Michael Ger, and Narges Lahiji, “From Internal Combustion to Battery Electric Vehicles: Enabling Digital Manufacturing,” Center for Automotive Research, August 2022. https://www.cargroup. org/wp-content/uploads/2022/09/CAR-ICE-to-BEV-Whitepaper-.pdf
23. Quote is from Patrick Sisson, “Shift to Electric Cars Gives Design Centers a New Look, Too,” New York Times, April 25, 2023. https://www.nytimes.com/2023/04/25/business/electric-vehicles-design-centers.html
45 www.creativeclass.com - @creative_class
24. Devashree Saha, Joel Jaeger, Sujata Rajpurohit, Evana Said, and John A. “Skip” Laitner, “A Roadmap for Michigan’s Electric Vehicle Future: An Assessment of the Employment Effects and Just Transition Needs,” World Resources Institute, May 2023. https://publications.wri. org/michigan-ev-future
25. Lou Glazer, “Could the Detroit Three Be Mobility Industry Minnows,” Michigan Future Inc., Blog, April 28, 2022. https://michiganfuture.org/2022/04/could-the-detroit-three-be-mobility-industry-minnows/
26. Matt Posky, “Rivian Snubs Michigan for California,” The Truth About Cars, Blog, October 8, 2020. https://www. thetruthaboutcars.com/2020/06/rivian-snubs-michigan-for-california/
27. See Environmental Defense Fund, “U.S. Electric Vehicle Manufacturing Investments and Jobs, Characterizing the Impacts of the Inflation Reduction Act after 6 Months,” March 2023. https://blogs.edf.org/climate411/ files/2023/03/State-Electric-Vehicle-Policy-Landscape.pdf
28. Jake Lingeman, “U.S. Automakers Aim to Make Detroit the Next Silicon Valley,” Newsweek, February 8, 2023. https://www.newsweek.com/2023/02/17/us-automakers-aim-make-detroit-next-silicon-valley-1779611.html
29. Data for automotive production use data for the motor vehicles, bodies and trailers, and parts manufacturing sector, from the U.S. Department of Commerce, Bureau of Economic Analysis, SAEMP25N, Total full-time and parttime employment by NAICS industry. https://www.bea. gov/data/employment/employment-by-state
30. These U.S. and Michigan industry employment figures are from the U.S. Bureau of Labor Statistics, Current Employment Statistics. https://www.bls.gov/ces/
31. Other industry sectors with LQs of close to or more than 1.0 include utilities (LQ of 1.3 in 2021), healthcare and social assistance (LQ of 1.04), management of companies and enterprises (LQ of 1.04) and professional, scientific, and technical services (LQ of 1.02). By comparison, Michigan has LQs that are considerably below 1.0 in sectors such as information (LQ of 0.7 in 2021), arts, entertainment, and recreation (LQ of 0.85), and finance and insurance (LQ of 0.88). These state-level industry LQs are calculated using employment data from the U.S. Bureau of Economic Analysis, SAEMP25N, Total full-time and part-time employment by NAICS industry. https://www.bea.gov/data/employment/employment-by-state
32. Metro-level industry LQs are calculated using employment data from the U.S. Bureau of Economic Analysis, CAEMP25N, Total full-time and part-time employment by NAICS industry. https://www.bea.gov/data/employment/employment-county-metro-and-other-areas
33. American Automotive Policy Council, “Investing for the Future: Leading in Capital Investments and Research & Development, March 2022. https://www.americanautomakers.org/sites/default/files/2021%20AAPC%20Scoreboard%20 on%20Auto%20CapEx%20and%20R%26D.pdf
34. Data on corporate R&D by industry include “Companies with domestic R&D paid for and performed by the company.” The data are from Table 34-A of the publication, National Center for Science and Engineering Statistics (NCSES). 2020. Business Enterprise Research and Development: 2019. NSF 22-329, National Science Foundation. https://ncses.nsf.gov/pubs/nsf22329/
35. The exact figure is $21.3 billion. Data on corporate R&D by state are from Table 13 of National Center for Science and Engineering Statistics (NCSES), 2020. Business Enterprise Research and Development: 2019. NSF 22-329, National Science Foundation. https://ncses.nsf.gov/pubs/ nsf22329/
36. Data on corporate R&D by metro are from Table 14 of National Center for Science and Engineering Statistics (NCSES), 2020. Business Enterprise Research and Development: 2019. NSF 22-329,National Science Foundation. https://ncses.nsf.gov/pubs/nsf22329/
37. This employment figure is from the Ann Arbor SPARK Sector Report, available at https://annarborusa.org/wp-content/ uploads/2022/07/Auto-Mobility-Sector-2022-6.pdf
38. On GM’s and Ford’s battery innovation centers, see Patrick Sisson, “Shift to Electric Cars Gives Design Centers a New Look, Too,” New York Times, April 25, 2023. The quote from Josh Sirefman below is also from this article. https:// www.nytimes.com/2023/04/25/business/electric-vehicles-design-centers.html. On Michigan Central, see “What is Michigan Central,” https://michigancentral.com/about/. Also see Annalise Frank, “Michigan Central Becomes State of Detroit’s Main Character,” Axios Detroit, March 9, 2023. https://www.axios.com/local/detroit/2023/03/09/michigan-central-state-of-detroit-mike-duggan. On Newlab, see “About Newlab,” https://www.newlab.com/about. Also see R.J. King, “Michigan Central Seeks to Add More Mobility Startups With Newlab,” DBusiness, February 15, 2023. https://www.dbusiness.com/daily-news/michigan-central-
seeks-to-add-more-mobility-startups-with-newlab/. Chanel Stitt, “Newlab at Michigan Central Is for Startups Working toward a Future of Mobility, Detroit Free Press, April 25, 2023. https://www.freep.com/story/money/business/ michigan/2023/04/25/newlab-michigan-central-station-opening-startup-tenants/70146468007/
39. These higher education R&D expenditures are from Table 6 of National Center for Science and Engineering Statistics (NCSES), 2022. Higher Education Research and Development: Fiscal Year 2021. NSF 23-304, National Science Foundation. https://ncses.nsf.gov/pubs/nsf23304/
40. See https://mcity.umich.edu/
41. See https://acmwillowrun.org/
42. “Michigan Lawmakers Approve $130 M Funding for New EV Center in Ann Arbor,” CBT News, July 7, 2022. https:// www.cbtnews.com/michigan-lawmakers-approve-130-mfunding-for-new-ev-center-in-ann-arbor/
43. Patent figures are from the U.S. Patent and Trademark Office, Patent Technology Monitoring Team (PTMT). https:// www.uspto.gov/web/offices/ac/ido/oeip/taf/reports.htm.
44. See Nicholas Bloom, Tarek A. Hassan, Aakash Kalyani, Josh Lerner, and Ahmed Tahoun. “Diffusion of Disruptive Technologies,” National Bureau of Economic Research, Working Paper #28999, November 2021. https://www.techdiffusion. net/
45. Startup Genome, “The Global Startup Ecosystem Report 2022,” June 2022. https://startupgenome.com/article/ rankings-2022-top-100-emerging-ecosystems
46. All venture capital data are from PitchBook-NVCA, Venture Monitor: Q1 2023, April 12, 2023. https://pitchbook.com/ news/reports/q1-2023-pitchbook-nvca-venture-monitor
47. “Top Five Global Startup Hubs: Mobility,” StartUs Insights. https://www.startus-insights.com/innovators-guide/ top-5-global-startup-hubs-mobility/
48. See Ned Staebler and Lou Glazer, “A New Economic Development Strategy for Michigan: Put People and Place First to Create Good-Paying Jobs,” Michigan Future Inc., February 2021. https://michiganfuture.org/wp-content/ uploads/2021/02/new-economic-development-for-MI.pdf
REFERENCES (CONTINUED) 46 www.creativeclass.com - @creative_class
49. Andrew Van Dam, “States with the Worst Brain Drain—and More!” The Washington Post, September 9, 2022. https:// www.washingtonpost.com/business/2022/09/09/films-assigned-college/. Data are from Johnathan G. Conzelmann, Steven W. Hemelt, Brad Hershbein, Shawn M. Martin, Andrew Simon and Kevin M. Stange, “Grads on the Go: Measuring College-Specific Labor Markets for Graduates,” National Bureau of Economic Research, Working Paper 30088, May 2022. https://www.nber.org/papers/w30088
50. Richard Florida, “The U.S. Cities Winning the Battle Against Brain Drain,” CityLab, March 15, 2016. https:// www.bloomberg.com/news/articles/2016-03-15/which-u-smetros-are-best-at-keeping-their-college-grads
51. This is the annual average for 2015-2019. These figures are from the U.S. Census Bureau, American Community Survey. https://www.census.gov/programs-surveys/acs
52. Because people who move outside the United States are not covered in the American Community Survey, this figure of 2 percent of college-educated adults moving out of Michigan does not include those who leave the country. https://www.census.gov/programs-surveys/acs
53. These numbers are calculated using information from the Young Adult Migration project, which tracks people from location at age 16 to location at age 26. The data are from the U.S. Census Bureau and Opportunity Insights. https:// www.migrationpatterns.org/
54. This information is from LinkedIn, Workforce Report: Detroit, February 2, 2023. https://www.linkedin.com/jobs/ blog/linkedin-workforce-report-february-2023-detroit-mi
55. The list of occupations classified as STEM is from the U.S. Bureau of Labor Statistics. https://www.bls.gov/oes/additional.html
56. The data for STEM occupations are from the U.S. Bureau of Labor Statistics, Occupational Employment and Wage Statistics. https://www.bls.gov/oes/
57. See Javier Colato and Lindsey Ice, “Charging into the Future: The Transition to Electric Vehicles,” Bureau of Labor Statistics, Beyond the Numbers, Vol. 12, No. 4, February 2023. https://www.bls.gov/opub/btn/volume-12/charginginto-the-future-the-transition-to-electric-vehicles.htm
58. State-level location quotients are from the U.S. Bureau of Labor Statistics, Occupational Employment and Wage Statistics. https://www.bls.gov/oes/additional.htm
59. The exact figures are: 624,859 students enrolled, 125,337 degrees and certificates (8,561 in engineering), and 59,263 bachelor’s degrees. These data are from the U.S. Department of Education, National Center for Education Statistics, Integrated Postsecondary Education Data System (IPEDS) and include students enrolled at Title IV institutions. https://nces.ed.gov/ipeds/trendgenerator/
60. See Anderson Economic Group: “University Research Corridor: Economic Impact Report, 2022.” https://www. urcmich.org/sites/default/files/reports/2022-06/URCEconImpactReport_6-1-2022.pdf. Also, “Michigan’s University Research Corridor Powers Mobility Innovation,” September 2021. https://www.urcmich.org/sites/default/files/reports/2021-09/urc-mobilitybriefweb-final.pdf
61. These figures cover degrees and certificates by CIP Code, Computer and Information Sciences and Support Services. The data are from the U.S. Department of Education, National Center for Education Statistics, Integrated Postsecondary Education Data System (IPEDS). https://nces. ed.gov/ipeds/trendgenerator/
62. See, for example, “Michigan’s College Graduates: Where Do They Go and Why?” Michigan Future Inc., August 2008. https://www.michiganfuture.org/cms/assets/uploads/2009/07/College-grad-survey-Mi-Future-Aug-08.pdf. “Young Talent in The Great Lakes: How Michigan Is Faring,” Michigan Future Inc., July 2008. https://www.michiganfuture.org/cms/assets/uploads/2014/07/YoungTalentInTheGreatLakesFINAL.pdf
63. These numbers for University of Michigan graduates come from Post-Secondary Employment Outcomes (PSEO) tabulations by the U.S. Census Bureau. https://lehd.ces.census. gov/data/pseo_experimental.html
64. The West Coast refers to the U.S. Census Pacific Region which includes California, Oregon, Washington, Alaska, and Hawaii. Figures for University of Michigan graduates come from Post-Secondary Employment Outcomes (PSEO) tabulations by the U.S. Census Bureau. https://lehd.ces.census. gov/data/pseo_experimental.html
65. Average annual wages for computer programmers are from the U.S. Bureau of Labor Statistics, Occupational Employment and Wage Statistics. https://www.bls.gov/oes/ additional.htm
66. See AnnaLee Saxenian, Silicon Valley’s New Immigrant Entrepreneurs (San Francisco: Public Policy Institute of California, 1999). Richard Florida, Flight of the Creative Class (New York: Harper Business, 2006). Shai Bernstein,
Rebecca Diamond, Abhisit Jiranaphawiboon, Timothy McQuade, and Beatriz Pousada “The Contribution of HighSkilled Immigrants to Innovation in the United States,” NBER Working Paper 30797, December 2022. https://www. nber.org/papers/w30797
67. These figures are from the U.S. Census Bureau, American Community Survey. https://www.census.gov/programs-surveys/acs
68. The percentage of U.S. workers who are in management, business, science, and arts occupations is higher for women (45 percent) than men (36 percent). This trend holds for Michigan as well, 42 percent for women versus 35 percent for men. These numbers are from the 2021 (5-year sample) American Community Survey of the U.S. Census Bureau. https://www.census.gov/programs-surveys/acs
69. “A Path to Good-paying Careers for all Michiganders: Sharing Prosperity with Those Not Participating in the High-Wage Knowledge-based Economy,” Michigan Future Inc., September 2017. https://www.michiganfuture.org/ cms/assets/uploads/2017/09/Sept2017_MIFUTURE_Report_FINAL.pdf Lou Glazer, “Four State policy Levers to End Michigan’s Two-Tier Economy,” Michigan Future Inc., September 2021, https://michiganfuture.org/wp-content/uploads/2021/09/four-levers-speech.formatted. updated-Sept-2021-1.pdf. Edward Lynch and Kendall Nash, “Growth Occupations: Opportunities for More Equitable Participation in Detroit’s Growing Economy,” Detroit Future City and Brookings Metro, February 2023. https://detroitfuturecity.com/wp-content/uploads/2023/02/Growth-Occupations-Report.pdf. Thomas Goff, Tyler Rivera, and Teresa Lynch, “Middle-Wage Jobs,” Detroit Future City and Mass Economics, May 2022. https://detroitfuturecity.com/ wp-content/uploads/2022/06/Middle-Wage-Jobs.pdf
70. For more information, see https://www.sixtyby30.org/
71. “MEDC Helps Launch $10 Million Microloan Fund for Women, Veterans and All Entrepreneurs of Color,” MEDC Communications, March 16, 2023. https://www.michiganbusiness.org/press-releases/2023/03/michigan-economic-opportunity-fund-launch/
72. For more details see https://www.michigan.gov/whitmer/ news/press-releases/2022/10/11/gov-whitmer-signs-bipartisan-michigan-achievement-scholarship-bill
73. For more information see https://www.kalamazoopromise. com
REFERENCES (CONTINUED) 47 www.creativeclass.com -
@creative_class
74. For more information see https://www.michigan.gov/leo/ bureaus-agencies/wd/industry-business/mobility/electric-vehicle-jobs-academy
75. For more on Digital Lakes see https://digital-lakes.org/
76. Claudia Newman-Martin, Tejus Kothari, Jonathan Nipper, Molly Jacobson, Mariano Parro, Brad Allan, and Sacha Litman “Talent as a Competitive Advantage: Why States Like Michigan Are Adopting the New Paradigm of Economic Development in EV, Other Key Sectors,” LinkedIn, March 14, 2023. https://www.linkedin.com/in/claudia-newman-martin-78486451/. “Michigan Announces Launch of Nation’s Largest Campaign to Promote New Careers in State’s Surging Electric Vehicle and Mobility Sector,” Michigan Economic Development Corporation, March 1, 2023. https://www. michiganbusiness.org/press-releases/2023/03/talent-campaign-launch/. Shelly Galliah, “Michigan Tech Signs on to MEDC’s Semiconductor Talent Action Team,” Michigan Tech Global Campus News, December 1, 2022. https://blogs. mtu.edu/globalcampus/2022/12/michigan-tech-signs-onto-the-semiconductor-talent-action-team/
77. See https://bellsbeer.com/history/
78. See Peter Ward, “A Brief History of Austin’s Technology Scene,” Culture Trip, October 11, 2018. Lisa Hartenberger, Zeynep Tufekci, and Stuart Davis, “A History of High Tech and the Technopolis in Austin,” Chapter 3 in Inequity in the Technopolis: Race, Class, Gender, and the Digital Divide in Austin (Austin: University of Texas Press, 2012). Pike Powers, “Building the Austin Technology Cluster: The Role of Government and Community Collaboration in the ‘Human Capital,’” Federal Reserve Bank of Kansas City, 2004.
79. Margaret O’Mara, The Code: Silicon Valley and the Remaking of America (New York: Penguin Books, 2019). AnnaLee Saxenian, Regional Advantage: Culture and Competition in Silicon Valley and Route 128 (Cambridge: Harvard University Press, 1994). Stuart W. Leslie and Robert H. Kargon, “Selling Silicon Valley: Frederick Terman’s Model for Regional Advantage,” Business History Review, Winter 1996. Stuart W. Leslie, “Profit and Loss: The Military and MIT in the Postwar Era,” Historical Studies in the Physical and Biological Sciences, 1990. David H. Hsu and Martin Kenney, “Organizing Venture Capital: The Rise and Demise of American Research & Development Corporation, 1946–1973, ” Industrial and Corporate Change, Vol. 14, No. 4, August 2005. Paul Gompers, “The Rise and Fall of Venture Capital,” Business and Economic History, Vol. 23, No. 2, Winter 1994.
80. Metropolitan area population figures are from the U.S. Bureau of Economic Analysis, CAINC1 County and MSA personal income summary. https://www.bea.gov/data/ income-saving/personal-income-county-metro-and-other-areas
81. Figures are in 2021 constant dollars. Metropolitan area total personal income figures are from the U.S. Bureau of Economic Analysis, CAINC1 County and MSA personal income summary. https://www.bea.gov/data/income-saving/personal-income-county-metro-and-other-areas
82. See Brad Alexander, Tammie Jones, Chris Gore, Jonathan Nawrocki, and Ken Powers, “Encouraging the Revitalization of Downtown Detroit: Attracting the Millennial Knowledge Worker,” University of Michigan, Ross School of Business, and Michigan Future Inc., May 2008. https:// www.michiganfuture.org/cms/assets/uploads/2014/07/ MAPreport.pdf. “Revitalizing Michigan’s Central Cities: A Vision and Framework For Action,” Michigan Future Inc., March 2003. https://www.michiganfuture.org/cms/assets/ uploads/2014/07/RevitalizingCities.pdf
83. On the MI New Economy Initiative, see https://www.michigan.gov/mineweconomy
84. “Compete to Win: Michigan’s Path to Top 10: A Framework for Holistic Economic Development,” Business Leaders for Michigan, May 2023. https://businessleadersformichigan. com/wp-content/uploads/2023/05/BizLeaders_Holistic-Economic-Development-Framework_2023-FINAL.pdf
85. On the Creative Destruction Lab, see https://creativedestructionlab.com/locations/
86. See “Greater Grand Rapids Tech Strategy,” The Right Place https://www.rightplace.org/regional-industries/ information-technology/tech-strategy
87. See Richard Florida, Charlotta Mellander, and Thomas Holgersson, “Up in the Air: The Role of Airports for Regional Economic Development,” The Annals of Regional Science, Vol. 54 (1), January 2015, pp. 197–214.
88. Eric D. Lawrence, “Buttigieg, Whitmer pitch EV corridor with Canada,” Detroit Free Press, May 16 2023, https:// www.freep.com/story/news/local/michigan/2023/05/16/ buttigieg-whitmer-ev-corridor-connecting-detroit-quebec/70223733007/
89. Cad Livengood and Kirk Pinho, “Amazon HQ2 Bid Revealed: Tax Breaks, $120 Million Talent Program, Transit Vision,”
Crain’s Detroit Business, December 20, 2017. https:// www.crainsdetroit.com/article/20171220/news/648176/ amazon-hq2-bid-revealed-tax-breaks-120-million-talentprogram-transit
90. See Richard Florida, “It’s Time to Put Cities at the Top of America’s Economic Agenda,” CityLab, February 7, 2022. https://www.bloomberg.com/news/articles/2022-02-07/ to-bolster-innovation-the-u-s-needs-a-place-based-policy. Joseph Parilla, Glencora Haskins, and Mark Muro, “The Future of Place-Based Economic Policy: Early Insights from the Build Back Better Regional Challenge,” Brookings Institution, November 17, 2022. https://www.brookings.edu/ research/the-future-of-place-based-economic-policy-earlyinsights-from-the-build-back-better-regional-challenge/. Mark Muro, Robert Maxim, Joseph Parilla, and Xavier de Souza Briggs, “Breaking Down an $80 Billion Surge in PlaceBased Industrial Policy,” Brookings Institution, December 15, 2022. https://www.brookings.edu/blog/the-avenue/2022/12/15/breaking-down-an-80-billion-surge-inplace-based-industrial-policy/. Mark Muro, “Industrial Policy Can’t Ignore Geography,” ProMarket, February 28, 2023. https://www.promarket.org/2023/02/28/bidens-bigbet-on-place-based-industrial-policy/
91. Melissa Nann Burke, “New $52 Million Federal Grant to Boost Mobility Innovation in Michigan,” The Detroit News, September 2, 2022. https://www.detroitnews.com/ story/news/politics/2022/09/02/new-52-million-federal-grant-boost-advance-mobility-innovation-michigan/7970333001/
92. Gregg E. Robertson and David N. Allen, “From Kites to Computers: Pennsylvania’s Ben Franklin Partnership,” Technovation, Vol. 4, No. 1, January 1986. https://www.sciencedirect.com/science/article/abs/ pii/0166497286900210
93. Courtney Overbey, “The State Unveils Future Mobility Plan to Ensure Michigan Remains Global Leader in Future Mobility,” Detroit Regional Chamber, September 19, 2022. https://www.detroitchamber.com/state-unveils-future-mobility-plan/
94. On Campus Philly, see, https://campusphilly.org
95. “Doerr: Staple a Green Card to Diplomas,” ACT/The App Association, November 10, 2008. https://actonline. org/2008/11/10/doerr-staple-a-green-card-to-diplomas/
REFERENCES (CONTINUED) 48 www.creativeclass.com - @creative_class
96. See Timothy J. Bartik, “Sensible Place-Based Policies Can Increase Jobs in Local Labor Markets,” W.E. Upjohn Institute for Employment Research, Policy Paper No. 2020-021, May 8, 2020. https://www.upjohn.org/research-highlights/sensible-placebased-policies-can-increase-jobs-local-labor-markets
97. See Mark Muro and Sifan Liu, “As the Digitalization of Work Expands, Place-Based Solutions Can Bridge the Gaps,” Brookings Institution, February 7, 2023. https://www.brookings.edu/ research/as-the-digitalization-of-work-expands-place-basedsolutions-can-bridge-the-gaps/. Ned Staebler and Lou Glazer, “A New Economic Development Strategy for Michigan: Put People and Place First to Create Good-Paying Jobs,” Michigan Future Inc., February 2021. https://michiganfuture.org/wp-content/ uploads/2021/02/new-economic-development-for-MI.pdf. “A Path to Good-paying Careers for all Michiganders: Creating Places across Michigan Where People Want to Live and Work,” Michigan Future Inc., December 2018. https://michiganfuture. org/wp-content/uploads/2018/12/MIFUTURE_Placemaking_Report_2018.pdf
98. Greg Tasker, “Marquette’s Outdoor Innovation Center Moves Forward,” UPword, December 7, 2022. https://www.secondwavemedia.com/upword/features/innovationcenter.aspx
99. John C. Austin, Amanda Weinstein, Michael Hicks, and Emily Wornell, “Improving Quality of Life—Not Just Business—Is the Best Path to Midwestern Rejuvenation,” Brookings Institution, January 26, 2022. https://www.brookings.edu/blog/the-avenue/2022/01/26/improving-quality-of-life-not-just-business-isthe-best-path-to-midwestern-rejuvenation/. Also see “Quality of Life and Place as Economic Development,” Reimagining the Civic Commons blog, Medium, July 19, 2022. https://medium.com/ reimagining-the-civic-commons/quality-of-life-and-place-as-economic-development-ab53cbd65433
100. See https://michiganscreativecoast.com/
101. For more on this program, see https://www.michiganbusiness. org/rap/2/
102. See Lou Glazer, “The Neighborhood Talent Concentration Initiative,” Michigan Future Inc. Blog, May 9, 2023. https:// michiganfuture.org/2023/05/the-neighborhood-talent-concentration-initiative/

103. Richard Florida, “How the ‘Rise of the Rest’ Became the ‘Rise of the Rents,’” CityLab, September 8, 2022. https://www. bloomberg.com/news/features/2022-09-08/why-did-housingcosts-explode-during-the-pandemic
104. See for example the deep body of research by Michigan Future Inc. https://michiganfuture.org/michigan-future-reports/, and Detroit Future City. https://detroitfuturecity.com/resources/ research/
REFERENCES (CONTINUED) 49 www.creativeclass.com - @creative_class
creativeclass.com
