As the academic year ends, one thing is clear—2024–25 was a defining year for Cornell Equity Research. A year of innovation, momentum, and cementing our position as the standard for student-led financial research. Since our founding in 2019, our mission has been set: to bring professional-standard financial research to the undergraduate campus. This year, we’ve not only lived up to that goal—we’ve exceeded it.
Our newly established CER Weekly Newsletter has quickly become the cornerstone of our research output, with 21 consecutive issues spanning seven sectors. This initiative has empowered members to engage consistently with the markets, raising the visibility and impact of student research at Cornell.
Meaningful steps to bolster our alumni network and relations have been taken, hosting six successful events with CER alumni working across leading financial institutions. These events not only provided insights into various sectors of the industry but also reinforced the lasting community CER continues to build.
This semester, we welcomed nine new members whose dedication and curiosity have added new energy to our team. At the same time, we proudly celebrate the graduation of ten seniors in the Class of 2025. Their dedication, rigour, and friendship have shaped the club’s identity in lasting ways—we thank them deeply and wish them the very best in the next chapter of their journeys.
As my term as President concludes, I’m incredibly proud of what we’ve achieved together. From launching our
first-ever weekly newsletter to expanding alumni engagement and standardizing our research output, this year has marked a transformative chapter in CER’s history.
These milestones reflect not only the progress of our fifth year but also the spirit of CER itself—bold, forward-thinking, and committed to excellence. I’ve always believed that CER should not just reflect the standards of the financial industry but help set them for student research. This year, we’ve moved many steps closer to that vision.
It has been a privilege to work alongside such an intelligent, motivated, and collaborative team. I’m thrilled to pass the torch to Khanh Nguyen, who will serve as President for the 2025–26 academic year. With her leadership, I have every confidence that CER will continue to innovate, inspire, and lead.
Thank you to every member, alumni, and leader who made this year possible. What we’ve built together in CER’s fifth year won’t just be remembered—it will be the foundation others build on.
Yours Sincerely,

Kaleb Kavuma President, 2024-25


As tariff headlines and near-record levels of uncertainty clouded global markets, the U.S. economy in the first quarter of 2025 presented a mixed picture of solid domestic demand undercut by significant external headwinds affecting markets to a near-unprecedented effect. Real GDP growth appears to have slowed sharply and may even have turned negative on an annualised basis due to a record trade deficit and inventory adjustments, even as core domestic consumption remained moderately positive i Consumer spending remained resilient overall, but momentum cooled from late-2024’s pace. Inflation stayed above the Federal Reserve’s 2% target, with headline CPI averaging around a 3% annualised rate in Q1 and core inflation somewhat higher. However, both measures showed modest deceleration over the quarter, with sticky core inflation partly fuelled by new import tariffs.ii The labour market stayed historically tight – unemployment hovered near 4.1–4.2% with broader underemployment ~7.9% – though job gains decelerated, and wage growth moderated to just under 4%.iii
Equity markets experienced heightened volatility amid these crosscurrents. After a strong start to the year, stocks sold off in February, leaving the S&P 500 down at its worst 18.95% and 9.98% for YTDiv . Investor sentiment swung in reaction to monetary policy signals and trade turmoil. The Federal Reserve paused interest rate adjustments (holding the Federal Funds Effective Rate at 4.33%) as it assessed balanced risks between still-elevated inflation, emerging growth risks,v missteps, and reduced foreign demand for Treasuries. However, a new U.S. trade policy regime – including hefty tariffs on major trading partners such as Canada, China and Mexico as well as blanket global tariffs on all imports vi – sparked a surge in imports and retaliatory measures, rattling global markets, with some retaliations such as China’s reaching 125% in April 2025 prompting widespread concernvii .
The U.S. dollar, once buoyed by safe-haven demand, plunged to multiyear lows, down 9.28% YTDviii , as confidence in U.S. policy stability deteriorated ix . Meanwhile, bond yields spiked (the 10-year Treasury yield’s 50-basis point surge was its steepest weekly jump since Nov 2001x), reflecting fears of inflationary policy.
April 30, 2025
Term vs 2nd Term
are showing YTD)
Despite the turbulence, underlying domestic fundamentals remained somewhat positive. After decreasing significantly month-on-month in Jan ‘25 to -0.6% growth, the Real Personal Consumption Expenditures figure for March ’25 was up 0.6%, showing potential signs of growth and consumer resilience (BEA, Real Personal Consumption Expenditures; FRED series: PCEC96).
Key service industries continued expanding, and household balance sheets – buttressed by prior income gains – provided a cushion. Sector performance diverged: Industrial Production in the United States increased 1.3% year-on-year in March 2025, following an upwardly revised 1.5% rise in February. Utilities surged 4.4%, and both manufacturing and mining went up 1% xi (ISM Manufacturing PMI, March 2025: 49.0; Federal Reserve Industrial Production Index, Feb 2025), while Services PMI fell sharply to 50.8 in March 2025 from 53.5 in February, well below forecasts of 53 (ISM Services PMI, March 2025). High-growth technology stocks suffered a significant correction after two years of outsized gains (NASDAQ-100, S&P 500 Information Technology Sector, Q1 2025), yet energy and traditional value sectors fared better as leadership rotated. The U.S. trade deficit widened sharply, driven by a front-loading of imports as businesses and consumers accelerated purchases ahead of expected tariff implementation.
Fiscal and monetary policy were generally supportive of growth but approached an inflection point. The new administration in Washington pursued an agenda of “America First” trade rebalancing and industrial revival, introducing uncertainty even as it promised long-term benefits to domestic producersxii. The Fed struck a cautious tone, signalling readiness to adjust policy in either direction depending on incoming dataxiii
Overall, equity investors face a complex macroeconomic backdrop of moderating growth, persistent inflation, and escalating geopolitical risk. A disciplined, sector-selective approach is warranted, with emphasis on beneficiaries of policy shifts such as infrastructure and defence firms and companies with strong pricing power to weather the inflationary environment. Looking ahead to mid-2025, the baseline outlook is for continued sub-trend growth alongside an inflationary trend, with stagflation risk. However, significant uncertainty remains, from the timing of Fed policy adjustments to the potential escalation or de-escalation of trade tensions. While markets may price in individual risks or even a combination of them, the overarching challenge is the heightened uncertainty introduced by current U.S. policy direction and global instability.
Markets Perfotmance Q1 '25
This report provides an in-depth analysis of U.S. macroeconomic conditions in the first quarter of 2025, with an emphasis on implications for equity markets. It is tailored for industry professionals and investors, blending an investor-oriented perspective with academic rigour in assessing the data. The report covers the broad economy (growth, inflation, labour markets, and spending); sectoral performance in areas critical to equities; the policy environment (monetary, fiscal, and trade); international trade and capital flows; and key risks and uncertainties on the horizon. My goal is to distil how Q1 2025’s economic developments are likely to influence corporate earnings, valuation, and investment strategy going forward.
Methodology:
This analysis draws on official economic data releases from agencies including the Bureau of Economic Analysis (BEA), Bureau of Labour Statistics (BLS), and the Federal Reserve System (Fed). These include reports on gross domestic product (GDP), consumer spending, employment, and inflation. Where relevant, I also reference aggregated datasets from the Federal Reserve Economic Data (FRED) platform, the Survey of Professional Forecasters (SPF), and projections published by the Federal Open Market Committee (FOMC).
Primary sources (e.g., BEA, BLS, and the U.S. Census Bureau) are prioritised for accuracy and transparency, with FRED used to consolidate and standardise time series data. I incorporate insights from Fed communications including FOMC statements, meeting minutes, and speeches to capture evolving policy guidance and its influence on market sentiment. The
After a robust second half of 2024, U.S. real GDP growth downshifted markedly in Q1 2025. While the advance estimate is pending, preliminary models provide divergent signals. Growth was close to flat or slightly negative for the quarter. The Atlanta Fed’s GDP Now model estimated -2.4% growth as of April 9, while an alternative adjusted model put the figure closer to -0.3% (Federal Reserve Bank of Atlanta 2025) The Philadelphia Fed’s Survey of Professional Forecasters (SPF) had previously forecast +2.5% annualised Q1 growth, although this predated trade disruptions (Federal Reserve Bank of Philadelphia 2025). Meanwhile, Goldman Sachs and J.P. Morgan revised recession probabilities upwards to 45% and 60%, respectively, by late April (Bloomberg 2025).
Key Drivers: Consumer spending and government spending were positive contributors, while net exports and inventories likely made large negative contributions to Q1 GDP. In late 2024 the economy had considerable momentum – Q4 real GDP grew 2.4%, fuelled by strong consumer expenditure (+4.2% annualised in Q4 PCE). Entering Q1, underlying domestic demand stayed firm: final sales to private domestic purchasers (a measure excluding trade and inventories) are estimated to have grown around ~2% in Q1, indicating the U.S. private sector continued to expand at a moderate rate. However, businesses likely pared back inventory accumulation after the holiday buildup, and trade flows swung dramatically (as detailed in the Trade section), subtracting from headline growth. On a year-over-year basis, real GDP in Q1 2025 was roughly 1.6% higher than a year ago (subject to revision), reflecting the economy’s come-down from above-trend growth in 2021–2023 toward a slower trend. Notably, the range of estimates is unusually wide, highlighting elevated uncertainty. Optimistic scenarios see a soft landing with modest growth resuming by Q2; pessimistic views warn that Q1 could mark the start of a mild recession if consumption falters further. The SPF panel puts only a ~10% probability on Q1 2025 real GDP contracting, though that was before the tariff shock – subsequent developments suggest that risk was higher in reality.
Investor Implications: The abrupt growth slowdown has two primary implications for investors:
1. Corporate revenue growth may weaken in upcoming quarters, especially for industries reliant on trade and manufacturing, necessitating more cautious earnings expectations.
2. The slowdown increases pressure on the Federal Reserve to consider policy easing a dynamic that typically supports equity valuations if inflation risks are contained. However, as discussed in subsequent sections, inflation and policy constraints complicate this outlook.
Inflationary pressures in Q1 2025 remained elevated but showed early signs of moderation, with key differences between headline and core measures. The Consumer Price Index (CPI) from the U.S. Bureau of Labour Statistics (BLS) and the Personal Consumption Expenditures (PCE) price index from the U.S. Bureau of Economic Analysis (BEA) both increased at an annualised pace of approximately 3%–4%, above the Federal Reserve’s 2% target but far below the 2022 peaks (BLS 2025; BEA 2025a).
According to the Federal Reserve Bank of Philadelphia’s Survey of Professional Forecasters (March 2025), headline CPI inflation in Q1 was approximately 3.0% annualised, while headline PCE inflation was around 2.5% (FRBP 2025). These figures slightly exceeded earlier forecasts, suggesting inflation ran hotter than expected early in the quarter. Core inflation, which excludes volatile food and energy components, remained sticky: the BLS estimated core CPI at ~5.3% year-over-year, and the BEA reported core PCE at ~4.3% YoY as of February 2025 (BLS 2025; BEA 2025b). These levels reflect persistent inflation in service categories despite easing goods inflation. The PCE
index the Fed’s preferred inflation gauge rose 4.2% YoY in February, down from over 5% a year earlier, but still more than double the central bank’s inflation target (BEA 2025b).
Drivers of inflation in Q1 were mixed. Energy prices declined during the quarter, with WTI crude oil falling from around $76 in January to roughly $63 by April, with lows of $59, contributing to lower gasoline prices and deflation in the energy sub-index (FRED 2025a). However, tariff-related import cost pressures countered that disinflationary impulse. In March, the ISM Manufacturing PMI indicated that “price growth accelerated due to tariffs”, as businesses pre-emptively stockpiled goods ahead of higher duties. This likely pushed up input costs and flowed into final goods prices (ISM 2025). Meanwhile, services inflation particularly in housing, healthcare, and personal services remained robust, driven by wage growth and continued demand. The ISM Services PMI prices sub-index stayed above 60 throughout Q1, signalling elevated cost pressures across the service sector (ISM 2025).
Wage growth slowed somewhat, which may ease core inflation going forward. Average hourly earnings rose 3.8% year-over-year in March 2025, down from over 5% the previous year (BLS 2025). Yet, rent inflation persisted, with Owners’ Equivalent Rent (OER) still rising at an annual rate of around 6% in the CPI.
Looking ahead, investors are watching for further confirmation that inflation is trending downward. The Federal Reserve’s March 2025 Summary of Economic Projections forecasts PCE inflation at 2.7% (Q4/Q4) by year-end (Federal Reserve 2025). Market-based expectations (e.g., TIPS break-evens) and survey-based forecasts suggest a slow disinflation path, though the durability of tariff-related inflation shocks remains uncertain. Long-run expectations remain anchored the SPF panel pegs 10-year expected CPI inflation at ~2.3% a reassuring sign for markets (FRBP 2025). For equity investors, this creates a dual challenge: while moderating headline inflation supports purchasing power and real income growth, elevated core inflation continues to restrict the Federal Reserve’s ability to pivot toward easing. Sustained progress on core inflation would likely boost equity valuations by reducing both input cost pressures and interest rate overhangs.
In my view, the policy environment is turning what might otherwise have been a relatively well-understood and manageable inflationary environment into one marked by elevated uncertainty. While the underlying trend suggests gradual disinflation driven by cooling wage growth, easing energy prices, and anchored long-term expectations the introduction of new tariffs, shifting geopolitical dynamics, and the Federal Reserve’s data-dependent posture have injected renewed volatility into the inflation outlook.
Absent these shocks, inflation would likely have continued to moderate along a clearer trajectory, allowing the Fed greater flexibility to begin easing without risking credibility. Instead, policymakers now face a more complex tradeoff: act too soon and risk fuelling renewed price pressures; act too late and potentially deepen a slowdown already visible in GDP growth and labour market cooling.
Thus, while headline inflation is easing, core pressures particularly in services remain sticky.
This uncertain policy landscape complicates valuation and sector allocation decisions for investors. It raises the risk of mispricing both in duration-sensitive assets and in sectors heavily reliant on cost stability. For now, it reinforces the case for focusing on firms with pricing power and operational agility those able to weather a longer stretch of elevated input costs and unpredictable monetary responses. Until inflation’s trajectory is clarified, and the Fed’s reaction function becomes more transparent, markets are likely to remain sensitive to even minor inflation surprises or shifts in policy tone.
The U.S. labour market remained a source of strength in Q1 2025, though signs of cooling emerged in hiring and participation. The unemployment rate (U-3) held steady in a tight range, ending the quarter at 4.2% in March (little changed from ~4.0% late last year). Unemployment has plateaued in the low 4% range since mid-2024, indicating the jobs market has loosened only marginally from the ultralow 3.5%–3.7% rates of 2022–2023. The broad underemployment measure (U-6), which includes discouraged workers and part-timers who want full-time jobs, ticked up slightly to 7.9% in March (seasonally adjusted) from about 7.5% at the start of the quarter – still low by historical standards but reflecting a modest rise in labour under-utilisation. Notably, the number of people working part-time for economic reasons (4.8 million) was little changed in Q1, and labour force participation remained stable around 62.5% This suggests that while more workers are available than a year ago, the labour supply has not dramatically expanded.
Job growth continued in Q1 but at a slower pace. Monthly payroll gains averaged roughly +150k in Q1 (after revisions) – for instance, +228,000 jobs in March, but January and February were revised down to ~+111k and +117k, respectively. This marks a deceleration from the 2024 average (~250k/month). The cooling was most pronounced in interest-rate-sensitive sectors and those affected by trade uncertainty. For example, manufacturing payrolls were flat to down in some months, and the ISM report noted manufacturing employment contracting in March In contrast, services sectors like health care, social assistance, transportation, and retail continued to add jobs in March, even getting a temporary boost from the resolution of a retail strike. Wage growth decelerated in tandem. Average hourly earnings for all private employees rose 0.3% in March (MoM) and 3.8% over the past year – a clear step down from ~5% annual wage gains seen in 2022 Wage increases are now only slightly above inflation, meaning real wage growth is just turning positive after a prolonged squeeze on households. The easing of wage pressures is a welcome development for the Fed’s inflation fight, though it could slightly dampen consumer spending power compared to the robust real income gains of 2020–2021.
From an investor viewpoint, the Q1 labour data sends mixed signals. On one hand, continued low unemployment underpins consumer confidence and spending – a positive for sectors like consumer discretionary and financials (credit quality tends to remain strong when employment is high). Solid job gains in services indicate that the domestic economy isn’t falling off a cliff, supporting earnings in those industries. On the other hand, slower overall hiring and higher unemployment than a year ago hint at later-cycle dynamics; companies facing profit margin pressures have become more cautious on expanding payrolls. Importantly, unit labour costs may start to stabilise or even fall if productivity picks up and wage growth cools, which would be positive for corporate margins in the long run. In Q1, productivity growth was modest, but if businesses adjust to higher interest rates by investing in efficiency (automation, etc.), it could bolster output per worker.
A Final Note: labour market risks include the possibility of a sharper slowdown in hiring if profit warnings rise and potential strikes or labour disputes as workers seek to keep up with inflation (the quarter saw some disruptions, though not on the scale of 2023’s industrial actions). So far, the labour market has achieved a very delicate balance –cooling enough to ease inflation fears but not so much as to cause a collapse in income and demand. Maintaining that balance will be critical for a soft landing. Still, this balance remains precarious, especially if profit margins erode further.
Consumer spending – which comprises about 68% of GDP – grew in Q1 but at a moderate and uneven pace. Real Personal Consumption Expenditures (PCE) appear to have increased only slightly quarter-on-quarter, a slowdown from the vigorous 4.2% annualised growth in Q4. Monthly data show a dip in spending in January followed by a rebound in February: real PCE fell -0.3% in January but then rose +0.4% in February. Early indications (e.g., credit card spending trackers) suggest March was modest, resulting in roughly 1–2% annualised real consumption growth for Q1 as a whole. Households started 2025 on a cautious note; perhaps post-holiday retrenchment and higher utility bills in a cold January dented discretionary outlays. The February bounce-back was encouraging and partly weather-related (a warm spell and improved auto inventories boosted sales). Retail sales figures (ex-auto) similarly showed a January drop and February recovery, reflecting this volatility. Consumers also shifted spending patterns: goods outlays were choppy (down in January, up in Feb), while services spending – on travel, dining, healthcare, etc. – maintained a steadier climb, benefiting from the ongoing normalisation of activities.
Several factors influenced consumer behaviour in Q1:
• Inflation and Real Incomes: Easing inflation improved households’ purchasing power compared to a year ago. Real disposable income grew in Jan/Feb as headline inflation cooled and cost-of-living adjustments (e.g., to Social Security cheques) kicked in. However, the re-imposition of student loan payments (for those whose moratorium ended) and higher shelter costs absorbed some of that gain. Wage growth, while slower, still ran above inflation (3.8% vs ~3% CPI), yielding slight real wage gains. This helped support consumer spending, especially for lower-income cohorts, who had been squeezed by high inflation previously.
• Labour Market Strength: High employment levels provided income security. The unemployment rate stabilising just above 4% means relatively few people experienced job loss. Job additions, though slower, were enough to keep aggregate labour income on an upward trend. Consequently, consumer confidence was mixed: the University of Michigan index dipped in February on tariff fears, but overall sentiment remained far above recessionary lows, buoyed by employment optimism.
• Tariff-Driven Buying Behaviour: Anticipation of tariffs on various consumer goods led to some front-loading of purchases. There is anecdotal evidence (and some survey data) that consumers and businesses rushed to buy big-ticket items (appliances, electronics, and even jewellery) before higher import duties took effect. This could explain strong durable goods spending late in 2024 and a giveback in early 2025. Indeed, durable goods PCE jumped at a 12% annual rate in Q4 2024, then likely flattened in Q1 as those purchases were satiated. I expect some payback in Q2 as well, meaning consumer spending might downshift further absent new stimulus.
• Excess Savings and Credit: Households still hold some excess savings from earlier fiscal stimulus, but that buffer is dwindling and skewed toward higher-income families. The personal saving rate hovered around 4–5% in Q1, up from record lows but below long-term norms, indicating consumers are not overly cautious. Credit card and consumer loan data show higher borrowing – household debt rose by $93 billion in Q4 2024 and likely continued rising in Q1 – which suggests consumers are willing to leverage to maintain spending. However, rising interest rates have made credit card balances more expensive, and delinquency rates have inched up from historic lows (though remain manageable). This dynamic bears watching, as a significant tightening of credit conditions could constrain spending for more indebted households.
In summary, the U.S. consumer in Q1 2025 was still spending, but selectively. Essentials and pent-up service demand were funded, while more discretionary purchases saw some tightening. Real consumer spending growth of roughly 1% (annualised) likely contributed only about ~0.7 percentage points to Q1 GDP growth, a noticeable drop from the 2+ point contribution in late 2024. For equity investors, this means revenue growth in consumer-oriented sectors (retail, restaurants, travel) was positive but not booming in Q1. Companies with pricing power likely fared better, as consumers became more price-sensitive. The quarter also showed that consumer behaviour can pivot quickly with shifts in policy expectations – a risk going forward if, for instance, uncertainty around the debt ceiling or further tariffs undermines confidence. On the upside, as inflation ebbs and if wage gains are sustained, consumers could regain momentum later in 2025, supporting a reacceleration in consumption. Much will depend on how the labour market and fiscal policy evolve, as well as the trajectory of household savings and credit conditions.
International trade became a front-and-centre issue in Q1 2025, as the U.S. implemented new tariff measures that reverberated through trade balances, exchange rates, and capital flows. Meanwhile, the broader global macro environment – including a modest recovery in Europe and challenges in China – influenced U.S. external sectors. Here I assess the trade balance, exchange rate movements, capital flows, and global trends and their implications.
The United States entered 2025 with a historically large trade deficit, and Q1 saw that deficit surge to record levels. In January, the overall trade gap (goods and services) widened by 34% in one month to an all-time high of $131.4 billion This spike was driven primarily by an imports surge: total imports leapt 10% in January (the most since mid2020), as businesses front-loaded purchases ahead of new tariffs. According to the Commerce Department, goods imports hit a record $329.5 billion in January. The composition of this import spike is telling – there was a $23 billion jump in industrial supplies/materials imports (mostly gold and metals), plus notable increases in consumer goods like pharmaceuticals, mobile phones, and capital goods like computers. Essentially, importers rushed to bring in items before tariffs on key trading partners (China, Mexico, and Canada) took effect or increased. Exports, in contrast, rose only 1.2% in January, not nearly enough to offset the import bill, hence the blowout deficit.
February data (advance figures) suggested some reversal – imports likely cooled after the January binge, and exports grew slightly. The goods deficit narrowed in Feb from January’s extreme, but the 3-month average deficit ending in January was $102.6B per month, far higher than the prior quarter. Net exports therefore are almost certainly a large drag on Q1 GDP, which aligns with the weak GDP Now estimate.
• Trade with specific partners: The trade policy changes targeted North American neighbours and China in particular. In early March, President Trump imposed a new 25% tariff on all imports from Mexico and Canada and doubled tariffs on Chinese goods from 10% to 20%. These actions immediately impacted trade flows:
• China: U.S. goods trade with China had already been on a downtrend due to the earlier trade war. The deficit with China in January was -$31.7B (goods only), and interestingly, it shrank to -$21.1B by February, likely because U.S. imports from China dropped off sharply once tariffs increased. However, those “lost” Chinese imports partly shifted to imports from other countries (Vietnam, etc.) or from surging domestic inventory drawdowns, so the overall import bill didn’t shrink as much. China, for its part, retaliated with tariffs on certain U.S. exports like large agricultural products (e.g., a mooted tariff on U.S. corn and pork was signalled). This likely contributed to weaker U.S. exports of agriculture to China in Q1.
• Mexico and Canada: These are the #1 and #2 U.S. trading partners. The tariffs on them were controversial domestically (given integrated supply chains). Mexican goods imports jumped in January as companies rushed in shipments of auto parts, electronics, etc., ahead of tariffs. I saw border congestion in late Jan as trucks rushed to beat deadlines. The January trade deficit with Mexico widened. By Feb-March, some U.S. importers cut back, awaiting clarity or trying to source elsewhere. Canada’s case is similar; one unique aspect was oil – the U.S. imports a lot of Canadian crude, which was included in tariffs, raising costs for U.S. refiners in the Gulf. There’s talk of exemptions for strategic imports, but none are implemented yet. Both Mexico and Canada announced partial retaliatory tariffs on U.S. exports in March (Mexico targeted certain manufactured goods, and Canada on U.S. steel). The new strain puts the USMCA trade pact under pressure – ironically, the USTR’s agenda calls for a review of USMCA’s impacts ahead of 2026.
• Others: The EU had not been directly targeted by new U.S. tariffs in Q1, but it responded to a lingering dispute (maybe over digital service taxes or steel) by placing retaliatory tariffs on select U.S. goods in March. The items were small scale but symbolic (Harley-Davidson motorcycles, some ag goods). The U.K. and allies haven’t joined the tariff war but are wary. Meanwhile, U.S. trade with other Asia (Vietnam, India, etc.) increased as supply chains rerouted around China’s tariffs. Emerging market exporters of commodities (e.g., Brazil for soy) took some U.S. market share in China.
Capital flows and investment: The trade turmoil influenced capital flows significantly. Typically, a larger trade deficit is financed by capital inflows (foreign investment in U.S. assets). But in Q1, I saw unusual patterns:
• Foreign Portfolio Investment: As noted, foreign investors (especially central banks and sovereign funds) became net sellers of U.S. Treasuries in late March. The loss of confidence in U.S. policy stability due to erratic tariff moves led to what Reuters described as offshore funds fleeing Treasuries, causing yields to spike. The dollar’s steep decline also suggests reduced appetite for U.S. assets – global investors might have reallocated toward European or Japanese assets, expecting those economies to suffer less from a trade war. Indeed, anecdotal reports say March saw large outflows from U.S. equity funds and some outflows from U.S. bond funds, while European markets had inflows (helping their outperformance). If such trends persist, financing the U.S. deficit could force higher interest rates to attract capital.
• FDI and Corporate Flows: On the flip side, onshoring sentiment rose. Some multinational companies announced plans to invest in U.S. production (to avoid tariffs and benefit from incentives), e.g., there were new factory announcements in the Midwest for electronics assembly (spurred by tariffs on imported finished goods). This could portend a pickup in foreign direct investment (FDI) into the U.S. manufacturing sector over time. Q1 data on FDI isn’t in yet, but I might see an uptick in commitments. However, uncertainty can also delay investments – companies might wait to see if tariffs are permanent or negotiable.
• U.S. Investment Abroad: U.S. firms also repositioned. Some offshore production further to circumvent China tariffs (moving from China to Vietnam, etc.), which is a continuation of the “China+1” strategy many had adopted. Also, U.S. financial flows to emerging markets may have increased given the relative undervaluation (and maybe some speculation that emerging Asia will benefit from the U.S.-China rift).
Currency markets reacted strongly to the new U.S. trade policies. The U.S. dollar, which had been relatively strong in 2024, weakened notably in Q1 2025. By early April, the dollar index (DXY) was down roughly 7% year-to-date, reaching its lowest levels in about a decade against some currencies. The dollar fell below $1.15 per euro (from $1.08 at end-2024) and hit multi-year lows versus safe havens like the Swiss franc. The sharp drop in the dollar in late March – described as a “flash crash” by traders – was directly linked to the erosion of trust in U.S. policy consistency. Traditionally, when the U.S. imposes tariffs or seems willing to tolerate a weaker dollar to improve
trade balances, the FX market often marks down the currency. Moreover, rising U.S. yields would normally attract capital and support the dollar, but in this case, the reason yields spiked (loss of safe-haven status) spooked investors enough that it hurt the dollar. Analysts like NAB’s Ray Attrill noted an “almost overnight loss of safe-haven attributes” for the U.S., an extraordinary statement. Essentially, the currency market saw the U.S. as exporting instability rather than being a refuge from it.
Other currencies responded accordingly: the euro and yen strengthened against USD. The euro’s rise was also supported by the Eurozone avoiding recession and the ECB still in tightening mode. Emerging market currencies were mixed – some that benefit from commodity exports or alternative supply chain roles (like the Brazilian real and Mexican peso after an initial dip) held up, whereas those reliant on U.S. demand had more volatility.
From the U.S. perspective, a weaker dollar does have a silver lining: it makes U.S. exports more competitive and imports more expensive, which theoretically helps narrow the trade deficit (over time). Indeed, in March the dollar depreciation likely started to marginally help exporters. However, the flipside is imported inflation – a weaker dollar can push up prices of imported goods and commodities, potentially complicating the inflation fight. The Fed will weigh this if the trend persists. For now, the Treasury seems content to let the market dictate the dollar while emphasising that erratic moves are unwelcome. I should note that if the dollar decline were to become disorderly, coordinated intervention could be considered, but that’s premature.
For equity investors, currency moves can affect the earnings of multinationals: the weakening dollar is actually a tailwind for U.S. companies’ foreign revenues, as those translate into more dollars. This is especially relevant for sectors like tech and industrials with large overseas sales. For foreign companies, the stronger euro/yen can be a headwind. Thus, the dollar’s path will influence earnings in coming quarters (Q1 likely saw some forex losses for companies hedged expecting a stronger dollar, but going forward it may boost guidance).
The macroeconomic landscape is fraught with risks and uncertainties that could materially impact both the real economy and financial markets. Investors should remain vigilant of these potential pitfalls:
Treasury Market Breakdown: An additional risk is the potential for a disorderly sell-off in the U.S. Treasury market. With over $7 trillion in debt maturing in 2025, the government faces significant refinancing needs amid already elevated deficits If demand particularly from foreign buyers continues to weaken due to rising geopolitical tensions and diminished confidence in U.S. fiscal discipline, bond supply could overwhelm demand. This scenario would exert downward pressure on prices and upward pressure on yields, potentially destabilising financial markets. Term premiums have already risen, reflecting increased uncertainty, and Treasury prices have declined significantly since 2020. If this trend accelerates, it could trigger broader financial instability pushing mortgage rates higher, undercutting equity valuations, and tightening credit across the economy. For investors, the takeaway is clear: the U.S. government bond market may collapse and cause not only a domestic recession but fundamentally and irreversibly alter the long-term trajectory for the United States as a key entity in the global financial market.
Monetary Policy Missteps (Fed Risks): The Federal Reserve faces a narrow path. One risk is tightening too little, allowing inflation to become entrenched at a high level, which could force more aggressive hikes later and derail the economy. Conversely, tightening (or staying too tight) for too long could choke off the recovery and tip the economy into an unnecessary recession. This “stop-go” policy risk is reminiscent of past episodes. So far, the Fed has paused, but if inflation surprises on the upside in Q2 (perhaps due to tariffs and dollar weakness), the Fed might resume hikes,
catching markets off guard. The Fed’s own projections show core inflation still above 2% through 2025 – if that persists, the Fed might keep rates higher for longer than markets expect, pressuring equity valuations. Additionally, communication risks are high: a misinterpreted Fed statement or a dissent within the FOMC could inject volatility. In short, there’s a risk of a policy error, either by prematurely easing (reigniting inflation) or over-tightening (causing a hard landing).
Persistent or Resurgent Inflation: While inflation has come down from peaks, there’s a non-trivial risk it persists above target or even reaccelerates. Potential catalysts include a wage-price spiral – though wage growth moderated to 3.8%, it’s still above productivity growth, which could sustain services inflation. If tariffs remain or escalate, import prices could drive a new wave of cost-push inflation (already ISM noted tariffs lifting prices ). Energy prices could swing upward – for example, OPEC+ could cut output in Q2 to prop up oil, or geopolitical tensions (Middle East flare-up) could spike oil prices, feeding into headline inflation. Sticky shelter costs are another worry; if housing rents don’t decelerate as expected, core CPI will stay elevated. Inflation running at, say, 3% into late 2025 would mean higher real yields and likely lower equity multiples. It would also erode consumer real incomes again, threatening corporate revenues. The risk of stagflation (low growth + persistent inflation) cannot be ruled out, which would be a worst-case for many assets.
Geopolitical Risks: The war in Ukraine remains a significant wildcard. Thus far, the economic damage is mostly localised to Europe via energy, but an escalation – e.g., if the conflict spills beyond Ukraine or if a disruptive cyberattack hits Western infrastructure – could shock markets. There’s also risk around war fatigue: changes in U.S./European political support could alter the war’s course, with unpredictable consequences for European stability and defence companies’ prospects. The China-Taiwan situation is perhaps an even greater tail risk. Any military confrontation or blockade involving Taiwan would likely cause a major global downturn: it could sever the flow of semiconductor chips (Taiwan makes the majority of advanced chips), hobble tech supply chains, and likely prompt harsh sanctions that fragment the global economy severely. Even short of conflict, increased military posturing in the Taiwan Strait ups uncertainty. Meanwhile, U.S.-China decoupling might intensify – if negotiations fail, the tariff war could broaden or tech decoupling could accelerate (China could retaliate by restricting exports of rare earth minerals essential to U.S. tech manufacturing, for example). Geopolitical tensions also raise the risk of cyber warfare or trade alliance reshuffling (e.g., China deepening ties with sanctioned states, undermining Western sanctions' efficacy).
Trade War and Protectionism Spiral: The tariffs introduced by the U.S. have already provoked retaliation from multiple partners. There’s a risk of a protectionism spiral – allies imposing their own tariffs, WTO disputes going unenforced (the WTO’s arbitration is hamstrung already). If global trade fractures further, companies could face rising costs and lost markets. Sectors like agriculture and autos are particularly vulnerable if foreign markets close off. Investors should watch for any signs that negotiations might resolve these issues vs. signs they will escalate (e.g., an absence of talks by summer would be worrying). Also, supply chain disruptions could reappear if countries impose export controls (imagine China limiting rare earth exports or medical supplies in response to U.S. actions). Less globalisation could mean structurally higher inflation and lower global growth – not an immediate shock, but a grinding risk.
Financial Market Instability: The volatility in late Q1 is a reminder that financial stability can be tenuous. Rapid interest rate changes have the potential to cause stress in debt markets. For instance, the “largest weekly rise in Treasury yields since 1982” indicates unusual stress – such moves can hurt portfolios of leveraged investors (like hedge funds using Treasuries as collateral) or banks’ balance sheets (as bond prices fall). A specific concern: commercial real estate (CRE). With higher rates and shifts in office usage, CRE valuations are under pressure, which could hit regional banks that have large CRE loan books. A spike in CRE loan defaults might pose systemic concerns. Similarly, corporate debt risk is inching up – Moody’s projects default rates on speculative-grade loans could rise to
post-2008 highs by the end of 2025 If credit spreads blow out, weaker companies might face refinancing crises. The leveraged loan and private credit markets, which grew in low-rate times, have yet to be tested in high-rate environment; problems there could ricochet into broader markets. Non-bank financial institutions (like certain fintechs or shadow banks) could be another locus of risk if liquidity dries up. On the flip side, if the economy sharply weakens, deflationary or liquidity trap risks (less likely, but possible if, say, inflation plunges, and the Fed has to slash rates quickly) could lead to near-zero rates and financial repression.
U.S. Fiscal Showdown: The upcoming debt ceiling debate is a critical risk in mid-2025. Political polarisation is high, and a miscalculation could result in a technical U.S. default or at least a close call. In 2011, such brinkmanship led to a U.S. credit rating downgrade and a stock market correction. A repeat would likely roil bond markets and cause a spike in volatility. Even absent default, resolving the trajectory of U.S. fiscal deficits is important – continued large deficits might push yields structurally higher if foreign demand stays weak, crowding out private investment (bad for long-run growth) and raising the government’s interest burden (which could eventually force spending cuts or tax hikes, affecting sectors like defence or healthcare which rely on federal funding).
Pandemic or Other Tail Risks: While COVID-19 is no longer front-page, the risk of a new variant or another type of pandemic (or, say, a biosecurity threat) always looms. Such an event could shock demand/supply in unforeseen ways. Other natural disasters (climate-related events, etc.) could also have outsized impacts, e.g., a severe hurricane season affecting oil refining or a drought hitting agriculture yields (pushing food inflation up and straining farm incomes).
In assessing these risks, I note that not all are equal probability. Some (like the debt ceiling and Fed policy error) are relatively likely in the next 3-6 months, while others (Taiwan conflict) are low-probability but high-impact. Investors should consider stress-testing portfolios against scenarios: What if inflation is 1% higher than base case? What if the Fed has to hike to 6%? What if global GDP is 1% lower due to a trade war?. Diversification, quality bias (strong balance sheets), and perhaps increasing exposure to defensive assets (like certain commodities or gold, which often shine in geopolitical crises) could be prudent hedges. Indeed, gold’s import surge in Q1 suggests some savvy actors are hedging
On the positive side, if many of these risks don’t materialize (i.e., gradual easing of inflation, no major geopolitical flare, etc.), there’s upside potential for a relief rally and stronger growth than expected (a “Goldilocks” scenario). But given the current environment, it’s wise to assume a more volatile road ahead, with above-mentioned risks as key mile-markers to watch.
Q1 2025 was a crossroads for the U.S. economy – a quarter where post-pandemic growth momentum encountered new headwinds from policy shifts and global uncertainties. The data show an economy that is resilient yet slowing: consumer and business fundamentals remain intact, but aggregate growth likely stalled due to a policy-induced trade shock and the cumulative effect of past monetary tightening. Inflation is off its peaks but not yet vanquished, keeping policymakers on alert. Financial markets have reacted by repricing risk, resulting in higher volatility and divergent sector performance.
Unfortunately, I don’t believe in macroeconomic forecasts, especially in unprecedented times like this, so my outlook is one of cautious optimism tempered by significant risks. A recession is still possible, and so too is a huge rally after potential policy corrections. Caution, timing, and risk management will be the name of the game.
Appendix A: Key Economic Indicators and Data Sources (Q1 2025)
• Nonfarm Payrolls: Bureau of Labour Statistics (BLS), Establishment Survey (CES). Q1 2025 monthly average: ~150k jobs. March +228k (Jan +111k, Feb +117k after revisions). FRED series: PAYEMS.
• Wage Growth: BLS, Average Hourly Earnings (Total Private). March 2025: $36.00, +3.8% YoY. FRED series: CES0500000003. Employment Cost Index for Q1 2025 due late April; Q4 2024 was +4.6% YoY.
• Consumer Spending: Bureau of Economic Analysis (BEA), Real Personal Consumption Expenditures (PCE). Jan 2025: -0.3% MoM; Feb 2025: +0.4% MoM. FRED series: PCEC96. Retail Sales (Census Bureau), ex-auto: Jan -2.0%, Feb +0.2%. FRED series: RSAFSNA.
• ISM Manufacturing PMI: Institute for Supply Management (ISM), Manufacturing Report. Mar 2025: 49.0. FRED series: NAPM.
• ISM Services PMI: ISM, Services Report. Mar 2025: 50.8. Note: No direct FRED series.
• Industrial Production Index: Federal Reserve, G.17 Release. Feb 2025: +0.7% MoM. FRED series: INDPRO (total), IPMAN (manufacturing). Capacity Utilisation: Feb 2025 manufacturing 77.0%. FRED series: MCUMFN.
• Federal Funds Rate: Federal Reserve, target range 4.25–4.50%, effective ~4.33%. FRED series: FEDFUNDS.
• 10-Year Treasury Yield: Market yield. End-Mar 2025 ~4.7%. FRED series: DGS10.
• Trade Balance: BEA/Census Bureau. Jan 2025 deficit: -$68.3B in goods, -$131.4B total. Feb 2025 advance deficit ~$91B. FRED series: BOPGSTB.
• Exchange Rate: Federal Reserve, Broad Dollar Index. Mar 2025 average ~105. FRED series: DTWEXBGS.
• Commodity Prices: WTI crude ~$70 in Q1. FRED series: MCOILWTICO. Natural gas ~$3 (EIA). Gold ~$2000/oz (market data).
• GDP & National Accounts: BEA GDP release (March 27, 2025); FRED GDPC1. Bloomberg ticker: GDP CQOQ Index.
• Labour Market Data: BLS Employment Situation (monthly); FRED: UNRATE, U6RATE. Bloomberg: USURTOT, NFP TCH Index.
• Inflation Data: BLS CPI (Apr 2025 for Mar CPI), BEA PCE (Mar 28, 2025, for Feb). FRED: CPIAUCSL, PCEPI. Bloomberg: CPI YOY, PCE Deflator.
• ISM & PMI: ISM official site. Bloomberg: NAPMPMI (Mfg.), NMAPMNON (Services).
• Industrial Production: Federal Reserve G.17 (Mar 2025). FRED: INDPRO. Bloomberg: IP CHNG.
• FOMC Policy Info: Federal Reserve statements and minutes (e.g., Jan 29, 2025). FRED: FEDFUNDS. Bloomberg: FOMC.
• Trade Data: Census Bureau FT900 (Mar 6, 2025). FRED: BOPGSTB. Bloomberg: USBALBS$.
• Global Indicators: IMF World Economic Outlook (Apr 2025). China data: NBS. Eurozone: Eurostat. Bloomberg: ECSTCHIN, GRGRACEZ.
• Adjustments: All data seasonally adjusted unless noted. GDP is shown as annualised QoQ. Monthly indicators are shown MoM unless stated.
• Surveys vs Official: Surveys (e.g., ISM, sentiment indexes) used as directional indicators, not exact measures.
• FRED Series: All time-series data retrieved via Federal Reserve Economic Data (FRED). Codes provided for traceability.
• Bloomberg Codes: Market-relevant Bloomberg codes are included for reference where applicable.
• Forecasts: Based on FOMC Summary of Economic Projections, SPF, and private forecasts.
• Data Access: Primary source sites: bea.gov, bls.gov, census.gov, federalreserve.gov, ismworld.org, ustr.gov.
i Real GDP Growth: BEA, Gross Domestic Product (Quarterly, SAAR). Q4 2024: +2.4%, Q1 2025: ~0% (est.). FRED series: GDPC1 for real GDP level; advance estimate via BEA News Release. Atlanta Fed GDP Now tracking: -2.4% as of Apr 9 (standard model)
ii BLS, Consumer Price Index – All Urban Consumers (CPI-U). March 2025 CPI ~3.0% annualized (Q1), headline CPI around 3% annualized rate; core CPI somewhat higher (~5.3% YoY as of March 2025 estimate).
FRED series: CPIAUCSL (all items SA), CPILFESL (core CPI).
PCE Price Index: BEA, Personal Income and Outlays. Feb 2025 headline PCE +5.0% YoY (est.), core PCE +4.3% YoY (est.)
FRED series: PCEPI (headline), PCEPILFE (core)
iii BLS, Current Population Survey. March 2025: 4.2% (SA). Jan–Mar range: 4.1–4.2%. Broader underemployment (U-6): ~7.9% as of March 2025.
FRED series: UNRATE (U-3), U6RATE (U-6).
iv Worst drop from “Liberation day” Feb 19th, 2025, to April 8th, 2025. YTD as of April 20th, 2025.
v Board of Governors of the Federal Reserve System (US). Federal Funds Effective Rate, 4.33% as of April 2025. FRED, Federal Reserve Bank of St. Louis. Accessed April 20, 2025. https://fred.stlouisfed.org/series/FEDFUNDS
vi Trump, Donald J. Executive Order 14257 of April 2, 2025: Regulating Imports With a Reciprocal Tariff To Rectify Trade Practices That Contribute to Large and Persistent Annual United States Goods Trade Deficits. Federal Register 90, no. 65 (April 7, 2025): 15041–15109.
vii Xiao, Josh. “China Raises Tariffs on US Goods to 125% in Retaliation.” Bloomberg, April 11, 2025. https://www.bloomberg.com/news/articles/2025-04-11/china-raises-tariffs-on-us-goods-to-125-in-retaliation.
viii As of April 20th, 2025.
ix Yahoo Finance. US Dollar Index (DX-Y.NYB). Accessed April 20, 2025.
x McGeever, Jamie. “Trading Day: Tariff Relief, but How Brief?” Reuters, April 14, 2025.
xi Trading Economics. “United States Industrial Production.” Accessed April 20, 2025. https://tradingeconomics.com/united-states/industrial-production.
xii Trump, Donald J. “Presidential Memorandum on America First Trade Policy.” The White House, January 20, 2025. Available at: https://www.whitehouse.gov/presidential-actions/2025/01/america-first-trade-policy/.
xiii Board of Governors of the Federal Reserve System. “Federal Reserve issues FOMC statement.” March 19, 2025. https://www.federalreserve.gov/newsevents/pressreleases/monetary20250319a.htm.


Insearchforthewinningracehorse-the�rst100daysofthe Trumppresidencyhavecreatednear-termturmoilascompanies rush to adapt. However, this has created an opportunity for innovativecompaniestoemergeasgainersfromthevolatility As tari� impacts trickle down, consumerhealthcontinuestobear thebruntofmacroeconomicuncertaintyaslarge-caphealthcare companiesshedunderperformingsegmentswhilekeepingwatch foropportunisticacquisitions.
Regulatory spotlight: despite supply chain diversification and domestication efforts during COVID-19, a substantial amount of Active Pharmaceutical Ingredients (APIs) and 48% and 13% of finished medications are manufactured in India and China, respectively Generics heavily reliant on Chinese APIs are projected to have at least a 10% cost increase Imposing 25% tariffs on Mexico, the top exporter of medical goods to the United States, will significantly increase medical device costs (69% manufactured outside of the US).1 On managed care, CMS announced an average increase of 5.06% in Medicare Advantage payments to plans in CY 2026, pricing in long-overdue inflation adjustments and boosting large insurers Major weight-loss drugs no longer in shortage, producers partnering with telehealth channels (e.g. Wegovy through Hims and Hers) to increase GLP-1 accessibility & adoption.
As policies often turn out to be, liberation day’s consequences come at a critical juncture for generic manufacturing when as many as 170 drugs could lose exclusivity over 2025-30, leaving more than $360 billion of US and EU large drugmakers' annual sales exposed to generics. Split between biologics and easily-replicable small molecules (40% of expiring patents), consensus sees up to $140 billion in sales erosion through 2030. Additionally, shifting manufacturing to India due to significant cost-savings (consensus view of India-based generic pharmaceuticals generating over half of generics revenue by 2030, from 27% in 2011, largely with declines in European and Israeli manufacturers who focus more on branded drugs, could present significant cost-saving opportunities
Fig.11-yearS&P500vs.Vanguard HealthcareETF–Healthcarediverged post-electionsbutnowfollowsbroadermarket
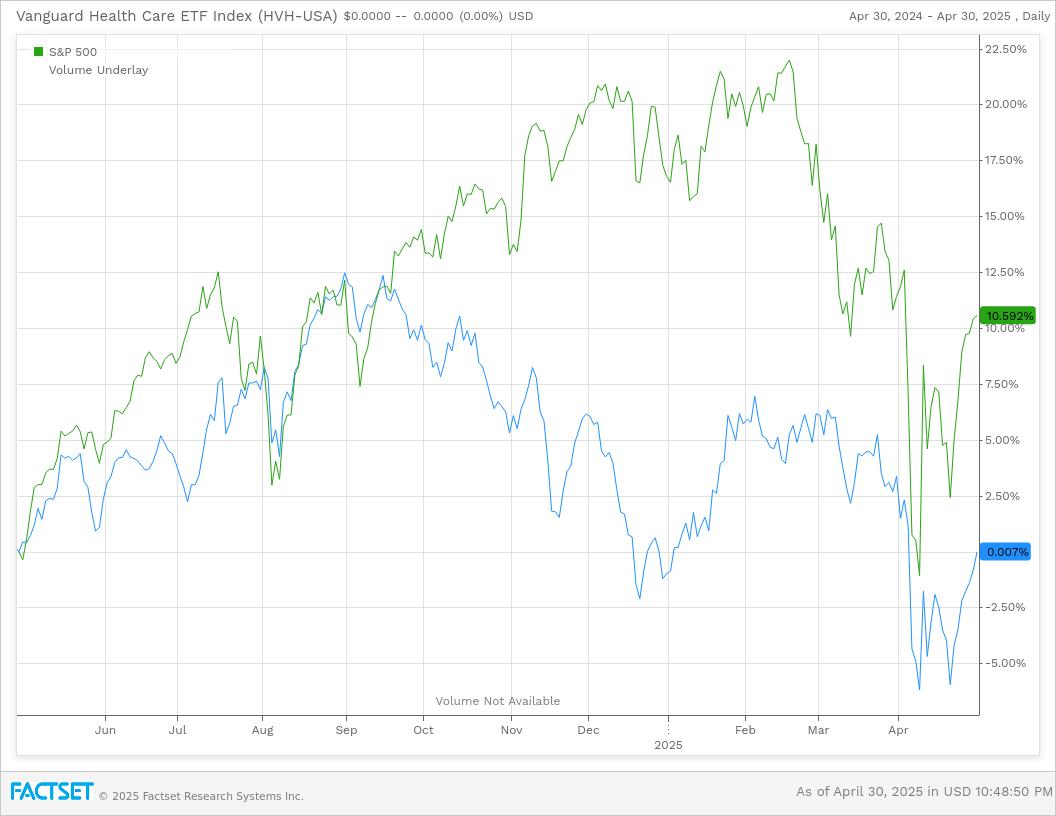
Fig.2CountryshareofUSpharmaceutical importsbyyear–ChinaandIndiamakeup 576%ofUnitedStatesPharmaceuticalImports, accordingtotheCPA
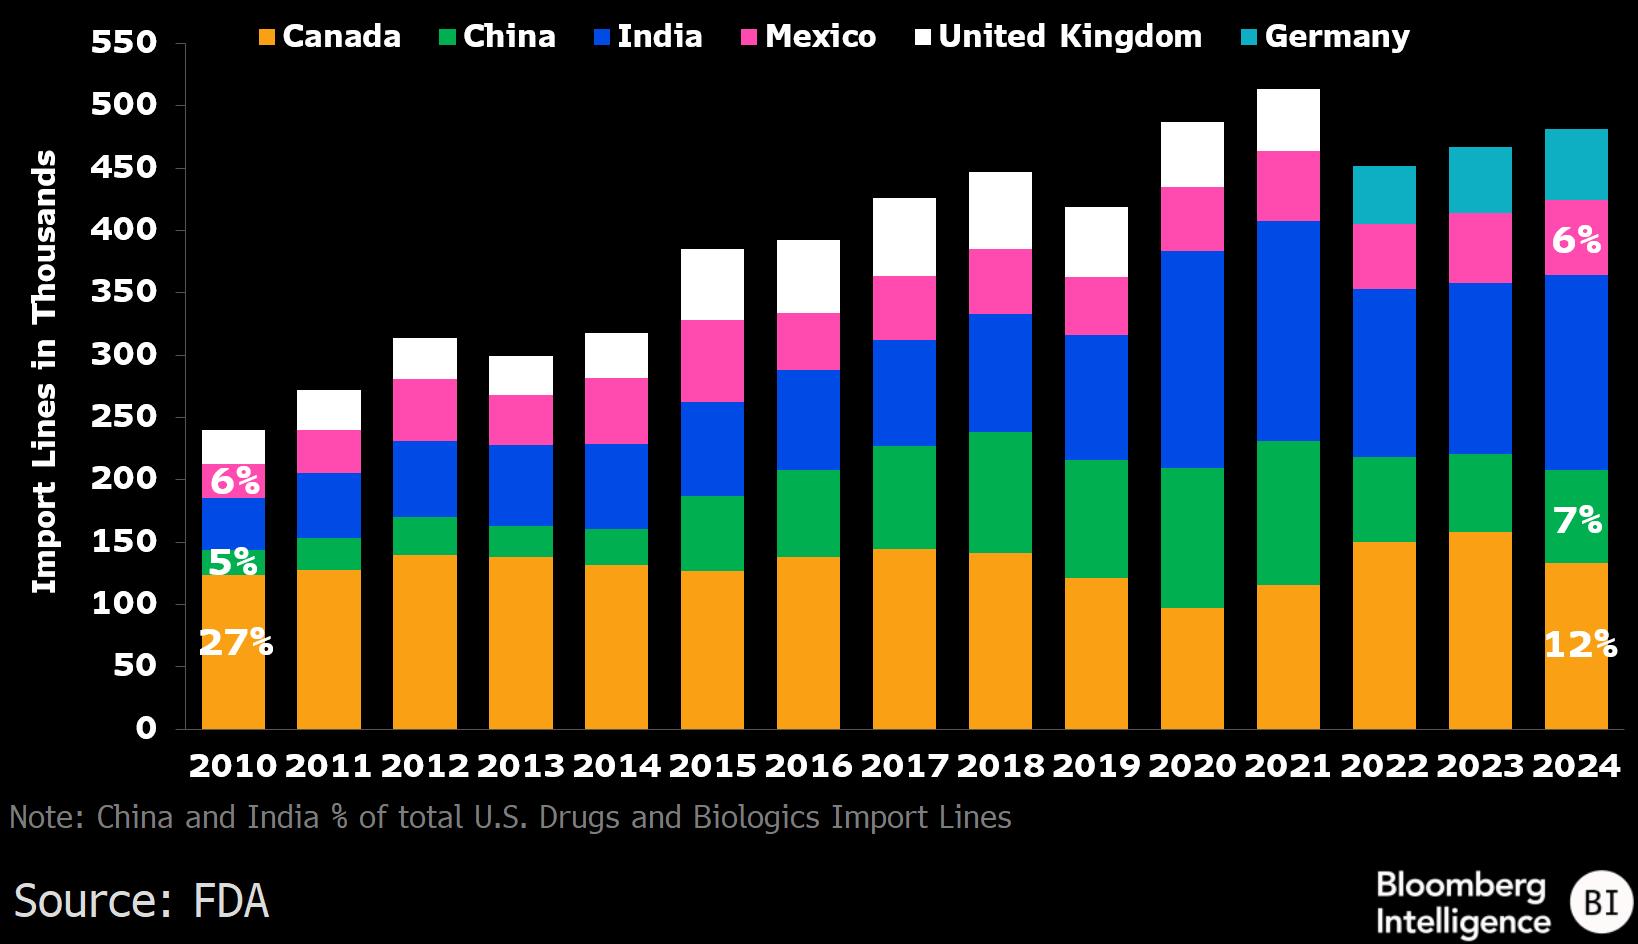
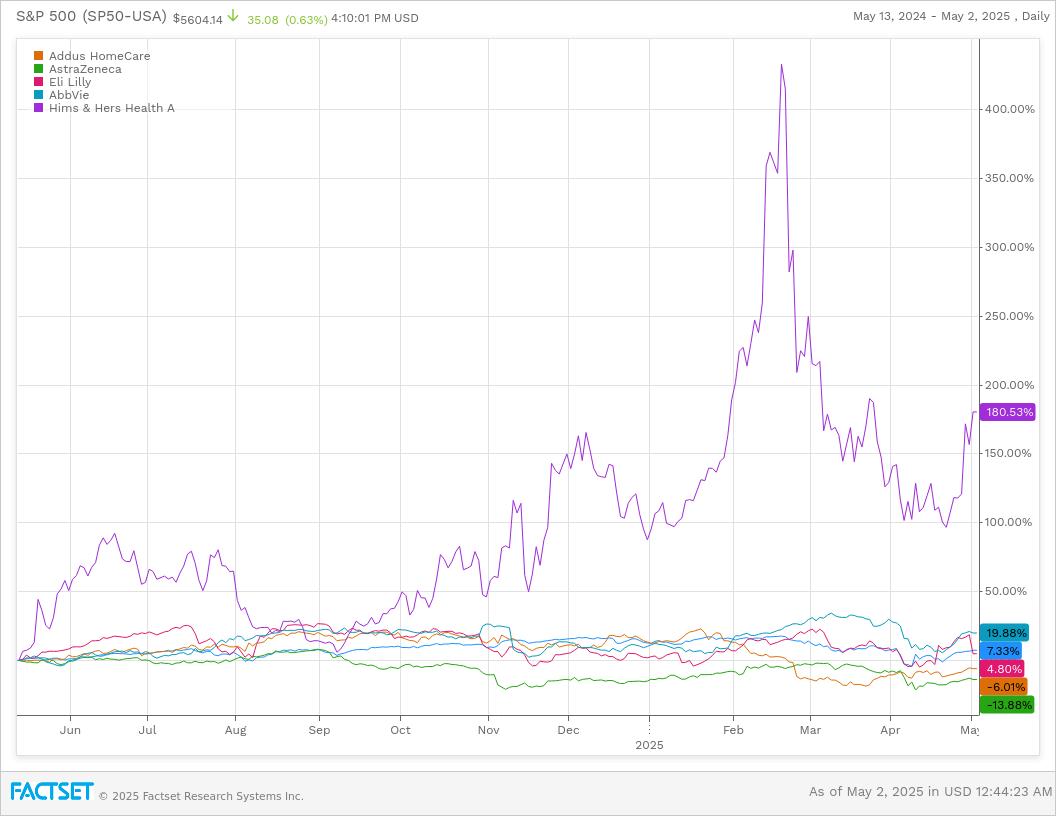
Fig.3Licensingdealsbycompanythoughthe number dealshavelargelydeclinedsince2021,deal sizehasincreasedespeciallywithChinesepartners
Despite these tailwinds, this trend needs to be weighed against disrupted supply chains, which will have an outsized impact on generic drugs due to their lower margins, and potential for increased regulatory scrutiny on FDA biosimilar and generics approval, leading to confounding factors that may end up giving large cap pharmaceuticals more time to extend their patents 2
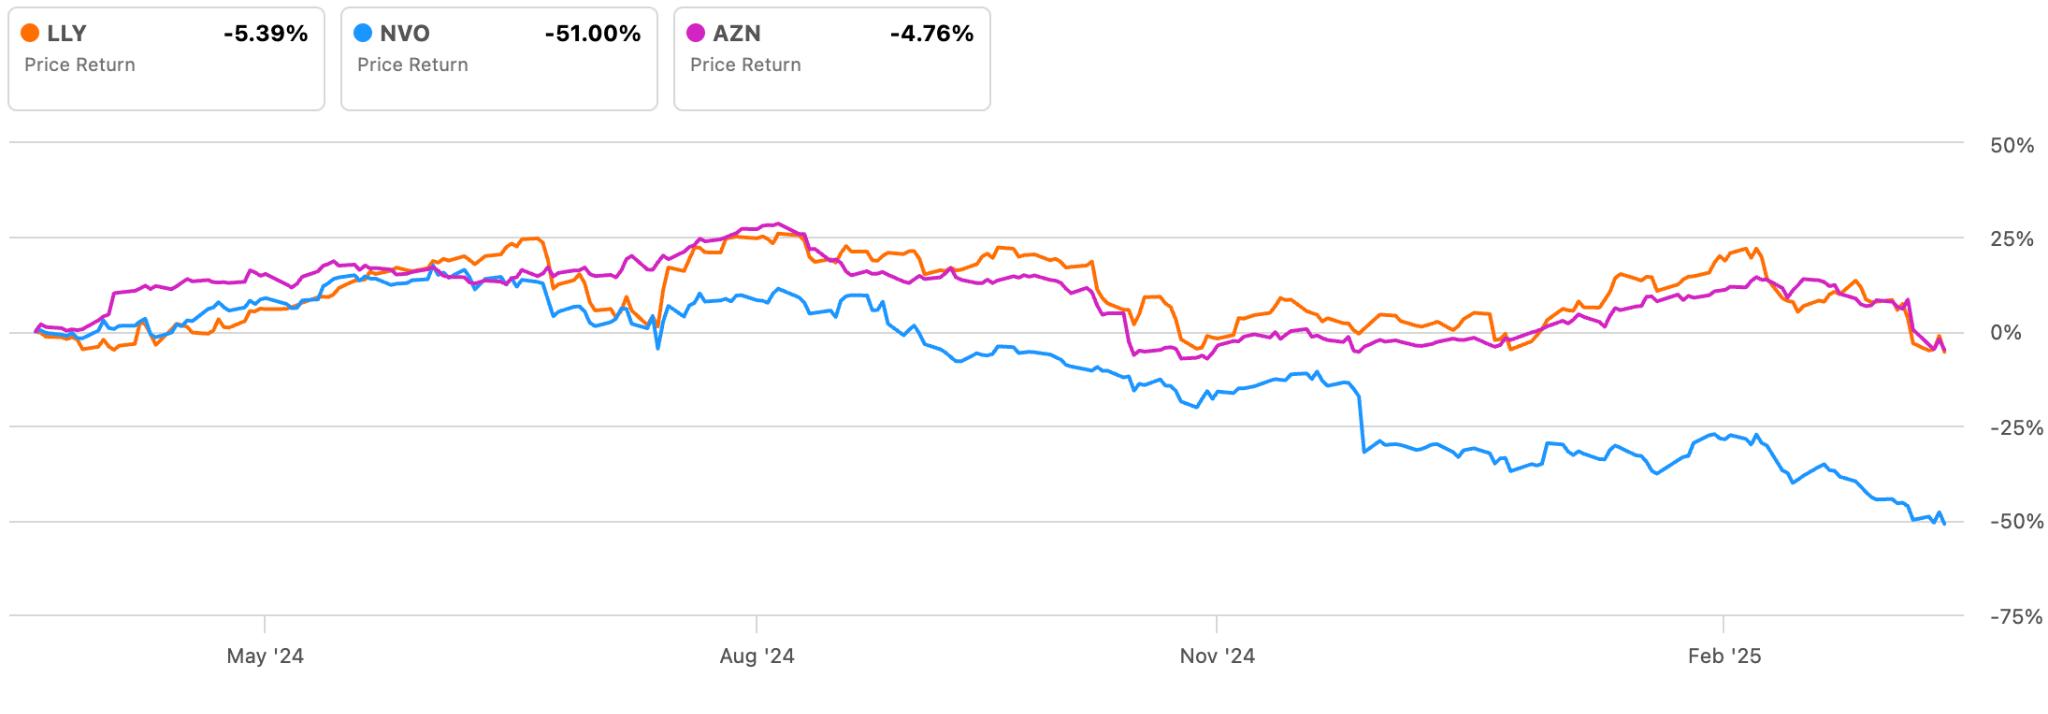
On our coverage, pharmaceuticals are in focus this semester with AbbVie, Eli Lilly, and AstraZenaca vying for a piece of the GLP-1 pie among other therapies. As the FDA announced that Wegovy and Zepbound were no longer in shortage, pharmaceutical companies are filling in manufacturing gaps with in-house manufacturing and licensing agreements (e.g. AbbVie with Denmark-based Gubra A/S) as well as experimenting with different methods of administration (Novo Nordisk’s recent application for FDA approval for an orally-administered GLP-1 therapy). As the space gets more diversified, pharmaceutical companies are also partnering with novel channels, such as telehealth companies like Hims and Hers, which soared on April 29 after announcing a partnership with Novo Nordisk to carry Wegovy, increasing the accessibility of weight-loss drugs to the general public Finally, CMS’s proposed 2025-2026 rate increase of 5% is finally giving payors the inflation-adjusted rate they need, and those with the savvy to navigate the regulatory environment and take advantage of M&A opportunities like Addus HomeCare will continue to win share.
Private markets to take on the risk of consumer weakness - there has been a flurry of private market activity as the optimal structure of companies in the industry begins to shift. In early March, Walgreens Boots Alliance announced its take-private by Sycamore Partners for $10 bn, only 10% of its peak market valuation of $100 bn. Due to the lower margins in the consumer business compared to pharmaceutical segments, Sanofi sold a 50% controlling stake in its consumer health business Opella to US private equity firm Clayton, Dubilier & Rice (CD&R) for 10bn euros ($11.4 bn) which closed on April 30.3 This follows J&J’s spinoff of Kenvue and GSK/Pfizer spinoff of Haleon
before, suggesting a long-term trend in large healthcare companies shedding less profitable consumer health businesses As consumers are hit with a tougher macroeconomic environment and sales slump, companies that may want to spin off consumer health or other “noncore” divisions may have limited opportunities to do so at fair valuations Bayer’s stock slumped significantly when management declared the company would not be altering its corporate structure, coinciding with a 3Q24 earnings miss and underperformance in the noncore sector of Crop Sciences due to pricing headwinds.4
In conclusion, the overall healthcare industry has performed in line with or under market as the magnificent seven and AI-related names took the spotlight in 2024. As we await new clinical trial updates and other catalysts in 2025, macroeconomic headwinds will continue to separate the outperformers.
2 Bloomberg Intelligence
3 https://www fiercepharma com/pharma/sanofi-gaining-eu10b-sale-opella-expect-more-bolt-deals
4 Bloomberg Intelligence
Justin
Li| May 1st, 2025
Rating: Buy
Current Price: $67.59
Price Target: $92.49
Company Updates / News
● Market Cap: $208B
● Beta: 1.25
● EPS: $2.25
● PE Ratio: 33.08x
● 52 Week High: $87.68
● 52 Week Low: $62.75
● AstraZeneca blew past Q4 expectations with a double-digit earnings beat
● Total Revenue Growth: AstraZeneca's total revenue increased by 21% ($54.1 billion)
● Core EPS Growth: Core EPS grew by 19% to $8.21, indicating strong profitability momentum
Competitor Statistics from Q4 2024

EV/EBITDA: 13.8x
Revenue: $85.68B

EV/EBITDA: 6.0x
Revenue: $11.73B

EV/EBITDA: 7.2x
Revenue: $12.34B
Investment Thesis:

AstraZeneca is a British-Swedish global biopharmaceutical company specializing in the discovery, development, and commercialization of prescription medicines across five key therapy areas: oncology, biopharmaceuticals (cardiovascular, renal & metabolism, and respiratory & immunology), rare diseases, vaccines & immune therapies, and infectious diseases
Though one of the long-standing industry giants, AstraZenaca has not lost its innovative spark Its oncology portfolio, accounting for the largest share of revenue, includes leading cancer treatments like Tagrisso for EGFR-mutated lung cancer, Lynparza for ovarian and breast cancers, and Enhertu, a promising drug for HER2-positive and HER2-low breast cancer, just a few of the life-saving solutions the company has developed over the years. AstraZeneca’s strong future growth prospects come from its entry into the weight-loss drug industry and its expansion in emerging markets, with a focus on China
As of March 13th , 2025, AstraZeneca was trading at $67 59 per share I believe that this equity is undervalued and will increase by 37% to $92.49 within the next year. I conducted a Discounted Cash Flow Analysis with a terminal growth rate of 2 00% and a WACC of 8 92% to arrive at this valuation My assumptions are based upon historical data and an optimistic view of AstraZeneca’s future performance.
AstraZeneca is making a significant move into the high-growth obesity and metabolic disease market with an oral GLP-1 receptor agonist in collaboration with Eccogene, a Shanghai-based small-molecule therapeutics company The GLP-1 drug class, which includes Novo Nordisk’s Wegovy and Eli Lilly’s Zepbound, has seen exponential demand, creating a massive commercial opportunity While AstraZeneca is entering this space later than competitors, its medicine (which may hit the markets as soon as 2026) functions as both a weight loss drug but also a treatment option for Type 2 diabetes By focusing on mitigating the side effects through cardiometabolic disease management, AstraZeneca will be able to provide a safer alternative for the market.
China remains a critical growth driver for AstraZeneca, even as the company navigates regulatory pressures and pricing reforms in the region. Effective January 1st, 2025, AstraZeneca successfully secured National Reimbursement Drug List (NRDL) renewals for major oncology products, including Tagrisso and Calquence, without price cuts Additionally, the company is expanding its footprint in China’s rare disease market, where there is growing demand for innovative treatments While AstraZeneca faces headwinds from regulatory scrutiny over drug imports, it continues to reinforce its market presence through new product launches, expanded indications, and increased investment in local partnerships. With China remaining one of AstraZeneca’s largest markets, its recent legal win to protect its pricing shows both the efficacy of the company’s drugs and secured future growth
Justin Li| May 1st, 2025
AstraZeneca vs. Novo Nordisk Daily % Change in Share Price (YTD)
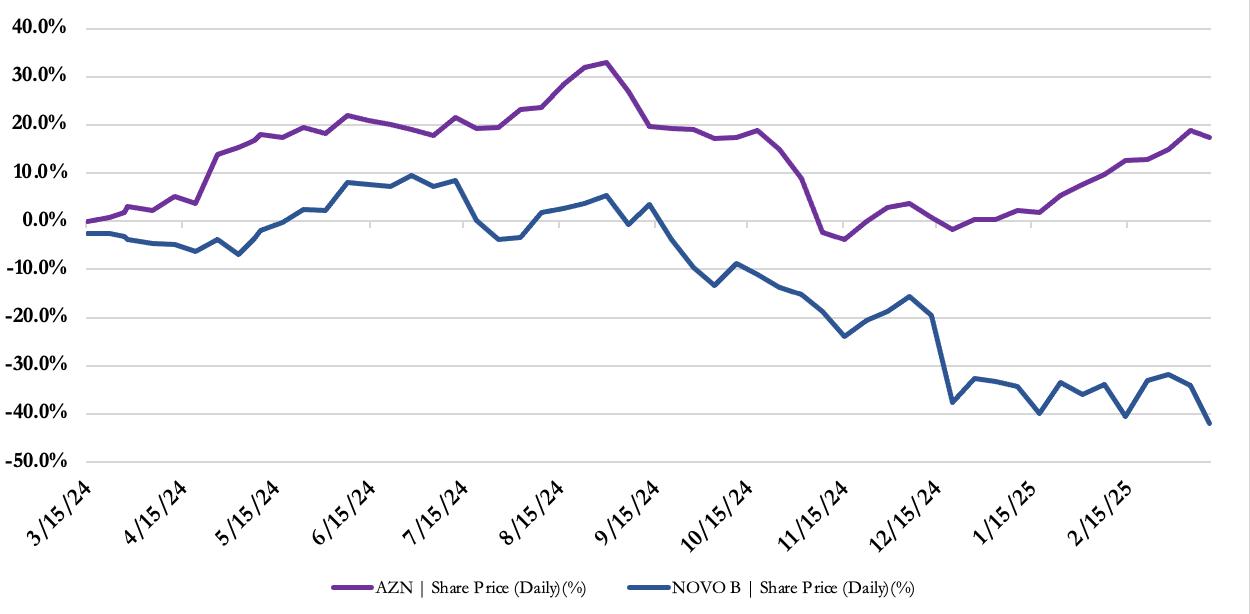
Source: S&P Capital IQ
Risk Potential
Intensifying Competition in the Oncology
AstraZeneca faces growing competition in oncology as various patents (both from the company and from competitors) expire New treatments like biosimilars and next-generation therapies threaten AZN’s core drugs like Tagrisso, Lynparza, and Enhertu To stay ahead, AZN should continue to expand its pipeline, focusing on the seven Phase III readouts in 2025, and investing in next-generation Antibody-Drug Conjugates (ADCs) like Datopotamab deruxtecan (Datroway) through partnerships with Daiichi Sankyo
The Inflation Reduction Act (IRA) introduces Medicare price negotiations, potentially reducing AstraZeneca’s pricing power in the United States To counter this, AstraZeneca should diversify revenue streams, expand in Europe and emerging markets, and focus on specialty medicines and rare disease treatments, such as those in its Alexion portfolio, which are less subject to government price controls and unfavorable price elasticities.
AstraZeneca relies on a complex global supply chain, exposing it to risks from raw material shortages, trade restrictions, and regulatory delays. Under the Trump administration, there is concern regarding potential trade wars and cost increases as a result. To hedge against these risks, AstraZeneca can consider diversifying suppliers and expanding in-house manufacturing. This will allow AstraZeneca to form its own efficient, robust supply chain.
Sources:
AstraZeneca IR | Bayer IR | Novo Nordisk IR |BMS IR |Capital IQ
Laurent Vo| April 26, 2025
Rating: BUY
Current Price: $186.06
Price Target: $210.12
● Market Cap: $330B
● Beta: 0.54
● EPS: 2.46
● PE Ratio: 15.3x
● 52 Week High: 218.66
● 52 Week Low: $153.58
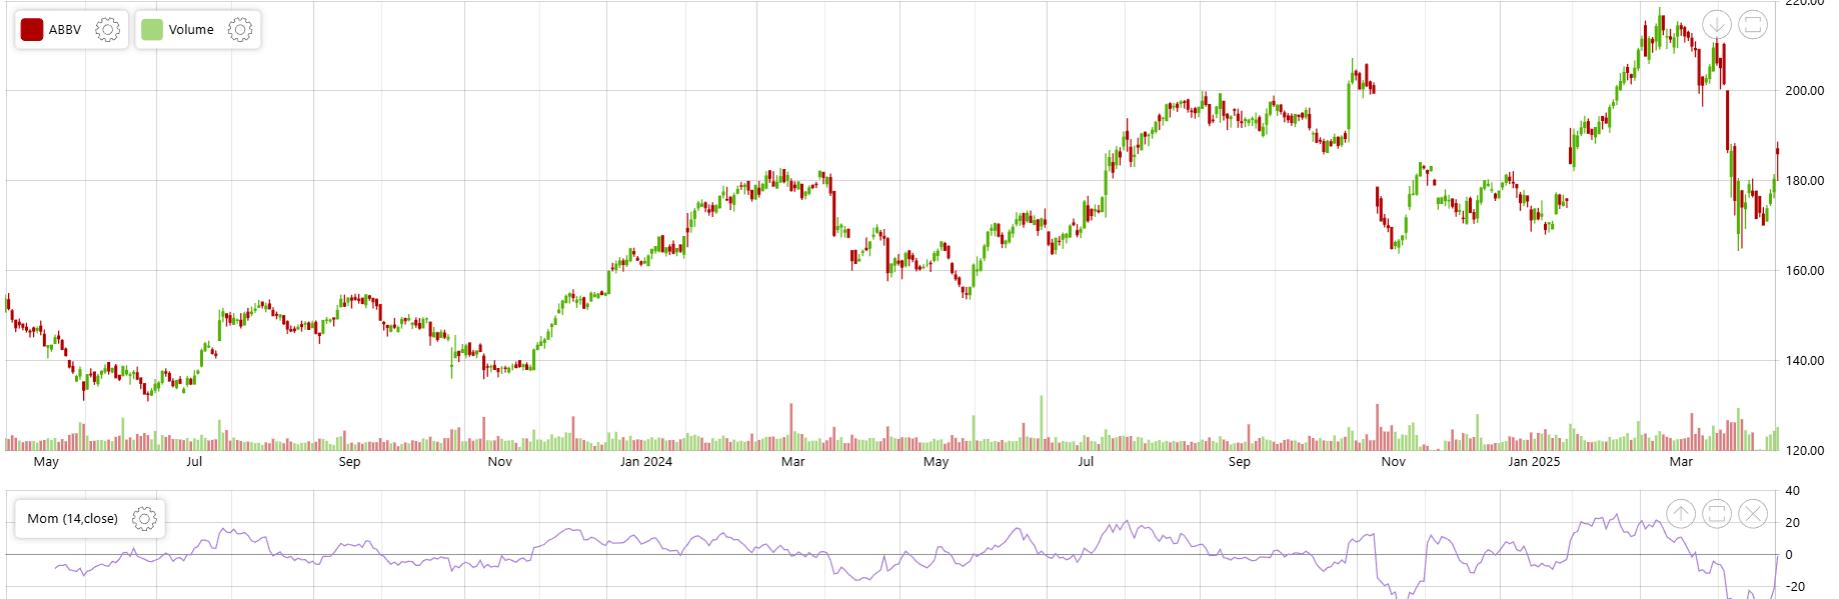
● AbbVie Q1 Revenue Beats Estimates on Strong Immunology Growth
● AbbVie Raises Full-Year 2025 Earnings Guidance Amid Skyrizi and Rinvoq Momentum
● AbbVie Expands Neuroscience Pipeline Despite Emraclidine Setback
Competitor Statistics from Q1 2025

EV/EBITDA: 9.55
Revenue: $14.58B

EV/EBITDA: 12.46
Revenue: $21.89B

EV/EBITDA: 8.57
Revenue: $15.5B
Investment Thesis:
AbbVie (NYSE: ABBV) is a US -based biopharmaceutical company with a diversified portfolio of therapies spanning immunology, oncology, neuroscience, and aesthetics. Following the patent expiration of its flagship rheumatoid arthritis drug Humira, AbbVie has strategically shifted focus to its newer immunology drugs, Skyrizi and Rinvoq, which have demonstrated robust growth and are expected to generate over $31 billion in combined sales by 2027
In Q1 2025, AbbVie reported an 8.4% year-over-year increase in revenue to $13.34 billion, driven by a 70 5% rise in Skyrizi sales and a 57 2% increase in Rinvoq sales Adjusted EPS for the quarter was $2.46, surpassing expectations and leading management to raise its full-year EPS guidance to a range of $12 09–$12 29 AbbVie is also investing $10 billion in US manufacturing over the next decade, including the construction of four new facilities, to mitigate potential risks from proposed pharmaceutical tariffs and to strengthen its domestic supply chain
Given AbbVie's strong performance in its immunology portfolio, strategic investments in domestic manufacturing, and proactive approach to offsetting Humira's decline, I issue a Buy recommendation with a price target of $210.12.
The company’s revenue for Q1 reached $13 34 billion, marking an 8 4% year-over-year increase, driven by a 70 5% rise in Skyrizi sales and a 57 2% increase in Rinvoq sales. Together, these two drugs contributed approximately $5.1 billion to the quarter’s revenue base
Adjusted earnings per share (EPS) stood at $2 46, reflecting a 6 5% year-over-year increase and surpassing expectations. Adjusted gross margins held strong at 84.1%, with an operating margin of 42.3%, reinforcing AbbVie's efficiency even as it invests heavily in next-generation therapies and US manufacturing capacity
AbbVie’s current P/E ratio sits around 15 3x, which is modest compared to large-cap healthcare peers, indicating potential undervaluation relative to earnings strength. The company's dividend yield of 3 64% remains attractive, particularly given its strong free cash flow profile and consistent payout history
Using a DCF valuation model incorporating modest revenue growth of 4 5% through 2029, stable operating margins, and a WACC of 8.0%, I came to an implied share price of around $210.12 for AbbVie This represents approximately 13% upside from the current price of $186. The DCF model reflects confidence in AbbVie's next phase of revenue driven from its new pipeline assets, offsetting Humira’s decline.
AbbVie’s strategic $10 billion domestic manufacturing expansion over the next decade, paired with its strong immunology growth engine, positions the company for both defensive resilience and upside capture within the healthcare sector.
Sources: Abbvie| Capital IQ | Yahoo Finance |Reuters | WSJJournal| S&P Global | UtilityDive | Barrons | Investors
Laurent Vo| April 26, 2025
Source: CSIMarket
In November 2024, AbbVie faced a significant setback when its experimental schizophrenia drug, Emraclidine, failed to meet primary endpoints in two Phase 2 trials This led to a $3 5 billion impairment charge and a 12% drop in the company's stock price. The failure not only impacts AbbVie's neuroscience ambitions but also raises concerns about the company's acquisition strategy, particularly the $8 7 billion purchase of Cerevel Therapeutics aimed at bolstering its central nervous system pipeline
AbbVie has entered the obesity treatment market through a licensing agreement with Denmark-based Gubra A/S, valued at up to $2 23 billion The deal focuses on developing an amylin-based therapy, a novel approach compared to existing GLP-1 treatments. While initial Phase 1 trials showed promising results, with patients achieving a 3% average weight loss, the company faces stiff competition from established players like Novo Nordisk and Eli Lilly The success of this venture will depend on further clinical validation and market acceptance
The current US administration's proposed pharmaceutical tariffs pose a potential risk to AbbVie's international operations In response, AbbVie has committed to investing over $10 billion in US manufacturing over the next decade, expanding its domestic footprint with four new facilities . This proactive move positions AbbVie ahead of some competitors; for instance, Pfizer has expressed intentions to increase US investments but is currently holding back due to tariff uncertainties While companies like Merck and Eli Lilly have announced significant U.S. investments , $1 billion and $27 billion respectively, their projects are either in early stages or spread over longer timelines . AbbVie's aggressive approach not only mitigates potential tariff impacts but also aligns with its strategic expansion into areas like obesity treatment However, the substantial capital expenditure and the time required to operationalize new facilities could pose near-term headwinds to earnings. Continuous monitoring is essential as the competitive landscape and policy environment evolve
Sources: Abbvie| Capital IQ | Yahoo Finance |Reuters | WSJJournal| S&P Global | UtilityDive | Barrons | Investors
Amy Zhang| April 17, 2025
Rating: Buy
Current Price: $26.81
Price Target: $32.47
Company Updates / News
● Market Cap: $5.96B
● Beta: 1.65
● EPS: 0.53
● PE Ratio: 50.58
● 52 Week High: $72.98
● 52 Week Low: $11.20
● A Super Bowl ad in Q1 2025 reached 115M viewers and drove a 37% QoQ increase in site traffic and 25% YoY growth in customer signups
● Shares fell after the FDA banned compounded semaglutide, which made up $230M of 2024 revenue
● Hims has since announced it will offer FDA-approved GLP-1 drugs, preserving its weight loss revenue stream
Competitor from Q1 2025

Revenue: $184.41M

Revenue: $750M

Company Overview: Hims & Hers Health, Inc. (NYSE: HIMS) is a leading direct-to-consumer telehealth platform offering personalized treatments across categories like mental health, dermatology, sexual health, and weight management. My buy recommendation is supported by two: first, core business performance remains robust excluding GLP-1 products, 2024 revenue grew 43% year-over-year to over $1.2 billion, signaling strong demand for its broader portfolio. Second, Hims & Hers continues to lead the personalized healthcare space, capturing an estimated 47% market share in 2024 While recent investor sentiment has weakened due to the FDA’s declared end to the semaglutide shortage effectively banning further production of HIMS’s compounded versions that generated $230 million in revenue for the company in 2024 – HIMS’s scalable model, strong brand, and continued focus on tailored treatments position it well for long-term growth, regardless of near-term regulatory headwinds
As of April 10th, 2025, Hims & Hers Health, Inc (NYSE: HIMS) was trading at $26 81 per share I believe that this equity is slightly undervalued and has the potential to reach $32.47 within the current year. I conducted a Discounted Cash Flow Analysis with a terminal growth rate of 3.00% and a weighted average cost of capital (WACC) of 11 7% My assumptions are based on the company’s historical performance and an optimistic outlook on Hims & Hers’ future growth in personalized prescription healthcare and consumer-driven weight management solutions
Revenue Growth: Hims & Hers’ core business remains strong, even excluding GLP-1 products, with total revenue reaching over $1 2 billion in 2024, representing 43% year-over-year growth. This performance was largely driven by a 172% increase in personalized healthcare subscribers and a 95% increase in total revenue in Q4 alone The company continues to expand its user base through multi-channel brand development, partnerships, and brand ambassadors. Notably, strategic marketing initiatives, including high-visibility campaigns like their Super Bowl ad, significantly enhanced brand visibility and customer acquisition, contributing to the surge in subscribers and revenue. Additionally, Hims & Hers has successfully boosted revenue per subscriber through increased multi-month adoption, proprietary product usage, and a growing breadth of offerings. Investments in clinical excellence, customer experience, and personalized content have contributed to strong subscriber retention and engagement As monthly online revenue per subscriber climbed from $55 in Q1 to $73 in Q4, Hims & Hers' ability to scale both acquisition and monetization reflects the strength of its consumer health platform and long-term growth potential
Weight Loss Category: Hims & Hers is taking deliberate steps to solidify its long-term leadership in the weight loss category, even after the FDA’s decision effectively halted sales of compounded semaglutide. The
Amy Zhang| April 17, 2025

Revenue: $750M
company has swiftly expanded its portfolio to include FDA-approved alternatives, most notably announcing the addition of Eli Lilly’s blockbuster GLP-1 drug Zepbound to its platform. Looking ahead, Hims & Hers plans to launch liraglutide—the first generic GLP-1 solution—by 2025, while continuing to grow its range of oral-based treatments that target the root causes of weight gain, including insulin resistance and metabolic disorders. These offerings, available at price points as low as $69 per month, allow the company to serve a broader population while reducing reliance on any single product. Backed by strong provider access, proprietary tools, and a data-driven approach to personalization, Hims & Hers has built a highly retentive subscriber base and is well-positioned to lead in the fast-growing digital weight loss space.
Hims & Hers Revenue for the Past Two Years
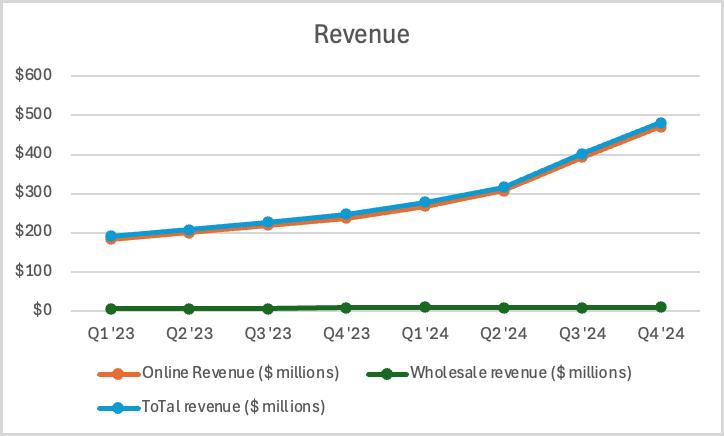
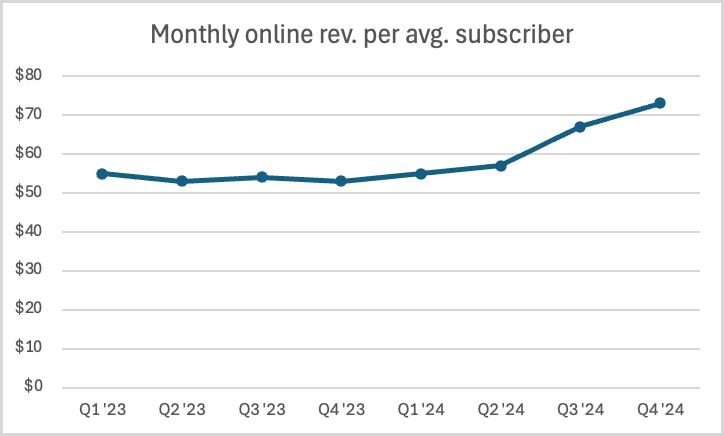
Source: Hims & Hers Investors Presentations
Risk Potential
Competitor Retaliation: A growing risk for Hims & Hers is potential lobbying by traditional healthcare players seeking to limit access to high-margin drugs like GLP-1s through tighter distribution controls. If successful, such efforts could restrict the company’s ability to offer key treatments directly to consumers. To safeguard access, digital health firms may need to engage policymakers and industry stakeholders amid increasing competitive pressures.
Macroeconomic Volatility: Another risk is increased stock volatility during a market downturn. As a high-growth company, Hims & Hers may face outsized declines even though its fundamentals remain strong, driven by steady subscriber growth, rising revenue per user, and demand for affordable, subscription-based care. While macro-driven selloffs may not reflect business performance, they could still affect short-term returns and investor confidence.
Sources: Hims.com | Seeking Alpha | Yahoo Finance | Capital IQ | Robinhood
Laura Zhai | April 9th, 2025
Rating: BUY
Current Price: $753.71
Price Target: $778.16
Company Updates / News
● Market Cap: $714.51B
● Beta: 0.5
● EPS: 11.49
● PE Ratio: 62.75
● 52-Week High: $972.53
● 52-Week Low: $677.09
● For the full year 2025, the company has provided an estimated revenue growth between $58 billion and $61 billion, representing approximately 32% growth compared to 2024
● Plans to launch its diabetes and weight-loss drug, Mounjaro, in major emerging markets like India, Brazil, and Mexico in the second half of 2025.
Competitor Statistics from Q4 2024

EV/EBITDA: 13.8

Investment Thesis:
Founded in 1876 in Indiana, Eli Lilly and Co has become one of the leading pharmaceutical companies, operating globally with plans for continued expansion. It invents, develops, and manufactures medicines that address four key categories: cardiometabolic health, oncology, immunology, and neuroscience. It invests heavily in R&D and often collaborates with and/or acquires other pharmaceutical and biotechnology companies to develop innovative products. Ultimately, its main source of revenue comes from patents and other forms of intellectual property rights.
Supported by a healthy balance sheet, pricing power, and operational scale, Eli Lilly and Co. has demonstrated great potential for growth. Its rapid expansion in the weight loss and diabetes markets, coupled with its strategic plans for global penetration, further strengthens its long-term outlook.
As of April 9th, 2025, Eli Lilly and Co. is trading at $753.71 per share. I believe that the security is undervalued; I conducted a Discounted Cash Flow Analysis with a weighted average cost of capital (WACC) of 9% and a terminal growth rate of 3% across five years. My assumptions are based on Eli Lilly and Co.’s historical data, an overall optimistic view of Eli Lilly and Co’s future performance, and industry analysis I came to a valuation of $778 16, suggesting a 3 3% undervaluation of the current stock price.
In February 2025, President Donald Trump announced the US would impose tariffs starting at 25% on pharmaceutical imports In response, Eli Lilly and Co decided it will invest at least $27 billion in building four manufacturing plants within the US over the next five years. This would reduce reliance on production overseas and mitigate trade barriers The company’s swift tariff response also reflects its adaptability and forces increased capital investment, which demonstrates strong financial support.

R EV/EBITDA: 14.01
Revenue: $54.1B
In the fourth quarter of 2024, Eli Lilly and Co. reported $13.53 billion in revenue, a 45% increase year-over-year This robust growth can be largely attributed to the success of its diabetes and obesity treatments with its GLP-1 receptor agonists, Monjaro and Zepbound; sales of Monjaro reached $3.53 billion, while Zepbound brought in $1 9 billion, contributing to about 40 13% of the total revenue in Q4 The obesity treatment market is expected to display substantial growth, estimated to reach $173 5 billion by 2031 While there are strong competitors, such as Novo Nordisk (the maker of Ozempic/Wegovy), Lily’s Zepound has shown superior weight loss results and a more reliable supply chain capacity to meet demand. Therefore, Lilly plans to utilize this momentum to expand further and launch its blockbuster weight loss drugs in underpenetrated markets in Europe and Asia.
Laura Zhai | April 9th, 2025
Source: Seeking Alpha
Potential Regulatory Challenges
The Trump administration has decided to exclude Medicare coverage for weight-loss medications, which include Eli Lilly’s Zepbound. This would limit access for more than 20 million Medicare beneficiaries, leading to significant losses in sales Additionally, the recent appointment of Robert F Kennedy Jr as Secretary of Health and Human Services, given his skepticism toward pharmaceutical practices, could signal stricter regulations This shift may prolong drug approval processes
The financial burden imposed by substantial tariffs on imports may require Eli Lilly to reduce its research and development budgets, which may hinder innovation. Eli Lilly and Co relies heavily on global markets for the production of its drugs Although it has plans to invest in domestic manufacturing, these new facilities can take several years to become operational. This suggests that the increase in operational costs from the tariffs would pose potential threats to its profit margins, R&D spending, and long-term innovation capacity.
In addition to Novo Nordisk, AstraZeneca has also become a close competitor of Lilly. It is quickly entering the obesity treatment market with its oral GLP-1 receptor agonist that was developed with the support of China’s Eccogne. Although it is only in Phase 3, this treatment in the form of a pill could differentiate it from Zepbound, an injectable treatment. This could pose a major threat as pills provide greater convenience. Furthermore, following Eli Lilly’s promising trial results for a lipoprotein(a)-lowering treatment for cardiovascular diseases, AstraZeneca announced its plan to invest $100 million into a heart-disease drug from CSPC Pharma. This move highlights AstraZeneca’s intent to directly outpace Lilly’s cardiovascular innovations.
Sources: https://www.lily.com| NY Times| Yahoo Finance | Morning Star |CNN | Capital IQ | CNBC | StockInvest.US | Seeking Alpha
The first five months of 2025 have been nothing short of historic. Between the political pushback on renewable energy, the theoretical future, and President Trump igniting a global trade war between all global superpowers during America’s “Liberation Day”, there has been no shortage of volatility in the energy markets thus far.
The present state of the global energy sector reveals a tug-of-war between the long-time preached renewable energy and the immediate headwinds generated by political shifts and economic reassessments caused by a turmoil filled first 100 days in office of President Trump's second term.. Much like historical trends that never follow a straight line, the current energy landscape suggests a more circular route than many envisioned. The once seemingly assured decline of fossil fuels now faces a recalibration in light of evolving political priorities, a renewed scrutiny of renewable energy's fundamental economics, as well as the new understanding of how complex it is to transition the entire globe away from the fuel that powers it..
A notable shift in political winds in the United States, with a clear leaning back towards traditional energy sources, has undeniably plummeted the renewable energy narrative. The scaling back of subsidies and tax incentives, critical for the financial viability of solar, wind, and other green technologies, casts a shadow over their future expansion. This policy adjustment finds common ground within the financial community, where influential voices, not least the activist stance of firms like Elliott Management, are increasingly questioning the core profitability of renewable projects without sustained government support and putting their money where their mouth is. One of the most covered positions in the energy sector this year has been the activist hedgefund’s attempt to turn around oil legend British Petroleum (BP). This heightened skepticism, alongside a renewed political appetite for easing regulations on oil and gas, paints a complex picture for where future energy investment will flow.
Across the Atlantic, the recent and dramatic power outages that crippled Spain and Portugal serve as a stark reminder of the intricate challenges inherent in transitioning to a grid reliant on intermittent renewable sources While advocates point to the urgent need for substantial upgrades in grid infrastructure and energy storage to seamlessly integrate these cleaner electrons, the immediate reaction has been a resurgence of doubt among those who remain
ThomasBailey
May1st,2025
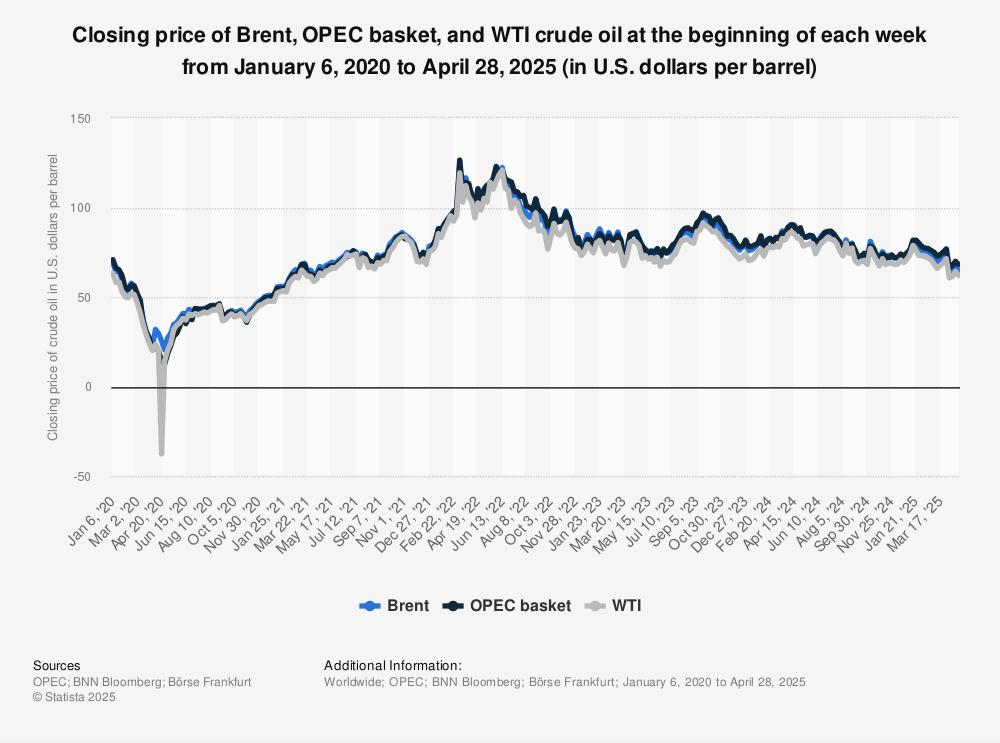
Brent, OPEC basket, and WTI crude Jan 2020 to April 28th 2025 in US Dollars
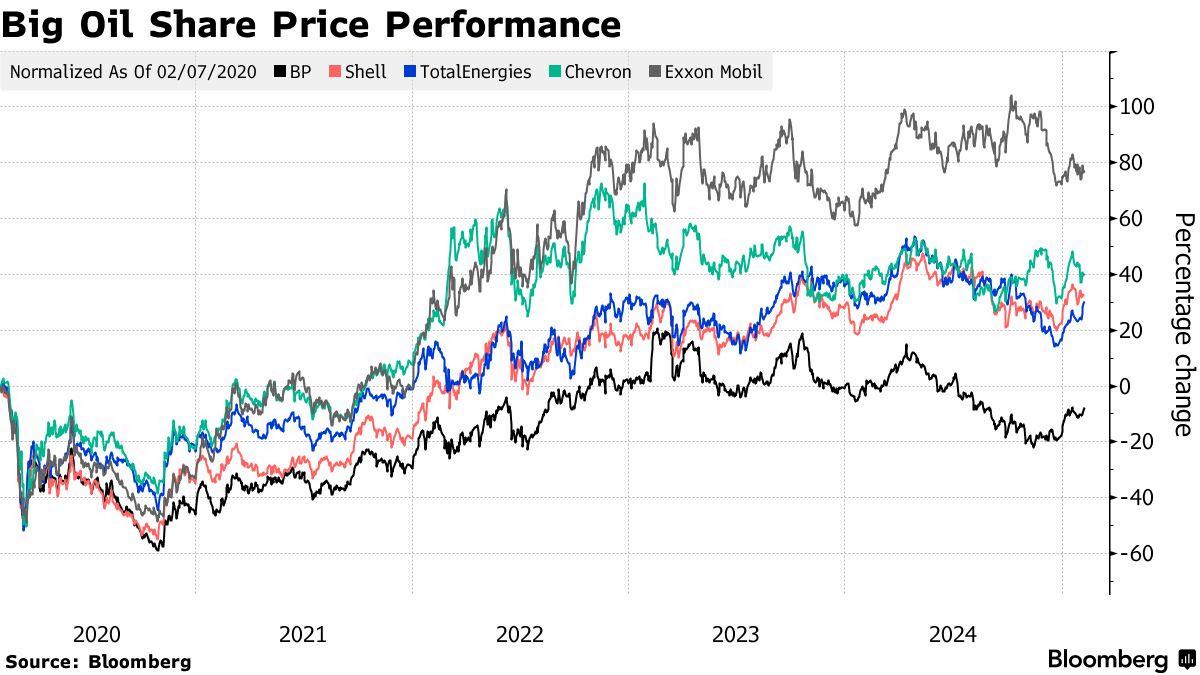
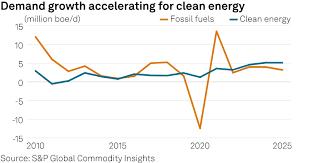
Demand Growth Oil vs Clean Energy
unconvinced about a rapid departure from dependable, dispatchable power This European disruption, though its roots are multifaceted, offers a tangible case study for those who question the inherent stability of an energy system dominated by renewables Unfortunately for those hoping to protect our climate, this does nothing but add coal to the furnace of the Trump train and oil fanatics.
Furthermore, the current US administration's approach to international trade, as demonstrated by the imposition of tariffs, creates a broader obstacle for the entire energy sector which bolsters the most important global supply chain in terms of the effect on everyday life. These protectionist measures, while ostensibly intended to bolster domestic industries, invariably drive up the costs of imported components essential for both renewable energy installations and traditional energy projects, thereby hindering their deployment and disrupting established global supply chains. This more insular trade stance ultimately undermines the very efficiency and innovation that have historically propelled the energy industry forward. It is not only Trump that has transitioned towards a world of national self sufficiency in energy, but he surely forced the trend into parliaments and government buildings across the globe
On another note, a significant environmental challenge unfolding in West Texas, the heartland of US oil and gas production, underscores the often-overlooked interconnectedness within the energy ecosystem. Twenty million barrels of water per day are produced as the byproduct of oil production with underground storage nearing its limit. This growing water management problem poses a tangible threat to the sustained output from this vital region, highlighting the urgent need for innovative and sustainable solutions to address the environmental consequences of energy extraction. The water itself is not clean nor drinkable, furthering the challenge, but can be processed or used in non edible crops such as cotton.
To summarize, the present state of energy is characterized by a significant reevaluation. The once-predicted swift ascent of renewables now encounters tangible political resistance and economic skepticism, while the inherent vulnerabilities of a rapidly transforming grid have been starkly illuminated. The intertwined challenges of trade policy and resource management add further layers of complexity to the path ahead. The confident projections of a straightforward energy transition now appear to be navigating a far more intricate and uncertain terrain.
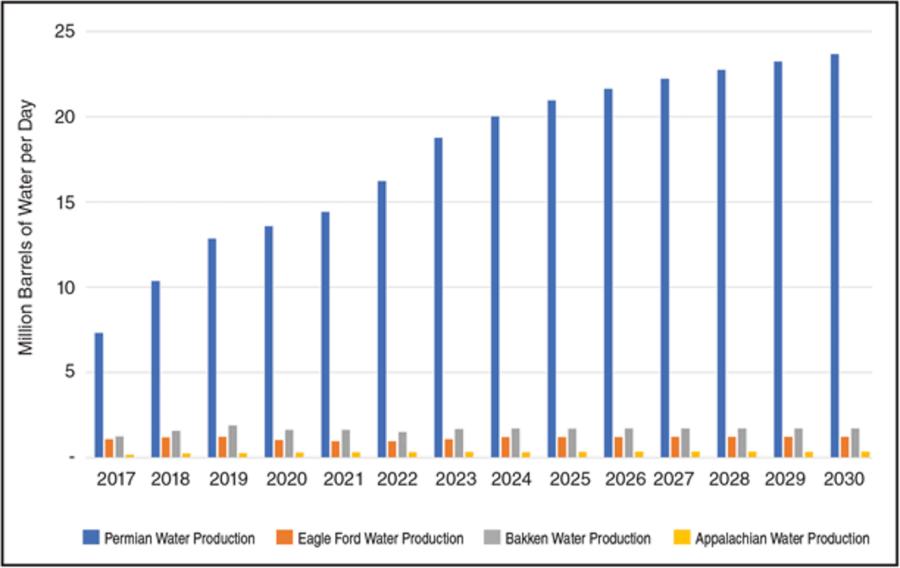
Water production in west Texas as a byproduct to oil production.
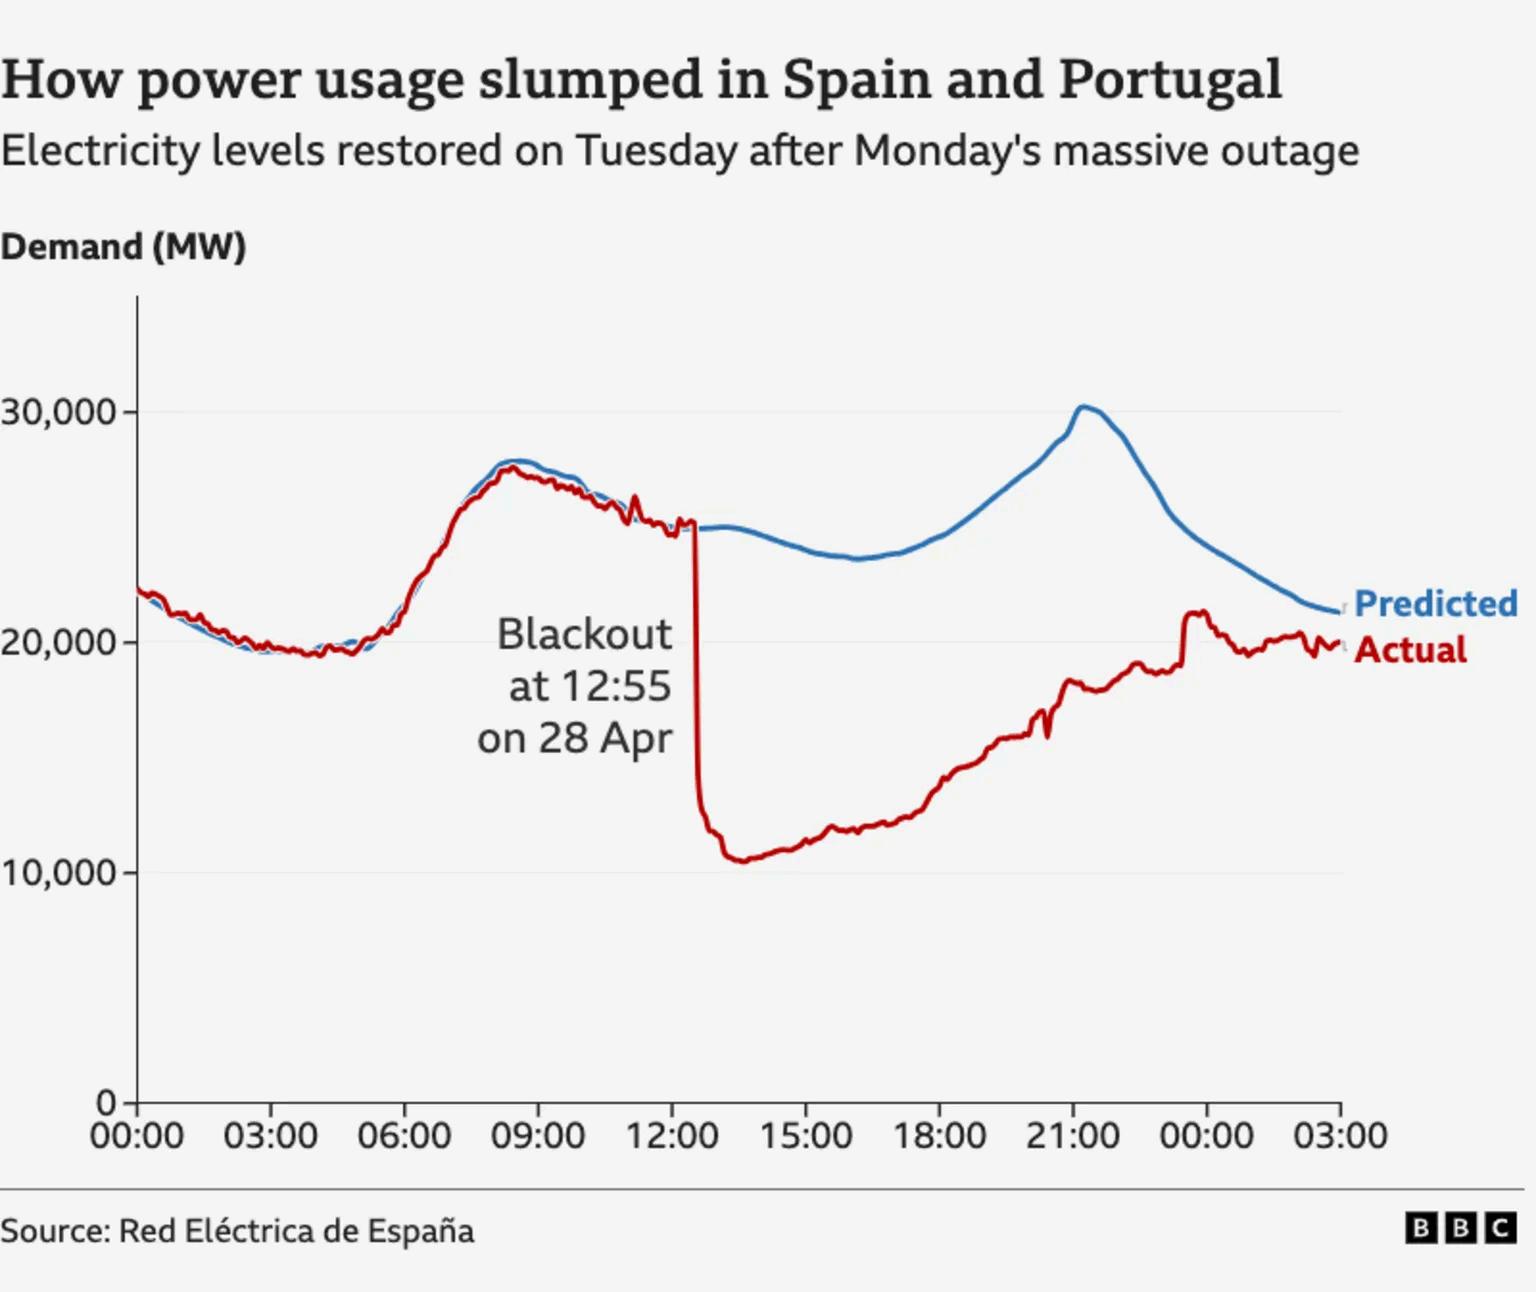
Spain and Portugal power outage electricity levels.
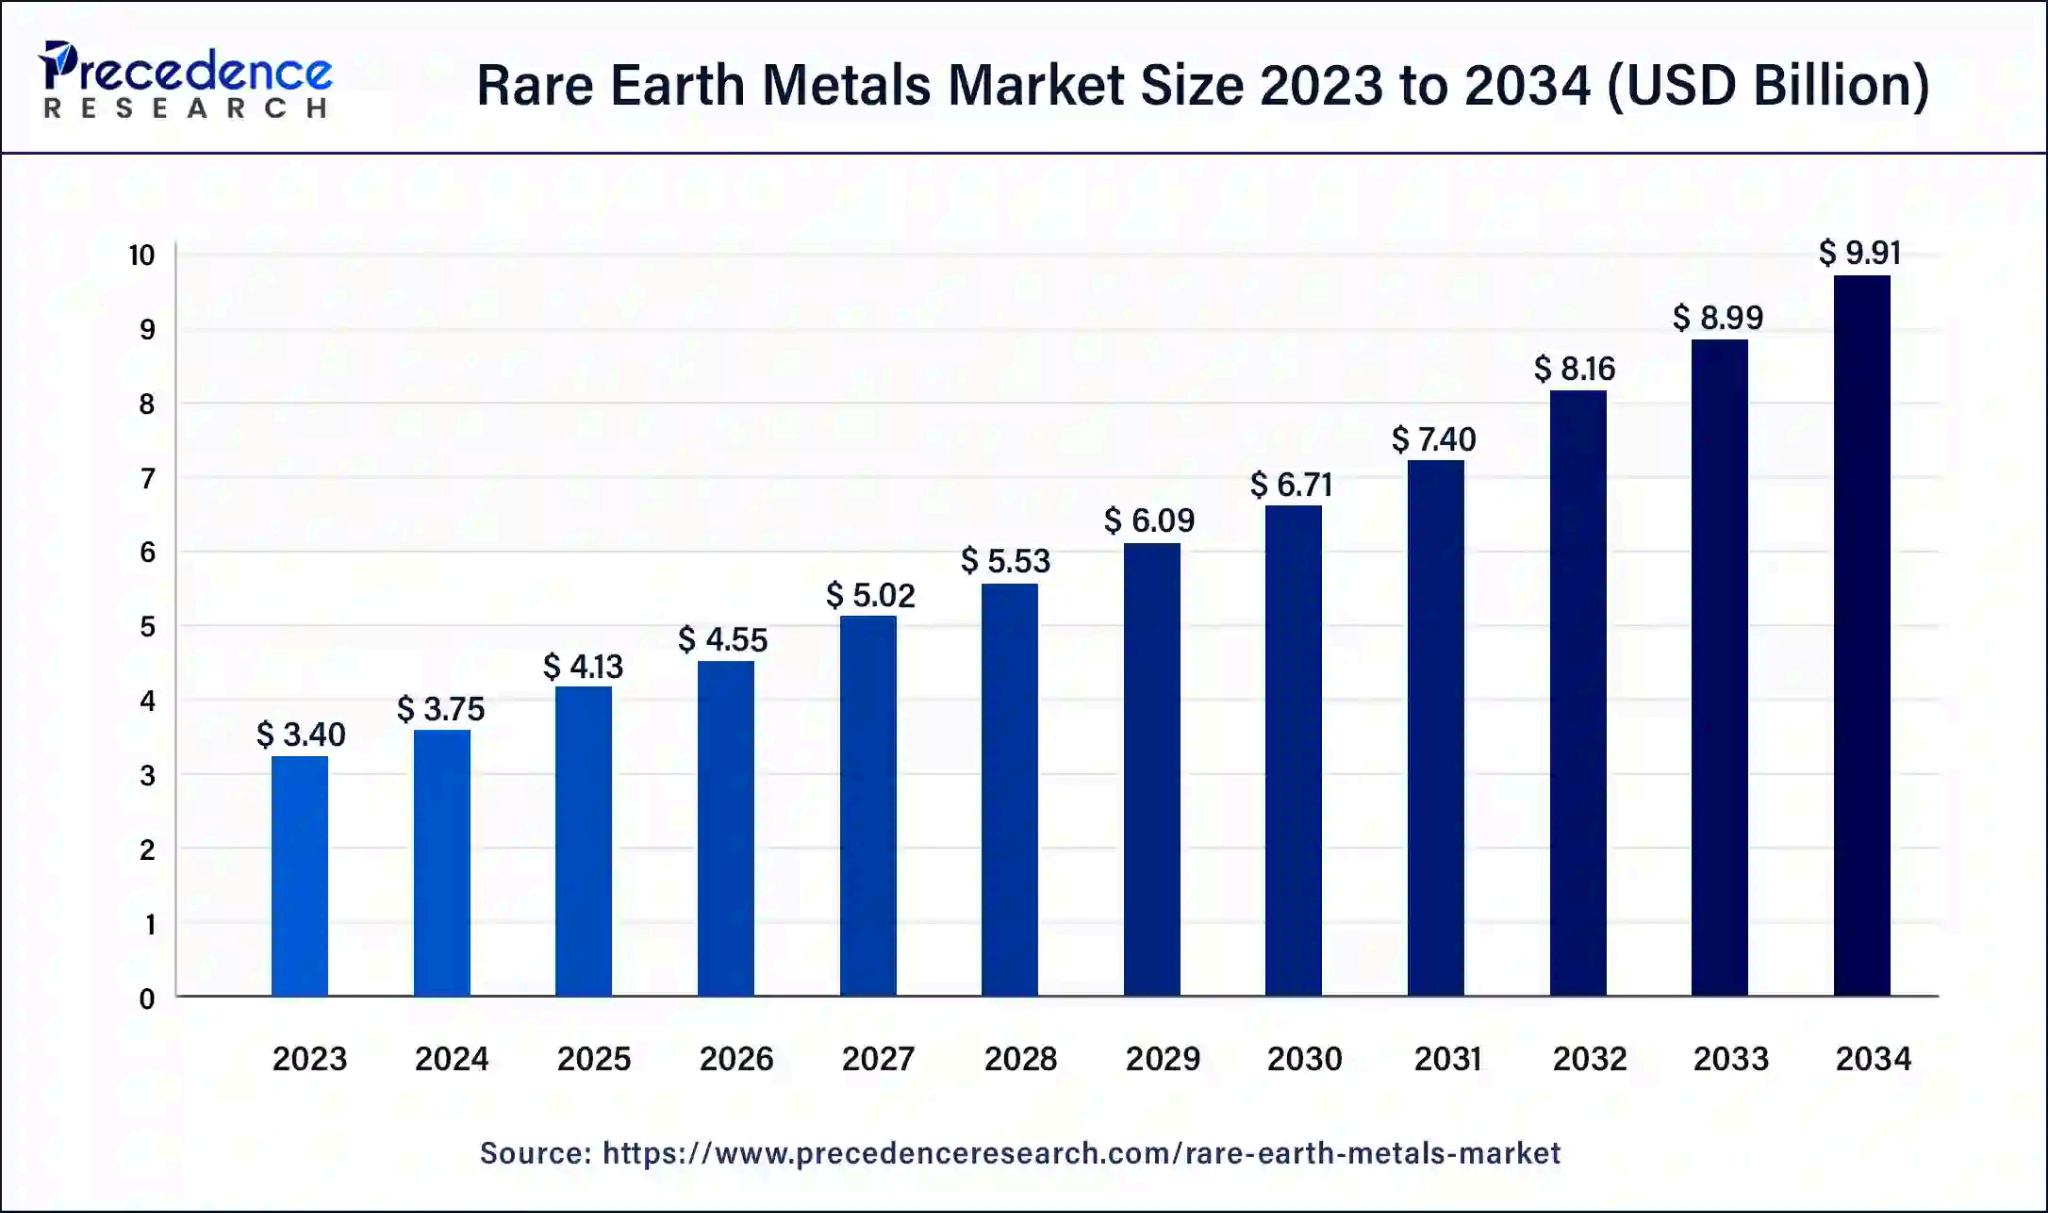
Rare earth metals that are crucial to the renewable energy transition continue to gain market power and influence on a geopolitical scale.
Konrad Hartung| April 10, 2025
Rating: Sell
Current Price: $1,186.67
Price Target: $970.71
Company Updates / News
● Market Cap: $27.27B
● Beta: 1.04
● EPS: $18.51
● PE Ratio: $64.11
● 52 Week High: $1,769.14
● 52 Week Low: $555.71
● Acquired Permian Mineral Interests and Surface Acreage in Aug 2024
● Acquired Permian Oil and Gas Mineral and Royalty Interests in October 2024
● Joined S&P 500 in Nov 2024
Competitor Statistics from 2024 Q3

Revenue: $5.00B Market Cap.: $7.39B


We’ll Drill, Baby, Drill!
Investment Thesis:
Texas Pacific Land Corporation (TPL) holds a premier position as the second-largest landowner in Texas, with an expansive footprint across the Permian Basin. This strategic landholding underpins a dominant share of US crude oil production and a significant portion of natural gas output. TPL’s business model centers on leasing its land for oil exploration and production, capturing robust royalty income while sidestepping the high capital expenditure of direct production Additionally, its subsidiary, Texas Pacific Water Resources, not only supplies but also treats and manages the critical water needs for drilling and fracking operations
My sell recommendation reflects the incredibly high valuation of TPL seen by its current EBITDA multiple of 47.17x. While TPL has a unique business model through royalties and water supply, allowing for an average EBITDA margin of 80%, the valuation of TPL is overblown. While TPL has seen an average y/y revenue growth of 38.4% in the last 10 years with no debt and high cash liquidity, recent growth has slowed to about 18% (average of the last 3y)
As of April 10th , 2025, Texas Pacific Land Corp. was trading at $1,186.67 per share on the NYSE. This level of market enthusiasm is, in my view, overly optimistic, and that the share price will decrease to $970.71. Using a Discounted Cash Flow (DCF) Model-with a more conservative EBITDA multiple of 23.6x, a Weighted Average Cost of Capital (WACC) of 9 9%, and a revenue growth estimate of 18% y/y over the next five years (calculated average of the past 3 years)-the current valuation seems stretched. This analysis suggests that while TPL’s market appeal is undeniably strong due to its novel business approach and high margins, paying such a premium effectively means purchasing the promise of 30+ years of future earnings at today’s inflated valuation.
TPL’s land portfolio spans approximately 873,000 acres in West Texas; however, historical structuring the 1954 spin-off of the majority of mineral rights to TXL Oil means that TPL only holds partial royalty interests on this acreage. Recent strategic moves include the repurchase of nearly 11,600 net royalty acres, expected to drive double-digit cash flow growth over time. This targeted acreage acquisition not only reinforces TPL’s revenue base but also enhances its control over future production outcomes TPL has also committed to taking a long-term, value-oriented approach in future acquisitions.

Revenue: $5.04B Mark R Market Cap.: $57.95B
In addition to consolidating its royalty interests, TPL is demonstrating its forward-thinking approach through innovative water management solutions. The company’s experimental desalination plant designed to convert produced water into fresh water at an initial capacity of 10,000 barrels per day serves as an effort to support sustainable drilling operations in an increasingly water-constrained environment By transforming a byproduct of oil production into a valuable resource, TPL is positioning itself to benefit from improved operational efficiencies, even though this project is set to realize its full potential over a longer-term horizon.
Konrad Hartung| April 10, 2025
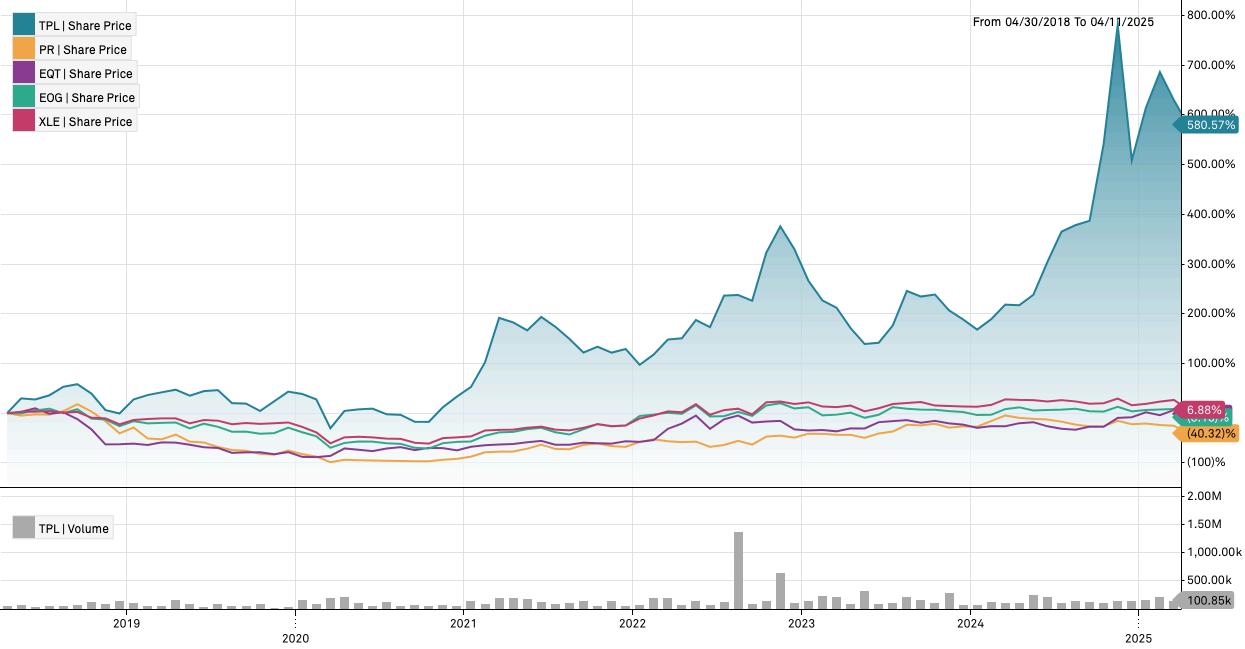
Source: S&P Capital IQ Pro
TPL’s fortunes are inextricably linked to the cyclical nature of the oil and gas industry While the company benefits from a relatively insulated revenue stream (thanks to its royalty structure), its performance is ultimately tethered to drilling activity and commodity prices. Recent price volatility illustrated by a drop in WTI crude prices by over $10 per barrel on “liberation day” exemplifies the inherent risks Although firms producing oil and gas have shown lower sensitivity when crude prices remain above $50 per barrel (according to a study by Goldman Sachs), any prolonged downturn or geopolitical turbulence could have material impacts
TPL has a high geographic risk exposure, owning land solely in and around the Permian basin a region that stands as one of the premier sources of crude oil and natural gas in the United States. This geographic concentration means that TPL’s performance is heavily tied to economic conditions affecting this specific region. Additionally, about 30% of crude oil and 20% of natural gas produced in the US are exported abroad, with most of the oil and gas going to European countries as well as Asia. Due to recent developments and complex relations with Russia, exports to European countries have surged. Nevertheless, recent tariffs and potential reciprocal tariffs from Europe and other countries in Asia are endangering these exports to other countries In essence, there is tremendous uncertainty about the direction of the industry and America, making it difficult to take these into consideration.
In summary, Texas Pacific Land Corporation embodies a unique investment case with resilient operational margins and significant growth catalysts inherent in its diversified revenue streams Nonetheless, the current market valuation, supported by an extraordinary EBITDA multiple of 47x, appears overly optimistic and unsustainable. The substantial premium investors pay for TPL’s future potential seems to discount the palpable risks and the possibility of market corrections In our view, unless TPL delivers unprecedented and sustained growth, which is highly unlikely, a steep reversion in its valuation is on the horizon.
Sources: rbnenergy.com | seekingalpha.com | Goldman Sachs | oilprice.com | CaptialIQPro | pboilandgasmagazine | Texas Pacific Land | valueinvesting io | cnbc com |finance yahoo com
Amy Ren| April 10, 2025
Rating: Buy
Current Price: $31.05
Price Target: $49.91
Company Updates / News
● Market Cap: $3.25B
● Beta: 0.46
● EPS: 0.48
● PE Ratio (TTM): 64.69
● 52 Week High: $24.21
● 52 Week Low: $44.36
● GLNG’s share price has risen 80.8% over the past year, outperforming the industry.
● Secured a 20-year contract for the FLNG Hilli, adding $500 million in EBITDA backlog.
● Golar’s transition to a pure FLNG company positions it for long-term growth, with $1.5B in projected EBITDA by 2030.
from Q3 2024

EV/EBITDA: 6.92
Market Cap: $40.54B

EV/EBITDA: 10.17
Market Cap: $5.09B

EV/EBITDA: 4.37
Market Cap: $3.62B

Golar LNG is a leading player in the LNG sector, offering a unique value proposition through its floating LNG (FLNG) model, which allows it to bypass the extensive permitting delays faced by traditional onshore terminals With a portfolio that includes its flagship MKII FLNG project, poised to generate $500 million in annual EBITDA, Golar is well-positioned to benefit from the regulatory shifts in the US energy landscape These shifts, including the reversal of Biden-era LNG export restrictions and new policies under the Trump administration, create a favorable environment for US LNG exports As global demand for LNG continues to rise, particularly in Asia and Europe, Golar’s offshore, modular infrastructure offers a faster, more cost-effective solution for energy importers, especially those seeking alternatives to traditional onshore projects However, Golar LNG faces risks, including potential legal challenges to its projects, which could delay timelines and increase costs Additionally, while US LNG exports are currently in high demand, long-term global energy transitions toward renewable sources could reduce future reliance on LNG. Despite these risks, Golar’s unique business model and its favorable positioning in the US energy landscape provide significant growth potential, making it an appealing investment opportunity in the short-to-medium term.
I arrived at the valuation by performing a Discounted Cash Flow (DCF) analysis, using a terminal growth rate of 4.0% and a WACC of 3.6% over a 10-year forecast period The assumptions are based on Golar LNG's strong growth in the Floating LNG sector, with significant projects like the MKII FLNG expected to generate substantial future cash flows. While the company faces challenges, including rising operating expenses and securing new charters, its solid balance sheet and long-term contracts from acquisitions like FLNG Hilli provide a strong foundation for growth. Given these factors, I recommend a buy for Golar LNG, as its growth prospects and financial position support continued value appreciation
Golar LNG is capitalizing on its transition to a pure Floating LNG (FLNG) company, positioning itself for higher-margin growth through long-term FLNG contracts With the recent reset agreement with BP on the Gimi FLNG vessel, Golar secures stable, long-term revenue, while its flexible offshore units offer a distinct advantage over traditional onshore projects. This shift allows Golar to meet the growing LNG demand, especially as Europe increases its reliance on LNG imports, giving the company a competitive edge in the expanding market.
Golar LNG is poised for significant growth with a robust pipeline of Floating LNG (FLNG) projects across key regions like South America, West Africa, and Southeast Asia As the only proven provider of FLNG services, it offers a cost-effective and scalable solution for monetizing offshore gas reserves. With long-term contracts and additional MKII FLNG units in development, Golar can capitalize on the increasing global demand for LNG
Amy Ren| April 10, 2025
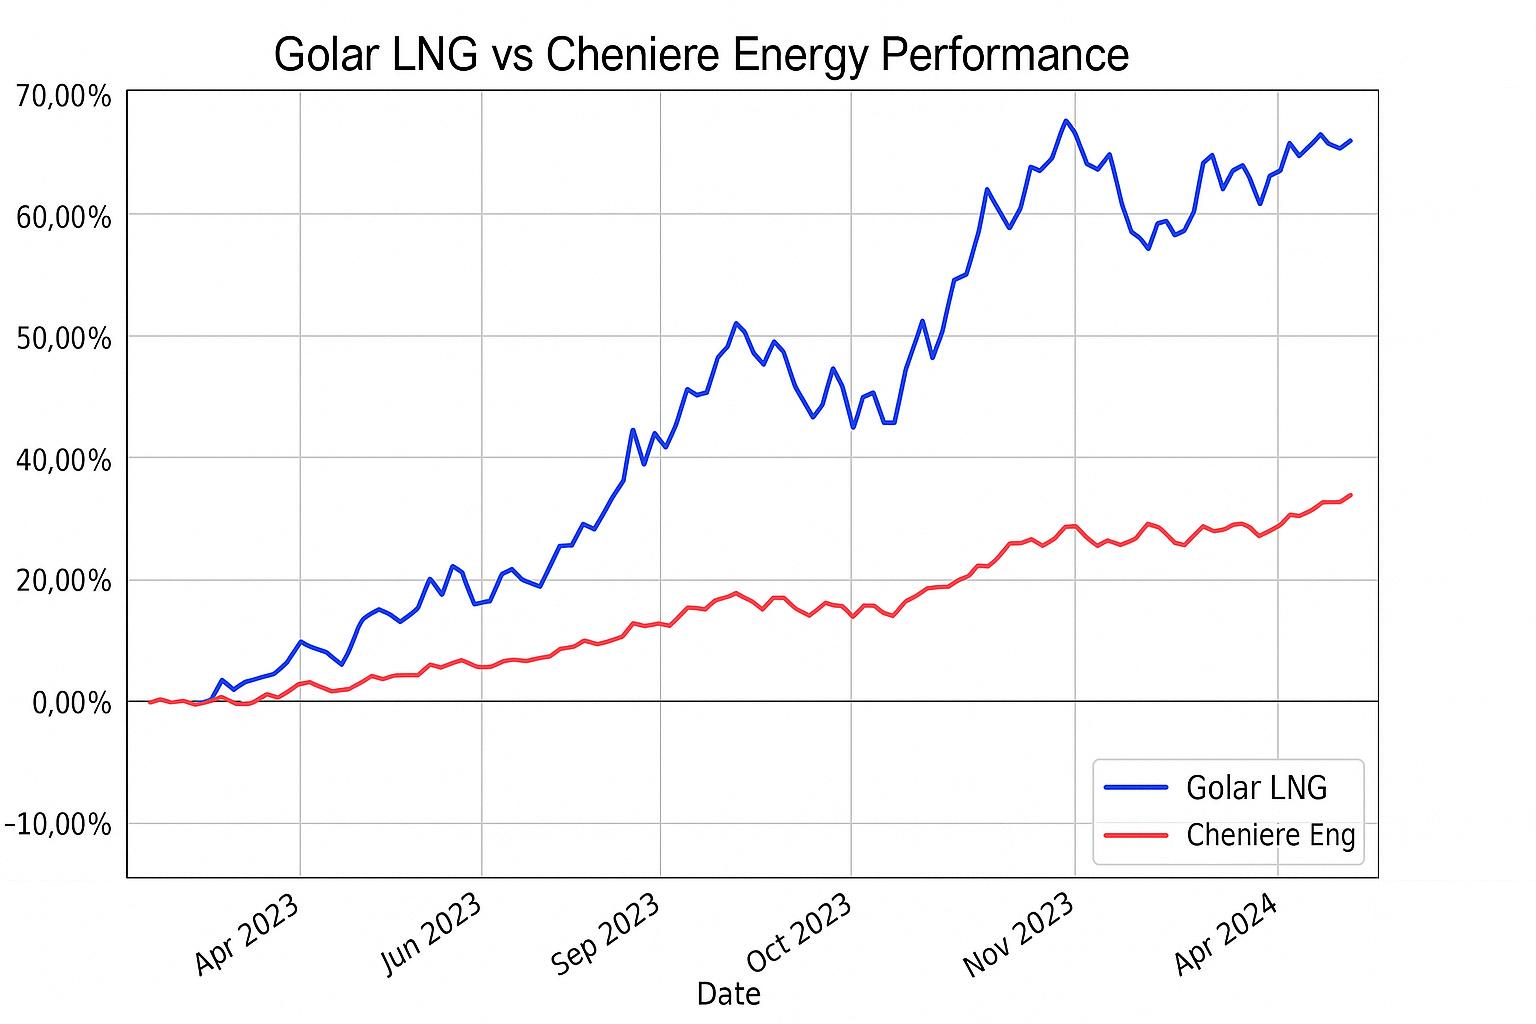
Source: Yahoo Finance
Golar LNG is facing significant pressure from rising operating expenses, particularly due to inflation. In the third quarter of 2024, the company saw an 18.5% year-over-year increase in operating costs, with vessel operating expenses accounting for over half of this increase. As inflation continues to affect the broader economy, Golar’s bottom line could be further squeezed, making it more difficult for the company to maintain profitability without corresponding revenue growth. Managing these escalating costs will be crucial for the company's financial stability.
Golar LNG is exposed to regulatory risks, particularly in the energy and environmental sectors. Changes in energy policies, such as stricter regulations on emissions or new tariffs on LNG exports, could impact Golar’s operations. For instance, any new trade tariffs on U.S. LNG exports, such as those imposed by the Trump administration, could affect the company's ability to secure profitable contracts, especially in international markets. Additionally, political instability in key regions like Africa and Latin America, where Golar operates FLNG projects, could introduce further risks to project timelines and cost structures.
While Golar LNG is expanding its FLNG capacity, project execution remains a significant risk. The company’s $2.2 billion MKII FLNG project, which is expected to be completed in 2027, faces potential delays due to construction challenges or unexpected technical issues. These delays could hinder Golar's ability to secure long-term charters, thereby affecting its revenue projections. Furthermore, the company’s financial stability depends on timely debt financing to manage the risks associated with its large-scale projects, and any disruption in the financing market could impact its ability to proceed with these ventures as planned.
Sources: Bloomberg| NY Times |Yahoo Finance | Investors golarlng com | Capital IQ | Alphasights
Howie Wang| May 1st, 2025
Rating: Buy
Current Price: $223.34
Price Target: $247.20
Company Updates / News
● Market Cap: $10.16B
● Beta: 1.5
● EPS: 17.63
● PE Ratio: 10.33
● 52 Week High: $258.03
● 52 Week Low: $98.50
● Talen Energy reports Q4 13.4% earnings increase, but 15.% decrease YoY due to sale of ERCOT portfolio
Competitor Statistics from Q4 2024

EV/EBITDA: 9.7
Revenue: $4.04B

EV/EBITDA: 12.8
Revenue: $5.47B

EV/EBITDA: 18.4
Revenue: $5.38B

Investment Thesis:
Talen Energy is an independent power producer (IPP) focused on and transitioning to clean energy, as well as data center power supply, headquartered in Texas Their portfolio consists of 12 generation facilities, primarily located in the Northeast and serving the wholesale market in the PJM interconnection. Talen owns and operates a diverse portfolio, consisting of coal, natural gas, and nuclear generators with future plans to phase out coal generation, reflecting its commitment to clean energy production.
My buy recommendation is driven by three factors. Firstly, Talen Energy is poised to capture future demands from data centers as AI developments continue to provide tailwinds for the market Secondly, Talen is increasing its share of stable revenue, providing more certainty in regards to its revenue. Lastly, Talen’s hedging strategies largely secure stable fuel sources for the near future, combating future fuel price fluctuations
As of May 1st, 2025, Talen Energy was trading at a price of $223 34 per share I believe this stock is undervalued, and I estimated a target price of $247.20 per share. My conclusion came from conducting a discounted cash flow analysis using a terminal growth rate of 3% and a 12.4% WACC. My projections are based on industry numbers, as well as an optimistic outlook on regulatory challenges facing Talen.
In 2024, Talen Energy, through its subsidiary Cumulus Data, sold a data center located adjacent to its Susquehanna Nuclear generator to Amazon Web Services The two parties have since entered into the Power Purchasing Agreement (PPA), whereupon Talen, through its Susquehanna facility, would provide the data center with 300 MW for 10 years with options to increase capacity in 120 MW increments, up to a 480 MW increase.
Furthermore, Talen reached a Reliability Must Run (RMR) agreement with the PJM interconnection in late January 2025 to continue operating its coal-operated Brandon Shores and H A Wagner plants, originally designated for closure and refitting This agreement, approved by FERC as of May 1st, would contribute $180 million annually to consistent revenue until 2029.
These agreements give Talen significant growth potential, diversifying its revenue streams from auction-based wholesale markets towards stable sources of cash and protecting Talen from fluctuating energy prices while still preserving upside potential
Howie Wang| May 1st, 2025
Talen Energy vs. Vistra Corp Relative Share Price (LTM)
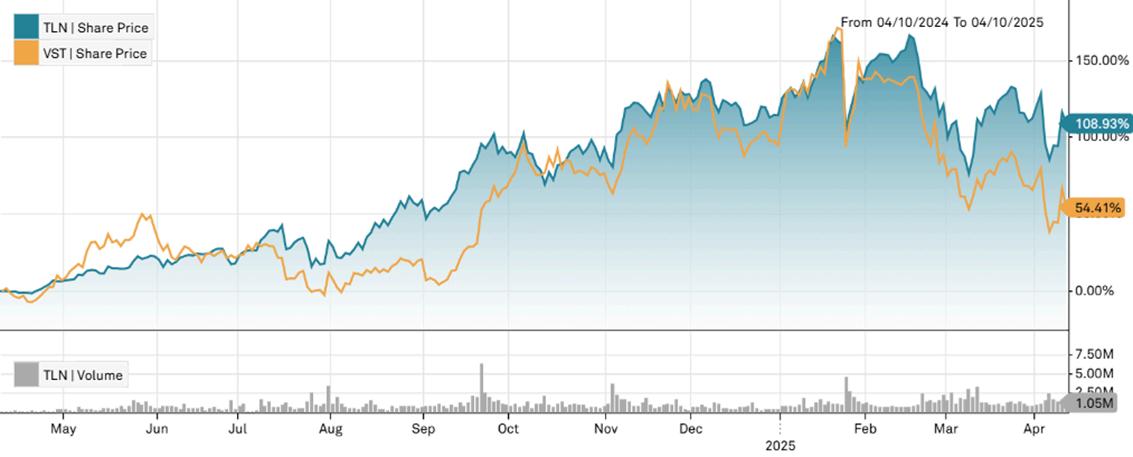
Source: S&P Capital IQ Pro
Risk Potential
FERC Blocks PPA Capacity Increase:
Talen, as a power producer, faces intense scrutiny from the Federal Energy Regulatory Commission (FERC). In November 2024, FERC rejected an amended Interconnection Service Agreement, intending to increase the power capacity supplied to the Susquehanna data campus from 300 MW to 480 MW over concerns of rising consumer costs This decision has since been contested.
While the majority of its nuclear fuel sources have been secured through 2029, outlasting the current administration, its natural gas hedging has proved less successful in the past. During the 2022 Energy crisis, Talen’s short position on natural gas caused it to incur significant financial losses against the backdrop of a price increase This ultimately led to the company declaring bankruptcy The unpredictability of the current administration, combined with a less far-reaching natural gas supply compared to its nuclear fuel supply, poses a slight risk to Talen’s natural gas supply
Spring 2025
Recap, Overview, and Themes: It’s rather unfortunate that the risks and uncertainties discussed in the previous publication have since materialized. The catalysts of the aforementioned risks are mostly systematic, involving headline makers such as tariffs, trade restrictions, recession fears, etc. While systematic developments generally affect the broader market, TMT equities’ volatilities were more pronounced than the S&P 500. This is mainly due to TMT companies inheriting high beta compared to other sectors for varying reasons, and TMT equity valuations were baked in perfection before the April US equities fallout. The other notable realized risk was the debate surrounding the substantial capital expenditure and its ROI for technology companies. Catalyzed by Deepseek, a Chinese firm that developed high-performance LLM with a fraction of US CapEx, the US market similarly reacted with single-day trillion-dollar moves, mainly led by technology losses
While the April 9th announcement of a tariff pause halted the violent equity losses in the market, the picture ahead for TMT, or the S&P 500 for that matter, remains highly elusive TMT sector movements will likely continue to be influenced by systematic principles, whether the administration's announcements or economic alterations are reflected in labor, inflation, or GDP data. Federal Reserve’s policies will also be closely observed across sectors, as the cost of borrowing remains elevated without a path to decreasing interest rates. This, however, is not to say that idiosyncratic factors of technology companies wouldn’t be imperative; however, when the broader market underperforms, it is often tricky for TMT to be the exception.
Our premise on TMT being able to outperform idiosyncratically relies heavily on earnings performance. The emphasis on EPS is instituted by the multiples-driven growth in broader equities from 2023-2024 (can earnings catch up to multiples?) and the heterogeneous effects of the tariffs and systematic events-driven catalysts on technology companies: Netflix, a streaming service, experiences a more indirect impact from the tariffs compared to Nvidia, a company reliant on trans-pacific supply chain. Major idiosyncratic catalysts up ahead are Q1, Q2, and Q3 corporate earnings; changes in product prices, especially in consumer electronics, and corporate layoffs could affect valuations There’s a valid rationale to believe in a bearish view of the general NASDAQ-100 index unless there’s a meaningful stabilization in VIX, clarity on consistent trade policies, and discernible income viability of AI in the increasingly complicated global environment.
Metrics and Graphs
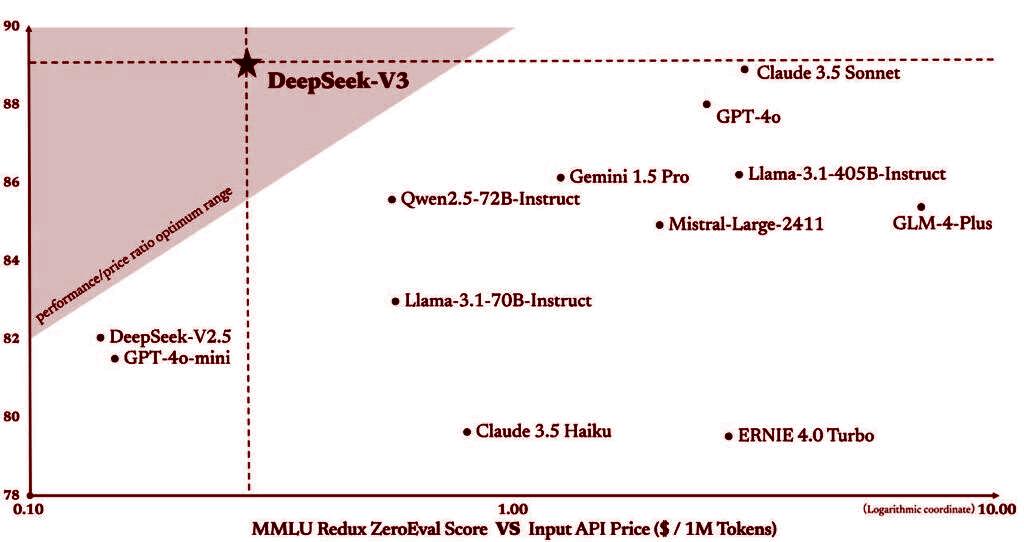
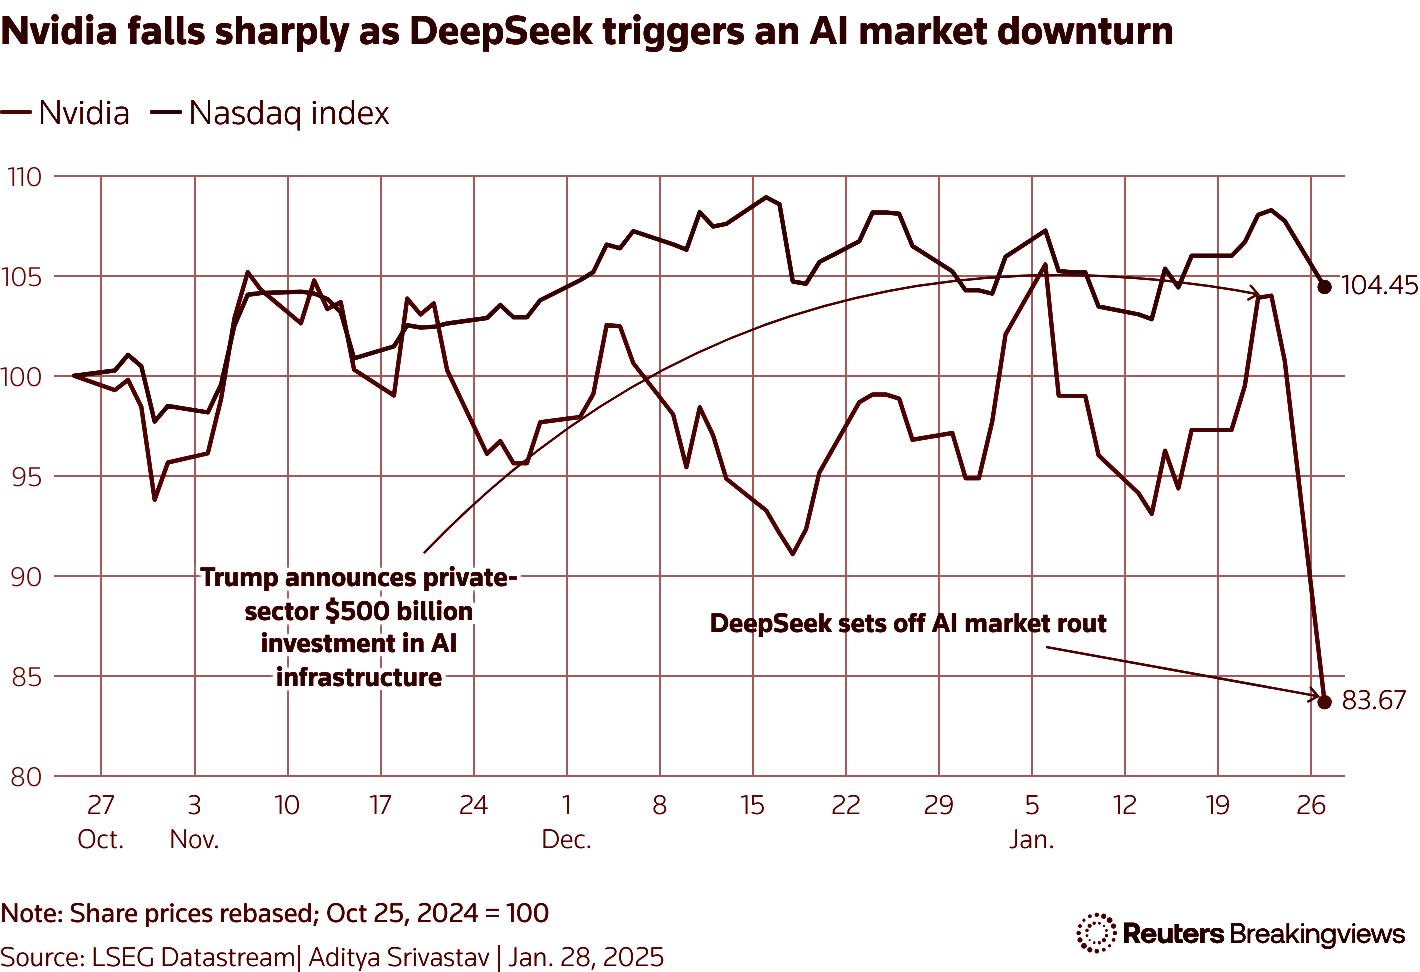
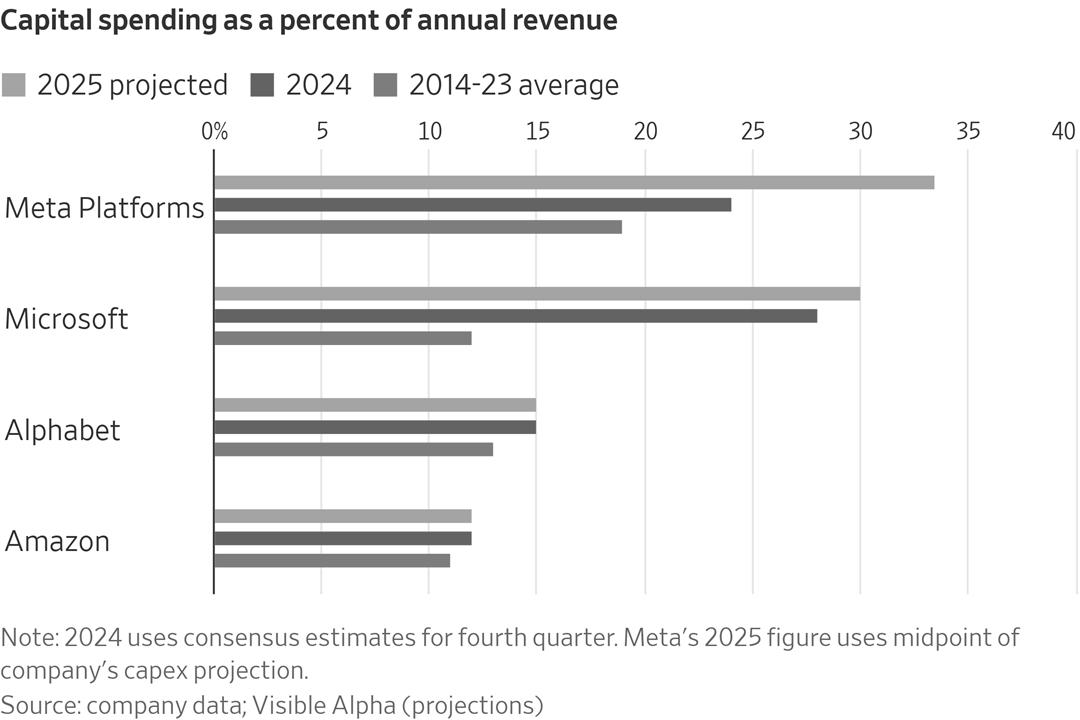
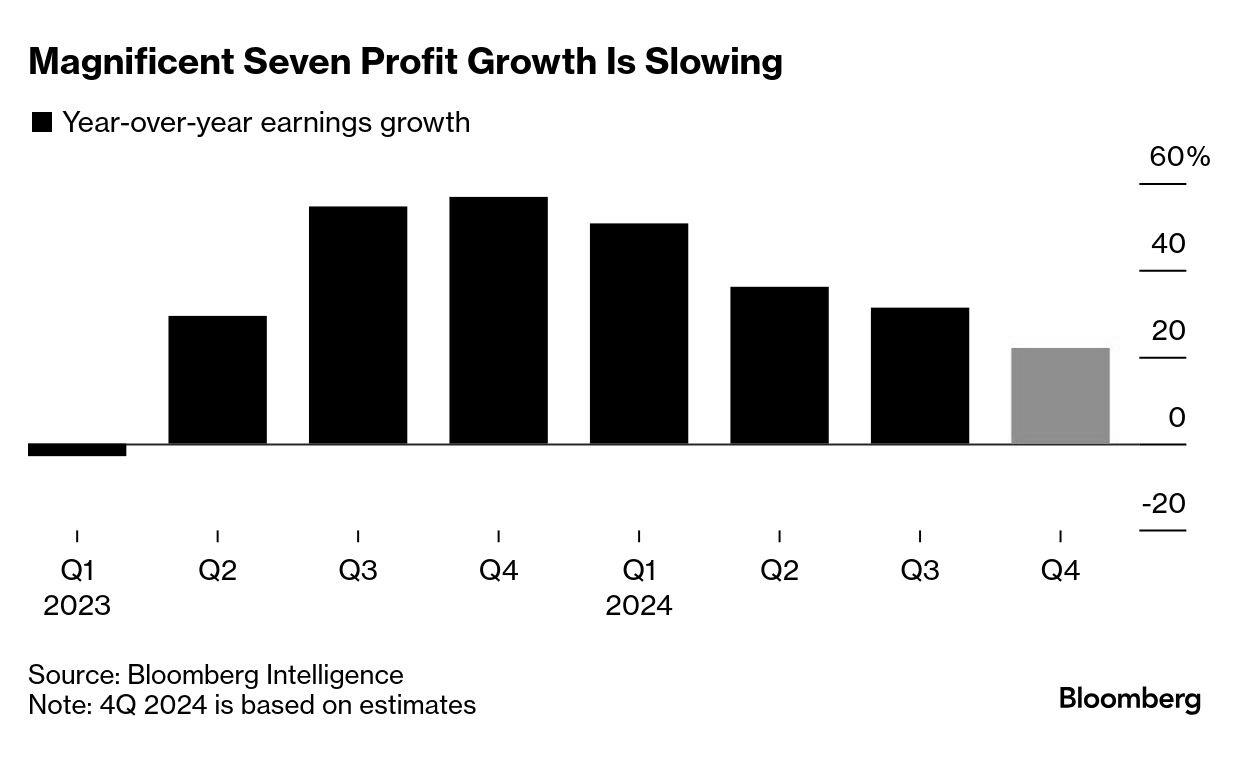
The technology sector faced substantially more tailwinds and headwinds from the new administration than the previous governments Technology has become the epicenter for government investment and export control because of its significance in the “tech race” between China and the US Specifically, semiconductors, generative AI, and quantum computing emerged as key items in the new administration’s policy handbook. Merely weeks into Trump’s second term, the administration announced the $500 billion Stargate Project to “revolutionize the US AI infrastructure.” While the project was soundly American, foreign investment funds, notably Softbank, are participating in these substantial technology investments in the US. This upscaling of investment in the US is similarly reflected in many other companies outside the three critical verticals: Apple promised to invest $500 billion in the US over four years, covering projects such as AI, silicon engineering, and advanced manufacturing. While these developments are generally positive for the technology sector, reaping the awards could be lengthy, making the returns less definitive
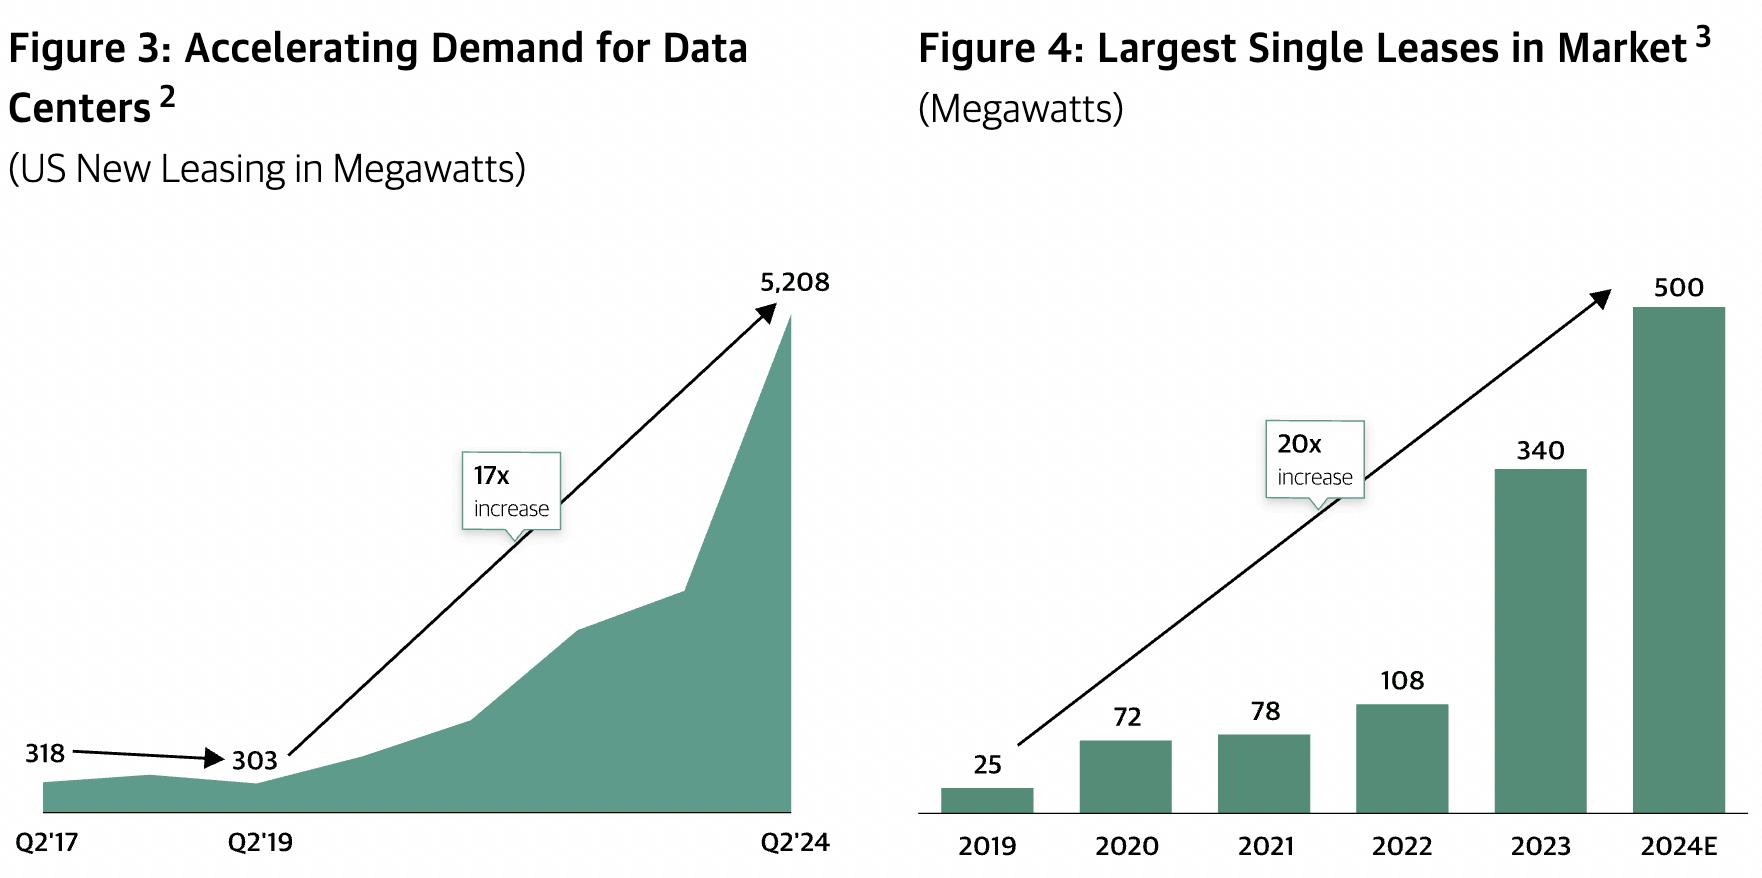
A fair share of headwinds faced by the technology sector, as mentioned, also came from the federal government. Foreign equities listed on the NASDAQ, notably TSMC, are pressured by the administration to move production to the US or face export restrictions and tariffs Again, since technology is now the principal driver of the race between China and the US, the government has become increasingly protective of the
exports of frontier technology to foreign nations For instance, there were discussions of restricting Nvidia’s export of H20, which was already a constrained version of the original product, to contort with the restrictions on semiconductor sales to China. China is a big customer of Nvidia. The world ex-US is a big customer of many other technology companies. Compared to the American corporations in the 1980s, the big tech firms today are more globalized and derive revenue worldwide, often just as much as domestic US sales. The threat of export controls, alongside uncertain investment returns, will likely continue to depress the technology stocks for a more prolonged period. There’s also the rising concern about firms being able to operate independently without the consistent regulation/influence of the government.
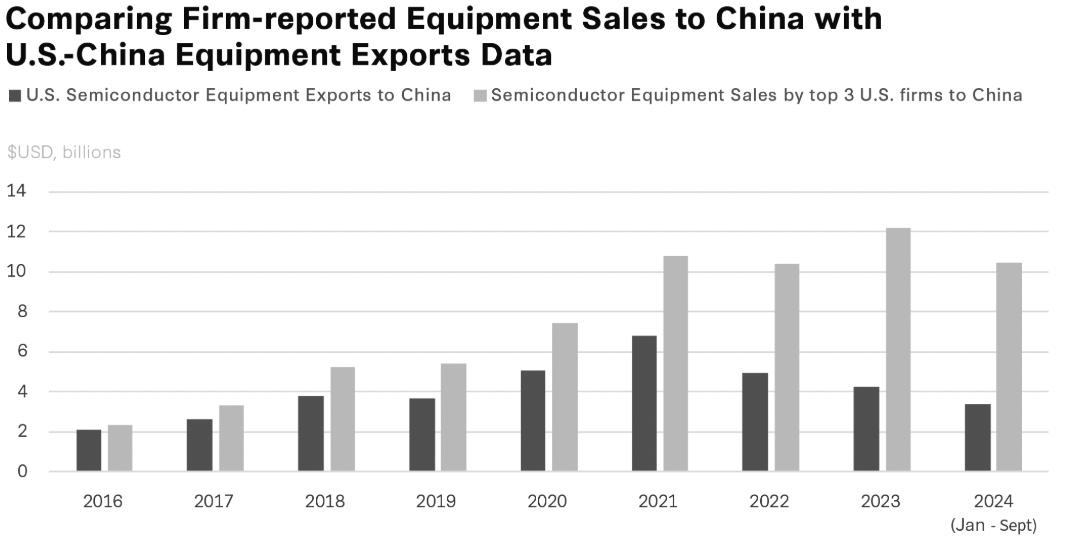
Despite the relatively bearish view on the technology vertical, the technology sector will maintain its prevalence in US equities. 2% of the 500 largest U.S. companies represent nearly 40% of the weight, and most 2% are represented by notable technology firms. Despite the recent market valuation fallout, most NASDAQ-100 and S&P 500 remain highly valued relative to historical norms and global peers.
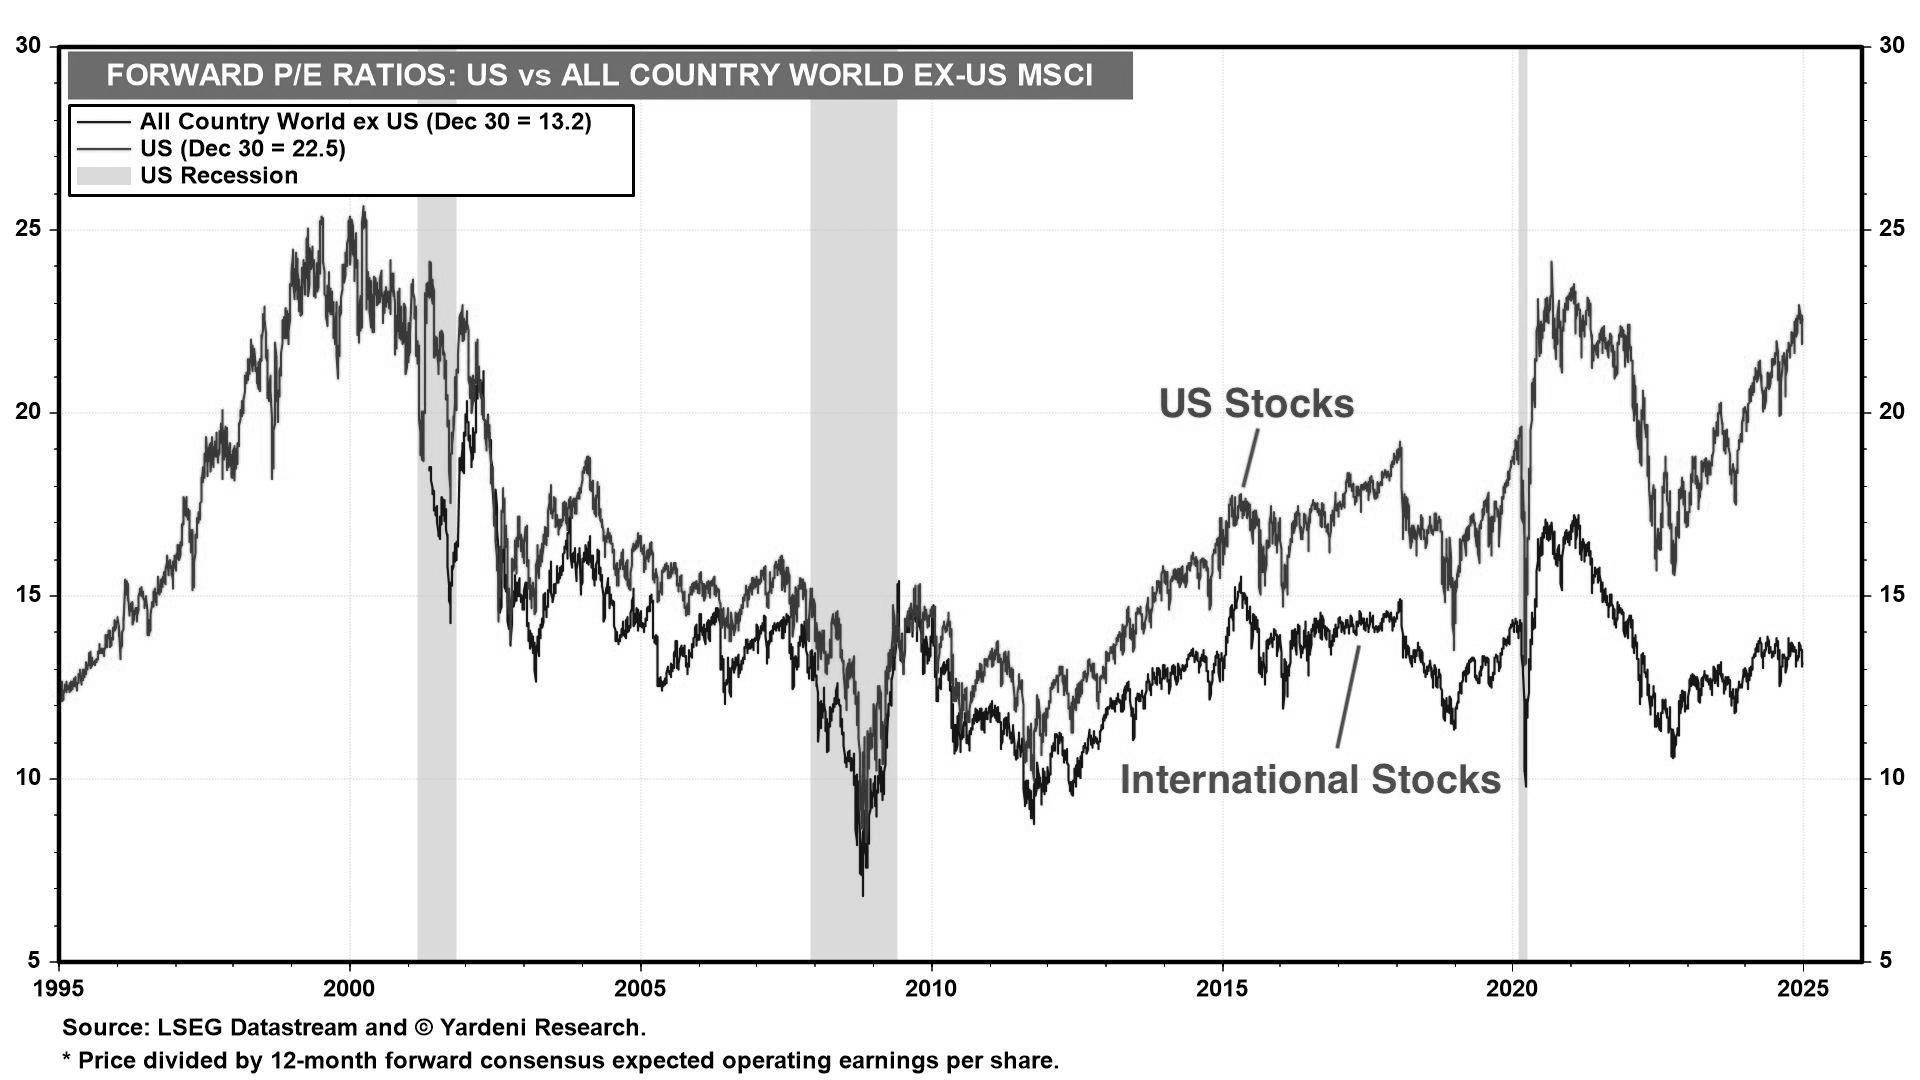
For most of the beginning of 2025, the media spectated the TikTok fiasco unfolding It is still uncertain what TikTok's fate would be as of April; however, the current list of potential US buyers suggests that significant technology firms could enter or increase their presence in the media vertical. Specifically, Oracle’s proposal and Amazon’s desire to utilize TikTok’s online shop platform demonstrate the increasing prevalence of social media-based (online video platform) across verticals in data and retail.
In early 2025, the telecom sector faces crosscurrents from global trade tensions and a push for faster 5G and fiber deployments Major carriers are navigating the aforementioned tariffs The U.S relies heavily on imported equipment needed for the telecom system. The Price of networking equipment will likely increase, exacerbating damage as telecom relies on hardware more than software
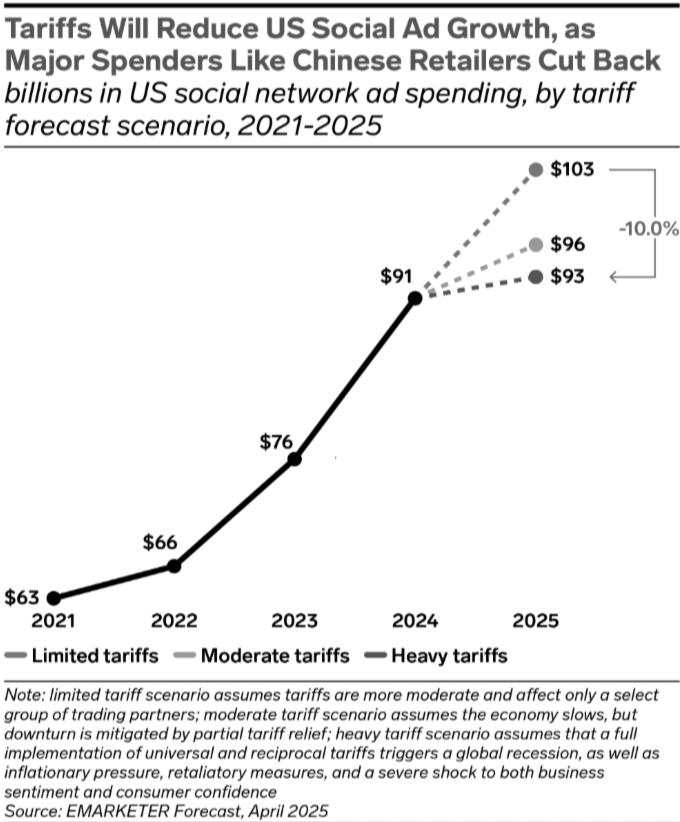
For the rest of 2025, however, the media vertical spotlight will likely shift towards disposable income and consumer confidence. Should the proposed tariffs fully materialize and upend economic norms, there are already elevated concerns over consumer vitality. When consumers decrease consumption, advertising tends to be negatively affected as firms begin to withdraw investment in product marketing. Reports suggest that companies reliant on advertising, such as AppLovin and Lamar Advertising, could see revenues decline by 4%. For multi-vertical conglomerate like Disney, a potential decrease in disposable income could negatively affect park attendance and subscription to streaming services. While streaming-only companies like Netflix have fared well over the tariff-based stock market crash, the price elasticity for streaming demand remains above one, meaning a pessimistic economic outlook remains worrisome for the media sector. Entertainment and media, similar to the airlines, are cyclical industries. The adverse economic conditions forecasted by many institutions won’t support stock valuations in the media vertical.
Meanwhile, surging data usage—fueled by AI-driven apps and remote work—keeps revenue growth steady, though increased competition from cable rivals and satellite operators has tightened margins. Some carriers are exploring strategic partnerships or smaller acquisitions, wary of a slow M&A climate. At the same time, regulators scrutinize network consolidation plans to preserve consumer choice.
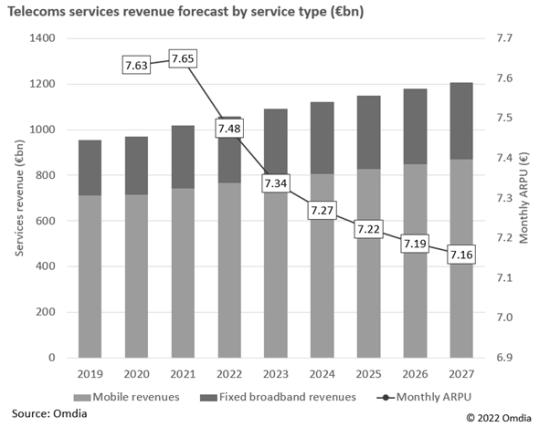
One exciting outlook for telecom is the increasing hope that quantum computing will one day play a role in the industry. As data demands surge, operators look to quantum algorithms for dynamic traffic management and encryption breakthroughs. This technology could reshape how networks adapt, scale, and defend against future cyber threats.
Kashmir Tai | May 1, 2025
Rating: Buy
Current Price: $32.74
Price Target: $44 09
Key Stats
● Total Revenue: $959 3M
● EV/EBITDA: 11 26x
● Market Cap: $1539.6M
● Beta: 0.22
● EPS: 0 99
● MSGE has announced David Collins as Executive Vice President and Chief Financial Officer, effective April 14th
● MSGE, with other MSG family company, had renewed and expanded their partnership with PepsiCo, effective March 5th
Competitor Stats

15.6x

Revenue: $1,072M


The New Old-Fashioned Way!
MSGE is a leading live entertainment company in NYC. The company includes a portfolio of iconic venues: Madison Square Garden, The Theater at Madison Square Garden, Radio City Music Hall, the Beacon Theatre, and The Chicago Theatre The company also has the original feature production – the Christmas Spectacular Starring the Radio City Rockettes – for over 90 years. My recommendation is a Buy for Madison Square Garden Entertainment. Though we saw high volatility in the stock market in the first few months of 2025, MSGE has the great potential to attract investors based on its solid venue portfolios and artists network MSGE’s performance is especially susceptible to seasonality, and therefore, this is the best time to “buy the dip”
As of April 30th, Madison Square Garden Entertainment (MSGE) is trading at $32 74 I believe that this equity is fairly valued and expected to increase to $44 09 within this year I arrived at this conclusion by conducting a DCF analysis with a terminal growth rate of 2 50%, a WACC of 7.46% across 5 years, and a $32.16 million Capex estimation for 2024. I used these assumptions based on historical data and an optimistic view given MSGE’s performance after its spin-off from Sphere Entertainment and its recent 2025 Q1 report’s projection on capital expense
The Street underestimates MSGE’s ability to drive organic growth beyond its anchor assets like the Knicks, Rangers, and the Christmas Spectacular. While the Street fixates on filling the gap left by Billy Joel’s residency, it overlooks MSGE’s powerful competitive edge: its contract and venue flexibility In FY2024 alone, MSGE hosted 960 live events, averaging 2 63 per day, enabled by short-term bookings, multiple venues within the complex, and contract terms allowing sports and artists’ schedules to shift as needed. This operational agility unlocks significant monetization potential through back-to-back or same-day events. Ticketing alone proves the revenue strength: UFC 295 and UFC 281 generated over $12 million and $11 5 million in gate receipts respectively, while the ongoing BIG EAST basketball partnership and bookings like Annie the Musical ($48M), Dua Lipa’s tour ($18M), and the Tony Awards further add to a projected $112 million in FY2025 ticketing revenue. Thus, contrary to Street concerns, MSGE has proven capable of replacing and even exceeding prior revenue anchors with diversified, high-demand bookings, especially during summer a peak season for concerts and live performances
MSGE offers artists a growth runway within its portfolio spanning the 3,000-seat Beacon Theatre, the 5,600-seat Theater at MSG, the 6,000-seat Radio City Music Hall, and the 21,000-seat Garden This allows artists to scale their performances while remaining within the MSGE network A great example is Olivia Rodrigo, who began with two sold-out shows at Radio City in 2022 (earning $704,545) and progressed to four concerts at the Garden in 2024, generating nearly $10 million. In the age of streaming and social media, artists are breaking out and moving up venue tiers sooner. MSGE’s integrated venue ecosystem is positioned to capture this trend, giving it a competitive moat that newer, isolated venues simply cannot replicate
MSGE benefits from a strong pricing moat that sets it apart from newer competitors. Performing at Madison Square Garden is widely regarded as a career milestone for artists, lending the venue unparalleled prestige compared to alternatives like Barclays Center or The Shed. This iconic status allows MSGE to command significantly higher prices, especially for premium offerings For example, concert suite prices at MSG can reach $34,000, far exceeding the $4,500 charged at Barclays Center, reflecting the premium customers are willing to pay for the exclusivity and reputation associated with the Garden.
Share Price of MSGE VS. S&P and S&P (Media & Entertainment)
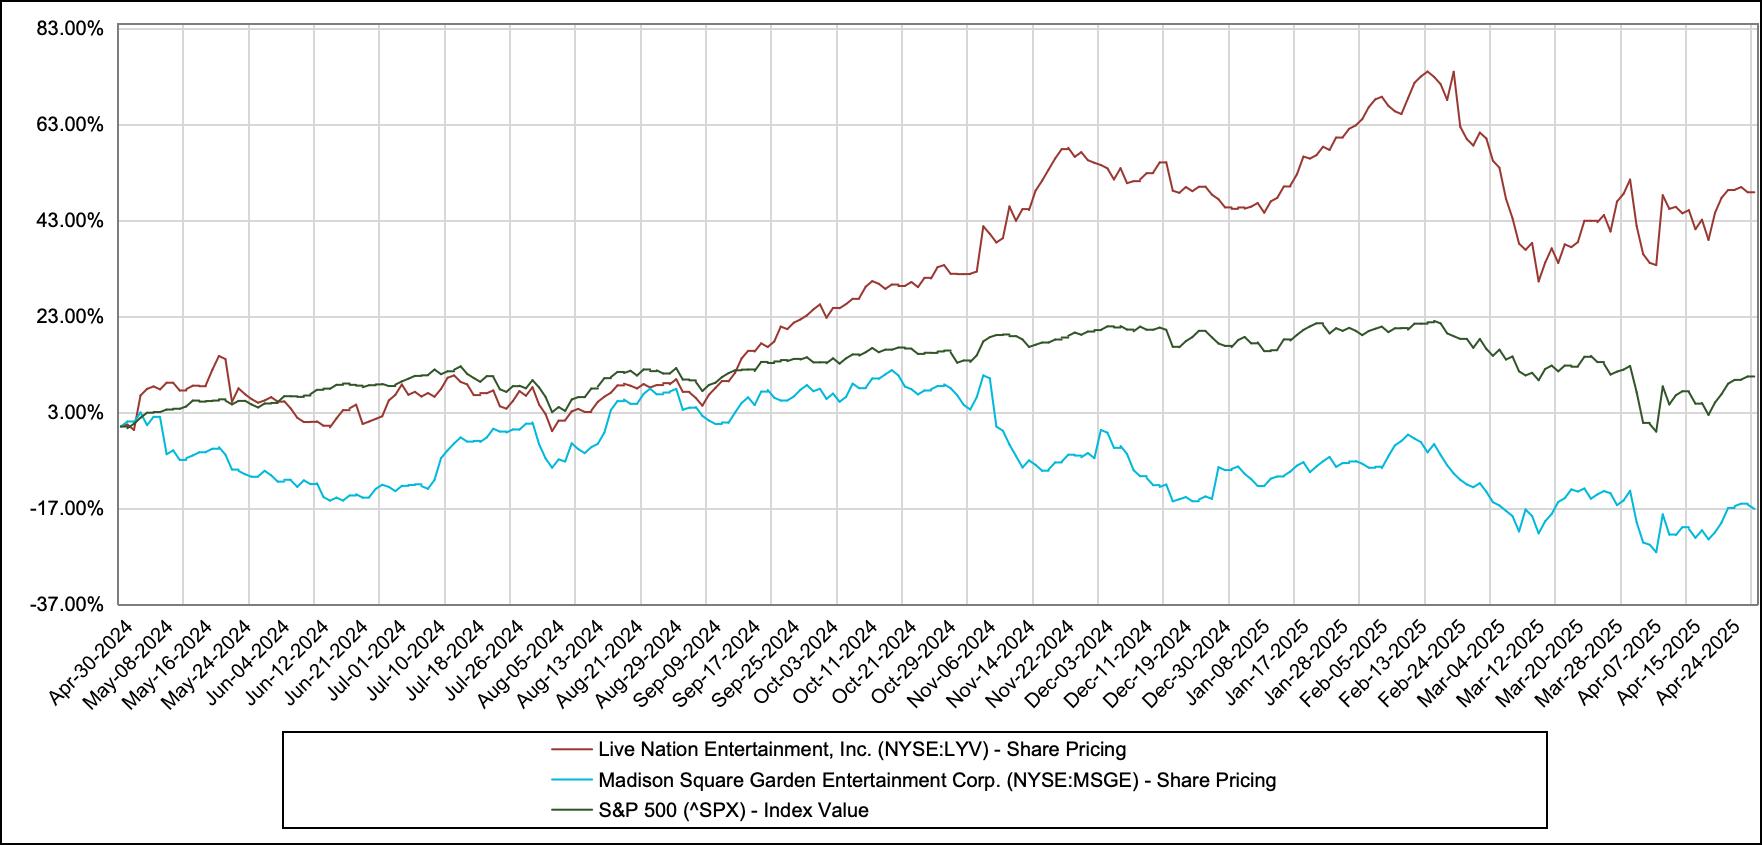
Source: Capital IQ
Risk Potential
Incompatibility with Penn Station
One key risk for MSGE is its location above Penn Station, which faces ongoing redevelopment proposals that could lead to significant costs or even forced relocation. With MSG’s operating permit recently renewed for only five years, long-term uncertainty remains. To mitigate this, MSGE should focus on securing a renewed permit or, under "as-of-right" zoning, rebuild on the existing site Its iconic status also offers leverage through public and political support to remain a central part of New York’s entertainment landscape
New Venues with Trendy Designs
MSGE faces increasing competition from newly developed venues in New York City that offer cutting-edge technology and multifunctional event spaces, which can attract a broader range of events and tourists. For instance, The Shed features a movable outer shell that creates a versatile space called The McCourt, while The Glasshouse offers 75,000 square feet of state-of-the-art facilities with advanced audiovisual systems and customizable features As a matter of fact, MSGE remains dominant in large-scale live entertainment, enabling strong cross-selling and customer loyalty. The company is also upgrading its tech through partnerships like Verizon, offering 5G, Wi-Fi, and premium services such as “Verizon Access” and “Verizon Lounge” to enhance the fan experience
Public Health Emergency
A pandemic or public health emergency poses a clear risk to MSGE’s core business, as live events rely heavily on in-person attendance But the company has shown resilience through digital innovation In Fall 2020, it launched The Beacon Jams, an eight-week livestream series with Trey Anastasio that drew 1.8 million viewers and raised over $1 million. Unlike on-demand platforms like Netflix, MSGE offers exclusive live performances, preserving the unique appeal of live music and helping sustain audience engagement during disruptions
Sources: Capital IQ | IBIS World | Yahoo Finance | Seeking Alpha | Financial Times | CFRA Equity Research | Evercore ISI | Deutsche Bank Research | Macquarie Equity Research
Spencer Hom | April 10th, 2025
Rating: Sell
Current Price: $34.08
Price Target: $25.70
● Market Cap: $19.01B
● Beta: 2.00
● EPS: $0.03
● PE Ratio: 1105.83
● 52 Week High: $44.12
● 52 Week Low: $21.32
● Toast posted its first quarter of profitabiltiy (Q4 2024: $33M)
● GPV for FY 2024 increased 26% y/y, while ARR grew 34% y/y
● The fintech industry faces headwinds due to anticipation of decreased consumer spending
Competitor Statistics from Q4 2024

EV/EBITDA: 26.9x
Revenue (LTM): $3.33B

EV/EBITDA: 31.5x
Revenue (LTM): $24.12B

EV/EBITDA: 10.0x
Revenue (LTM): $31.8B

Toast is a cloud-based restaurant operating system powering point-of-sale (POS), and offers online ordering, payroll, and payment processing for over 120,000 restaurants, with a heavy focus on non-enterprise SMB establishments Though the company has benefited from the long-term digitization of restaurants, the underlying financial model and near-term expansion ambitions are showing signs of weakness Toast relies on low-margin payment processing for over 80% of revenue, and its expansion into Europe and retail is financially risky and operationally misaligned. As macroeconomic pressure weighs on SMBs, Toast’s GPV-based revenue is vulnerable to churn and transaction slowdown. Regulatory constraints and market saturation also present long-term headwinds, which I believe the current valuation fails to reflect.
As of April 10th, 2025, Target Corporation was trading at $34.08 per share. I believe that this equity is overvalued and will decrease to $25 70 within the current year I conducted a Discounted Cash Flow Analysis using the fintech payments industry EBITDA multiple of 19.8x and a WACC of 9.0% across 5 years to arrive at this valuation My assumptions are based upon Toast’s historical data and a conservative view of Toast’s future performance.
Toast’s growth has historically come from rapid SMB merchant acquisition. However, the company already serves ~14% of U.S. restaurants, many of which are not ideal targets for further upsell or device expansion (threshold is ~6 devices) To follow, investor guidance on Toast’s European expansion is misguided. Toast relies on a per-transaction take-rate of 2 6%-2 7% for over 80% of its revenue Europe’s market is vastly different in each of the aspects that drive Toast’s US market, namely ,with the limitation on interchange fees and the restaurant density. Interchange fees in the EU are capped at 0 2%-0 3%, and there are 0 51 restaurants per 1000 in the UK, compared to 3.125 restaurants per 1000 in New York. This, paired with the lack of brand equity for Toast’s fintech platform, creates an environment that will stifle the ~48% growth that Toast has seen over the past year
Toast’s heavy reliance on small and medium-sized businesses (SMBs) exposes it to heightened volatility, particularly during periods of economic uncertainty. SMB restaurants often operate with tight margins and limited financial buffers, making them more susceptible to downturns, labor shortages, and inflationary pressures If these businesses underperform Toast’s gross payment volume (GPV) which drives over 80% of its revenue declines accordingly Compounding this issue is Toast’s unfavorable revenue mix: only 13% of revenue comes from high-margin, recurring SaaS subscriptions (with ~70% gross margins), while the dominant 82% comes from transaction-based fintech revenue with gross margins of just ~23% The remaining 5% hardware and onboarding services are loss leaders. This mix limits Toast’s ability to achieve meaningful operating leverage, especially when growth is tied to onboarding new merchants rather than expanding value per existing customer
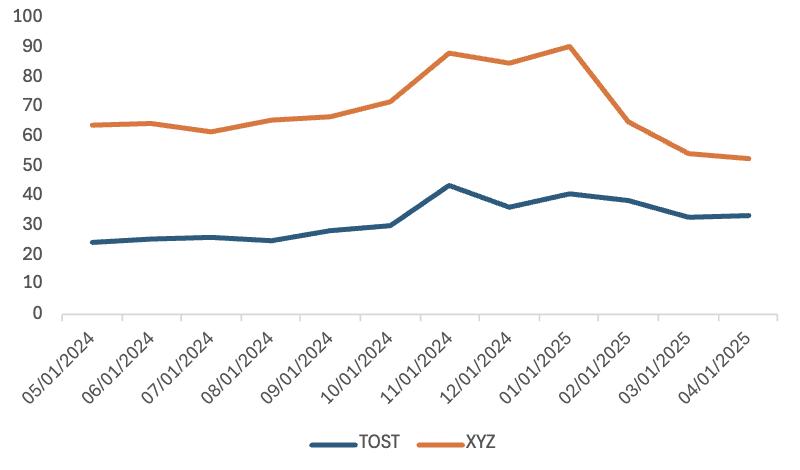
Source: S&P Capital IQ
Risk Potential
While Toast’s revenue is primarily transaction-based (~82% of revenue at ~23% gross margin), its GPV grew 26% y/y to $159.1B in FY 2024. Continued expansion in transaction volume, even at low margins, could fuel top-line growth that supports valuation and investor optimism, even if underlying profitability compresses.
Toast serves as more than a POS; it's the operating system for restaurants and has deeply embedded itself in kitchen workflows, payments, online orders, and back-office functions. This complexity creates high switching costs for SMB restaurants, Toast’s main customer segment. If churn remains low even during macro stress, Toast’s recurring revenue base could prove more resilient than expected in my short thesis
Despite already serving ~14% of US restaurants, Toast still has a runway among the 400k+ independent restaurants in the U.S., many of which still use legacy systems. With more than 50% of restaurants still operating with outdated POS infrastructure, the tailwind from digital penetration remains intact.
Sources: pos toasttab com | Refinitiv | IBIS World | Yahoo Finance | block xyz | affirm com | Capital IQ | Robinhood
Kristian Suh | April 10, 2025
Rating: Sell
Current Price: $22.87
Price Target: $19.60
● HP Lays Off Up to 2,000 Employees, aiming to save $300 million through job cuts
● HP rolls out new AI-powered laptops and desktops for enterprises
● HP and other tech giants face pressure to raise prices amidst tariffs

HP Inc is a global leader in personal computers and printing, but its core businesses face significant structural challenges After a temporary pandemic-era boost in PC demand, the market has cooled dramatically amid macroeconomic challenges HP’s Personal Systems segment enjoyed a 3-quarter period of modest revenue growth in FY25, driven primarily by a consumer trend to upgrade their devices after the pandemic However, this rebound has also masked deeper issues where PC sales and profitable segments of HP’s business model continue to decline

Competitor Statistics from Q1 2025 Revenue: $23.93 B Revenue: $66.02 B
As of April 10, HP is trading at $22.87. HPQ currently trades at 7-8x forward earnings, however, I believe that this equity is overvalued and expected to decrease to $19. I arrived at this conclusion via relative P.E, applying 5.5x of the FY25 EPS estimate of $3.50, which yields a target price of $19. Notably, HP carries a leveraged balance sheet with net debt of $10.9 billion as of January 2025. Furthermore, HP’s operating margin and flat-to-declining sales and earnings trajectory continues to contracts as its revenue shifts from high-margin printing In Q1FY25, HP’s non-GAAP operating margin slipped to 7.3% from 8.4% a year prior My Sell recommendation reflects my belief of HP’s limited growth prospects where further downside is likely as cyclical tailwinds fade and competitive and macro challenges become more salient.


Revenue: $11.4B
Fiscal 1Q 2025 revenue grew just 2.4% YoY to $13.5 billion. This growth, however, came entirely from commercial PC demand and higher average selling prices from inflation and other macroeconomic factors. In its other segments, consumer PC and printing continued to decline Furthermore, despite this modest growth of 2.4%, Q1FY25 shows that non-GAAP net earnings dropped 13% YoY, indicating a trend of diminishing operating leverage Current market pressures on inflation and geopolitical uncertainty regarding U.S tariffs serve to exacerbate HP’s leveraged balance sheet and diminished operating leverage HP’s Printing unit, with 19% operating margins, saw revenues decline 2% in FY 25 Q1. Consumer and commercial printing hard sales also appear weak overall. Hardware unit sales declined 17% in FY 24 Q2; flat to -4% in Q3. In response, HP has pursued cost reduction programs aggressively. HP expanded its restructuring program (“Future Ready”) to target $1.9 billion in annualized cost savings by end of FY25, up from its original $1.6 billion goal. Amidst this restructuring, HP has cut roughly 9000 jobs since 2022 and have pursued other savings measures. While these cuts should offset some of the margin pressure, it also highlights management’s view of persistently low growth to preserve profitability amid revenue stagnation.
Kristian Suh | April 10, 2025
HP has attempted to reinvigorate its portfolio by launching segments in AI and hybrid work. HP recently launched a line of “AI-powered” PCs, which saw initial success in the commercial segment with AI PC sales showing +25% in FY25 Q1. Additionally, HP acquired Poly, a video conferencing hardware, and other hardware businesses in an attempt to diversify its market position and portfolio However, despite these attempts, AI PCs have not boosted overall PC demand and have struggled to grab the attention of the mass market, as the benefits remain unclear to buyers
With limited cash, and a lackluster expansion into new business lines of AI PCs and other acquisitions, HP remains an aggressive repurchaser of its own stock. For fiscal 2024, HP’s dividend payment of $0.276 per share resulted in cash usage of $300 million. Furthermore, HP also repurchase approximately 17.1 million shares of common stock for $600 million, and increased its share repurchase authorization to $10.0 billion.
If global economic conditions markedly improve through lower inflation and interest rates stimulating spending, consumer demand for PCs, printers, and hardware could exceed my original assumptions Similarly, resolutions of tariffs and trade disputes could remove potential headwinds and rally confidence and optimism in the market.
It is possible that with the market frenzy on AI, exerting pressures on hardware demand, there could be a more robust PC Upgrade cycle with PC shipments and sales rebounding more sharply If PC sales rebound more sharply, this would beat the original revenue and earnings estimates Such a cyclical upside could push the stock higher
Sources: McKinsey & Company | CFRA Equity Research | Wall Street Journal | Yahoo Finance |Reuters | Insight Trends | Bloomberg | Capital IQ | Financial Times
The consumer & retail sector has started out the year in a tumultuous market, navigating a climate of geopolitical uncertainty and borderline stagflation has put pressure on consumers. Market wise, this has translated to investors seeking safe havens for their capital, and a rotation toward defensive sectors such as tobacco and low-cost retail. The consumer staples side has shown resilience as Americans continue to prioritise essentials, evidenced by the Consumer Staples ETF (XLP) showing gains of 4.4%, outpacing the S&P’s 5.1% loss year-to-date. Businesses have started to see normalisations, as after a year of hefty price increases in 2022–23, staples companies are seeing cost pressures moderate. Inflation for food and consumer products has decelerated (food prices up about 3.0% year-on-year in early 2025), relieving some margin pressure. High flyers in this space include Phillip Morris (PM), whose smoke-free push and broader capital rotation has seen the stock gain 41.5% YTD
On the staples retailer side, value-focused grocers and big-box retailers such as Walmart, Costco, and dollar stores reported solid traffic as cost-conscious consumers flock to stores known for low prices. In contrast, some conventional supermarkets and pharmacies face stagnating growth. The proposed mega-merger of Kroger and Albertsons collapsed in December 2024 due to regulatory opposition, halting what would have been a $25 billion consolidation of two grocery giants. Courts blocked the deal on antitrust grounds, and the firms have since traded lawsuits blaming each other for the failure. The merger’s demise highlights regulators’ stricter stance on retail consolidation, even as the grocery industry seeks to utilise economies of scale to offset thin margins. Business strategy has shifted in M&A markets to divestitures to slim down and prioritise core segments. Meanwhile, regional grocers and discounters are expanding selectively, and private-label products are capturing greater market share as consumers look to save money.
The macroeconomic front has led to discretionary names lagging amid uncertainty, and a consumer burdened with historically low savings rates has still remained resilient and provided some buoyancy to these names What is interesting to me is that although savings rates keep declining, consumption as a percentage of the economy is still north of 20%, the highest we have seen since the Financial Crisis
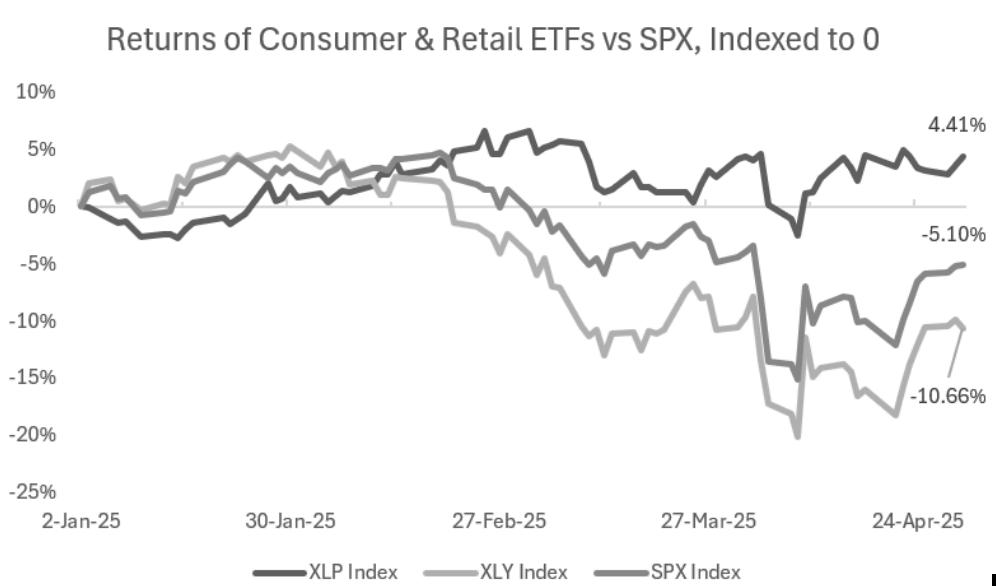
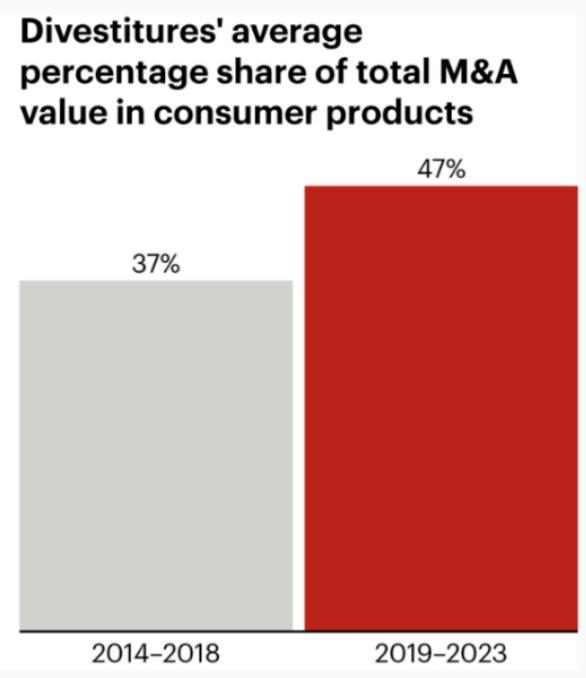
Sustainability in this segment would necessitate higher spending on credit cards and BNPL, both of which significantly increase consumer credit. So far in 2025, the Consumer Discretionary ETF (XLY) has seen significant capital outflows, losing 10.9%. This was partly driven by a slide in heavyweight components (Tesla, Amazon) on growth fears, but it also reflects a broader expectation that consumer spending on goods will slow.
One of the most telling subverticals of discretionary spending is apparel retail, which has been experiencing a dramatic post-pandemic shakeout. During the pandemic, clothing sales were volatile, plummeting in 2020, then rebounding strongly in 2021–2022 as consumers refreshed wardrobes and returned to events Now, in late 2024 and early 2025, the fashion industry’s performance is bifurcated. On one hand, certain apparel players have recovered or even thrived by adapting to new trends, but legacy department stores are struggling to regain footing in a changed retail landscape.
A symbol of the turmoil in apparel retail is the bankruptcy of Hudson’s Bay Company. In March 2025, HBC filed for insolvency protection and announced plans to liquidate the vast majority of its stores, coming after an announcement last year by the company to sell Saks Fifth Avenue to Neiman Marcus. The shift to omnichannel retail and protecting the legacy of core department stores is still proving to be a struggle, and combining this with overall uncertainty highlights the broader trend for most consumer & retail companies going into the latter half of the year - how do you balance the long term secular trends with immediate uncertainty?
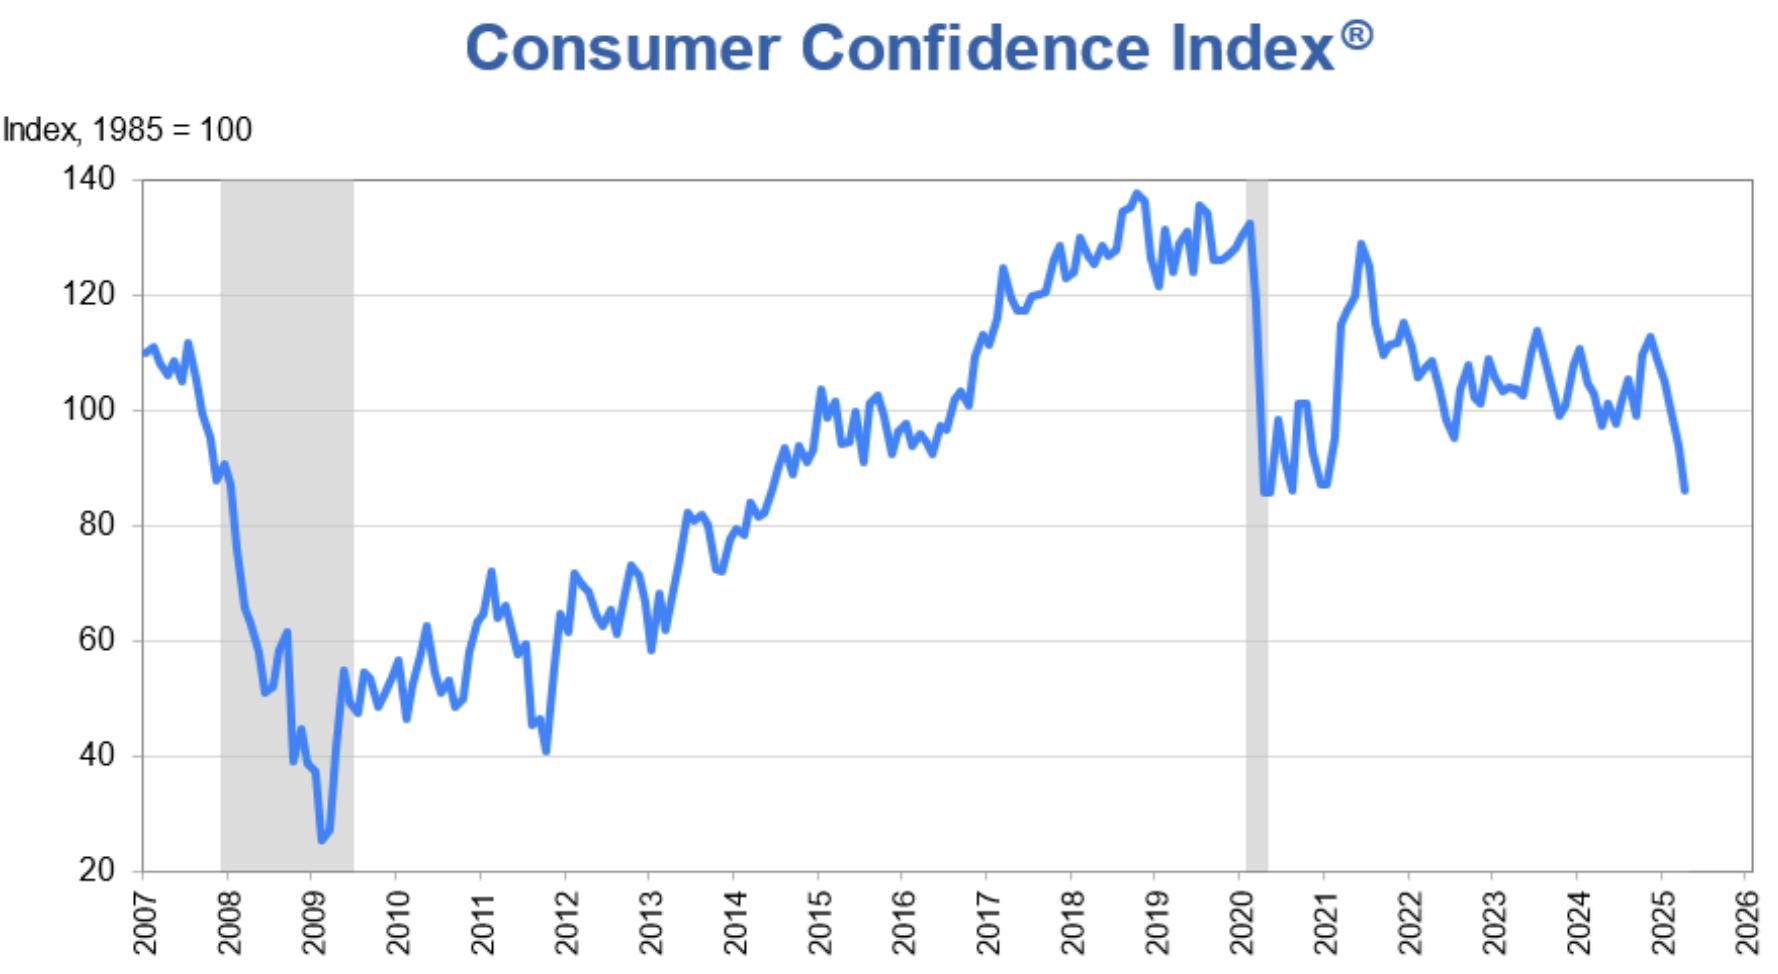
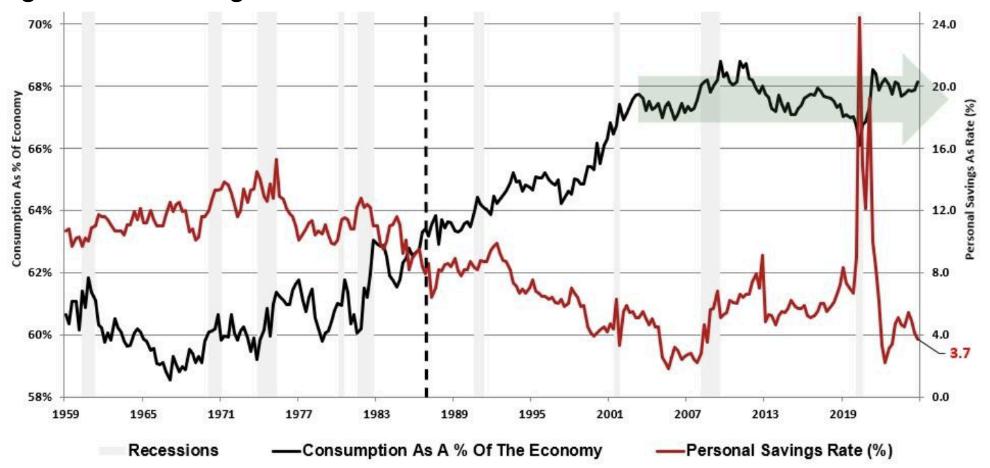
Aditya Mehra| April 29, 2025
Rating: Buy
Current Price: $23.11
Price Target: $48.30
Company Updates / News
● Market Cap: $44 68B
● EPS: 0 54
● PE Ratio: 43.38
● 52 Week High: $24 46
● 52 Week Low: $17 67
● Dan Loeb’s Third Point Capital started to build a stake in Kenvue as reported by the Fianncial Times
● In Q4 this year, revenue decreased 1% from Q4 last year, underperforming street expectations by $109mn
● The personal care industry faces headwinds due to a decelerating consumer
Competitor Statistics from FY2024
EV/EBITDA: 16.67x

Kenvue Inc. operates as a pure-play consumer health company, delivering science-backed innovative products and solutions in more than 165 countries As the largest pure-play consumer health company in the world, reaching 1.2 billion consumers daily, Kenvue benefits from participating in categories where reliability and performance matter for consumers The company operates at the intersection of healthcare and consumer goods, combining the stability of a staples business with opportunities for margin improvement and unlocking strategic value Spun off from Johnson & Johnson in 2023, Kenvue owns a portfolio of notable brands (Tylenol, Listerine, Aveeno, Band-Aid, etc) that enjoy strong consumer loyalty and dominate markets in many regions The stock has underperformed since its IPO, down 12 8%, and trades at a discount relative to its peers. I believe this discount is unwarranted, given Kenvue’s durable cash flows and high margins, which are expected to expand as the company accelerates growth and streamlines cost inefficiencies Additionally, shareholder catalysts are emerging through activist investors, including Dan Loeb’s Third Point, who are pushing for strategic changes to boost performance In my view, Kenvue offers a compelling risk/reward profile: a defensive business (3 5% dividend yield) with upside potential from operational improvements and strategic actions. The investment thesis is that Kenvue can deliver mid-single-digit earnings growth via margin expansion and brand investment, even on low organic sales gains, supports a higher valuation in line with consumer health peers.
R EV/EBITD
Revenue: $19.75B

EV/EBITDA: 59.05x
Revenue: $6.11B
As of April 29th , 2025, Kenvue was trading at $23.38 per share. I believe that this equity is undervalued and will increase to $48 30 within the next two years I conducted a Comparable Companies Analysis by analysing peers’ EV/EBITDA, EV/Revenue, and Price/Earnings multiples, and averaging the median results in accordance with Kenvue’s current statistics Given Kenvue’s diversified business (operating in three primary segments: Self Care, Skin Health & Beauty, and Essential Health), I chose a set of companies that closely represented each of their segments in size and geographic presence This set of comps included Estée Lauder Companies, Coty Inc., Kimberly-Clark, Colgate-Palmolive, Church & Dwight Co., and e.l.f Beauty.
Kenvue’s FY 2024 earnings reports were largely mixed, with misses on both the top and bottom line, but buried deep within the report, the company showed promising signs of operational improvements that continue to mitigate risks endemic to the market. Over the past year, the strong US dollar masked organic sales growth of 1 7%, which comprised 1% price growth and 7% volume growth The weakening dollar, which is expected to persist over the remainder of 2025 means that it is very possible that EPS will see gains over guidance. The reason why this is favourable for Kenvue above their peers boils down to Kenvue’s revenues being very well diversified across regions.
With nearly 50% of revenue coming from foreign markets, foreign exchange has a significant impact on their net sales For 2024, a stronger dollar resulted in a 1 8% reduction to their top line, and Kenvue expects a ~3% headwind to net sales growth from FX translation in 2025, as well as a mid-single-digit unfavorable impact on adjusted EPS. With all macroeconomic trends pointing toward a weaker dollar for 2025, If the dollar reverses that 3% headwind, reported sales would rise by roughly the same amount, all else equal. For a $15.5 billion revenue base, a 3% tailwind adds nearly $465 million to the top line. Furthermore, in relation to Kenvue’s working capital management, it is worth noting that Kenvue was able to extend days payables outstanding by 17 days, and reduce inventory days to below 100 days from 108 last year This describes a company that is able to move product efficiently with little friction, and management certainly deserves credit.
One notable aspect is that Kenvue is “increasingly viewed as a takeover target.” Toms Capital, another activist, explicitly urged considering a sale of Kenvue or parts of it. Third Point, by joining this campaign, may similarly advocate for exploring strategic options Kenvue could be attractive to larger consumer goods companies or private equity at the right price, given its stable of brands. Loeb’s fund might push management to hire advisers to review merger or sale opportunities, effectively putting the company in play Even absent an outright sale, Third Point could encourage portfolio optimization, for example divesting non-core brands or even splitting the company by segment (though Kenvue’s segments are interrelated, one could imagine separating faster-growth Skin Health & Beauty from the rest if it would fetch a higher multiple). Third Point’s involvement “sparks speculation about potential moves, including a sale of non-core assets or a broader corporate split,” as one analysis noted
Kenvue vs Church & Dwight Co (1-Year)
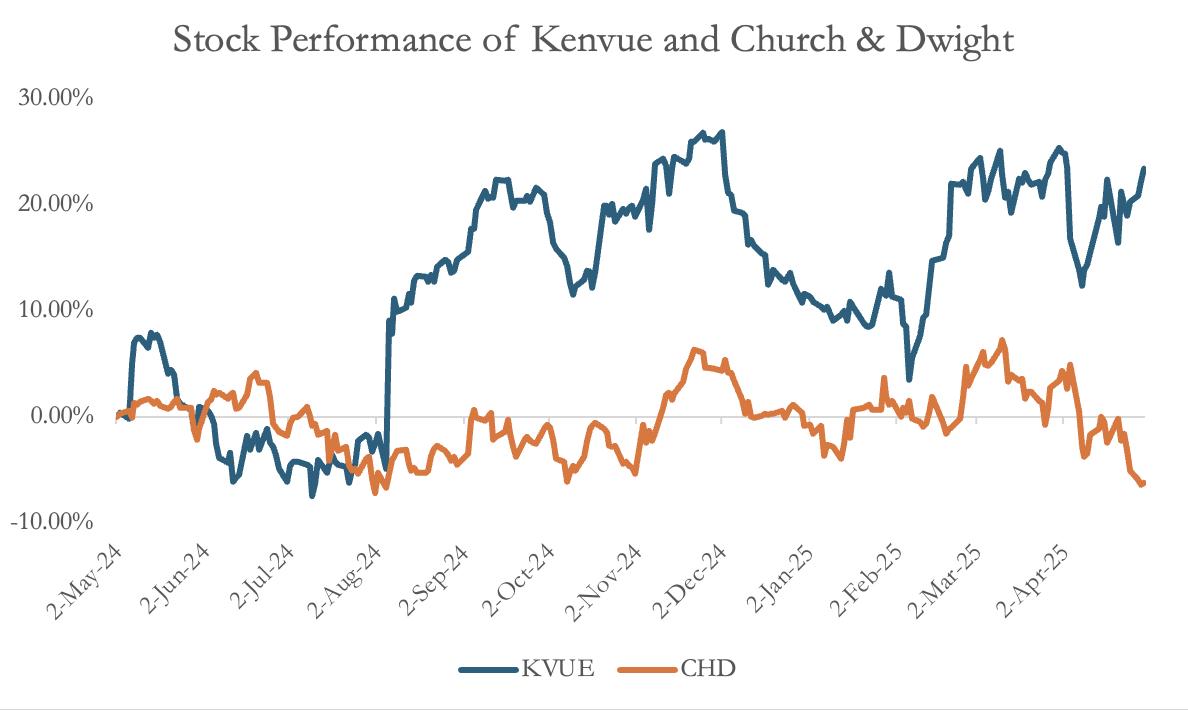
Source: S&P Capital IQ
Aditya Mehra| April 29, 2025
Although extremely diversified across various industry-leading brands, comprising a portfolio of 22 notable brands, this poses a risk to Kenvue. A core risk is that Kenvue’s organic revenue remains stagnant or grows <1% long-term, due to a lack of breakthrough innovation or loss of market share. The consumer health market is competitive, as rivals like P&G, Haleon, and more recently, private-label store brands continually pressure pricing and launch new products. If Kenvue cannot keep its brands relevant, especially to younger consumers, sales could underperform. However, Kenvue’s category leadership and brand equity give it a strong starting position (Tylenol, Listerine, and Band-Aid for example are often consumers’ default choices), and management has committed to maintaining R&D spend to refresh product lines.
Spin-offs inherently pose risks to the entity being spun off, as Kenvue’s recent spinoff from Johnson & Johnson in 2023 necessitate time to establish its own corporate functions and strategy separate from J&J. Execution mishaps during this transition could temporarily disrupt operations or lead to higher-than-expected costs. However, the leadership team, CEO Thibaut Mongon and CFO Paul Ruh, are experienced J&J veterans who know the business intimately and have retained key talent.
Target’s earnings are negatively impacted by the overall economic outlook. As customers refrain from making unnecessary trips to the store, they are less likely to make unplanned purchases, which accounts for nearly 21% of the company’s revenue. The current 8% inflation rate makes many items in stores unaffordable for the average consumer. Additionally, rising interest rates will further decrease consumer spending.
Sources:
Erin Limb| April 14, 2025
Rating: Hold
Current Price: $367.95
Price Target: $445.70
● Market Cap: $16.643B
● Beta: 1.15
● EPS: 25.34
● PE Ratio: 14.50
● 52 Week High: $460.00
● 52 Week Low: $309.01
● Announced a pause in expansion to more Target stores
● Net sales decreased by 1.9% YOY during the quarter
● Weaker performance attributed to “dynamic environment" causing “incremental pressure on consumer spending”
Competitor Statistics from Q4 2024

EV/EBITDA: 8.7
Revenue: $15.18B
EV/EBITDA: 3.5
Revenue: $3.72B
EV/EBITD

Investment Thesis:
Ulta Beauty is the largest beauty retailer in the U.S., operating over 1,350 stores across 50 states. The company offers a unique combination of cosmetics, skincare, fragrance, haircare, and salon services, featuring both mass and prestige brands Ulta’s differentiated model offering a wide selection across price points, an inclusive customer experience, and in-store beauty services positions it as a one-stop shop in the beauty category The company also leverages a strong loyalty program (Ultamate Rewards) and omnichannel capabilities to drive customer engagement. Despite headwinds from slowing discretionary spending and increasing competition (e g , Sephora at Kohl’s), Ulta remains well-positioned due to continued consumer demand for affordable luxury and the resilience of the beauty category. I issue a hold recommendation, as the stock may perform in line with the market while Ulta navigates margin pressures and re-accelerates digital growth.
As of April 14th 2025, Ulta Beauty was trading at $367.95 per share. My valuation suggests a modest upside to $445.70 over the next 12 months. I conducted a Discounted Cash Flow (DCF) analysis using a terminal growth rate of 3 5% and a cost of equity of 9.2%. The model reflects stable top-line growth with mid-teens margins but accounts for rising SG&A and promotional pressures in a cautious consumer environment While the intrinsic value points to potential upside, current macroeconomic risks and limited near-term catalysts support a hold rating.
Ulta continues to expand its footprint through new store openings and its shop-in-shop partnership with Target, which is expected to scale to over 800 locations The company is investing in omnichannel innovation, including same-day delivery, personalized app features, and virtual try-ons, aiming to create seamless beauty experiences Additionally, Ulta’s internal brands and exclusive partnerships (e.g., with Fenty Beauty) offer high-margin revenue opportunities. These initiatives are supported by Ulta’s strategic focus on Gen Z and Millennial consumers through influencer campaigns and digital content Long-term, the company targets low-double-digit EPS growth and intends to return capital to shareholders through buybacks
While broader retail faces macroeconomic headwinds, the beauty category continues to show resilience Ulta is well-positioned to benefit from the "lipstick effect" the trend where consumers splurge on affordable luxuries during economic downturns. Beauty remains one of the last categories where consumers cut spending, and Ulta's mix of value and prestige brands gives it flexibility in capturing this demand In the most recent quarter, cosmetics and skincare remained growth drivers even as other discretionary categories slowed The strength of Ulta’s loyalty program (over 41 million members) and recurring purchase behavior provide defensive qualities during periods of uncertainty.
Erin Limb| April 14, 2025
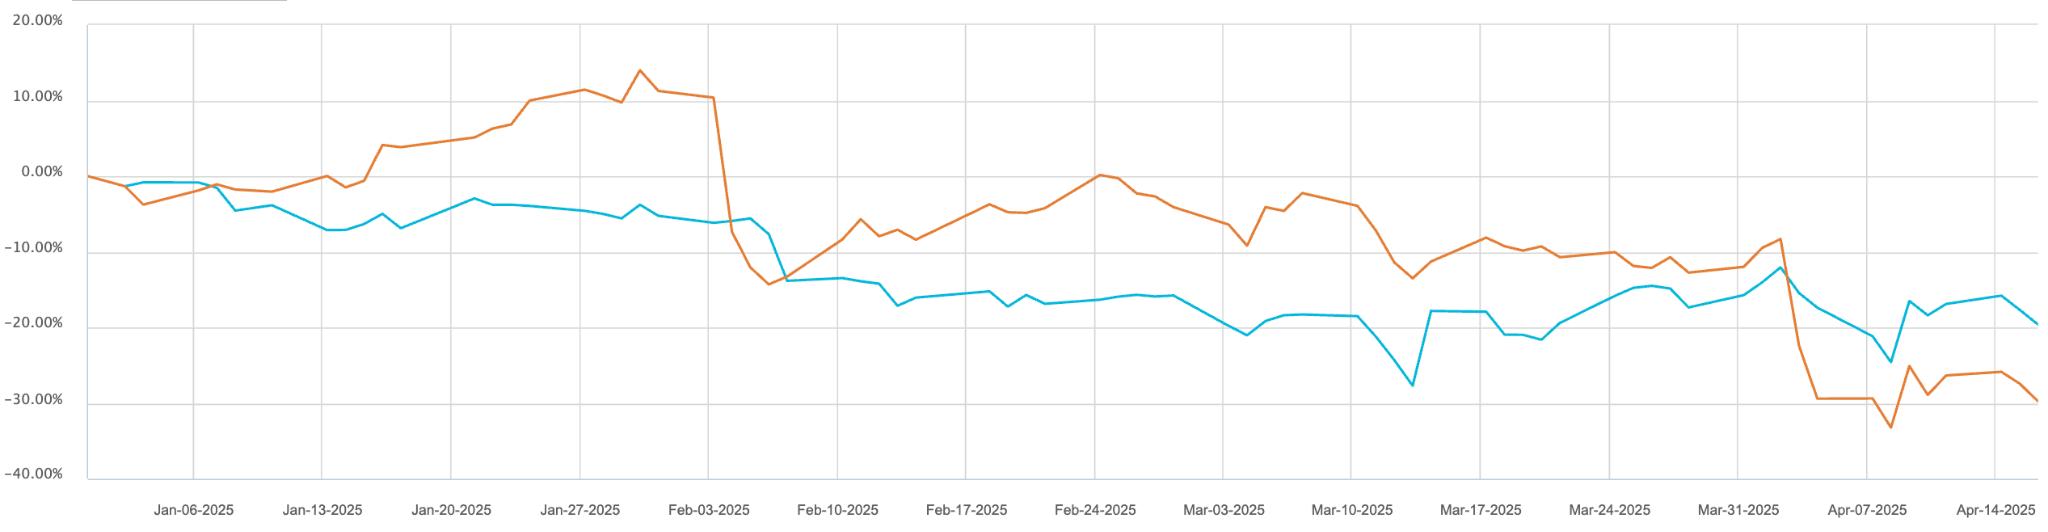

Source: S&P Capital IQ
Risk Potential
Shrink and Retail Crime
Ulta Beauty, like other retailers, faces increasing risk from organized retail crime and theft. The beauty category includes small, high-value items that are especially vulnerable to shoplifting. As organized theft continues to rise across the industry, Ulta may face higher shrink rates, additional security costs, and pressure on gross margins. The company must coordinate with local authorities and invest in loss prevention technology to mitigate these risks while maintaining a positive in-store experience.
Ulta may experience short-term margin compression due to elevated inventory levels and a more promotional retail environment. As consumer spending on discretionary items slows, Ulta may need to offer discounts to maintain traffic and move seasonal stock, especially in lower-performing store locations. These promotional activities could erode gross margins if not managed carefully.
Although beauty is more resilient than many discretionary categories, Ulta is not immune to broader economic trends. Inflationary pressure on input costs, rising wages, and potential shifts in consumer behavior (e.g., trading down from prestige to mass brands) could impact sales mix and profitability. Additionally, rising interest rates and reduced disposable income may lead to fewer high-ticket beauty purchases, lower salon traffic, and decreased basket sizes, especially among price-sensitive demographics.
Sources: Yahoo Finance | Capital IQ
Estate Spring 2025
In the �rst quarter of 2025, Real Estate InvestmentTrusts (REITs) experienced varied performances across sectors, in�uenced by macroeconomic factors, including newtari�s introducedbytheTrumpadministration.
Industrial REITs demonstrated resilience in Q1 2025, driven by supplyconstraintsandstrongdemandforlogisticsandwarehousespaces. TheglobalREITindexreporteda90%totalreturnforindustrialREITs duringthequarter,withNorthAmericanindustrialpropertiesachievinga 958%occupancyrate UBSanalystsnotedthatREITs,includingthosein the industrial sector, outperformed the broader market amid ongoing economic uncertainty, citing their minimal international exposure and backing by real assets asadvantagesduringvolatileperiods Forinstance, Prologis, a leading industrial REIT, experienced a 14% dropinitsstock price following the announcement of new tari�s, re�ecting investor apprehension over the impact on logistics demand and warehouse utilization
RetailREITsexhibitedmixedperformanceinQ12025,in�uenced by shifts in consumer behavior and economic uncertainties. UBS analystshighlightedthatretailREITsmayfacechallengesduetopotential declines in consumer demand, with sectors sensitive to discretionary spending, such as mall operators, experiencing stock declines Notably, Simon Property Group, a prominent retail REIT, saw its stock price decline during the quarter, re�ecting concerns over weakenedconsumer spendingandadecliningstockmarketa�ectingluxurybuyers.
Following President Trump's announcement of new tariffs, we saw a significant decline in US Real Estate Investment Trusts (REITs) The S&P 500 and Dow Jones Industrial Average both experienced losses, with the S&P 500 falling 0.96% and the Dow Jones decreasing by 0 57% However, the SNL US REIT Equity Index saw a more substantial drop of 2.51%, indicating that REITs were more sensitive to the tariff news compared to other sectors Particularly hard-hit were hotel REITs, with the SNL US REIT Hotel Index declining by 4.87%, reflecting investor concerns about reduced travel and hospitality demand due to the tariffs
Metrics and Graphs
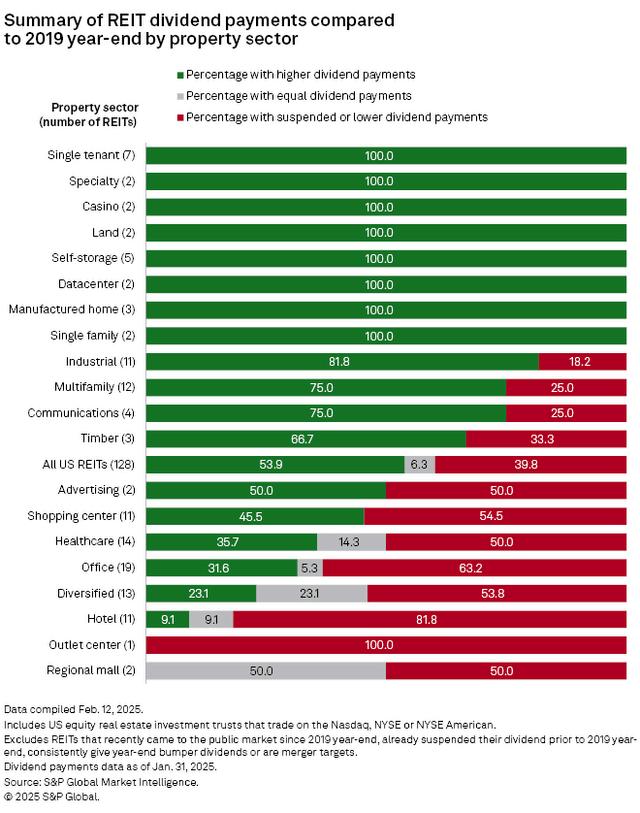
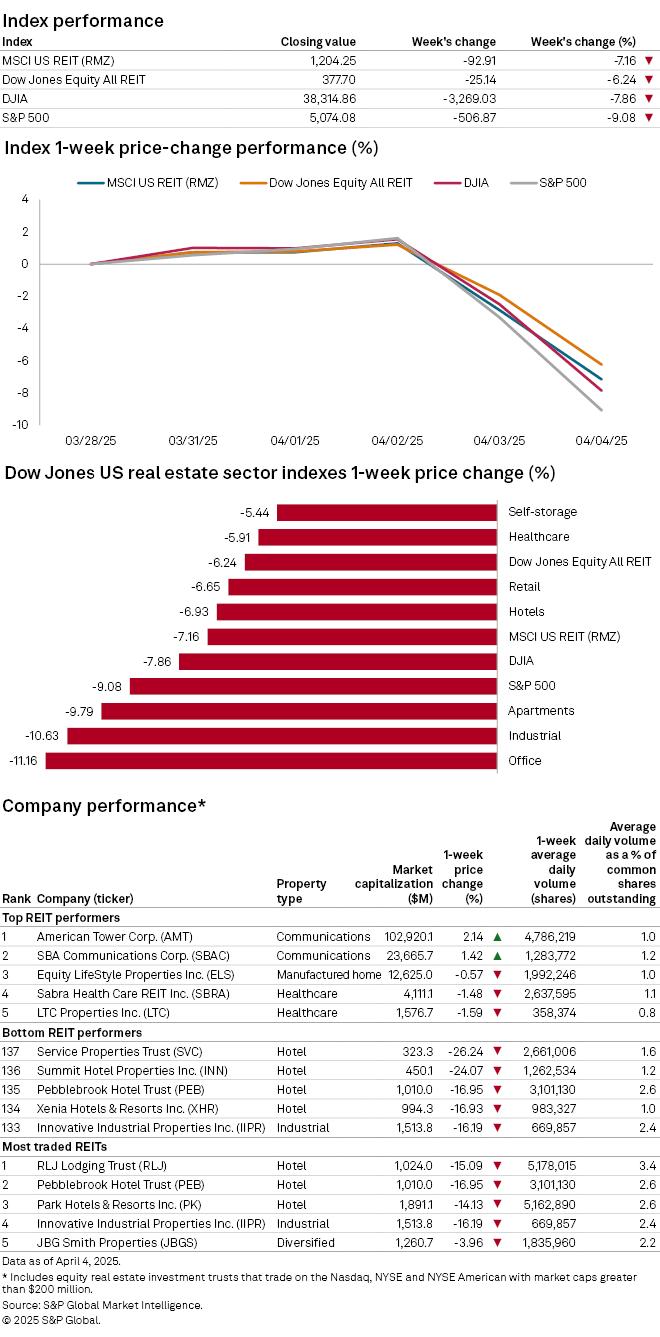
Figure 2. Company Performance Post-Trump Tarrif Announcement on April 2nd, 2025 (Source: S&P 500)
As of May 2025, the outlook for hotel Real Estate Investment Trusts (REITs) reflects a blend of moderate optimism and heightened caution. The sector has shown resilience in the face of recent macroeconomic challenges, but headwinds are mounting. Strong U.S. travel demand and strategic expansions by key players are helping sustain investor interest, though concerns over a cooling economy and slowing revenue growth are tempering enthusiasm.
Domestic travel in the US has remained steady in early 2025. During peak travel periods, the Transportation Security Administration (TSA) reported processing over 3 million passengers daily, setting new records for U.S. airport traffic. This surge in travel has helped maintain occupancy rates and helped support revenue per available room (RevPAR), particularly for the U.S.-focused REITs such as Park Hotels & Resorts Inc (PK), which is currently trading near $10 04 The company is capitalizing on this momentum, declaring a one-time oversized dividend and expressing intentions to return more capital to shareholders Similar strategic actions by other REITs signal that management teams are leaning into growth and investor returns despite economic uncertainties
However, this strength in travel demand is not evenly matched by financial outlooks across the sector Goldman Sachs recently downgraded its forecast for hotel performance in 2025, reducing expected RevPAR growth to just 0.4%, down from a prior estimate of 1.4%. This downgrade reflects weakening consumer demand, ongoing inflationary pressures, and uncertainty regarding future travel behavior amid geopolitical tensions and market volatility.
Another macroeconomic factor influencing the sector is the Trump administration’s continued imposition of tariffs, which has led to reduced international travel from regions such as Canada and the EU. Hilton Worldwide Holdings Inc. (HLT), trading near $234, has already revised its 2025 guidance downward, citing global economic uncertainty and weaker inbound travel as key reasons for a projected dip in annual net income
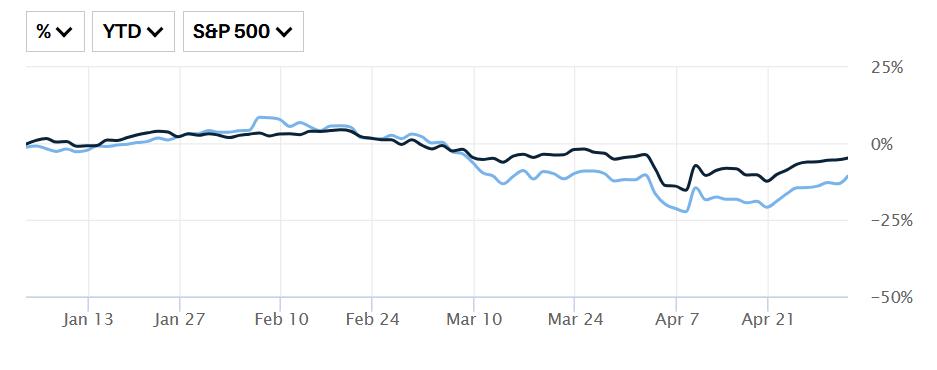
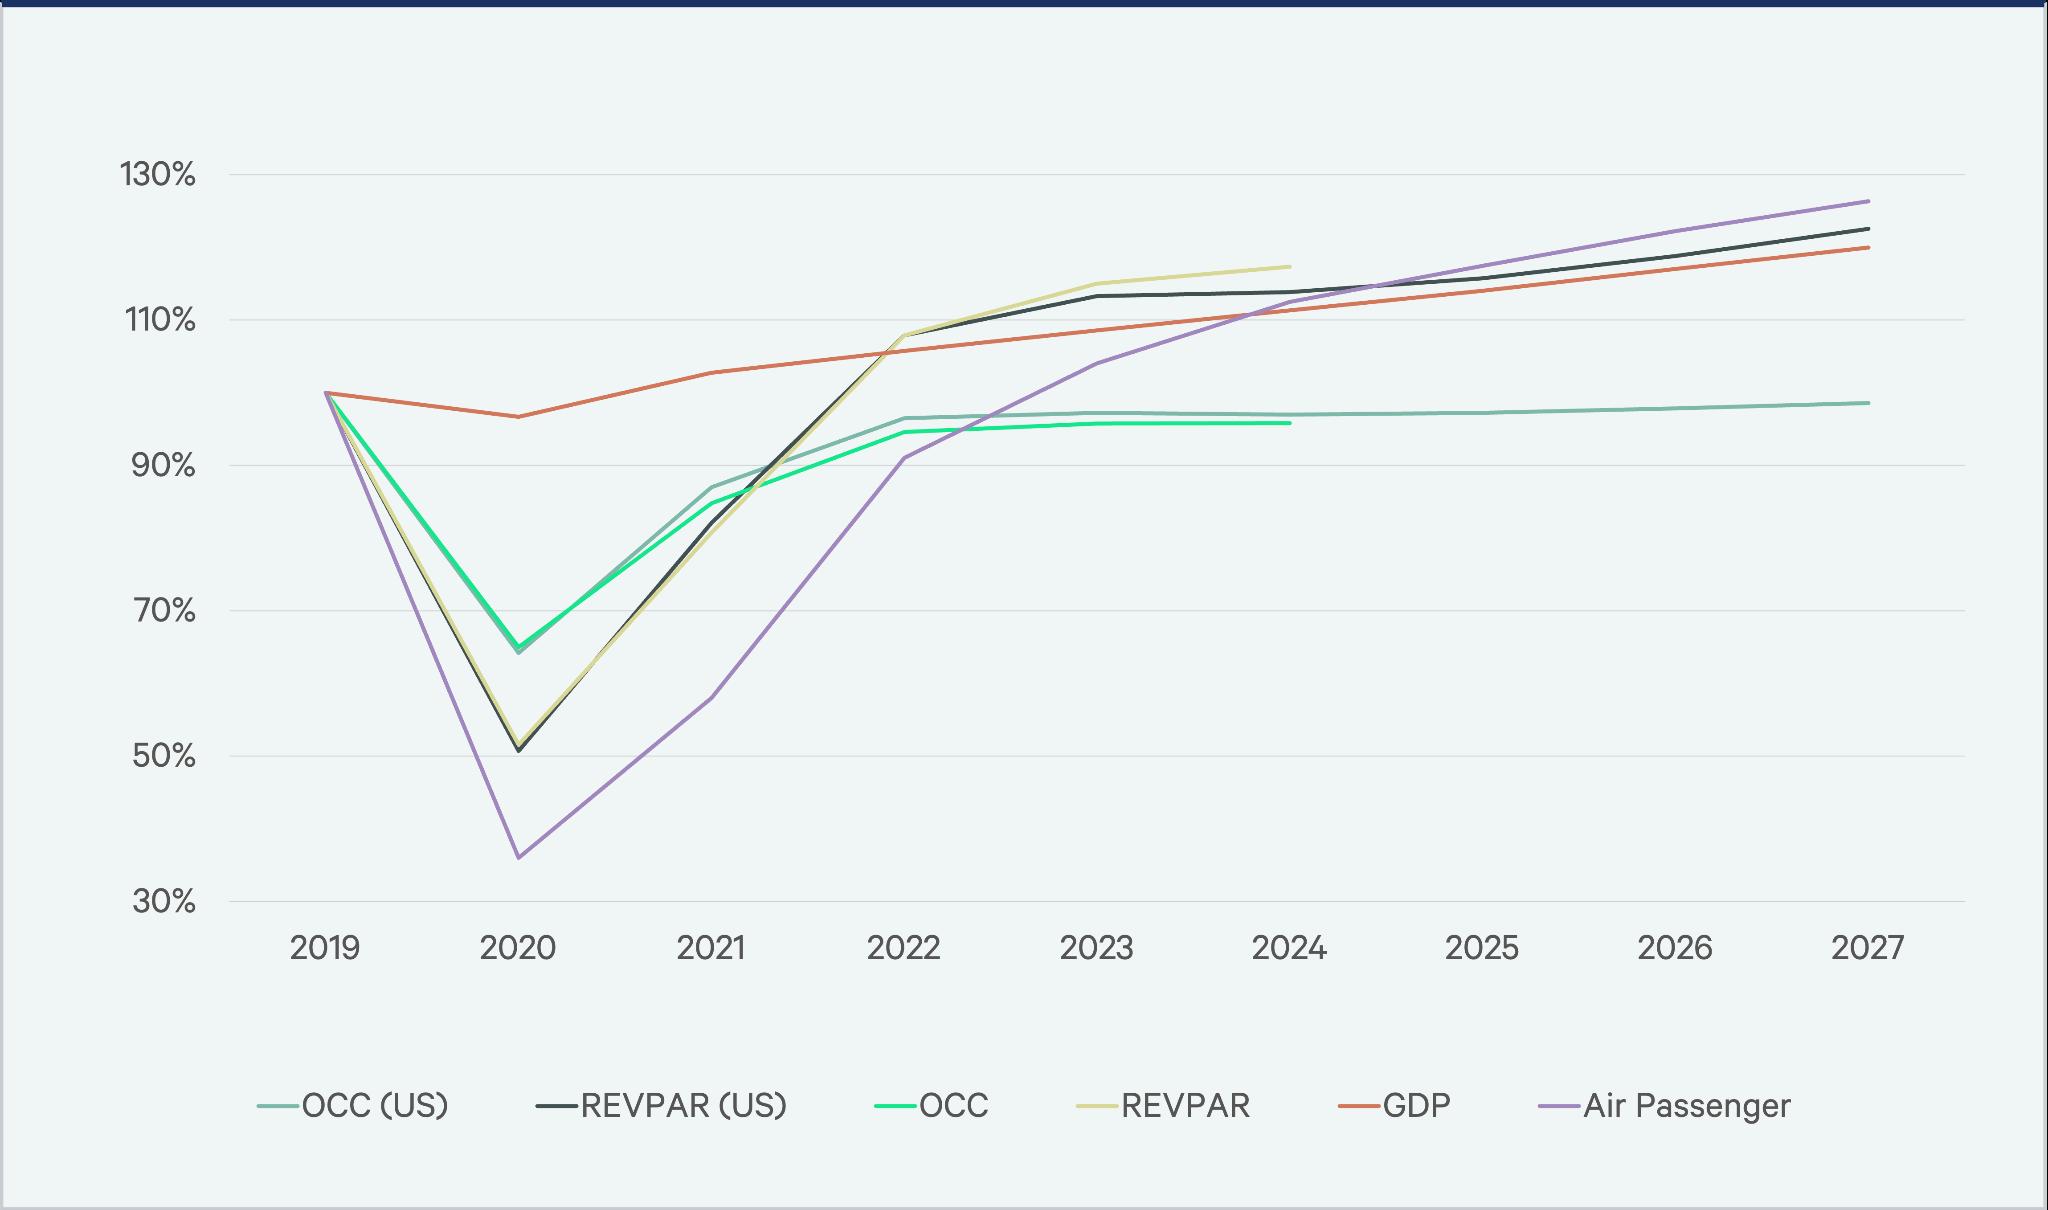
In conclusion, hotel REITs enter the remainder of 2025 with a cautiously optimistic outlook While strong US leisure demand and strategic shareholder initiatives provide a tailwind, softening global travel trends and economic volatility introduce considerable risk going forward Investors will need to evaluate hotel REITs on a case-by-case basis, prioritizing those with solid domestic exposure, flexible balance sheets, and disciplined capital return policies. The year ahead is likely to be marked by selective growth rather than broad-based expansion in the hotel REIT sector.
Isabella Mourelle| April 10, 2025
Rating: Hold
Current Price: $ 115.00
Price Target: $ 285.77
● Market Cap: $10.31B
● Beta: 1.36
● EPS: 2.05
● PE Ratio: 24.7
● 52 Week High: $168.20
● 52 Week Low: $102.74
Competitor Statistics from Q3 2022
Revenue: 761M

EV/EBITDA: 24.5
Revenue: 1.2B

EV/EBITDA: 27.4
Revenue: 1.72B
Hyatt Hotels is a leading global hospitality company with over 1,300 properties in over 75 countries. The brand spans a diverse portfolio, including luxury, lifestyle, and resort destinations, catering to both business and leisure travelers Hyatt’s strategy emphasizes personalized guest experiences, strong loyalty through the World of Hyatt program, and continued expansion into key international markets However, like its competitors, Hyatt has faced profitability pressures due to inflation, labor shortages, and inconsistent travel trends. My hold recommendation reflects the view that while macroeconomic challenges remain, Hyatt is positioned to perform in line with the market as it leverages its upscale brand identity and global development pipeline.
As of April 11th, 2025, Hyatt Hotels Corporation traded at $115 00 per share This equity is undervalued and will increase significantly to $285.77 within the current year. I arrived at this conclusion by conducting a comparable companies analysis, comparing Hyatt to Hilton, Marriott, MGM Resorts, and Wynn Resorts, with a 1.8% growth assumption. My assumptions are based on Hyatt’s historical data and an optimistic view of Hyatt’s future performance in the recovering travel market
In its most recent announcement, Hyatt highlighted its continued global expansion by opening its first 163-room hotel in Ha Long City, Vietnam. The hotel provides business and leisure travelers convenient access to Ha Long Bay, local attractions, and cultural experiences Its thoughtfully designed guest rooms include separate areas for work and sleep, along with all-day dining options, modern event spaces, and scenic amenities such as an outdoor infinity pool The hotel embodies Hyatt Place’s commitment to comfort and functionality This expansion supports Hyatt’s strategic goal of offering personalized and unique stays while deepening its presence in established and emerging travel destinations
In April 2025, Hyatt announced a strategic growth plan for India and Southwest Asia after a record-setting expansion in 2024 The company signed 21 new hotel deals last year and will open seven new properties in 2025 in Ghaziabad, Kochi, Bhopal, Jaipur, and Butwal, Nepal. This expansion focuses on meeting the demands of business, leisure, and cultural travelers in high-growth markets Hyatt is introducing the Destination by Hyatt brand in India while continuing to grow its Andaz and JdV by Hyatt portfolios With a goal of reaching 100 hotels in India within five years, Hyatt aims to become a leader in the hospitality industry, catering to the demand for unique, wellness-focused, and luxury travel experiences.
Isabella Mourelle| April 10, 2025
Hyatt vs. Hilton (YTD)
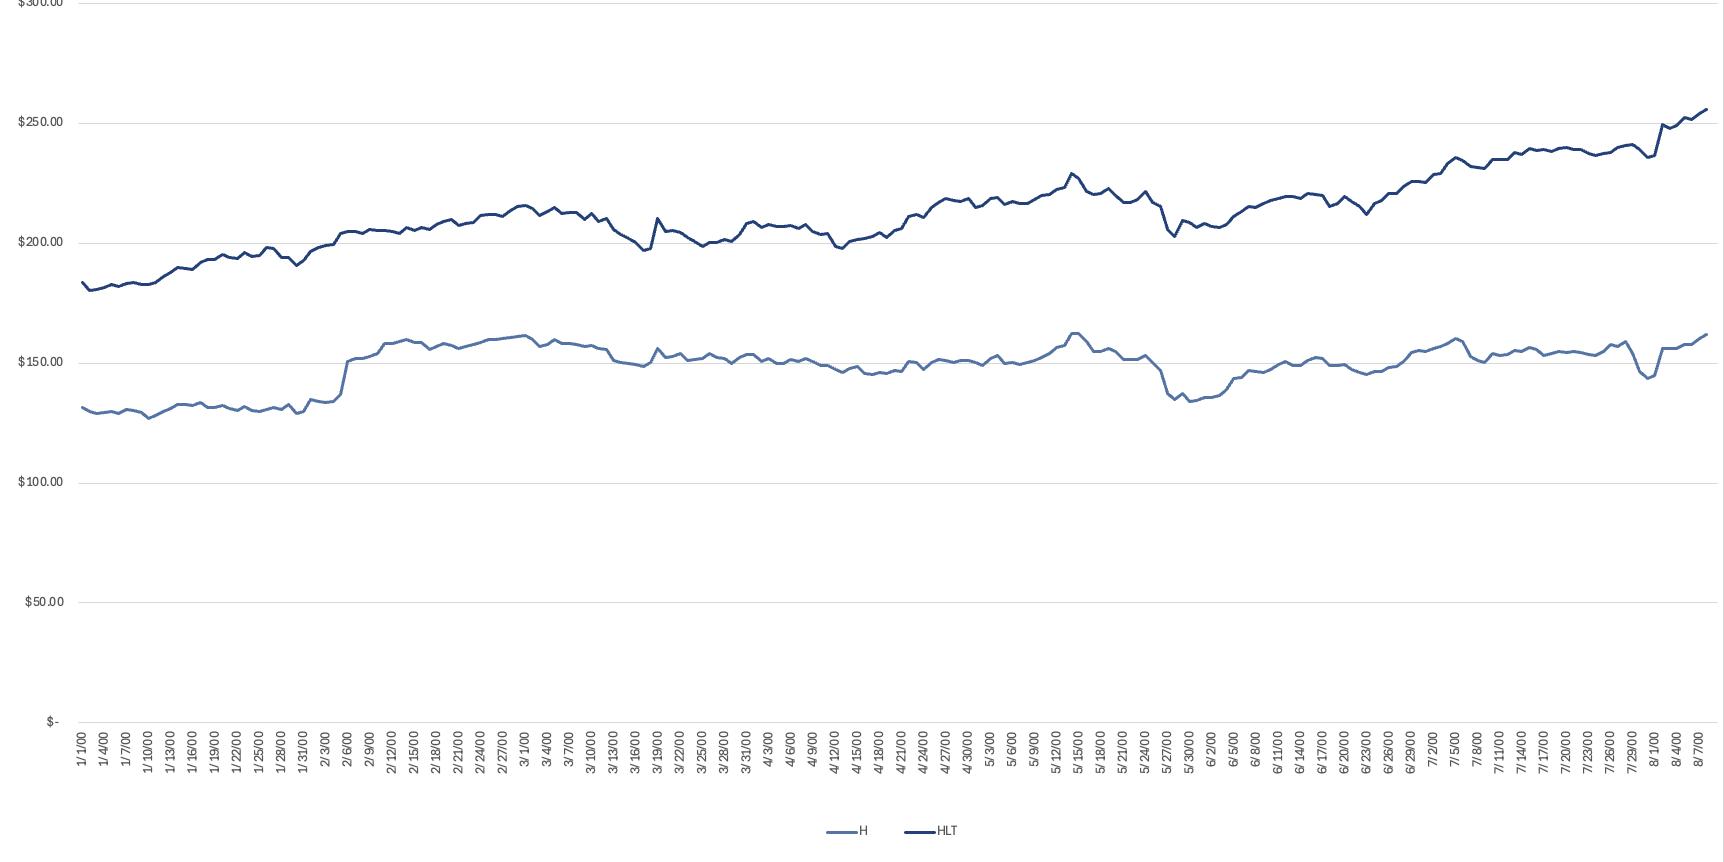
Source: S&P Capital IQ
Risk Potential
Hyatt has significantly increased its luxury and lifestyle offerings, which now represent over 40% of its portfolio. While this attracts higher-margin travelers, it also makes the company more vulnerable to economic downturns, as spending on upscale travel tends to decline during such times. To manage this risk, Hyatt may need to adjust its focus to value-conscious travelers during economic slowdowns.
Hyatt Hotels experiences seasonal fluctuations in demand, with peak periods like summer holidays and regional festivals leading to full occupancy in resort locations. This can strain staffing and operations, causing service delays and increased costs. Conversely, off-peak times result in underutilized resources, affecting revenue. To counter this, Hyatt should enhance dynamic pricing, offer targeted seasonal packages, and expand non-peak initiatives such as wellness retreats and corporate meetings to ensure a steadier flow of guests year-round.
Hyatt has encountered labor disputes in California, where hotel workers have staged strikes for better wages and working conditions These issues can disrupt operations and harm the company’s public image, as seen with the ongoing strikes at the Grand Hyatt in San Francisco To address these challenges, Hyatt should prioritize proactive labor relations by ensuring fair compensation and working conditions to maintain workforce stability
Sources: NY Times | Yahoo Finance | Capital IQ |https://investors.hyatt.com
Julian Dahl | April 10, 2025
Rating: Buy
Current Price: $153.18
Price Target: $168.50
Company Updates/News
● Market Capitalization: $49.98 B
● P/E Ratio: 21.1
● EPS: 2.04
● 52 week high: 190.14
● 52 week low: 136.34
● Its stock saw a 7.33% decrease over the past month as investors brace for the negative impacts of tariffs on retail outlets
Competitor Statistics from Q4 2024

Revenue: $525.4 M
Revenue: $312.8 M

Revenue: $92.8 M
Simon Property Group (SPG) is a U.S.-based real estate investment trust specializing in retail and mixed-use properties in North America, Europe, and Asia. Founded in 1993 and headquartered in Indianapolis, the firm is led by CEO David Simon, who has transformed SPG from a traditional mall owner to a diversified portfolio of luxury physical retail and mixed-use properties In December 1993, SPG went public through an IPO and raised $840 million in the largest REIT IPO in the history of the United States The company has grown to become the biggest market-cap retail-led REIT since then SPG's portfolio is skewed towards Class A properties, and this has served to provide a cushion for market fluctuations over the long term relative to other types of assets. Simon, in recent years, has bet the company on redevelopment projects, converting underleveraged retail space into apartments, hotels, and entertainment hubs to maximize long-term value and hedge against the popularity of e-commerce. The firm has also acquired minority interests in troubled retail brands to stabilize anchor tenants and maintain the retail market. Although retail challenges continue, SPG's size, balance sheet quality, and steady cash flows make it an attractive long-term holding for income- and real estate-exposed investors.
I recommend a buy on Simon Property Group (SPG) based on solid valuation analysis that includes both a forward FFO multiple and a discounted cash flow (DCF) analysis. I arrived at my price target of $168.50 by placing a 13x multiple on SPG's estimated 2026 funds from operations of around $12.96 per share. To cross-check that figure, I also built a DCF model starting with about $5.3 billion of net operating income (NOI) for 2024. If we assume SPG grows that figure by about 2.5% a year for the next five years, driven by consistent leasing and redevelopment of properties, and using a conservative terminal growth rate of 1.5% and a 7.5% discount rate, the model suggests a value of around $170 a share. That implies SPG still trades below its intrinsic value, with upside potential from its current price of around $153.
As of April 10, the stock of Simon Property Group is at $153.18. In my view, the stock is undervalued, and I estimate its fair value to be at $168.50 in the next 12 months. This target price was derived employing a mixed valuation that employed a forward FFO multiple and a DCF model. For the FFO approach, I applied the 13.0x multiple to the projected 2026 FFO of $12.96 per share, with a 5% growth rate on the current FFO of $12.34. This multiple also reflects Simon's leadership in premium retail REITs, with a deep-seated tenant base and strong balance sheet. Although SPG is not risk-free, especially in light of continued rate uncertainty and retail conditions, the valuation suggests much of the risk is implied.
Julian
Dahl | April 10, 2025
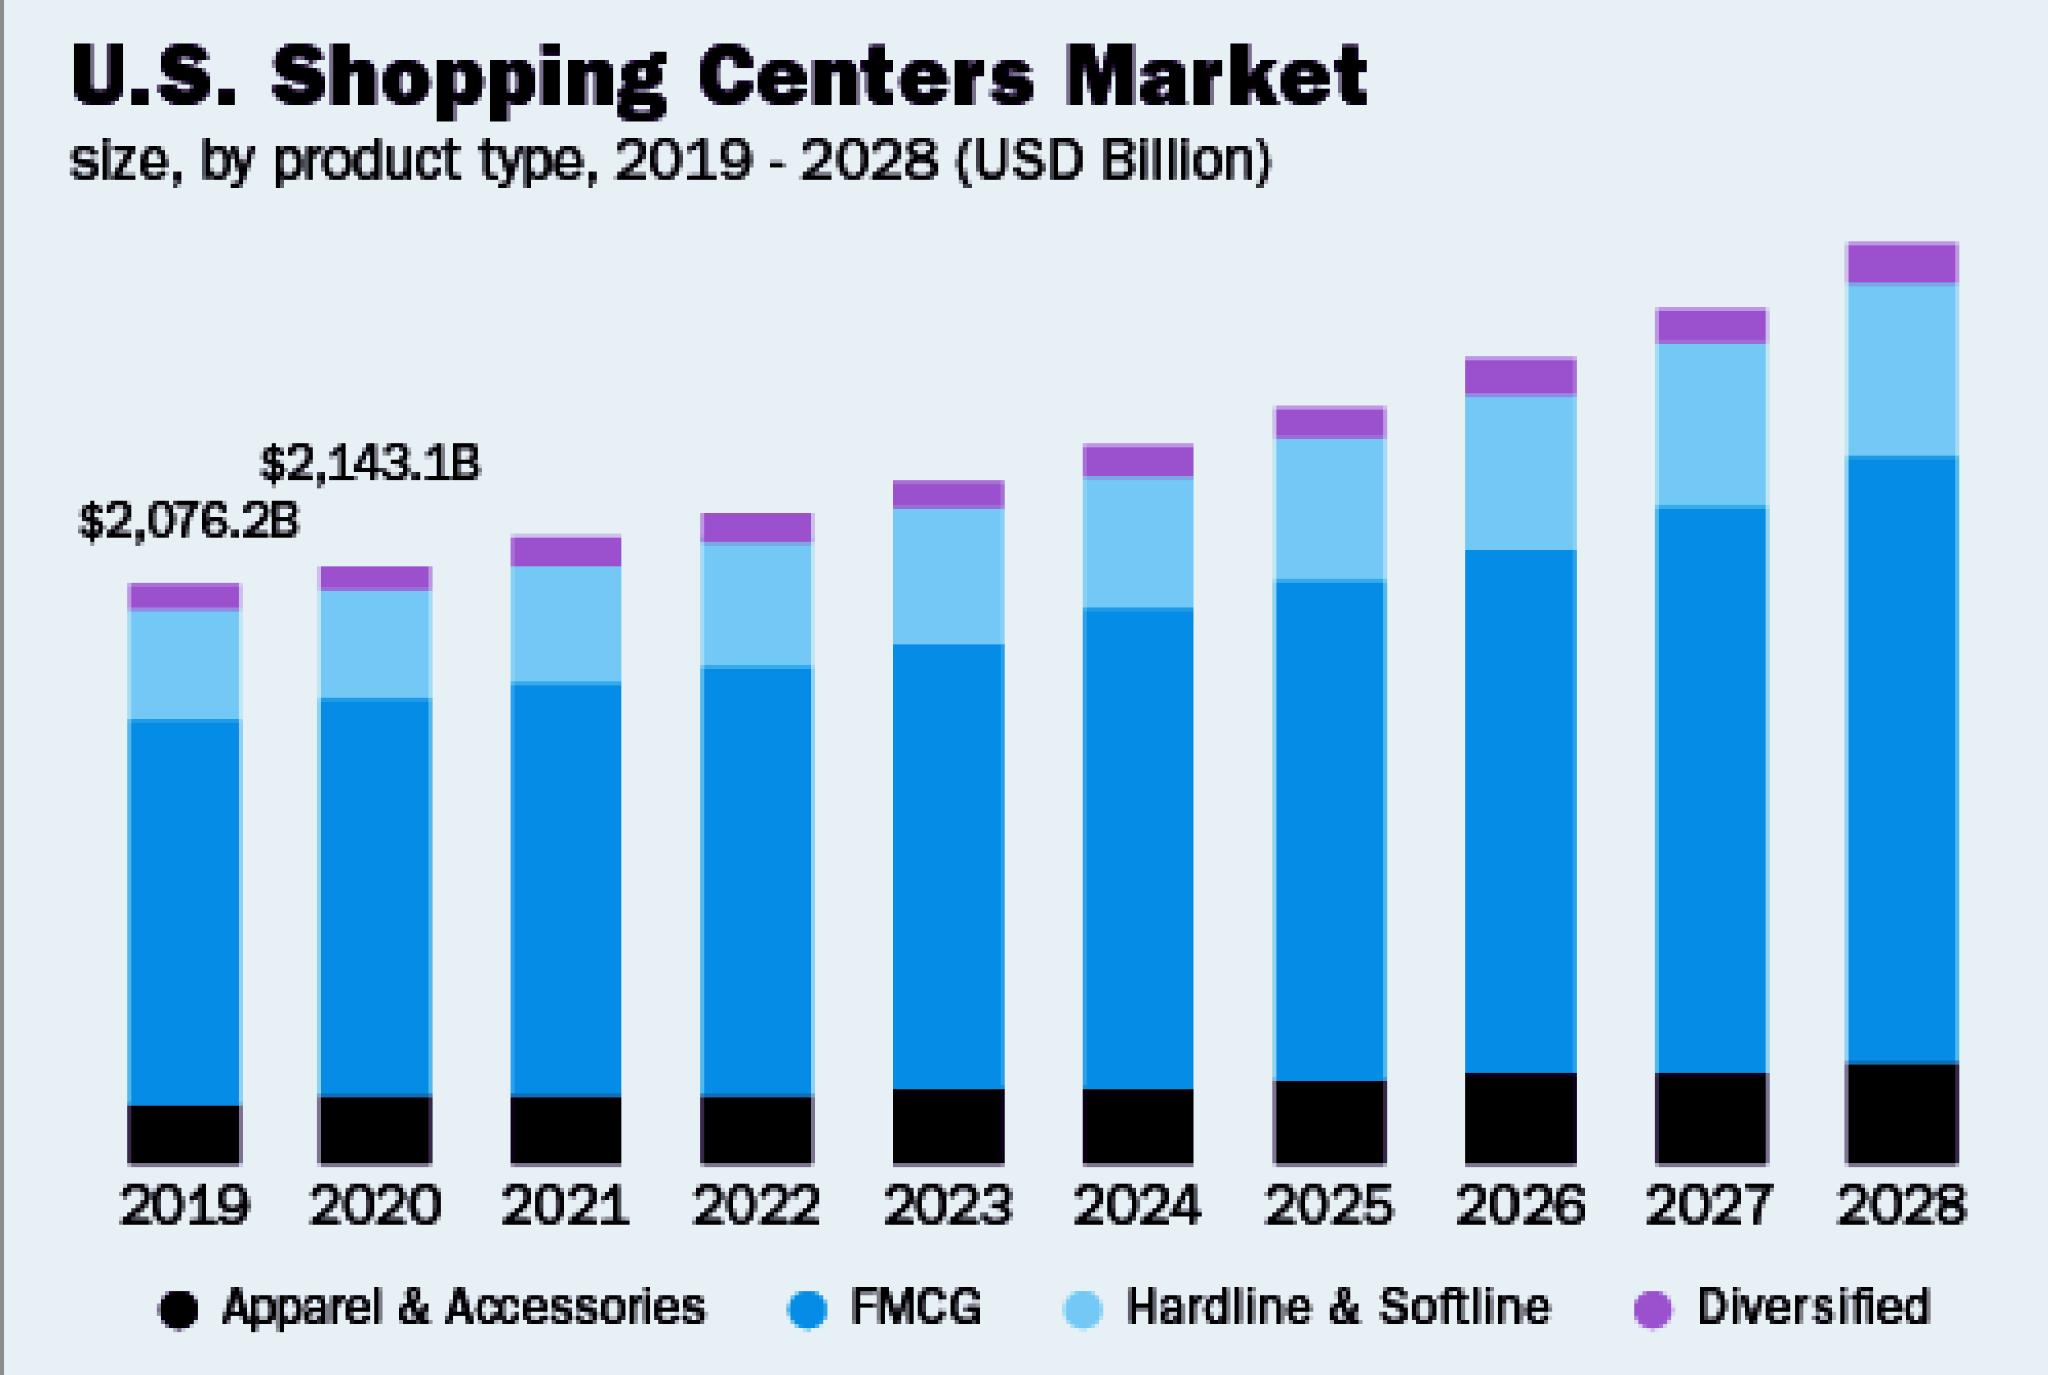
Source: Grand View Research
Retail Industry Market Outlook & The Dawn of E-Commerce:
Simon Property Group is well-positioned in the shifting retail landscape, where brick-and-mortar locations continue to play an important role in the company's business while e-commerce growth continues. Nearly 70% of U.S. retail transactions stay in stores, and the majority of digitally native brands are expanding into physical space to help drive customer acquisition and brand visibility. As can be seen from the graph, American Shopping centers are still expected to grow with a compounded growth rate of 5.7% until 2028, further solidifying SPG as a safe investment in the future. Simon's portfolio consists primarily of top-performing, high-traffic, high-income centers with increasing occupancy (currently at 96.5%) and rising rents, making its assets effectively rock-solid. The company has also addressed the transformation of older shopping centers in a pragmatic way through redevelopment as mixed-use properties with residential, hospitality, and entertainment components, producing diversified long-term revenues. While there remain consumer spending and interest rate risks, Simon's strong balance sheet, stable tenant base, and consistent cash flow create substantial protection against downside risks
Although I believe Simon Property Group is a good long-term hold, there are still a few risks that need to be considered. One of the biggest risks is the impact of extended high interest rates, which have the potential to make dividend-paying REITs like SPG less attractive compared to other income-generating assets There's also the threat of lower consumer spending, especially in a weaker economy, that could affect some of Simon's tenants and lead to lower leasing volume or rent growth. And, naturally, black swan events such as the COVID pandemic can blow up the market entirely While Simon focuses on high-quality properties, they're still vulnerable to overall retail trends, such as store closures or bankruptcies, that can create short-term vacancies Lastly, any change in REIT-specific taxation or market-wide regulation would have had a multiplier effect on how investors would price players like SPG in the future.
Sources: Simon Property Group| PitchBook| Google Finance | Yahoo Finance | Grand View Research | MarketWatch | FinancialTimes
Jarret Zundel | April 11, 2025
Rating: Buy
Current Price: $208.32
Price Target: $240
Company Updates / News
● Market Cap: 97.518B
● Beta: 0.88
● EPS: 6.94
● PE Ratio: 30.81
● 52 Week High: 243.56
● 52 Week Low: 170.46
● 2024 Q4 net income surged over 9,000% to $1.23 billion, driven by strong operating performance and likely one-time factors or prior-year comparables
● 2024 full-year total revenue grew modestly by 1.1% to $10.13 billion, reflecting stable growth
● AFFO attributable to common stockholders increased 7.0% for the full year, reaching $4.93 billion
Competitor Statistics from Q4 2024

EV/EBITDA: 16.47x Revenue: $6.9B

EV/EBITDA: 19.05x Revenue: $2.7B

American Tower Corporation (NYSE: AMT) is a leading global real estate investment trust (REIT) that owns, operates, and develops multitenant communications infrastructure Its portfolio spans 148,957 communications sites, including towers, rooftops, and data centers, across five continents. The company’s primary business is leasing space on these sites to wireless service providers, broadcast companies, government agencies, municipalities, and a diverse range of commercial tenants This segment accounted for 98% of American Tower’s total revenue for the year ended December 31, 2024 In addition, American Tower provides tower-related services such as site acquisition, zoning and permitting, structural and mount analyses, and construction management.
As of April 11, 2025, American Tower was trading at $208.32 per share. I believe that this equity is undervalued and will increase to $240 within the next year, implying a 15.2% upside. I conducted Discounted Cash Flow Analysis with a terminal growth rate of 3% and a weighted average cost of capital of 7.2% across 5 years to arrive at this valuation My assumptions are based upon American Tower’s guidance and an optimistic view of American Tower’s future performance in growing segments.
American Tower is taking advantage of international opportunities, notably in emerging markets, while prioritizing investments in developed economies like the U.S. and Europe The company plans to build new towers in high-demand locations: in 2025, it has allocated $1.7 billion for capital deployment, including $600 million for data center development and new tower construction in Europe
The ongoing 5G revolution presents a significant growth opportunity for the telecommunications sector, and American Tower is well-positioned to benefit due to its expansive global portfolio of nearly 149,000 communications sites. The company has observed a clear positive correlation between increased 5G capital expenditures by major wireless carriers and rising demand for tower space, particularly in the US , where providers boosted 5G-related capex by over 20% year-over-year in 2024. This investment surge has driven increased network densification efforts, resulting in increased colocation and amendment activity across American Tower’s tower portfolio. Also, data traffic on the company’s U.S. network grew by about 30% year-over-year, fueled by widespread adoption of 5G-enabled devices and applications requiring high-speed, low-latency connectivity, such as mobile video, augmented reality, and IoT American Tower expects continued organic tenant billings growth in the low-to-mid single digits, supported by long-term lease contracts with annual escalators. Internationally, early-stage 5G deployments in markets like Latin America and Africa offer additional upside, positioning the company for sustainable global growth as 5G infrastructure builds out over the next decade.
Jarret Zundel | April 11, 2025
AMT vs Comps Set Relative % Stock Price Change
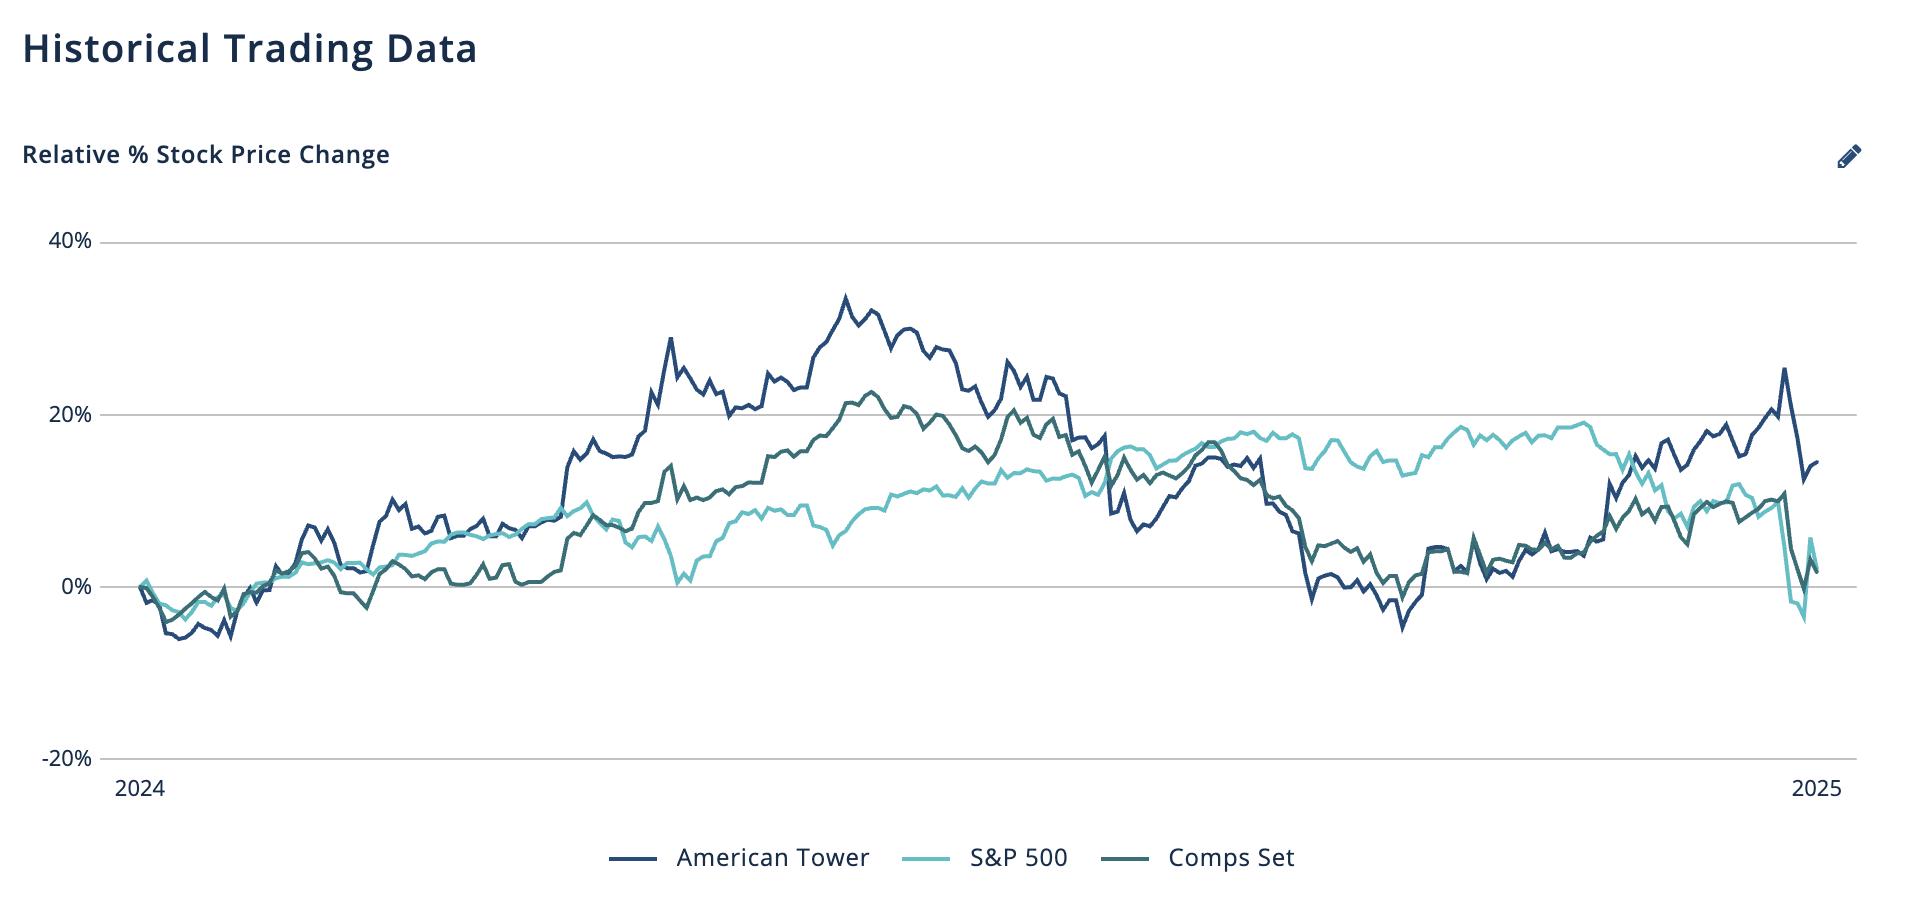
Source: PitchBook
Risk Potential
Customer Concentration & Carrier Spending Cycles
American Tower’s revenue is heavily dependent on a small number of major wireless carriers. In the U.S., its top three tenants—AT&T, Verizon, and T-Mobile—account for a significant portion of total revenue. Any changes in these carriers’ network strategies, including mergers, pricing pressure, or reduced capital expenditures on 5G infrastructure, could materially impact AMT’s leasing activity and organic tenant billings growth. Additionally, the tower leasing business is subject to cyclical patterns in telecom capex, which could lead to slower growth during periods of reduced carrier investment.
As a capital-intensive REIT, AMT is particularly sensitive to interest rate fluctuations. While recent efforts to deleverage and optimize the balance sheet have helped, rising or persistently high interest rates can increase borrowing costs and reduce funds available for reinvestment or shareholder returns. Higher rates also reduce the relative attractiveness of dividend-paying stocks like AMT, potentially affecting valuation multiples Additionally, future growth initiatives such as data center expansion and international buildouts may require significant funding, which could pressure the company’s credit profile if not managed conservatively
Sources:
Investing com | Global Data Center Hub | Capital IQ |Pitchbook
Spring 2025
Lede and Abstract: Amid chaotic signals (slowing GDP with higher-than expected employment), defensive industrials like waste management and aerospacecontinuetooutperform.
In the first week of May, the market was rocked by mixed signals: GDP growth came in below expectations, yet employment forecasts beat consensus. This divergence added to policy uncertainty, particularly around the path of interest rates. Bloomberg has floated the idea that recent market reactions may be a case of front-loading tariff expectations post-GDP miss, suggesting potential reversals ahead. Rate cut timing remains uncertain.
Despite market chaos, stocks of industrial companies with monopolistic or defensive characteristics—such as waste management and the aerospace aftermarket—continue to demonstrate resilience
The waste management industry has gained record pricing power, driven by increased privatization. Public counties are offloading legacy waste management operations to private firms. With increasing market share of private firms, they can potentially further tap into further increasing prices (although cautiously).
The defense sector is anchored by structurally resilient firms with durable business models. Defense Original Equipment Manufacturers (OEMs) like Raytheon, Lockheed Martin, and Boeing are particularly well-positioned to maintain stability. These companies benefit from high switching costs tied to their product platforms and maintain backlogs of orders that support stable demand. Switching away from a Boeing aircraft, for instance, would require replacing not just the aircraft itself but also the associated repair systems, docking infrastructure, training programs, and operational protocols This platform stickiness ensures financial stability

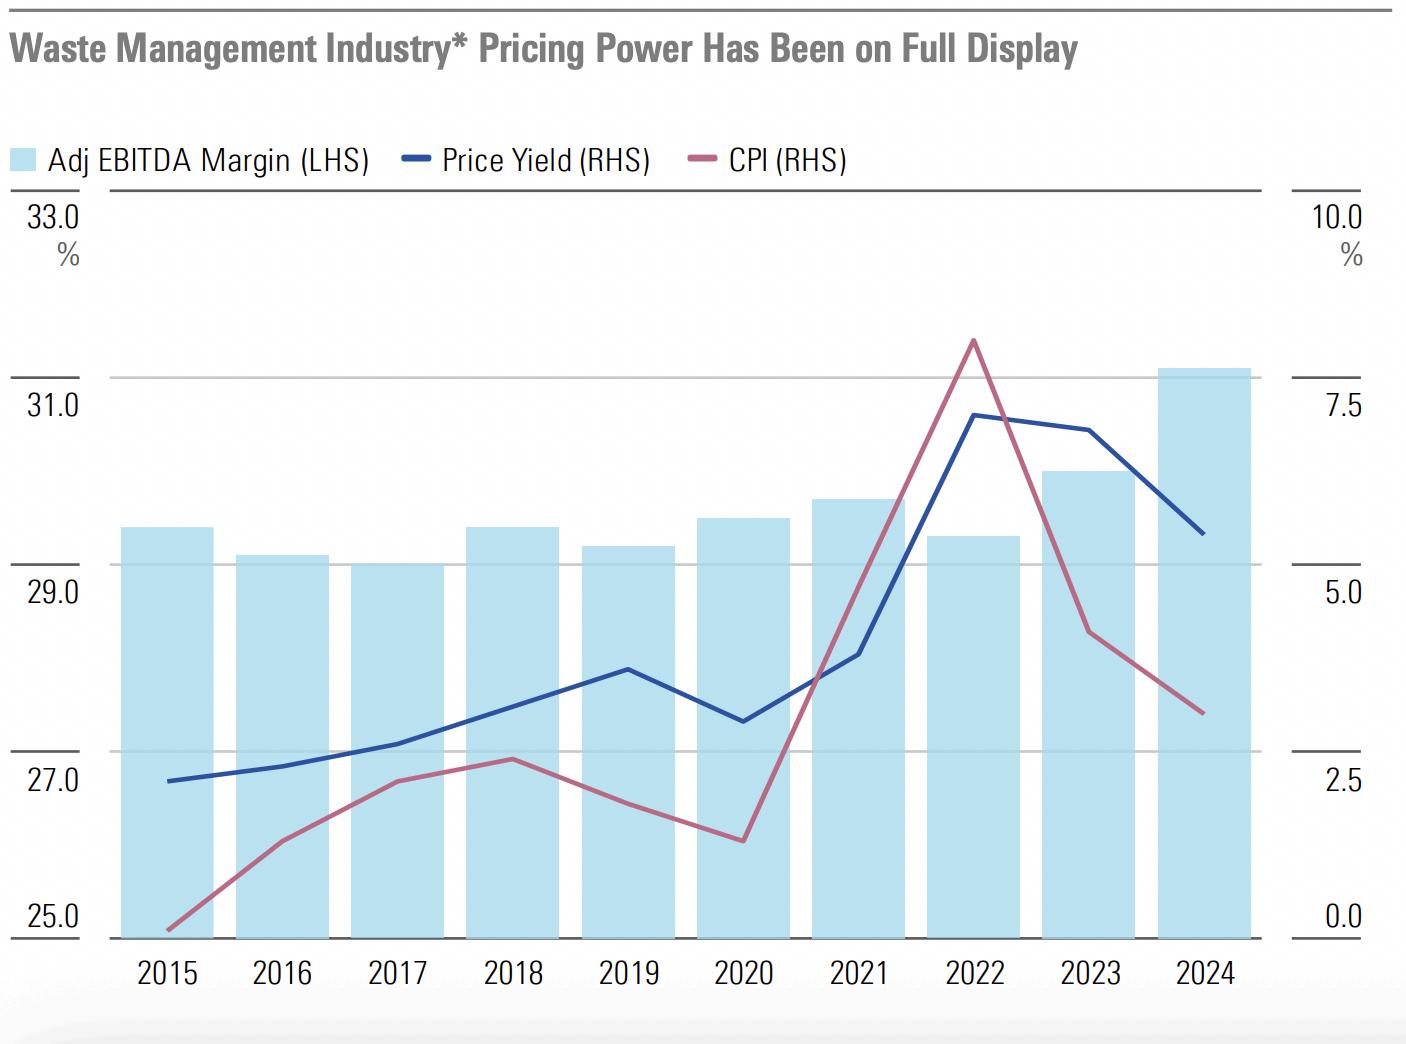
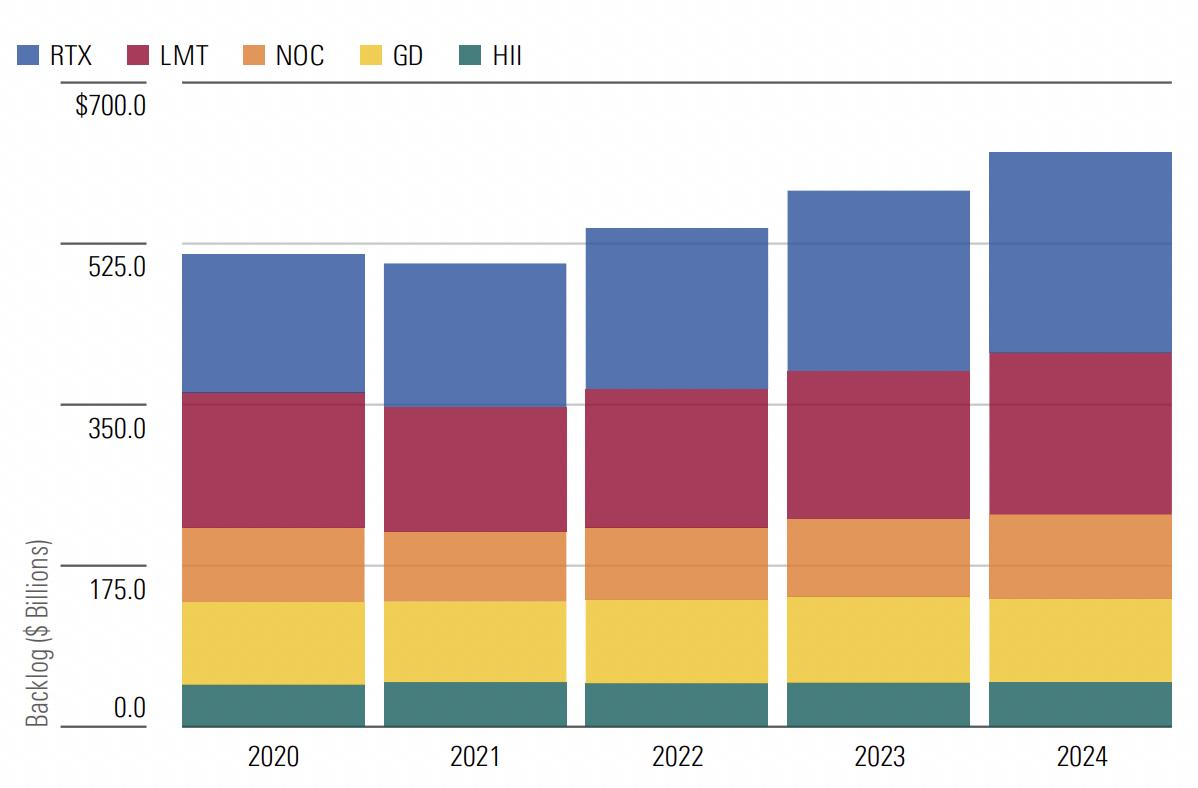
Transdigm:
Similarly, TransDigm holds an effective monopoly on select high-margin airplane parts—think of seat belts Although the company could face pressure on repair revenues due to reduced flight activity, the fact that 90% of its revenue is generated from exclusive repair contracts (no other company can supply the same parts) ensures durability
Agriculture:
The agriculture equipment sector is also showing promise through digital transformation. Historically, companies like John Deere have seen earnings closely track commodity cycles—particularly corn prices. The chart below illustrates the relationship between John Deere’s Production and Precision Agriculture revenue and corn prices per 5 billion bushels from 2000 to 2024 on November 1.
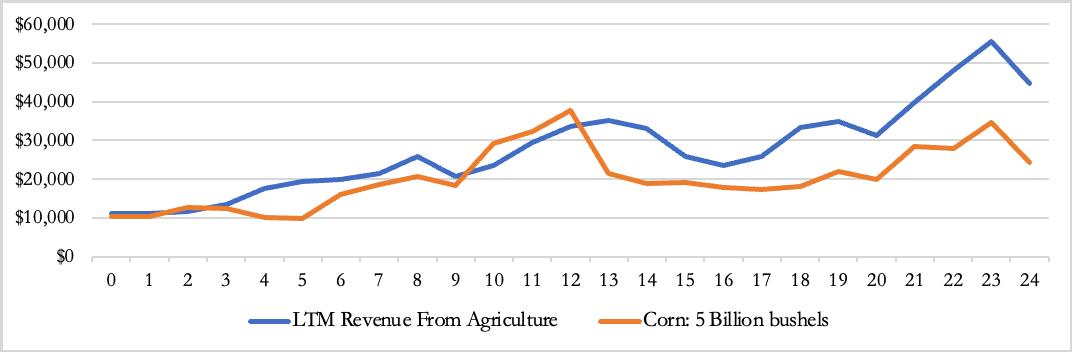
However, with the rollout of precision agriculture and subscription-based software tools, Deere aims to make 10% of revenue recurring by 2030. This shift could reduce cyclicality and improve margins
Conclusion:
Over the past half-century, only two sectors have consistently outperformed the broader market: Industrials and Technology What’s fascinating is that these sectors are fundamentally different—tech prioritizes asset-light, scalable models, while industrials rely on asset-intensive operations focused on efficiency, process control, and disciplined cost management.
The strength of the industrial sector lies in its ability to optimize variable cost structures, enabling firms to scale production quickly in response to rising demand. This operational flexibility is critical for a cyclical industry, where aligning cost structures with revenue swings can strengthen margins and long-term performance.
As we look ahead, the direction of the industrial sector remains uncertain—but precisely because of this, it will be an area to watch closely. The evolution of automation, AI, and geopolitical shifts may reshape how industrials compete, and which players emerge as long-term winners.
Matthew Jarek | April 10, 2025
Rating: Hold
Current Price: $150.41
Price Target: $163.98
Company Updates / News
● Market Cap: $68.58B
● Beta: 0.956
● EPS: 7.67
● PE Ratio: 19.6
● 52 Week High: $156.35
● 52 Week Low: $90.17
● PFAS exit and litigation weigh on outlook
● Margin pressure from inflation and raw material costs
● Global industrial demand remains soft
● Completed spin-off of Solventum; post-spin dis-synergies pressure margins
Competitor Statistics from end of fiscal year 2024
EV/EBITD
Revenue: $38.5 B

EV/EBITDA: 21.8
Revenue: $23.1 B

EV/EBITDA: 17.2
Revenue: $51.9 B

3M Company (NYSE: MMM) is a global diversified industrial conglomerate operating across three primary business segments: Safety and Industrial, Transportation and Electronics, and Consumer Its iconic brands like Scotch®, Post-it®, and Filtrete™, 3M have been a staple in both household and industrial markets However, 3M faced headwinds recently from litigation risks, PFAS-related liabilities, and inflationary pressure in materials and labor Despite this, a strong core R&D engine and robust IP portfolio, helps 3M retain a competitive moat. While macroeconomic uncertainty and legal overhangs persist, I believe 3M’s diversified products, strong balance sheet, and long-term cost discipline position it to perform in line with the broader market. Therefore, I recommend a Hold rating, with upside potential should litigation risks abate or operational efficiency gains exceed expectations heading into 2025.
As of January 1st, 2025 3M Company was trading at $150.41 per share. I believe that this equity is fairly valued and will increase slightly to $163.51 within the current year. I conducted a Discounted Cash Flow Analysis with a terminal growth rate of 2 0% and a WACC of 8.52% across 5 years to arrive at this valuation. My assumptions are based upon 3M’s historical data and an optimistic view of 3M’s future performance
Following the spin-off of Solventum, formerly 3M’s healthcare business, focus increased on the core businesses In 2024, each experienced a decline in yoy sales Safety & Industrial fell 6.2%, Transportation & Electronics by 13.6%, and Consumer by 5 4% In response, 3M is exiting underperforming and subscale businesses to streamline Notably, the company announced plans to discontinue approximately 1,200 SKUs across its Consumer segment alone to eliminate redundant/low-margin offerings, and prioritize high-margin, high-growth segments particularly personal safety, home improvement, and electronics. Additionally, 3M has divested its dental local anesthetic business and wound care operations in Europe These moves point to management’s emphasis on simplifying operations, consolidating manufacturing footprints, and shifting capital toward higher-margin, scalable innovations
3M’s growth strategy is centered on operational efficiency, innovation, and portfolio realignment To support this transition, 3M is investing in manufacturing productivity, digital transformation, and a unified ERP (enterprise resource planning) system to streamline its supply chain and organizational structure. These efforts aim to reduce costs, boost agility, and improve margin performance Additionally, 3M continues to leverage its strong R&D engine and intellectual property portfolio to drive innovation across product lines, while disciplined capital allocation ensures funding for strategic initiatives and shareholder returns
Matthew Jarek | April 10, 2025
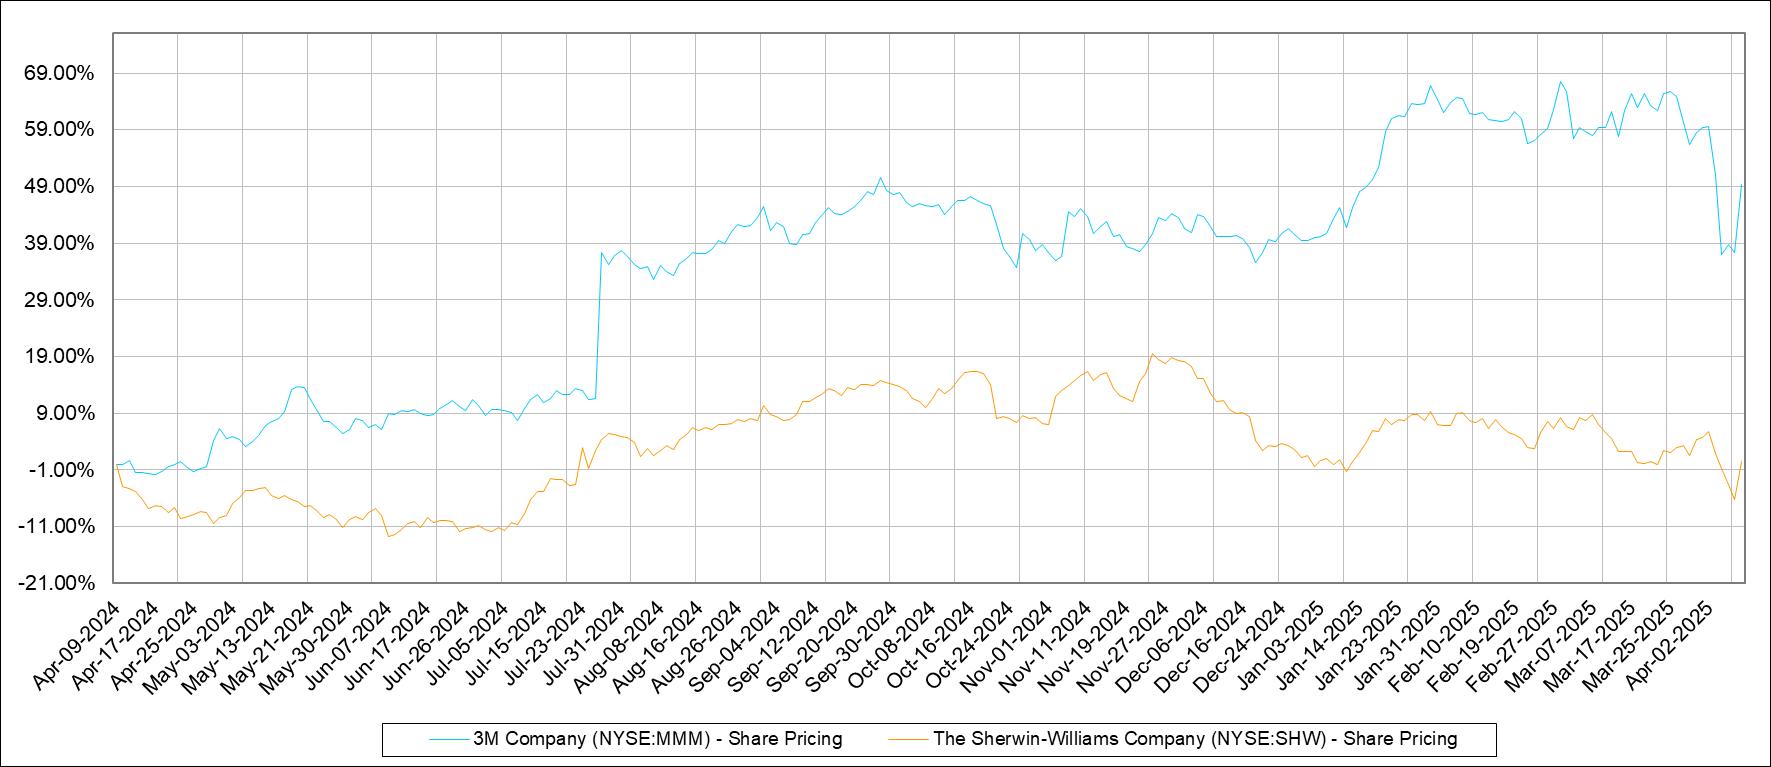
Source: S&P Capital IQ
Risk Potential
Legal and Regulatory Exposure:
3M faces ongoing legal risk from PFAS litigation and Combat Arms earplug claims While a $6.0B earplug settlement is now in place, payments through 2029 will continue to weigh on cash flows The planned PFAS exit by 2025 may incur transitional costs but positions 3M to improve its ESG profile and reduce long-term legal exposure
Soft Demand Environment:
Full-year 2024 sales declined across all segments, reflecting weak global demand—particularly in consumer electronics and industrial markets. While portfolio streamlining is underway, near-term recovery hinges on macroeconomic stabilization and improved end-market conditions, especially in manufacturing and auto production.
Economic Uncertainty:
3M faces macroeconomic headwinds, including newly imposed global U.S. tariffs that raise costs across key markets such as automotive, industrial, and consumer electronics. These tariffs, alongside ongoing inflationary pressures and soft global demand, present near-term risks to margins, pricing power, and supply chain efficiency. However, 3M’s finances provide a buffer against volatility. In 2024, the company generated $5.2 billion in operating cash flow and held $3.6 billion in cash, with a robust balance sheet and disciplined working capital management. This financial strength enables 3M to weather economic disruptions while continuing to fund core innovation, portfolio optimization, and shareholder returns.
Sources: Investors3m com| Barrons| CFRA Equity Research| Yahoo Finance |Zacks Research | Capital IQ | PitchBook
Jacob Zwerling| April 14th, 2025
Rating: Buy
Current Price: $161.36
Price Target (12 mo):
$205
Implied Upside: +27%
R/R: 3.6x
Ametek & Peer Stats

EV/EBITDA: ~17.2x FCF Conversion: ~95%

EV/EBITDA: ~24.5x FCF Conversion: ~100%

EV/EBITDA: ~18.8x FCF Conversion: ~85%

FCF Conversion: ~85%

Ametek is a repeatable free cash flow compounder that continues to be miscategorized as a short-cycle industrial I believe the market is underappreciating a multi-year transformation into a higher-margin, capital-light, instrumentation platform. While investors broadly respect the business, they view margins as fully optimized and the earnings growth profile as modest This creates a disconnect between business quality and current valuation
AME was derated in 2022 as investor flows shifted away from secular compounders toward short-cycle industrials. Meanwhile, recent acquisitions have not been reflected in EPS or Street models. Buy-side consensus forecasts a 7% EPS CAGR, while I forecast 10–12% driven by margin expansion and capital reinvestment Despite solid fundamentals, AME is down 8% YTD, underperforming peers, which are up 6-10%. This presents a compelling setup for a quality name trading at a relative discount
The Street views AME as a great allocator, but expensive. In reality, it's still compounding FCF at 10%+, and is attractively valued relative to high-quality peers While consensus sees a margin ceiling near 30%, I believe the EIG mix shift will support 31 5–32% EBITDA margins by FY27
The market also assumes there is no near-term M&A pipeline, but Ametek has over $2.5 billion in firepower and a proven history of redeploying capital within 12–18 months, and note that recent deals like Paragon Medical have not yet contributed meaningfully to reported earnings. Historical IRRs on M&A have ranged from 15–20%, and the valuation today doesn’t reflect the duration or quality of the company’s FCF stream
Margin Expansion = Earnings Surprise: The EIG segment, which generates 40%+ EBITDA margins, now comprises ~65% of the business Despite this, consensus is modeling flat margins of 29.5–30%. I see FY25 margins at 30.7% and 31.5% by FY27, leading to $0.45–$0.70 of EPS that is not yet in estimates
Capital Deployment = Optionality: The street models no buybacks or new deals. However, management has completed over 100 M&A transactions with 15–20% IRRs. Even conservative capital deployment could add 5–8% to EPS CAGR over the next 3 years
Secular End-Market Exposure: Over 50% of revenue is tied to medical, aerospace, and diagnostic instrumentation–regulated, long-cycle markets with multi-decade replacement cycles Only 20% of sales are tied to short-cycle industrial demand
Reverse DCF: At the current price of $161.36, the market implies just 5.5% long-term FCF CAGR and a 16 5x terminal FCF multiple My base case assumes 8 0%+ FCF growth and a 3.0% terminal growth rate, implying an intrinsic value closer to $225.
EV/EBITDA-Based Price Target: Using FY25E EBITDA of ~$2 3B and a target multiple of 18.5x (in line with historical 90th percentile and peer averages), I derived an implied enterprise value of $42 5B After subtracting ~$2 2B in net debt, the equity value supports a price target of $205/share, or +27% upside
Jacob Zwerling| April 14th, 2025
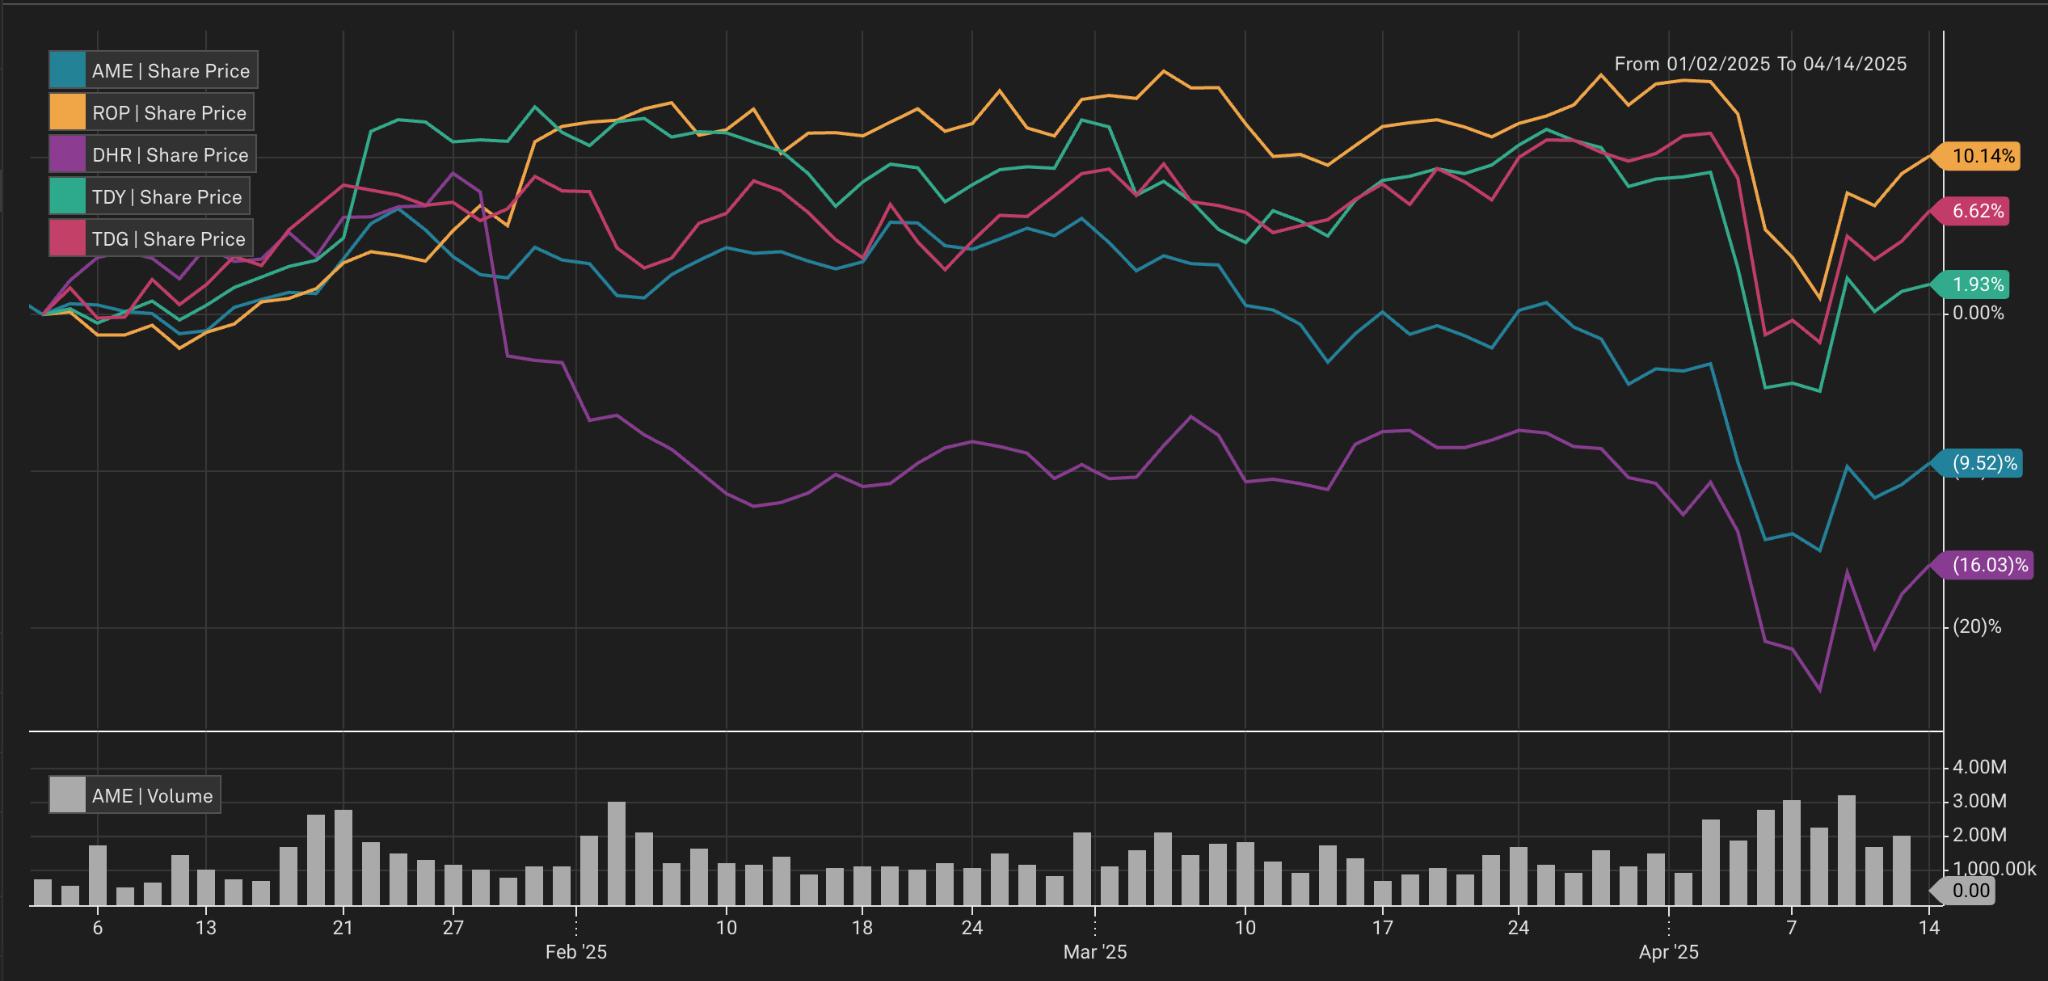
m early signs of margin expansion from EIG mix shift This could lead to the first wave of upward estimate revisions By Q4 2025, I expect a formal capital return announcement–either in the form of a buyback or another high-ROIC inorganic acquisition–both of which would be materially accretive and off-consensus In early 2026, Street models are likely to be revised higher as management delivers sustained EBITDA margin improvement and deploys capital Over the medium term, steady FCF compounding even without further multiple expansion supports a total shareholder return (TSR) in the 12–14% range, underpinned by 8%+ FCF growth and operating leverage The optionality for a re-rating still exists, but the embedded return is attractive regardless of multiple movements.
The most immediate risk to the thesis is a slowdown in capital deployment. While the Street already assumes no deals in its models, if Ametek does not execute any acquisitions in the next 12–18 months, it may cause sentiment to stall However, management has a long-standing track record of disciplined capital deployment, rarely sitting on dry powder for more than a year Another risk is valuation compression if interest rates remain structurally elevated, reducing the premium investors are willing to assign to compounders I view this risk as largely hedged by AME’s high ROIC, strong cash conversion, and recurring-revenue end markets. Lastly, supply chain inflation could weigh on gross margins. But this is mitigated by the nature of EIG’s business model–high value-add, spec’d-in parts with embedded pricing power, often governed by escalator clauses or long-term customer contracts.
In my base case, I assigned a $205 price target based on a modest re-rating to 18.5x FY25 EBITDA, assuming 30.7% margins and one to two bolt-on acquisitions This scenario yields an IRR of approximately 11%, with potential for upside revisions as capital is deployed. In the bull case, I assumed a more aggressive ramp in capital deployment, a further mix shift toward EIG, and consolidated EBITDA margins expanding to 32% by FY27 This drives a price target of $225 and an IRR in the 16% range Conversely, my bear case assumes no new deals, flat margins, and 5% EPS growth–effectively the Street’s current embedded assumptions. This scenario implies a price target of $150 and an IRR of –2%, but I believe this downside is already embedded in the current multiple Overall, the distribution of outcomes is asymmetric: the bear case is well-understood and modeled in, while both the base and bull cases require only modest execution to realize meaningful upside.
Sources: IBISWorld | Bloomberg | PitchBook | Yahoo Finance | Capital IQ | AME Investor Relations | CFRA
Emily-Jane Luo| April 12th, 2024
Rating: Buy
Current Price: $1,313.09
Price Target: $1,605
Company Updates / News
● Earnings Per Share (EPS): 28.36
● 52 Week Range: 1,176.311,451.32
● Market Cap: 73.644B
● PE Ratio: 46.30
● Stock fell ~3% after an in-line quarter and no guidance raise, despite strong aftermarket growth.
● Aftermarket revenue rose 9% YoY, with standout performance in business jets (+18%); all four sub-markets showed growth.
● M&A pipeline strong, with more EBITDA in the pipeline than last year; company holds $2.5B in cash and remains flexible with leverage (5.2x).
Competitor Statistics from Q3 2024
Revenue: $1.03B
Market Cap: $30.54B

Since Transdigm Group’s listing on the New York Stock Exchange on March 15, 2006, the stock has grown more than 5,348.51%. The company operates in the aerospace aftermarket industry with a near-monopoly status, supplying highly engineered parts that are essential for aircraft operation. These include items like cockpit locks, valves, and seatbelts components that airlines are willing to pay a premium for due to safety, reliability, and regulatory compliance requirements My buy recommendation reflects a belief that TransDigm will continue to perform well, given its dominant aftermarket position, pricing power, and the steady recovery in global air travel demand.
As of April 11th, Transdigm Group is trading at $1,313 09 I believe this equity is undervalued and will increase to $1,605 within this year. I arrived at this conclusion by conducting an EV/EBITDA valuation with an NTM EBITDA of $5 085bn, a target multiple of 22.5x, and net debt of $21bn. My assumptions are based on historical trading multiples, current sector premiums for high-margin aerospace suppliers, and TDG’s pricing power in the aftermarket segment
Global commercial air travel is projected to grow at 5–6% annually over the next decade, driven by population growth, emerging market connectivity, and rising demand for leisure and business travel. This secular tailwind supports the broader aerospace industry, but TransDigm benefits in a fundamentally different way than traditional OEMs or aircraft manufacturers.
While most aerospace companies are tied to large, cyclical aircraft orders, TransDigm focuses on the high-margin aftermarket. It sells critical replacement parts needed to keep existing fleets flying valves, cockpit locks, and safety components These are required for maintenance and inspection cycles, regardless of macro conditions. Additionally, TransDigm enjoys substantial operating leverage. As volumes increase, TDG’s fixed-cost base allows it to convert incremental revenue into outsized earnings gains. This dynamic helps the company outperform peers during upcycles while remaining more resilient during downturns
The current macroeconomic climate of tariff uncertainty, inflation, and high interest rates has made many airlines and defense contractors cautious about investing in new aircraft or equipment. This benefits TransDigm, which generates the majority of its revenue from repairs and replacements, not new plane builds When capital expenditures are delayed, operators focus on extending the lifespan of existing fleets through maintenance and upgrades the services and parts that TDG provides. Airlines are less likely to cut back on critical repairs, especially when they affect safety and compliance, making TDG’s revenue stream more durable than traditional equipment providers.
Furthermore, TransDigm’s business is largely insulated from global trade risks and foreign exchan portion of its revenue is generated domestically, and the company sources many components within the US , lowering its exposure to tariffs and international supply chain disruptions. This domestic orientation enhances its resilience in an increasingly protectionist global environment.
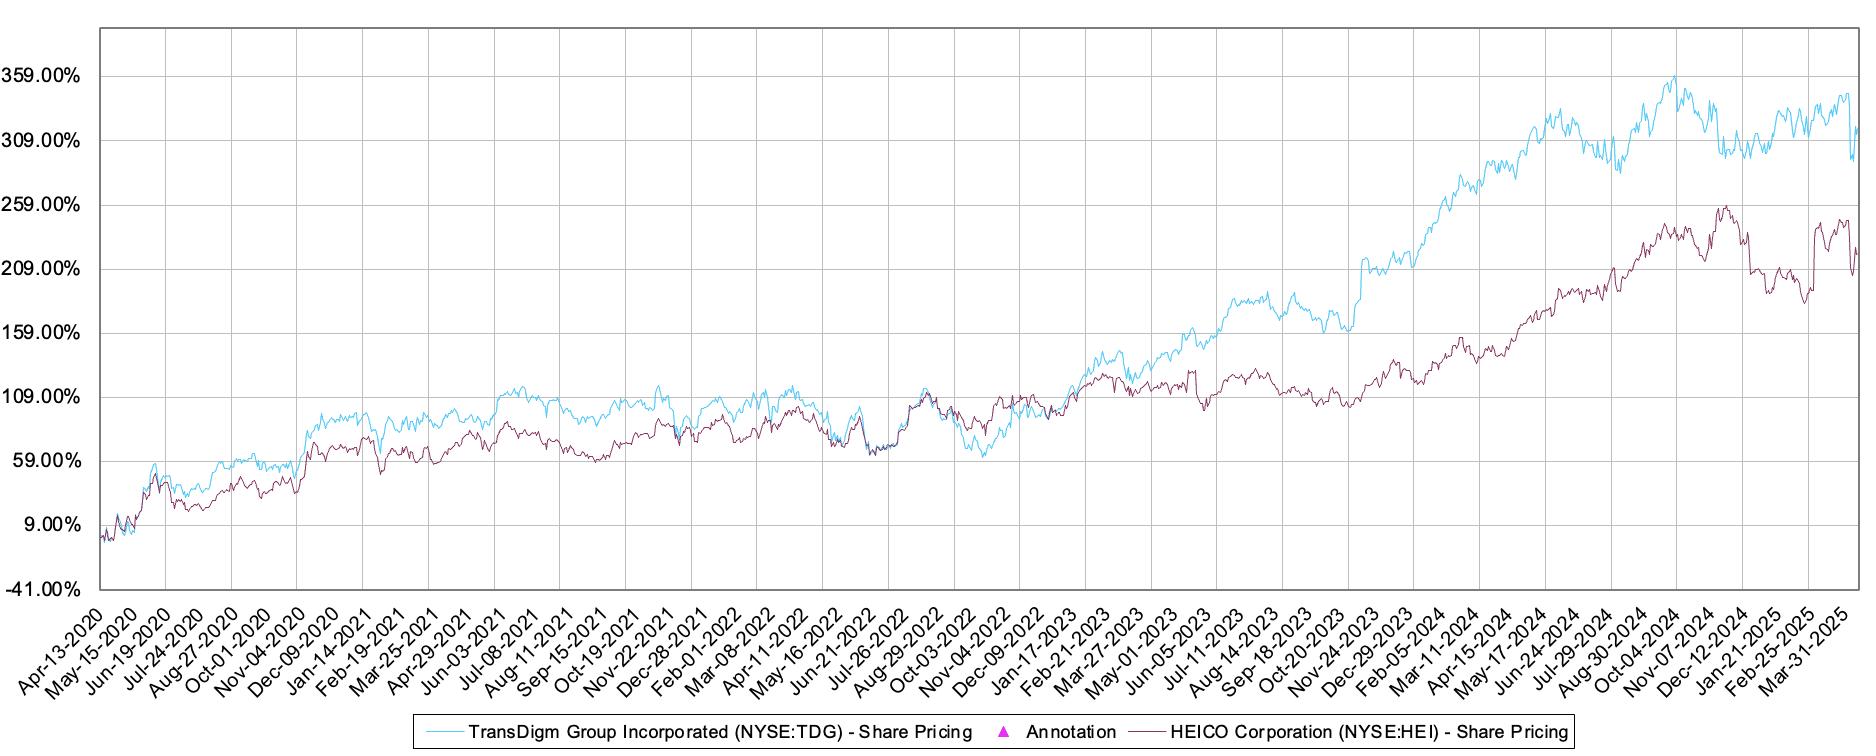
Source: S&P Capital IQ
Risk Potential
While the aftermarket is less volatile than OEM demand, it is not immune to downturns. If global travel demand slows or maintenance cycles are extended, TDG could experience a deceleration in sales. Its narrow product focus also amplifies exposure to this segment.
TransDigm’s high pricing has previously attracted scrutiny from the U.S. Department of Defense and commercial OEMs. Although it has not materially affected contracts, any renewed regulatory focus could lead to pricing pressure or margin compression. Additionally, over-reliance on the aftermarket may pose challenges if airlines or regulators demand more cost transparency.
Sources:
Eric Chen|April 17, 2025
Rating: Buy
Current Price: $29.03
Price Target: $40.65
Company Updates / News
● Market Cap: $831.19M
● Beta: 1.35
● EPS: 3.21
● PE Ratio: 9.04
● 52 Week High: $41.50
● 52 Week Low: $24.85
● Revenues in 2024 were higher than the prior year (2023) due to OES growth and government contracts
● $247.5 million of unrestricted cash and $311.5 million of total liquidity
Competitor Statistics from Q1 2025

Price/Earnings: 10.9x
EV/EBIT: 6.1x

Price/Earnings: 23.8x
EV/EBIT: 17.6x

Price/Earnings: 8.7x
EV/EBIT: 5.4x
Sources:
Investment Thesis:

The Bristow Group (VTOL) is a leading vertical flight solutions provider with a global operating presence in 18 countries. The company primarily serves offshore energy producers and government entities In particular, 68% of the company's revenue comes from its offshore energy customers, 23% from government contracts, and the remaining 9% from other services. For its offshore energy clients, the company provides personnel transportation between onshore facilities and offshore platforms. For its government clients, the company offers helicopter services for search and rescue operations My buy recommendation reflects the belief that a full ramp-up of large government contracts in the coming years and the current multi-year growth cycle in offshore energy positions The Bristow Group for strong growth potential Furthermore, the undervalued share price of the stock presents a buying opportunity before this growth potential is realized.
Using a comparable company analysis, I derived the values of two financial multiples for a peer set of 10 companies: Price to Earnings (P/E) and EV/EBIT. The ticker symbols for the 10 companies are as follows: OII, LBRT, HLX, WTTR, ACDC, XPRO, INVX, TDW, RNGR, and NESR. I computed the implied share price for each multiple, and then designated 50% weight to EV/EBIT and the other 50% to P/E Finally, I determined the weighted average to derive an implied share price of $40.65, which indicates that the current share price is trading at a significant discount.
Starting in 2022, the offshore energy production market has entered a multi-year growth cycle driven by increasing investments in offshore energy infrastructure and production in regions such as Africa and Latin America As a result, the offshore energy transportation market has also entered a growth cycle with The Bristow Group looking to capitalize by raising rates This has proven to be particularly effective as revenue from the offshore energy services (OES) segment was $113 million higher in 2024 than 2023, which has been attributed to higher utilization and increased rates in Africa and Latin America
In late 2024, the company commenced operations on two new large government contracts: 2nd Generation UK SAR Contract (UKSAR2G) and Irish Coast Guard Contract (IRGC). The UKSAR2G contract is a £1.6 billion agreement and the IRGC contract is a €670 million agreement with a 10-year term limit and 3-year extension option. These contracts are currently in the transition phase with intensive capital requirements, causing a drag on profitability in the government segment throughout 2025 In 2026, as the company closes out of the transition phase for these contracts, a clearer picture of profitability will be available, and a fuller ramp-up of these contracts and stronger profitability will be expected in 2027 and beyond
Eric Chen|April 17, 2025
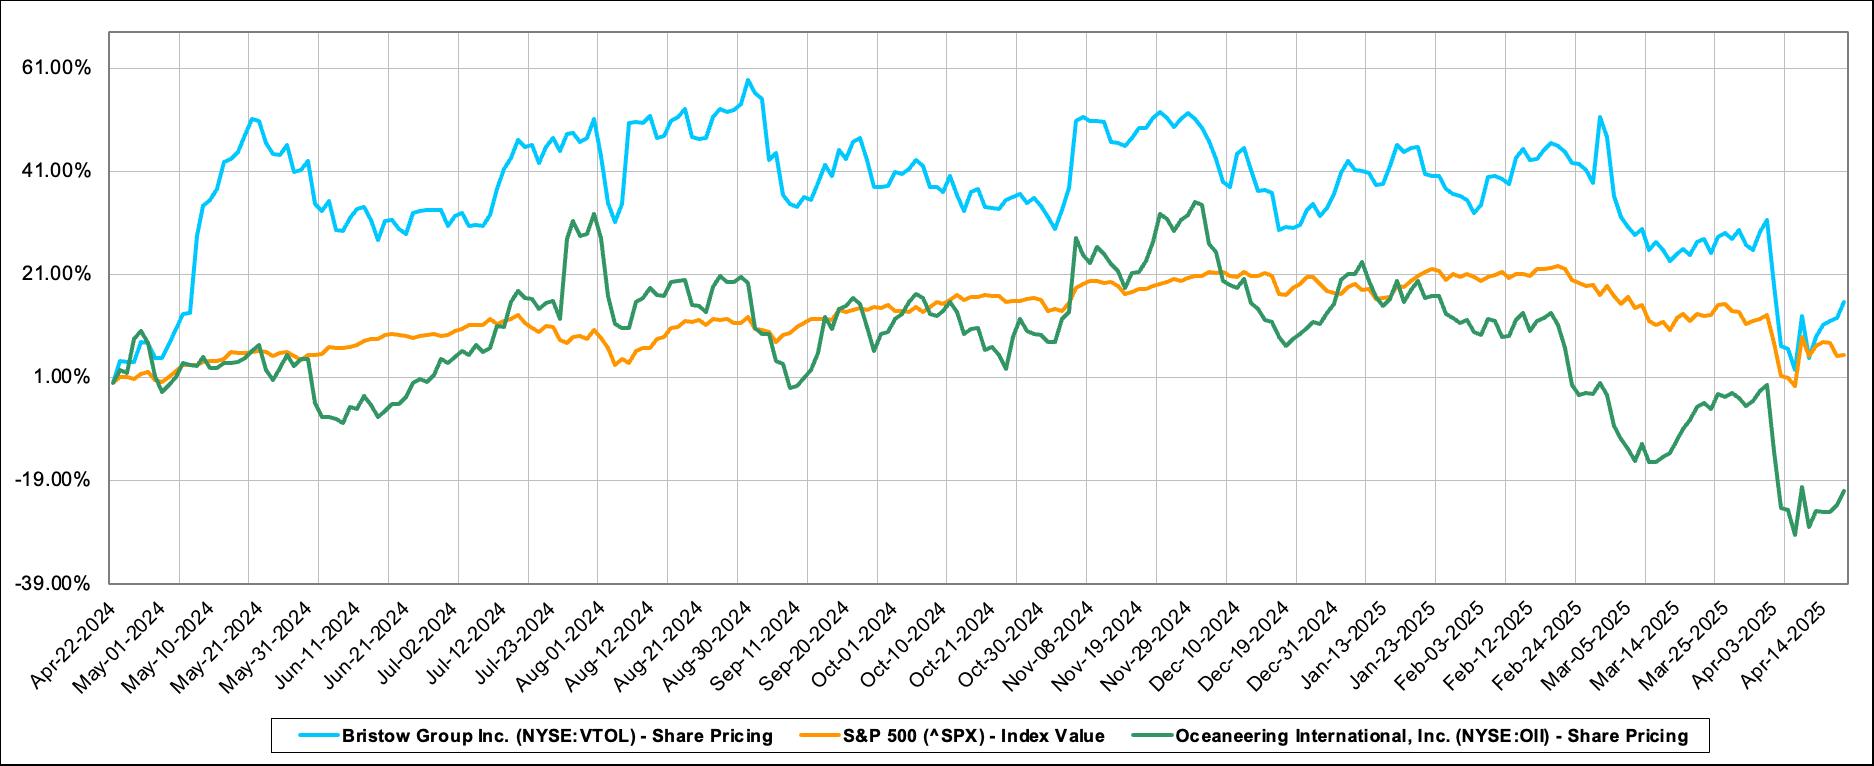
Source: S&P Capital IQ
Potential
With the complex supply chains in the aircraft industry and limited number of OEMs and suppliers, supply chain shortages are a major operational and financial risk to the company. Furthermore, the current tariff environment creates additional uncertainty surrounding the company’s ability to maintain its fleet In 2024, the company suffered from significant delays in deliveries of parts for its S92 fleet, which accounts for 30% of their total fleet. This event resulted in the searching of other suppliers to satisfy their request for parts and the grounding of their S92 aircrafts, leading to missed business opportunities. Ultimately, any disruptions in the supply chain for the company’s aircrafts make it difficult for fleet maintenance and repair, which threatens earnings on both new and active contracts. To mitigate the risk of supply chain shortages, the company has actively increased its inventory levels in critical aircraft components Although this puts pressure on working capital, it also provides a buffer for any disruptions in the supply chain and enables the company to support ongoing and future contracts
Since the majority of the company’s revenues come from the offshore energy industry, demand for the company’s services is highly dependent on the activity levels of offshore energy production, which are strongly influenced by movement in oil and gas prices as well as the capital spending of offshore energy producers Given the cyclical nature of offshore energy and the inherent volatility of the oil and gas industry, this poses a significant risk to the company’s revenue and performance In particular, during market downturns, the company faces lower utilization of aircraft, pricing pressures, and idling of its fleet. However, the offshore energy market is currently in a multi-year growth cycle, which began in 2022, supporting a strong market environment for offshore helicopters. In addition, the company’s services are focused in production-related activities, rather than exploration, which is less sensitive to short-term volatility in the oil and gas market providing some stability. The Bristow Group also maintains a strong balance sheet to endure any market downturns and prepare for growth when activity rebounds. Sources: