Restructured and Recharged On The Frontier of Solar Energy Returns Could Be Sweet and Green
A curated semesterly roundup of stocks that we are currently obsessed with in the market.


Restructured and Recharged On The Frontier of Solar Energy Returns Could Be Sweet and Green
A curated semesterly roundup of stocks that we are currently obsessed with in the market.

Now in our fifth year, Cornell Equity Research has made this semester one of innovation and an unwavering commitment to excellence in student-led financial research and publication.

As Fall 2024 comes to a close, it is an honour to continue leading such an intelligent, passionate, and creative executive board who, along with our dedicated sector leads, constantly strive to improve the quality of our research and the experience for our members. As we look to Spring 2025, I cannot help but be optimistic for the future of the club. Whether it be connecting further with our alumni, hosting more social events, or inspiring a passion for financial research, I know I speak for everyone in the organisation when I say this has been an impactful semester, and we cannot wait to see what the new year brings. We invite you all to join us in our upcoming endeavours.
Yours Sincerely,

Kaleb Kavuma President, 2024-25


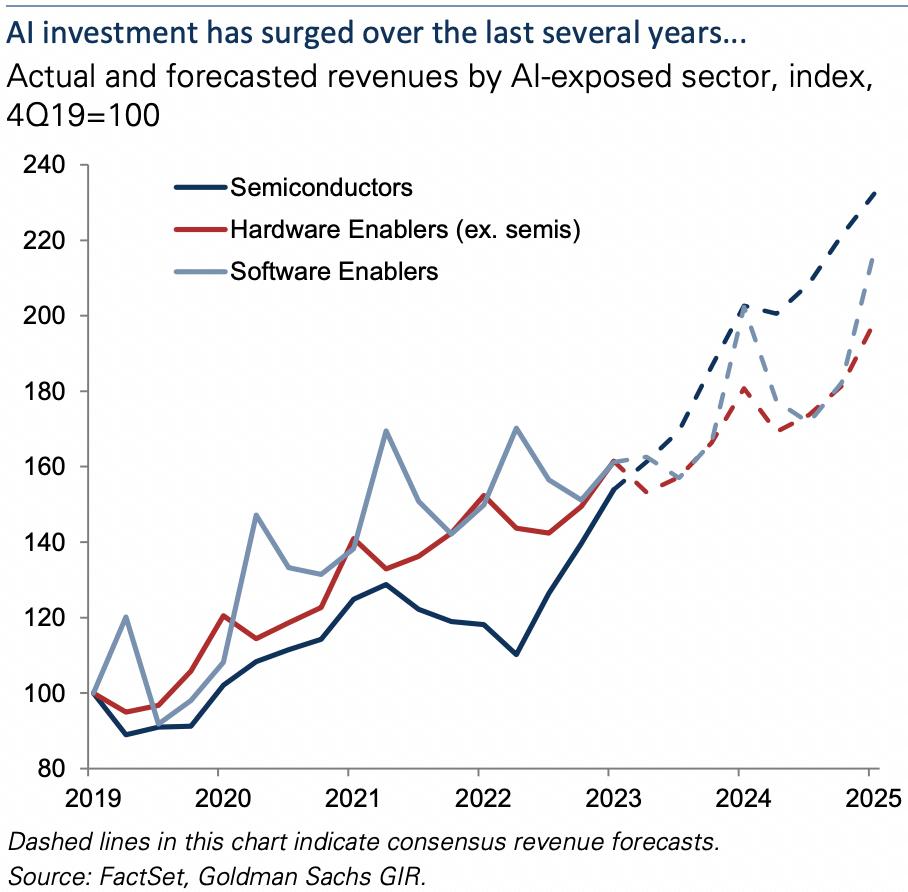
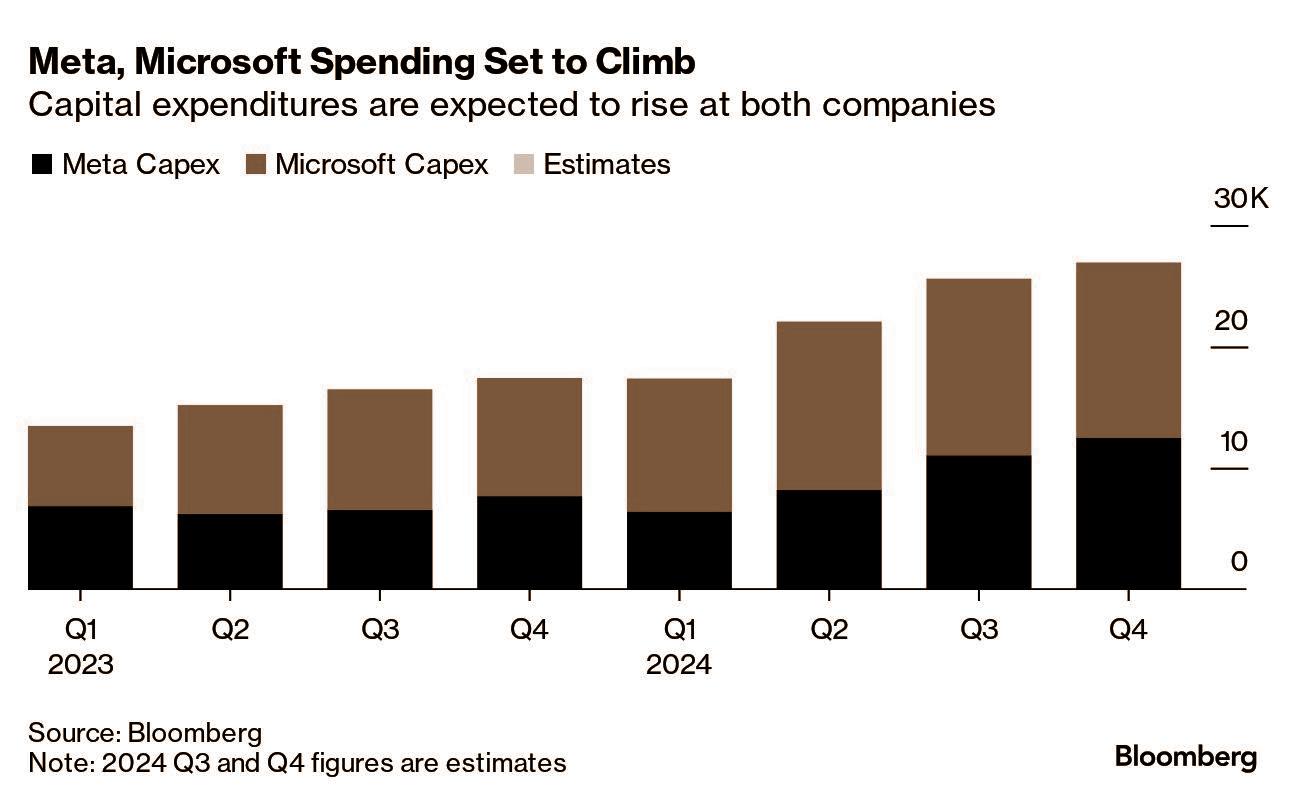
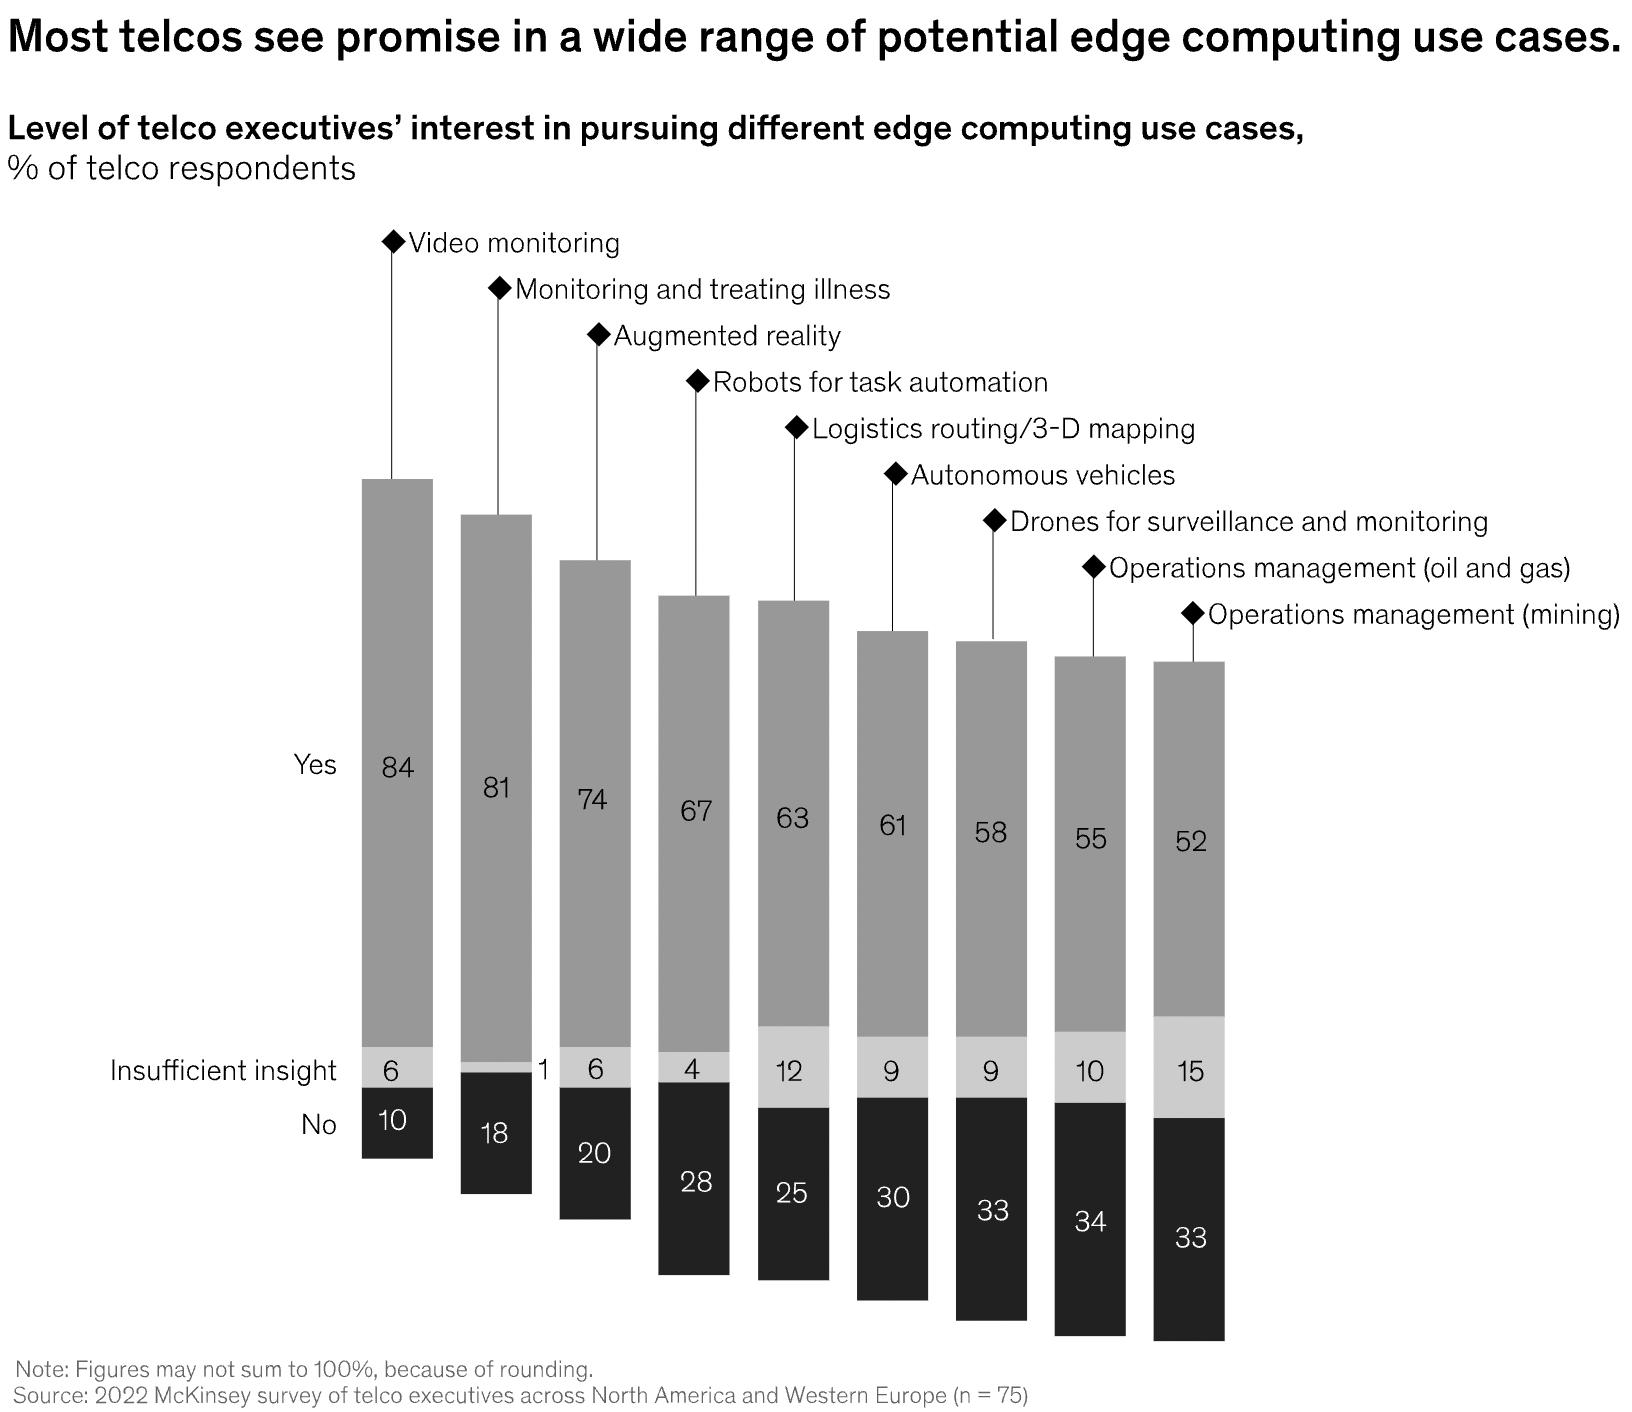
Overview and Themes: Since the last publication, generative AI continues to be the primary driver of equity markets and valuation across global markets. Nonetheless, two significant changes to the market view affected the outlook: the election of Donald Trump and the rising ROI debate across the AI value chain. Over the summer of 2024, investors began questioning tech firms’ trillion-dollar investments in semiconductors and relevant PP&Es, causing temporary volatilities in Nasdaq-100. The red-sweep of legislative and executive branches of the US government adds complexity to the discussion, where a pro-business yet anti-trade administration complicates a globally dependent tech industry. Looking ahead, company management reiterated continued CapEx in AI and digital transformation, as well as a rise in M&A amid anticipated favorable domestic political policies
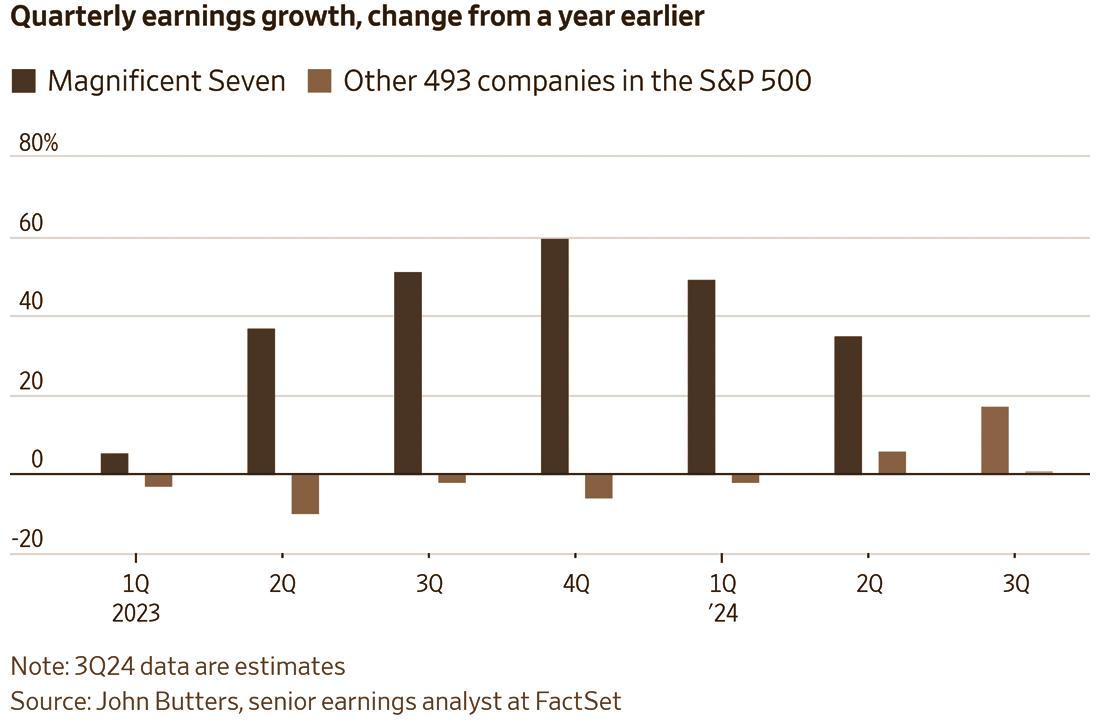
Generative AI remained the trailblazer, with companies like NVIDIA and OpenAI capitalizing on foundational LLM models Semiconductor firms continued to witness 50-100% YoY increases in chip demand, the fuel for LLM computation and processes Major tech players like Microsoft, Google, Oracle, Amazon, and Tesla are the main customers of these chips, fueling their productivity, particularly in software development, content creation, and customer service Cloud hyperscalers, including Amazon’s AWS and Microsoft Azure, expanded AI-driven services, facilitating enterprise adoption and introducing B2B AI productivity suites. The stocks of these big-player tech firms (Magnificient 7) continue to dominate the market, driving Nasdaq-100 up nearly 21% since May 2024. Nonetheless, there was a market sell-off in early August during earnings season, contributed by systematic and idiosyncratic risks.
2025 Outlook: Investors will be interested in how the AI trade could expand beyond the seven stocks to the other 493 in the S&P 500. There is hope for the “democratization” of AI applications integrated across sales, marketing, and enterprise operations. Earnings calls reaffirmed previous anticipations of sustained investment in AI infrastructure, mainly supplied by Nvidia – its Blackwell chips being the show's highlight. Institutional and retail investors want to see certainty from tech firms like Microsoft that the $60k/unit chips are bringing tangible revenue for the firm, something that has been more opaque in 2024.
There’s a central theme of convergence with advanced technology in media, especially towards personalization driven by AI. Notable deals included Amazon’s acquisition of smaller content creators to bolster Prime Video and a resurgence of sports streaming as a growth segment. Social media increasingly emphasizes short-form video content, with professional media giant LinkedIn launching its version of Tik-Tok-related scrolling montage. These developments, whether fueled by decreased human attention span or genuine product demand, underscored consumer shifts toward interactive and immersive entertainment. Media did experience considerable pushback, especially with the US government actively seeking to ban TikTok within its borders and Australia banning all social media for children under sixteen. These political headwinds may slow the revenue realization of AI integration in media relative to other industries. The S&P 500 Media Index has returned about 16% since May 2024.
2025 Outlook: The media landscape is set to see augmented reality (AR) and virtual reality (VR) gain traction, particularly in gaming and live events. Apple’s release of Vision Pro and Meta’s new AI glasses bring new stages for the media industry to dance on. Similar to joint ventures in the semiconductor, there could be vital partnerships between content creators to maximize this tech-enabled growth opportunity. There were also discussions about utilizing blockchain to secure individual content creators’ artworks online, where originality is becoming less consistent.
5G deployment continued to be the priority for telecom firms approaching near-global rollout in developed markets. This also means that the bulk of Cloud Service Providers (CSP) – think IBM, AWS –spending on 5G equipment seems to be finished, meaning higher cash flows for CSPs but negative for 5G wireless equipment suppliers like Qualcomm and Intel. The M&A space was active, with Vodafone and Verizon finalizing landmark deals to expand network reach to every corner of the United States There’s also an emergence of terrestrial connectivity, where direct-to-device satellite phone connectivity provides unparalleled connectivity in areas of distress, like Ukraine Starlink, now equipped with nearly 7,000 satellites in space, approaches 60% of all functional artificial satellites, with an estimated valuation of $137 billion; there are rumors of a 2025 IPO with favorable political and market conditions. The S&P 500 Telecom Services has returned about 11% since May 2024.
2025 Outlook: Investors could be looking out for early definitions of 6G from 2025-2028, considering that each generation takes a decade to come to fruition. With the advent of localized LLMs, the increased specialized data comes with increased cybersecurity risks. These developments are expected to increase demand for cloud solutions that can operate locally. There would also be an emphasis on how AI could be integrated into the industry. Investors anticipate AI revenue impact in 2025, especially in edge computing beyond rudimentary applications like customer service.
Vatsal Kalola| November 29, 2024
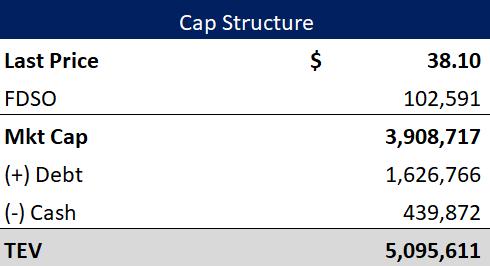
Rating: Buy
Current Price: $38.10
2026 Price Target: $72.59
Company Updates / News
● DigitalOcean beat both sales and revenue expectations for Q3
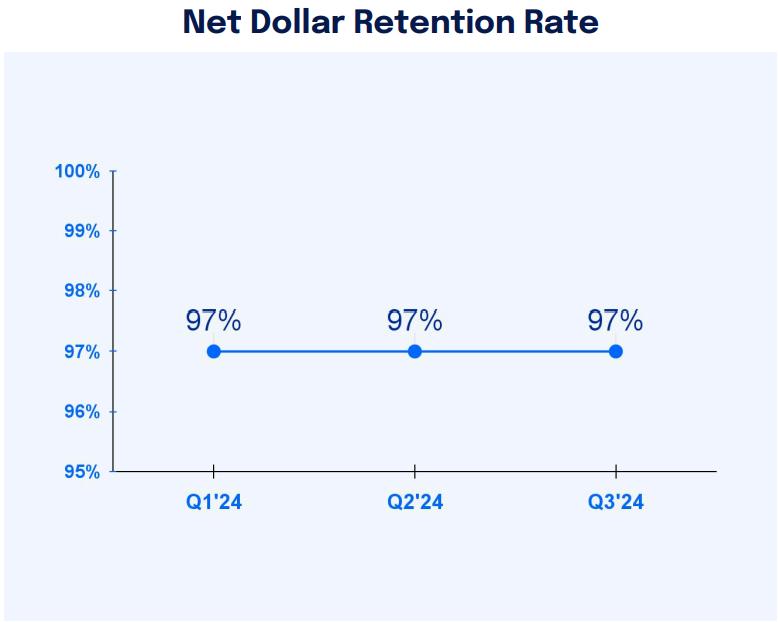
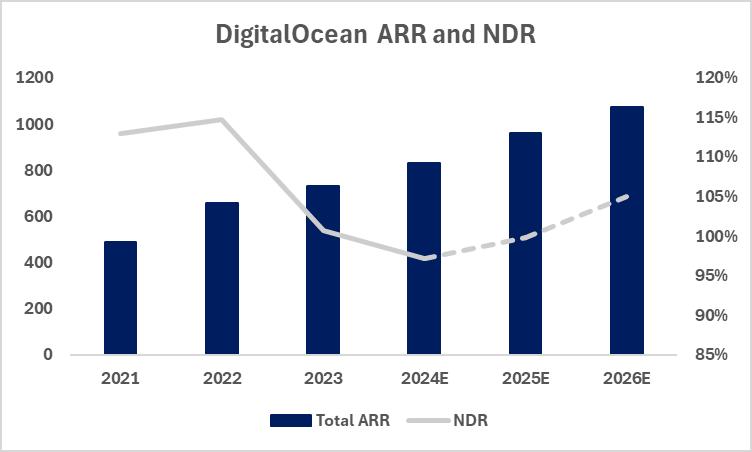
● Although FY guidance was raised, DOCN traded down around 14% → +8% since ● NDR, a KPI for both DOCN and investors has been stuck at around 97% for 3Qs
Key Statistics from Q3 2024

DigitalOcean is a leading alternative cloud service provider catering primarily to small and medium-sized businesses (SMBs) and developers. With its simple, cost-effective, and developer-friendly platform, DOCN offers a competitive alternative to hyperscalers like AWS, Azure, and GCP through its droplets and offerings across the tech stack. Recently, DOCN has acquired Cloudways and Paperspace, which has significantly boosted its managed cloud hosting and AI/ML offerings
DigitalOcean has a moat around its product offering and target market as it is a very capital-intensive industry to enter and hyperscalers don’t have the financial incentive to go after SMBs. As DOCN scales its product offering, it will be able to not only be able to scale ARR from existing “Builders/Scalers” (customers that spend >$50/mo), but they will also continue to poach customers from hyperscalers as mentioned in the Q3 earnings call Once DOCN laps the price increase on its Cloudways offering, churn will stabilize, coupled with upselling new products → Inflection in NDR and accelerated ARR growth. Investors that use both these measures as KPIs for long-term business quality will drive up the share price as the story gets better
As of November 29th, 2024, DigitalOcean Holdings was trading at $38 10 per share I believe that this equity is undervalued and will increase significantly to $72 59 by the end of 2026. DOCN splits customers into Scalers, Builders, Learners, and Testers based on monthly spend I built out a granular operating model looking at # of customers, ARR, and ARPU for these segments and then used conservative assumptions to arrive at projected ARR numbers. Then I built out a cost model to arrive at projected adjusted EBITDA values to which I placed a fair 18 5x industry multiple on 2026E adj. EBITDA to arrive at a $72.59/share valuation.
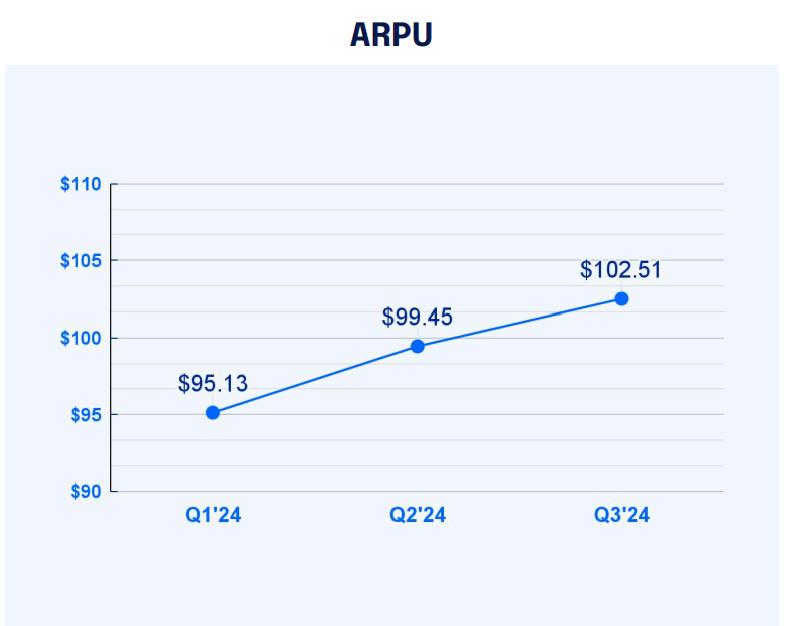
According to management, DigitalOcean has seen a positive trend in NDR during the current quarter although it has stayed flat at 97% with core DO NDR ahead of that due to the headwind from Cloudways pricing until 2H25. AI products are not included in NDR currently as the offering has been for training models for a couple months However, as DOCN expands the GPU droplet offerings, upselling will be easier as well as maintaining spend from the largest customers I expect that by 2H25 into 2026, the AI/ML offerings will be included in NDR, which management has said would already be a 2pt boost. DigitalOcean is also shifting to an outbound sales motion, which has resulted in customers with around $5-6K monthly spend vs $15-20 for self-serve Although this will be a slight NT margin headwind, DO is opening a new Atlanta Data Center, which is likely to drive significant margin upside from reshaping their DC footprint from consolidating workloads from expensive locations. Additionally, it will provide NT incremental power/space.
Vatsal Kalola| November 29, 2024
DigitalOcean by the Numbers:
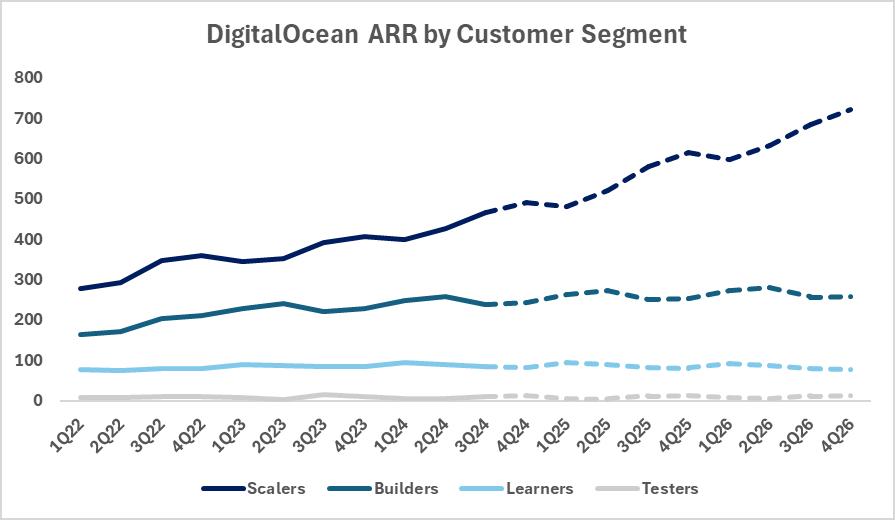

Scaler ARR accelerates from new product offerings. NDR inflects into FY25 driving ARR Growth.
Overall, the accelerated product rollout and ability for DigitalOcean to capitalize on overarching AI/ML trends will allow it to reignite ARR growth that has been lacking over the past couple years. DOCN has lost over 70% of its value since the ATH in late 2021 after the market correction in 2022. This has led investors to be wary of what has been viewed as a stable, but dying cloud/software company. However, recent management changes, product rollouts, and cost initiatives provide real upside to the current valuation as the narrative around the company shifts with KPIs improving over the next 1-2 years.
Risk Potential:
The DigitalOcean existence risk comes from the hyperscalers and other CSPs taking their customers However, the SMB target market for DOCN is perfect because it's big enough to feed new customers with high levels of demand, but small enough to not be enough of an incentive to be interfered with by large competitors
DigitalOcean’s NDR has plateaued at 97% over the last 3Qs, below the desired 100%. This has been attributed to the large number of customers that it serves, causing NDR growth to slow However, the recent positive trends seen by management in core DO offerings and lapping the churn caused by pricing in the Cloudways segment should jumpstart growth. Additionally, the 3Q inflection above 100% built into the valuation model is conservative and even with a slight delay, returns will stay similar due to the accelerated product rollout and outbound sales motion.
Ultimately spending in this sector often comes down to the macro environment especially in the SMB segment. However, with interest rates coming down there seems to be optimism regarding IT spending budgets, which will positively impact DOCN's growth. Additionally, because DOCN provides a cost-effective alternative to other CSPs and other tech companies, it will still prove valuable to SMBs even within an economic downturn.
Sources: digitalocean.com | NY Times | Barrons | Business Wire | Yahoo Finance | investors.digitalocean.com
Kashmir Tai | November 6, 2024
Rating: Buy
Current Price: $123.00
Price Target: $132.9
● Total Revenue: $23 81B
● EV/EBITDA: 16.88
● Market Cap: $28 55B
● Beta: 1 33
● EPS: 1.09
● Live Nation Entertainment completed a $1 7B debt refinancing with a close date of November 5th
● Portland's City Council has approved Live Nation's proposal to build a new concert venue, despite an appeal from Oregon’s music industry advocacy group on September 18th
Competitor Statistics from Q2 2024

Total Revenue: $3 1B (€2 87B)
EV/EBITDA: 17.10

Total Revenue: $6 38B
EV/EBITDA: 15 3

Total Revenue: $858M (€793.6M)
EV/EBITDA: 14 31

Live Nation Entertainment (LVY) is a leading global live entertainment company founded in 2010 after its merger with Ticketmaster No doubt the giant in the industry, Live Nation occupies 32 9% of the total live concert industry revenue as estimated ($11.7 billion). After its revival from the devastating blow of the pandemic since 2020, Live Nation aims to boost concert attendance, targeting over 145 million fans by expanding its global footprint and increasing events at owned or operated venues.
My recommendation is a buy for Live Nation Entertainment It will maintain its strong growth and remain in its leading position in the live concert industry, given healthy global demand trends, promising adjusted operating income (AOI) outperformance, and a steady stadium pipeline
As of November 6th, Live Nation Entertainment (LVY) is trading at $123.00. I believe that this equity is fairly valued and expected to increase to $132.90 within this year I arrived at this conclusion by conducting a DCF analysis with a terminal growth rate of 2.5%, a WACC of 9.89% across 5 years, and a $650 million Capex of estimation for the year 2024 I used these assumptions based on historical data and an optimistic view given Live Nation’s outperformance after the pandemic and its recent 2024 Q2 report’s projection on capital expense to support venue expansion globally.
Live Nation Entertainment has three clear sections that make its business thrive: Concerts, Ticketing, and Sponsorship & Advertising The Concerts segment generates most of Live Nation's revenue among the three segments. In 2023, the Concerts segment generated $18 8 billion in revenue, achieving an AOI margin of 1 7% The Ticketing segment reported $3 billion in revenue, achieving a 37 7% AOI margin Meanwhile, Sponsorship & Advertising earned $1.1 billion in revenue with a high 61 6% margin
Interestingly, the main driver for the increase of AOI margin in all three segments is not how Live Nation cut their direct operating expenses or SG&A; rather, it is the increased revenue in 2024 In fact, Live Nation's direct operating expenses, SG&A, and D&A all increased compared to 2023 Q2 performance (an increase of 12%, 22%, and 7%, respectively) Nevertheless, the increased revenue offset the decrease in Live Nation's operation costs by enlarging its fan base and expanding its venue numbers in the US and globally. The following sections will explain why it is expected that Live Nation will continue to maintain relatively similar or even higher AOI growth in 2024-2025
Live Nation has deep connections with 765 million fans across 49 countries For the first six months in 2024, approximately 62 million fans attended Live Nation shows, an improvement of 6 million fans or 10% compared to the same period in 2023 As Live Nation plans to open 14 potential venues in 2024-2025 (explain in detail in the next section), it is estimated that 20 million new fans will be drawn to Live Nation concerts and shows, ultimately contributing to a $350 million AOI increase
After dominating the US entertainment market with almost a third of the industry revenue, Live Nation emphasizes the idea of expanding its global platform many times to the public. They believe that this business strategy will strengthen its portfolio in the global music market, bringing additional revenue opportunities by connecting with new fans, artists, sponsorship, and partnerships across Europe, Asia, and the South Pacific
Currently, Live Nation owns about 370 venues globally; it plans to develop 14 new venues over 2024-2025 (have yet to disclose all locations to the public) By the end of June, 2024, the new venues have contributed to $149 6 million revenue In the near future, major sports events like the 2026 FIFA World Cup, 2026 Winter Olympics, and 2028 Summer Olympics are significant revenue growth catalysts, as well as ongoing large-scale concerts and annual festivals such as Coachella, EDC, and tours by artists like Usher, Katy Perry, Ed Sheeran, Billie Eilish, and Ariana Grande. Accordingly, the increased stadium activity will drive higher revenue and AOI margins, particularly in the ticketing segment.
Share Price of Live Nation Vs. S&P and S&P (Media & Entertainment)
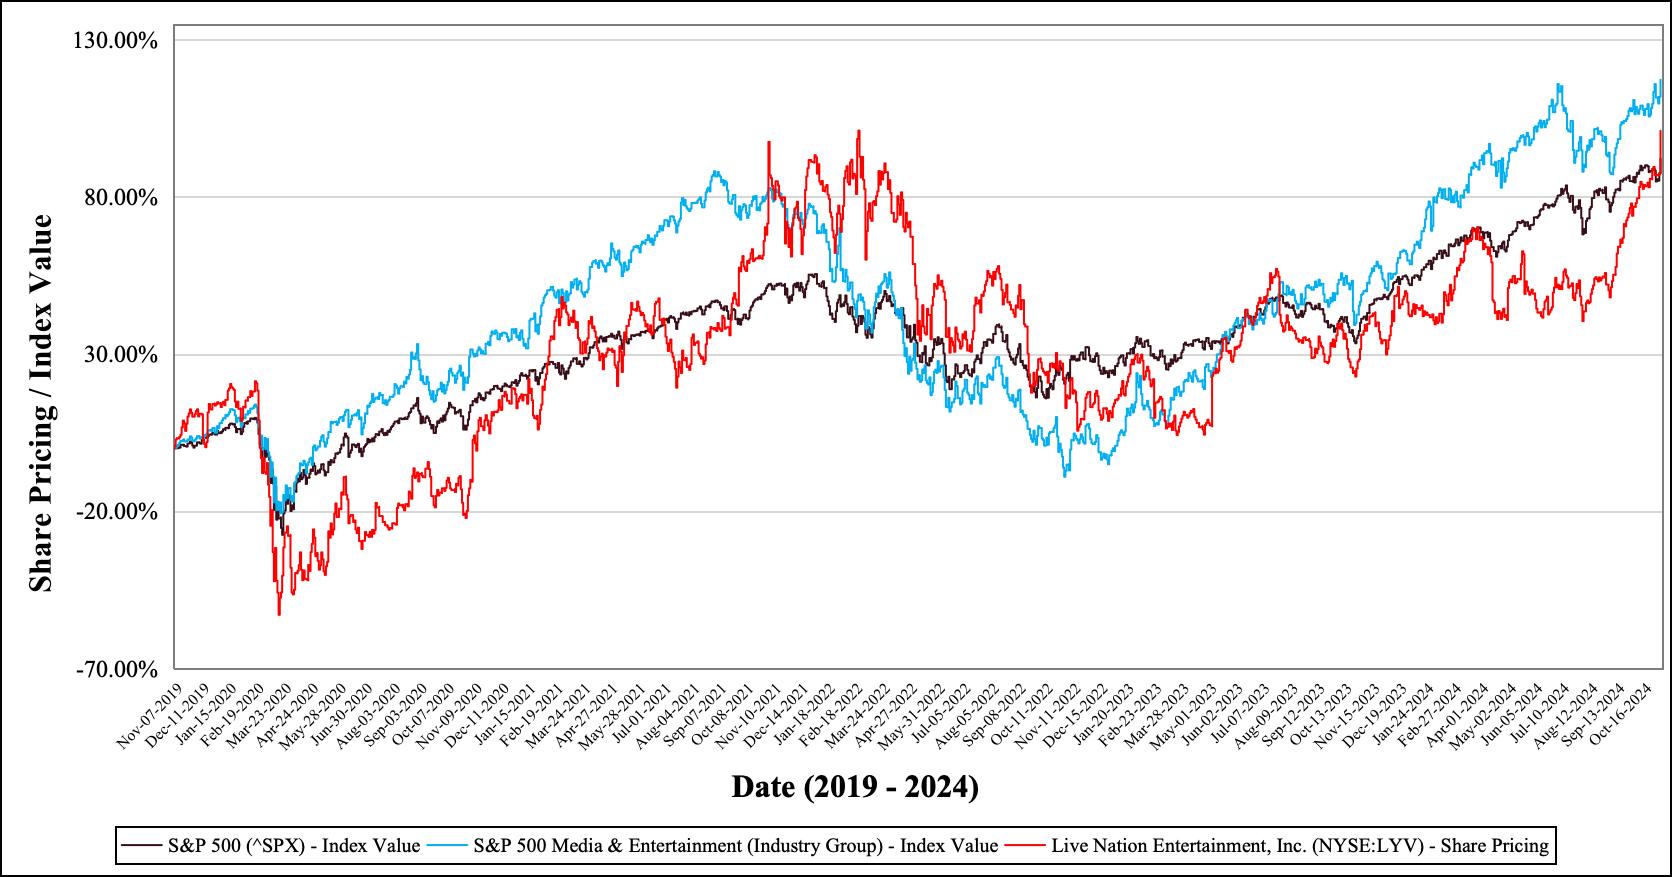
Source: Capital IQ
Risk Potential
DOJ & Trump’s Administration on Antitrust Law
On May 2nd, 2024, the U.S. Department of Justice in 29 states and the District of Columbia sued Live Nation Entertainment, dominating the concert industry by locking venues and selling exclusive presale tickets. Live Nation defends by stating that its integration improves service quality and lowers costs The executive vice president, Dan Wall, claims that Live Nation's net profits with Ticketmaster do not wield monopoly power, and this lawsuit will not reduce the price of tickets or service fees.
As Trump wins the 2024 election, many agencies expect he will replace Ms Khan, the FTC commissioner who champions antitrust regulations and chooses leaders from his party. To foster a better economic environment in the US, Trump will release fewer business regulations, including solid opposition to monopolies in industries such as energy and technology It is still not clear if Live Nation will benefit from this election. Still, I believe that Live Nation could take advantage of the loose business regulations under Trump's administration, further dominating the live concert industry.
In May 2024, Ticketmaster experienced a serious customer account security issue A hacking group called ShinyHunters disclosed 560 million users' personal information online. To fix this issue, Ticketmaster introduced a two-factor authentication process for ticket transfers. This suggests that Live Nation's ticketing system still has room for improvement, such as offering enhanced encryption practices and continuous system monitoring.
One thing that Live Nation should be concerned about while expanding its global presence is the ongoing geopolitical conflicts. Past tragedies include the Manchester, England bombing attack at the 2017 Ariana Grande concert; Pairs, France, massive shooting incidents at the 2015 Vince Neilstein metal concert; and recent news of how terrorist threats pushed Taylor Swift to cancel her concerts in Vienna. Therefore, Live Nation should prepare each concert event with effective risk management, or else there will be undesired terrorist attacks and massive shooting incidents harming Live Nation's long-term growth.
Sources:
Capital IQ | IBIS World | BBC News | Yahoo Finance | Seeking Alpha | Financial Times | CFRA Equity Research | Evercore ISI | Deutsche Bank Research | Oppenheimer | Macquarie Equity Research |Guggenheim
Eva Shrayer | December, 1st 2023
Rating: Buy
Current Price: $257.07
Company Updates / News
Q2 2024 Highlights
● $41B Market Capitalization
● $3.6B Revenue
● $44,465 Enterprise Value (MM)
● $738M Adjusted EBITA
● $171M Free Cash Flow
● $2.62 Adjusted EPS
● 1,680,606 Average Daily Volume
● 32M Active Users
Competitor Statistics


55M Loyalty Members
11.53B
All in on Flutter: Bet on Big Growth
Since Flutter’s listing in the New York Stock Exchange on January 29, 2024, the stock has grown 17% and is up 42.32 % year to date. Flutter is a best-in-class B2C gaming operator, with a leading presence across all of its key markets including the US, UK, Australia and Italy which together account for 90% of group revenues It has a leading product, scale, and brand which continues to reinforce its positioning despite increase competitive intensity and ongoing regulatory headwinds. Its competitive advantage lies in its wide-reaching digital platform, strong customer acquisition strategies and well diversified geographic footprint My buy recommendation reflects a belief that Flutter will continue to perform well, given the rising popularity of online sports betting and the legalization in more states across the US
Using comparable company analysis, Flutter is set to outperform its competitors With M&A acquisitions coming into play soon, they are set to grow especially in different geographic regions. For 2024, the revenue is expected to grow 20.7% Y/Y with an EBITA margin of 19 9% The EV/Sales ratio is projected to be 3 3x compared to competitor DraftKings at 3.7x as well as EV/EBITA of 18.3x vs. 47.6x.
Flutter Entertainment’s technology serves as a cornerstone of its competitive advantage, enabling it to deliver a superior user experience, drive engagement, and maintain operational agility in a rapidly evolving market The company has invested heavily in developing proprietary in-house platforms that power its major brands, allowing for greater control over the customer journey and enhancing platform stability Unlike competitors that rely on third-party systems, Flutter’s in-house technology gives it the flexibility to quickly adapt to regulatory changes, launch new products, and offer innovative betting features tailored to customer preferences. For instance, Flutter has pioneered advanced live betting options, such as enhanced NBA live betting and MLB prop betting, which have increased user engagement and retention by catering to bettors who favor real-time wagering. The technology also supports cross-product promotions and personalized recommendations, making it easier for users to explore different types of betting within Flutter’s ecosystem, thus increasing customer lifetime value. Furthermore, Flutter’s transition to an integrated technology platform has streamlined its operations, reducing costs and boosting margins by consolidating resources across its brands
In a ~$368B regulated sports betting and gaming market, Flutter has a strong 8% CAGR to 2030 with a current market capitalization of $44B. In 2024, Flutter Entertainment reported a significant increase in total assets, reaching approximately $35 billion, reflecting growth across its global betting and gaming brands, including FanDuel, Paddy Power, Betfair, and PokerStars. The company has expanded its market presence, particularly in the US , where FanDuel holds a dominant share of the online sports betting market (38%). Flutter's total revenue rose to approximately $12 billion, with the U.S. market contributing around 40% of this total due to rapid growth in legalized sports betting The company's customer loyalty is reflected in FanDuel’s strong position in active monthly users and high engagement levels in regulated markets.
Eva Shrayer | December, 1st 2023
Government Regulation: The regulatory landscape of U.S. sports betting has rapidly evolved since the 2018 repeal of PASPA, allowing states to independently legalize and regulate the industry Currently, sports betting is legal and regulated in 38 States and the District of Columbia. This change has created significant opportunities for Flutter Entertainment, whose FanDuel brand has established a leading position in the U.S. market. As more states, including potential large markets like California and Texas, consider legalization, Flutter is well-positioned to capture a substantial share of this growth. However, the fragmented state-by-state regulation requires Flutter to navigate complex licensing requirements, varying tax rates, and specific advertising and responsible gaming regulations, which impact profitability In addition, the rule of thumb is that leading scale operators can initially mitigate 50% of a potential tax hike (marketing lever, repricing of odds), which in theory should be more over time as smaller/sub-scale operators end up struggling and potentially exiting the market (Australia is a good example). I believe regulation will gradually increase, in line with more mature geographies, but at the same time will offer scale operators the opportunity to consolidate the industry further. The blended tax rate in the US, as last communicated at FanDuel’s CMD in 2022, was 33% of NGR, and this should not be too different today (a touch higher given tax increases in Ohio and Illinois)
M&A Acquisitions: Flutter has recently acquired an initial 56% stake in NSX Group, a leading Brazilian operator of Brazilian gaming Group Betnacional seeking to expand into the soon-to-be regulated market (early 2025) After the regulation, there will be less competition and small/sub sale operators will find it challenging to operate. Brazil’s market is particularly attractive due to its population of over 200 million with soccer and sports being a key part in the culture There is a strong demand for sports betting and iGaming products with compound annual gross gaming revenue growth in the unregulated market of 38% since 2018, to almost $3bn in 2023.
Flutter has also agreed to acquire Snaitech (“Snai”), one of Italy’s leading omni channel gaming operators Expected to close by Q2 of 2025, upon completion, combining Snai with its existing Italian leading business, it will be the country’s gaming leader with about 30% of the online market. Italy is the largest gambling market in Europe with an estimated gross gaming revenue of €21bn in 2023 Greater digital adoption is expected to drive online market growth at a compound rate of approximately 10%6 over the next three years.
Sources: Sources: Flutter Investor Relations | JPMorgan Equity Research |Yahoo Finance | Capital IQ | Financial Times
Lucas Lee | Nov 29
Rating: Hold
Current Price: $44.38
Price Target: $45.47
● Market Capitalization: $170.41 B
● EPS: $1.19
● 2023 Revenue: $134.00 B
● 3-year Sharpe Ratio: -0.7
● 5-year Beta: 0.42
● Gross Margins: 60.28%
● P/E: 17.48
● Dividend Yield: 6.68%
Competitor Statistics from Q3 2024

Market Cap: $273.07 B 2023 Revenue: $78.6B

Market Cap: $168.02 B 2023 Revenue: $121.57 B

Market Cap: $160.30 B 2023 Revenue: $128.4 B

Headquartered in New York City, Verizon was formed in 2000 through a merger between Bell Atlantic Corp. and GTE Corp. Verizon is currently one of the world’s leading providers of communications, technology, information, and entertainment products/services to consumers, businesses, and government entities. With a presence around the world, Verizon offers solutions that are designed to meet customers’ demand for mobility, reliable network connectivity, and security. The company operates in two segments: the Consumer Group and the Business Group The Consumer Group provides goods and services to individual customers while the Business Group serves businesses and government agencies.
The forecast for Verizon is clouded by a combination of strong strategic initiatives and unimpressive financial reports. While Verizon is advancing in key areas such as 5G expansion and broadband services, it holds a giant long-term fixed debt of almost $150 billion and has lost in net income each of the past 2 years, with a major decrease by $10 Billion. The dissatisfaction with the locked up cash has projected itself in the stock price being at a 10-Year low in October 2023. Today, the stock has recovered nearly 30% with increased free cash flow and increased dividend payments Verizon also announced the acquisition of Frontier in October 2024, which will have unknown long-term effects While Verizon will expand its coverage from this deal, it will have to navigate through the challenges of taking it on. Hence, I believe Verizon to be a Hold.
As of November 29th, Verizon (VZ) is trading at $44.38 Using a DCF analysis, I believe that the equity is fairly valued. I came to a target price of $45.47, using a 1.2% growth rate and WACC of 4.2% across 5 years These assumptions are based on a realistic representation of Verizon’s recent performance history of slow growth.
In its most recent quarter, Verizon reported a net total broadband addition of 389,000. It added a net total of 363,000 fixed wireless subscribers, bringing that total to 4.2 million. The company hit its fixed wireless subscriber target 15 months ahead of schedule. Total broadband connections are up 16% YoY and fixed wireless revenue is up YoY.
Lucas Lee | Nov 29
Verizon has been committed to rewarding its investors with consistent and increasing dividend payments. The company’s free cash flow has been growing over the years, typically paying out ⅔ of it to investors They provide investors with a high yield and the company has increased dividends for the 18th consecutive year
Verizon plans to acquire Frontier for $20 B in cash. What Verizon hopes to see from this acquisition is the expansion of its fiber footprint and good synergy However, Verizon will acquire $11 B of Frontier’s debt, which may bring more financial restrictions and reduce future dividends
Verizon 10-Year Graph:
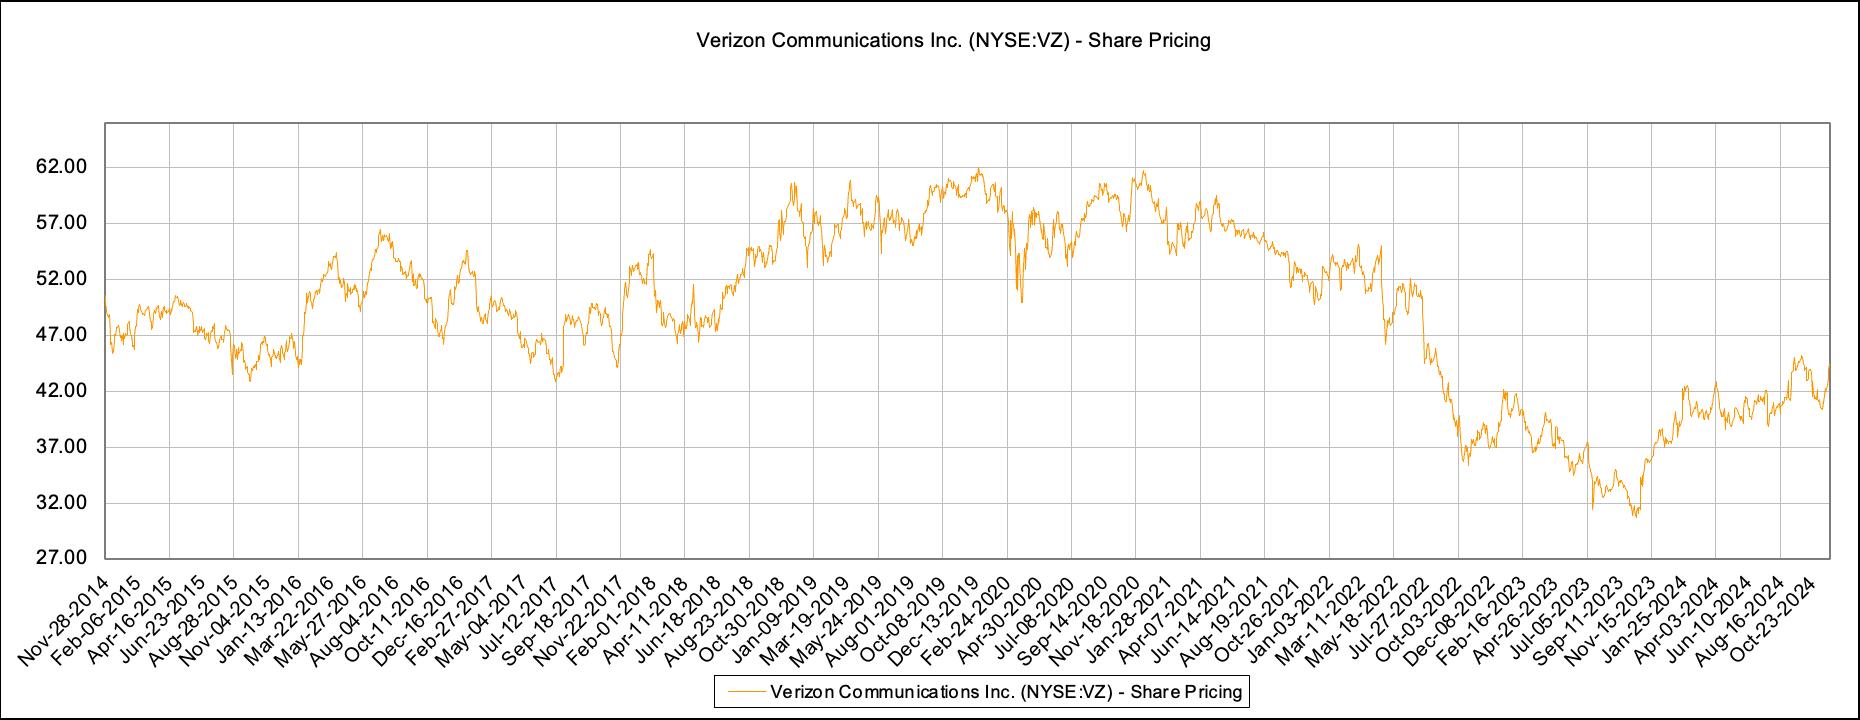
Source: Capital IQ
Risk Potential
Debt: Verizon has generated minimal revenue growth and experienced declines in earnings. In efforts to grow, it has used debt to finance growth. However, its debt has been adding up, racking up to $178 B Its current debt/equity ratio sits at 1.564 since September 2024. The debt/equity is a little higher than its competitors, meaning it is financially more risky Though, high debt is not unique to Verizon but rather the telecommunications industry
Market Saturation: Taking a deeper look into the industry, heavy competition in a highly saturated market affects growth potential. Most American consumers are already involved in the wireless market. While Verizon makes up for the largest customer base and achieves the highest revenue, T-Mobile dominates the market in terms of market cap This industry has been stagnant for some time now, making the emergence of the next big thing a huge differentiator in the space
Sources: Verizon Financial Reporting Summary | Capital IQ | Morningstar | Nasdaq | WSJ | Yahoo Finance
reaches S&P 500 Consumer Defensive stocks, including companies that manufacture food, beverages, persona and housing products, and other packaging, have revealed an upward 2024 trend, alongside the S&P 500 Index, year-to-date. While the S&P 500 is up +26.47% YTD, Consumer Defensive is shy of that at +19.76%. This is partly driven by Costo (COST) and Walmart Inc. (WMT). Costco is up +47.24% YTD, and Walmart is up +76.02% YTD. For a more holistic view, we can look at Invesco S&P 500 Equal Weight Consumer Discretionary ETF, which includes top holdings of Las Vegas Sands Bath & Body Works, Tesla, Tapestry, and Ralph Lauren. Due to greater diversification, the YTD returns are at +12.71%.
Consumer growth can, in large part, be attributed to control by the Republican party in office Following US elections, consumer discretionary stocks rallied. Previously, in September, buyers poured into the market at a low, in anticipation of interest rate cuts by the Federal Reserve Should the Federal Reserve cut rates once again, the economy would continue to grow further Looking toward debt, we can examine the US Consumers’ Debt-Service Ratio, examining the change in aggregate disposable household income with the amount owed. This has been on the rise and reveals the ease at which individualism can cover its debts If it stays as is now over the next year, consumers will have more spending money. Healthier debt ratios may also encourage consumers to dine out more, which would again boost consumer equities among the food and beverage sub-sectors.
Despite growth in the overall consumer sector, fashion stocks have declined post-pandemic boom. Volatility in the area brings great risk to investors. Demand for luxury goods is on the decline particularly with weak Chinese consumer demand driving a sales dip. Shares of luxury giant Louis Vuitton Moet-Hennessy (LVMH) declined nearly 7% after disappointing Q3 sales were announced, due to the conglomerate’s sales in Asia dropping 16%. While seemingly disappointing, the drop in luxury demand may drive brands like Indirex (ITX), owner of Zara, to perform well.
Lastly, we can predict the demand for home-related consumer goods by looking at the real estate market. Lower interest rates, boost the real-estate market, as borrowing liquidity becomes easier, which would drive the demand for home-related goods
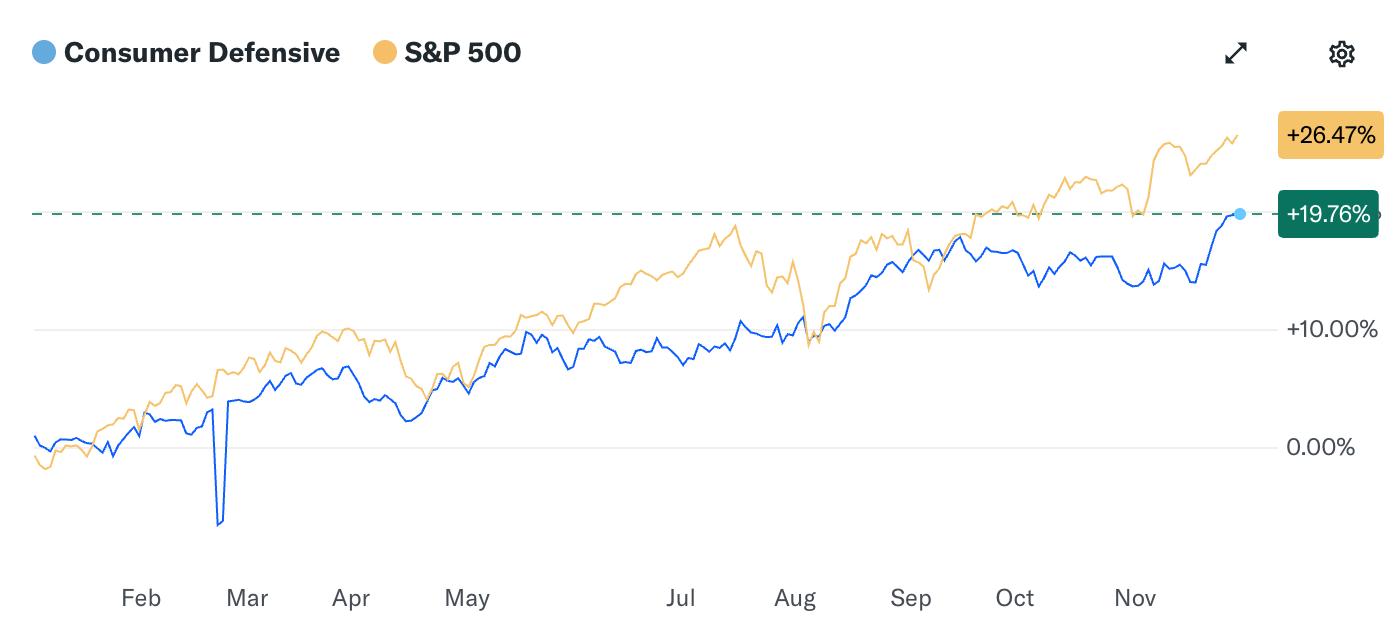
Consumer Defensive + S&P 500 (Source: Yahoo Finance)
Emily Hong | December 1, 2024
Rating: Hold
Current Price: $106.87
Price Target: $127.46
● Market Cap: $4.67B
● Beta (Yahoo Finance): 0.27
● EPS (TTM): $5.53
● PE Ratio (TTM): 19.33
● 52 Week High: $108.48
● 52 Week Low: $54.81
● 1Q25 filings show 30% increase in Career Learning enrollments YoY, ~41% of total enrollments
● Revenue per enrollment saw little change: 1.0% in Career Learning and 0.8% in General Education
● Optimistic forecasts for 2Q25, including revenues in the range of $560mm - $580mm, up from 1Q total revenue of $551mm
Competitor Statistics
incl. Statistics from Yahoo Finance

EV/Revenue: 0.73x

Revenue (TTM): $684.37mm

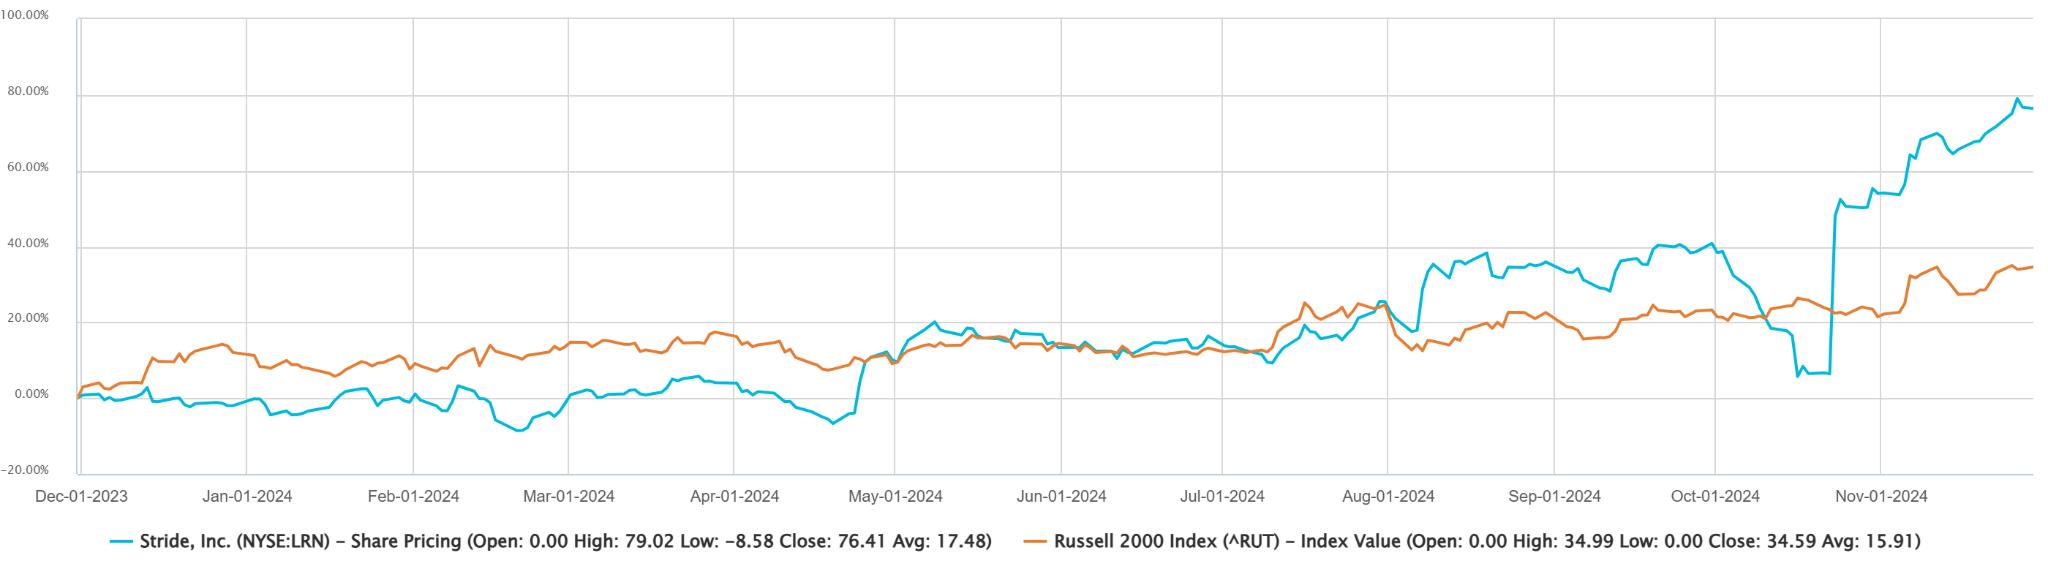
Stride, Inc. is an education services provider company with a focus on products supporting virtual and blended learning. Stride’s technology-based products and services span across curricula, learning management systems, instruction assistance tools, support services, and more. Stride operates a “school-as-a-service” model, namely an integrated package of these assorted offerings in order to service their clients across all elements of education Further, the company breaks revenue down into two key streams General Education and Career Learning. While General Education, the business’ K-12 focus, has historically been Stride’s focus, recent trends show shifts toward career learning. My hold recommendation reflects an excitement about Stride’s ability to continue developing Career Learning under the industry-wide trend of shifts toward seeking alternatives to traditional higher education, tempered by a realistic mentality toward current market enthusiasm toward the company, which has driven high valuations
As of November 29th, 2024, Stride, Inc. trades at $106 87 per share, sitting right under the company’s 52-week high of $108 48 per share This situates the share price slightly below my anticipated 2026E price of $127.46 per share, calculated through a Discounted Cash Flow analysis with a 2 50% terminal growth rate and 8 37% WACC Notably, this model utilizes a beta of 0 58, average between Yahoo Finance and Barra, the latter of which offers a more conservative beta estimate of 0.88. Despite the slight upside of the anticipated share price over its current price, I do not believe the upside substantiates a buy recommendation, given comparable growth of peer companies; the growth rate of the S&P 500 and other indices; and anticipated YoY inflation rates.
A key observation from Stride’s October release of its 1Q 2025 earnings report is the continued increase in Career Learning enrollments, not only nominally, but more notably as a percentage of Stride’s total enrollments. Compared to 1Q24, Career Learning enrollments increased by approximately 21,400 students, boosting the segment’s portion of total enrollments from ~37% to ~41% In parallel, trends in the education industry as a whole suggest rising interest in career development and alternative education outside of traditional higher education, with cost of attendance skyrocketing for university degrees that generate waning ROI for the majority of the population. Further, rports from the Bureau of Labor Statistics (referenced in Stride’s 10K23) estimate a 6 7% growth in demand for job occupations that require nondegree postgraduate education, and companies like Stride service that gap, providing good reason for the mirrored industry trends in the company’s financials. Still, it is important to note that Career Learning, compared to General Education, generates slightly lower revenue numbers, although it has seen slightly higher growth (1 0% vs 0 8% General Education) If Stride can adequately boost revenue numbers from Career Learning in its continued expansion and compress margins, that would positively impact its future valuation.
Emily Hong | December 1, 2024
Source: S&P Capital IQ
Risk Potential
Regulatory Policy:
Given that much of Stride’s General Education growth depends on state-level education policy as well as the company’s collaborations with individual state boards of education, regulatory uncertainty is a meaningful concern when evaluating Stride’s future performance Political changes, such as the recent election playing a new party in power, may affect national-level budgeting decisions, which would trickle into budget allocations and constraints for education in different states Further, tightening of technology policies in education, homeschooling policies, or virtual education would impact both enrollment and recurring revenue Collaboation with policymakers and staying on top of policy trends remains important in order to mitigate this risk.
While Stride is a fairly established player in the online education space, there remains the risk of technological disruption or competition from smaller companies or other education-technology firms. These risks are larger in the Career Learning space, as Stride’s products and relationships with firms are less differentiated in comparison to General Education, where the company’s position in public education is more formidable. Because of this, Stride must continue to innovate, both in terms of curriculum and products itself as well as its underlying technologies. The Career Learning space as a whole is very competitive, and Stride faces—like any other company operating in this space—strong challenges of differentiating its brand name, product, and customer relationships from peers.
While economic downturns and higher unemployment may boost demand for Career Learning, as students opt away from attending college or postgraduate degrees due to high costs and low employment rates, a prolonged period of poor economic performance could also reduce household disposable income as a whole, limiting customers’ willingness to spend on education as a whole. Further, in periods of cost-cutting due to poor performance or growth, companies themselves may also be more reluctant to spend on career development tools for their employees in partnership with Stride, which would also reduce revenues in the Career Learning space.
Sources: Capital IQ | Stride Company Filings | Yahoo Finance
Aditya Mehra| November 11, 2024
Rating: Buy
Current Price: $124.87
Price Target: $166.57
Company Updates / News
● Market Cap: $193.8B
● Dividend Yield: 4.18%
● PE Ratio: 19.86
● 52 Week High: $134.15
● 52 Week Low: $87.82
● Hits all-time high after Q3 earnings, driven by raised guidance and double-digit revenue growth
● Smoke free segment is growing at double the rate of its core combustible segment
● The tobacco and nicotine segment face headwinds due to regulatory uncertainty
Competitor Statistics from Q3 2024
EV/EBITDA: 9.87
Revenue: $21.6B

EV/EBITD Revenue: $20.4B

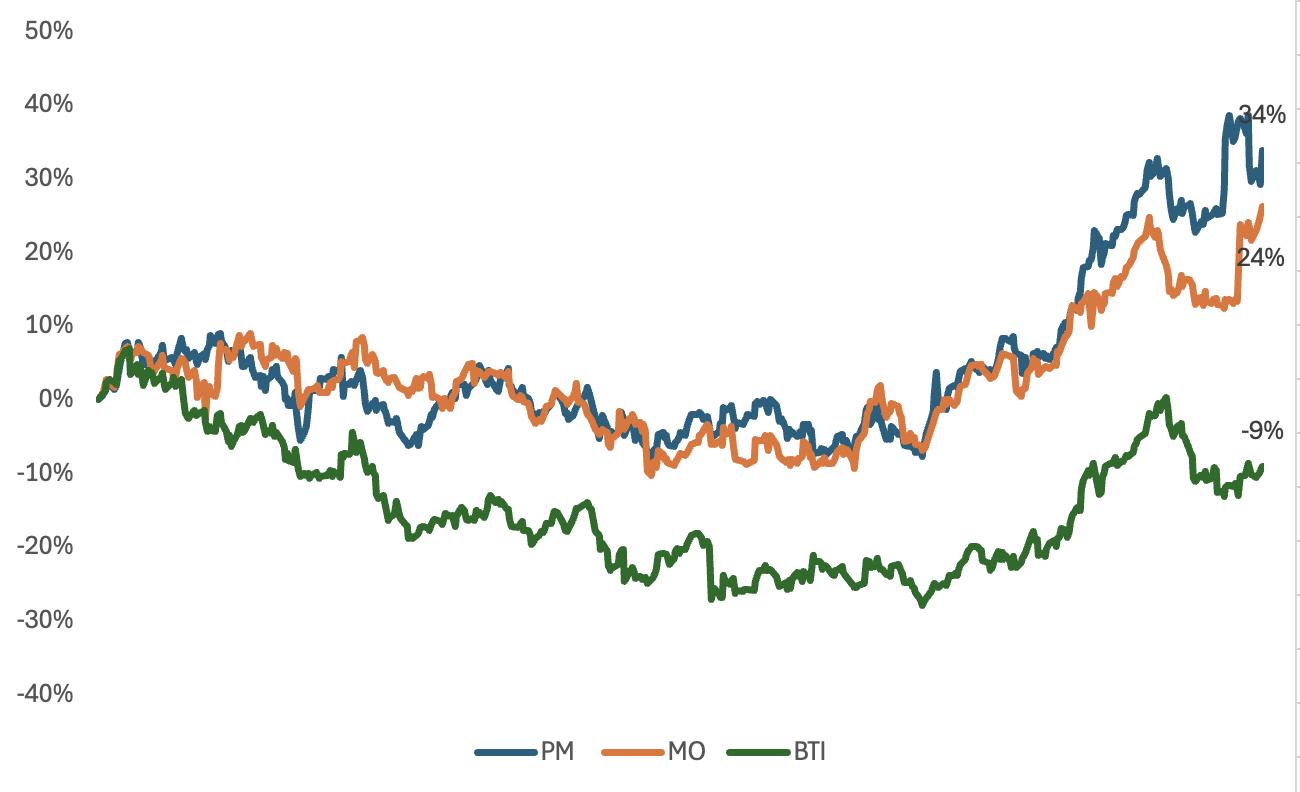
Created by the spinoff of the international operations of Altria in 2008, Phillip Morris operates as a multinational tobacco company delivering products in the tobacco and nicotine sectors It is most well known for its best-selling product Marlboro, and is now working to deliver a smoke-free future and evolving its portfolio for the long term to include products outside its core segment Philip Morris International sells cigarettes and reduced-risk products, including heatsticks, vapes, and oral nicotine products through Swedish Match, in more than 180 countries primarily outside of the US The stock is ~9% below its all-time high and has been outperforming the S&P by nearly 5% this year, with an implied beta of 0.6. My buy rating is reflected by the stock being attractively valued at current levels, creating a compelling value and income opportunity through its high dividend yield Despite declining global cigarette consumption, Phillip Morris’ pricing power and growth in emerging markets support revenue growth and margin expansion
As of November 11th , 2024, Phillip Morris was trading at $124.87 per share. I believe that this equity is undervalued and will increase to $166 57 within the next year, implying a 33% upside. I conducted a Discounted Cash Flow Analysis with a terminal growth rate of 3 00% and a weighted average cost of capital of 6 6% across 5 years to arrive at this valuation My assumptions are based upon Phillip Morris’ guidance and an optimistic view of Phillip Morris’ future performance in growing segments.
The acquisition of Swedish Match in 2022 has been beneficial to PM on two primary fronts The primary advantage of PM relative to its competitors, given the relatively lower dividend yield and higher valuation, is the fact that its smoke-free revenue is more than double its competitors as a percentage of sales. From its iQOS heatsticks to oral nicotine products (ZYN and Snus) through Swedish Match, its brands are market-leading, and purchasing this stock is a bet on the consumer transition away from cigarettes. Its iQOS segment has increased customers by nearly 15% in FY23, spurred by growth in Japan, Europe, and a broad range of low-income countries
Given the nature of the spinoff from Altria, Phillip Morris’ US presence remains low, accounting for only 6% of its revenues. While PM does not disclose segmentation for which products comprise this 6%, it is fair to assume that Swedish Match accounts for a significant portion of their American sales Phillip Morris is gearing up to grow this portion, with plans to invest 800 million dollars in building ZYN factories in the US to meet higher demand, creating a new entry route to rebuilding its US presence Furthermore, PM has been good at targeting lower-income markets and acquiring brands, notably with its purchase of Sampoerna cigarettes in Indonesia. In the US, PM acquired the rights to commercialize iQOS from Altria, effective April 30th 2024 The US smoke-free market is growing at the second quickest rate behind China, and this combined with its oral nicotine offerings will assist PM in capitalizing on this growth
Aditya Mehra| November 11, 2024
Source: S&P Capital IQ
Risk Potential
According to estimates based on company guidance, the forward price to non-GAAP earnings stands at 18.8x, and while this is considerably undervalued given the Shiller PE ratio at 37x, this compares unfavorably to PM’s historical PE of 16.2, implying a 14% downside. Given its successful pivot to next-generation products, there is some justification for PM’s premium valuation, accounting for 36.5% of net revenues Regardless, it is important to look at comparable valuations given the uncertainty of its core business
Phillip Morris’ earnings are negatively impacted by the overall regulatory outlook, and the company is already subject to heavy government intervention in their sector Phillip Morris’ net revenues are 60% below revenues before excise taxes (government-imposed taxes on production and distribution), and regulatory scrutiny could lead to higher-than-expected excise taxes In June 2024, PM disclosed a subpoena from the attorney general of D.C regarding the sale of flavored pouches, stating “a material liability is reasonably possible ”
Sources:
Kevin Feng| November 11, 2024
Rating: Buy
Current Price: $39.04
Price Target: $47.69
● Market Cap: $4.9B
● Beta: 2.33
● EPS: (0.78)
● PE Ratio: NM
● 52 Week High: $42.77
● 52 Week Low: $8.83
● Sweetgreen’s 2024 Q3 results report positive but slightly below-expectation growth
● SG’s Infinite Kitchen automation initiative is under trial & expects to be fully implemented within 5 years
● Cost-push inflation in 2024 drives more consumers transition to dine-at-home options
Competitor Statistics up to Q3 2024

EV/Revenue: 7.6x
Revenue: $10.98B

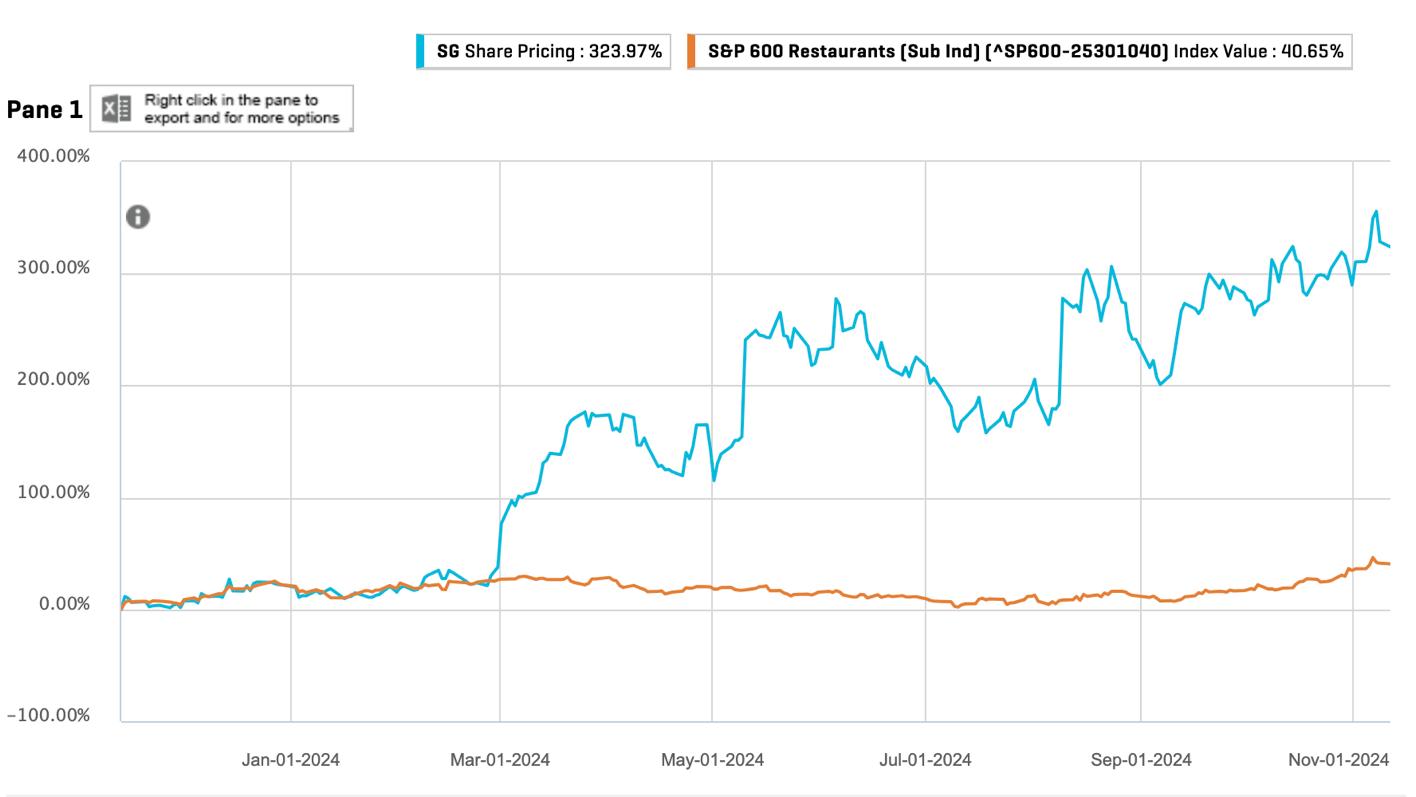
Sweetgreen Inc (NYSE: SG) is a mission-driven restaurant brand in the fast-casual restaurant industry that differentiates itself with a set of “green” ethos, including healthiness & freshness of ingredients, local sourcing, seasonality celebration, etc It now operates over 200 restaurants in more than 18 states, sourcing from 200+ domestic partners and serving 13+ menu items With a young group of company management members, Sweetgreen seeks continued growth into the future with a heavy focus on adopting new technology From building more diverse, digital distribution channels to automating its kitchens, there is significant room to increase sales, enhance cost efficiencies, and break even in the near future. However, given fierce competition and potential drops in consumer spending, realizing the margin improvements may face difficulties. Altogether, combining quantitative valuation results giving a 20%+ upside with these trends, Sweetgreen is given a “Buy” rating.
As of November 11th , 2024, Sweetgreen (SG) is trading at $39.04. Using a Comps analysis with 5 competitors in the fast-casual restaurant industry and median EV/Rev & P/B multiples, the implied share price is $50.08. Only these multiples are chosen because current earnings are negative. Conducting a Discounted Cash Flow (DCF) analysis for SG until 2030, with WACC 8.22% and terminal value calculated from an average of Perpetuity Growth & EV/EBITDA multiple TV, the implied stock price is $45.30. Applying an equal weight, the target price will be $47.69, an upside of 22%.
Sweetgreen has been expanding the number of its distribution channels to the current count of 5, particularly emphasizing the digital channels. Its own digital app & website, combined with the previously used Marketplace channel, constitutes 59% of FY 2023’s total revenues. In particular, per-order value generated is reported to be higher for digital orders than in-store ones, reflective of an increasingly larger loyal customer base and further room for sales growth. Moreover, while more revenue is generated, cost-efficiencies have been improving too – the support center costs has grown by merely 4% between 2020-23 while revenue in the same period has grown by over 100%, reflective of shared overhead costs rendering some economies of scale Combined with initiatives like its “Sweetpass+” membership & its outpost channel for group orders, the multi-channel growth of Sweetgreen has enhanced the customer experience and built loyalty
EV/Revenue: 10.3x Revenue: $25.94B

EV/Revenue: 19.9x Revenue: $12.17B
Since Sweetgreen’s acquisition of Spyce, a robotic-powered restaurant chain, in 2021, it has announced plans to automate both its ordering system & the salad-making process This initiative provides room for Sweetgreen to greatly reduce labor costs, which currently is around 30% of COGS; CFO Mitch Reback estimates a 7% margin increase for each store that can be sustained into the future Moreover, same-store sales growth, which has been consistently growing at ~3-5%, could be maintained, if not enhanced, with the automation capable of supporting staff during peak times. Management plans full implementation at all stores within 5 years; initial attempts has proven successful with more traffic throughout the day and improved efficiencies by around 10%.
Kevin Feng| November 11, 2024
Sweetgreen vs. S&P 600 Restaurants Sub-Index Stock Price Performance (1Y)
Source: S&P Capital IQ
Risk Potential
The US restaurant industry, particularly the fast-casual industry, faces significant competition with over 200,000 businesses For example, Chipotle (CMG), one of the biggest, well-established players, shares merely 2 7% of the market; Sweetgreen is about 1/20 of Chipotle. As a result, switching costs between alternatives are low. Dine-at-home options are also becoming more appealing, particularly caused by the diminishing market segment of low-income households However, the competitive landscape is also one that favors unique value propositions, such as a focus on health; in this realm, Sweetgreen is the leading restaurant in the industry with the main product line being salads, and may generate a loyal, younger-generation customer base.
Given positive prospects from automation in the future, Sweetgreen may see limited effectiveness in improving its current cost structure, in the short-term. For one, each installment of the Infinite Kitchen automation technology costs between $450,000 and $500,000, a significant CAPEX within the next five years Given 2024 Q3 results, margin improvements appear to be slow, and whether this will be sustained or not may be uncertain.
Any unfavorable conditions for consumer spending in the future, such as higher interest rates, higher taxes, or less certainty, could all significantly reduce revenues for Sweetgreen and the restaurant industry altogether. Particularly for Sweetgreen, whose menu options are slightly pricier than McDonald’s or Chipotle at ~$20 per item, lower consumer spending may affect same-store traffic, the rate at which new stores are opened, and the ability to pass on higher costs through higher menu prices
Sources: Yahoo Finance | Capital IQ | SeekingAlpha | investor.sweetgreen.com | SEC/EDGAR | CNBC | IBIS World
Abstract: Energy in Q3 has experienced many complex trendsacrossbasicallyeveryverticalandcommodity.Asthe industry navigates into Q4, therearestillmanyunknowns regarding the demand, supply, and pricing thatleaveboth investors and companies confused. While oil prices have beendeclining,gaspriceshavegrownsigni�cantlytoalmost over50%ofitspricesinceAugust.
Oil prices have been on a bit of a rollercoaster this quarter. Uncertainty coming from both geopolitical tensions, new presidents and unclear policies, and fluctuations in demand have caused investors to have very mixed feelings about the market. To effectively break these pricing mechanics down, it is important to view each event holistically
Starting with geopolitical tensions, the conflict in the Middle East has been slowly involving more and more countries, as the US encourages warring nations to not strike key energy and oil infrastructure. So far, these methods of protecting oil supply have worked, keeping oil prices relatively subdued. However, there is always the possibility of further escalation, which has led to energy trading being a major profit driver for many companies this quarter. Shell and Exxon have seen relatively strong Q3’s compared to historical data due to higher profits from risk hedging.
Trump’s Presidency: with Trump back in office, there are major expectations from analysts across each vertical. For oil, the entire situation can be encapsulated with one simple phrase. “Drill, baby, drill.” Trump has made it clear he wants to increase US oil supply through slashing regulations to increase production. However, this is troubling for many oil giants, as Trump's actions would not only drive oil prices down, but increase competitors as well.
Finally, with unclear actions from OPEC and the lack of a complete economic policy from China has brought uncertainty for both supply and demand. As such, the commodity hasn’t stuck to any particular trend or forecast.
Commodity Pricing Last 3 Months Oil (Brent Crude and WTI)
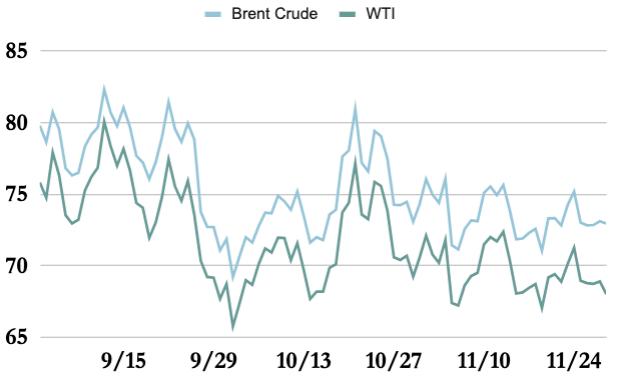
Source: Yahoo Finance
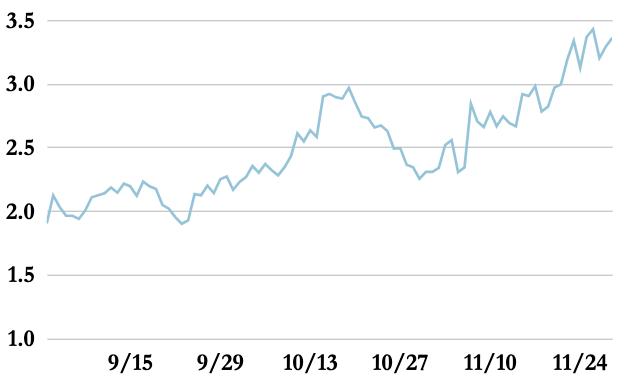
Natural Gas (NG Futures)
Source: Yahoo Finance
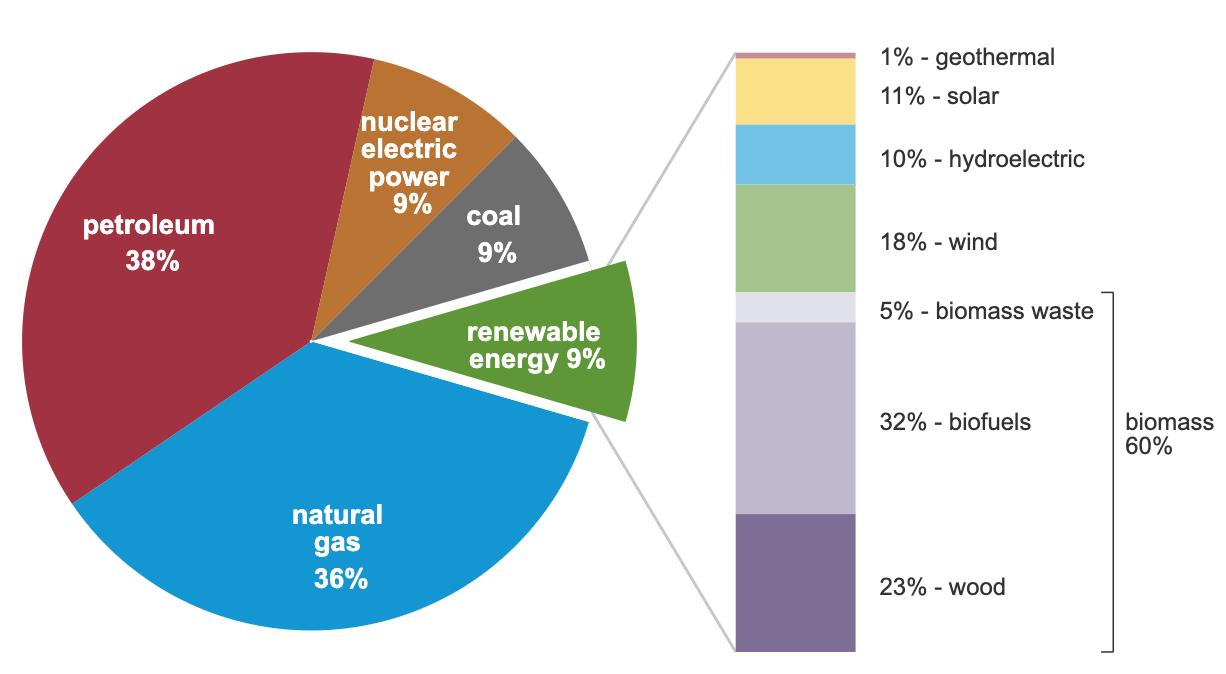
Renewable Energy Demand
Source: US EIA
As for natural gas, the consistent price increases from increasing demand along with Trump's promise to cut regulation on exports could mean a booming industry for the next four years. Natural gas, and especially liquid natural gas products, have been exploding in demand due to their flexibility, versatility, and low cost.
With many economic sanctions resulting from the Russo-Ukraine war, natural gas has been a key commodity in Western Europe US exports could potentially relieve EU countries' current reliance on Russia for gas China, once again, has seen unsteady demand and no clear direction or focus for their economy in Q3, leading investor confusion and uncertainty
However, there are many complexities with Trump and the IRA. In particular, the probability of the IRA completely disappearing is very unlikely. Similarly, while the renewable energy industry might have taken a hit, there is very little chance that the energy transition is over.
Source: US EIA
These trends are consistent with other renewable energies like solar as well. This shows that the IRA and its grants, subsidies, and tax credits/breaks are incredibly important for both Red and Blue states. This, along with the IRA’s role in promoting general energy transition technology that has been increasingly important to the US economy, should safeguard most of the IRA from Trump’s ambitious program cutting goals
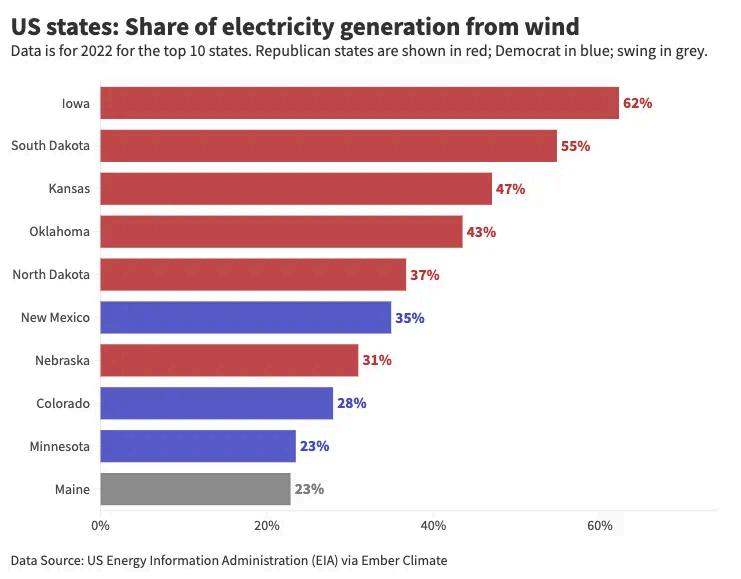
Although Trump has appointed conservative leaders to both the Energy Secretary and EPA, many Republican states rely heavily on the clean energy sector for employment and economic benefit. From the graph showing state energy generation from wind, the top 5 wind energy generating states are all Red states.
Finally, while M&A deal flow recovered a bit in Q3, expectations with Trump in office and the potential removal of FTC chair Lina Khan could mean further consolidation and increased M&A deals for energy companies. Currently, oil and gas have already reached high level of consolidation, and renewable energies companies are often too small to attract the fees necessary for the bulge bracket banks to act. As such, many middle market firms have seen an influx of deals and activity The future of energy will likely continue to dependent on government policy, tariffs, and commodity prices What we can expect in the immediate future in Q4 is the recovery for M&A, especially in the middle market due to the already consolidated large energy companies
All in all, the energy industry is going to experience a lot of changes as policies and expectations become much more clearer from some of the world’s largest economies.
Justin Li| November 11, 2024
Rating: Buy
Current Price: $40.14
Price Target: $52.05
Company Updates / News
● Market Cap: $5.765B
● Beta: 1.41
● EPS: 3.98
● PE Ratio: 10.08x
● 52 Week High: $62.31
● 52 Week Low: $30.93
● Nextracker’s Q3 earnings beat expectations
● Revenue increased 11% from Q3 last year driven by increased sales
● Adjusted EBITDA grew by a massive +57% from YoYr, signifying Nextracker’s transition to profitability
Competitor Statistics from Q3 2024

EV/EBITDA: 10.9
Revenue: $0.982B
EV/EBITDA: 8.72
Revenue: $4.017B

EV/EBITDA: -1.13
Revenue: $0.144B
Investment Thesis:


Nextracker is a solar technology and software company, whose product is intended to be used alongside solar panels to improve and optimize performance. Nextracker’s core offerings reflect its niche well; the NX Horizon product line offers three types of solar panel mounts that adjust to the altitude (angle) of the sun throughout the day to maximize solar exposure and energy generation Nextracker supports mainly commercial and agricultural solar panels for profit, and the company’s technology greatly contributes to increasing reliability and stability of solar panels across the globe However, it is important to note that the recent US Presidential election may bring unforeseen challenges for Nextracker due to Trump’s explicit stance against renewable energy tax credits. My buy recommendation reflects the belief that although there is substantial uncertainty for Nextracker, the company’s potential to continue to outperform the rest of the renewable energy market is highly likely due to recent recognized revenue synergies and its resilient core business model
As of November 8th , 2024, Target Corporation was trading at $40.14 per share. I believe that this equity is undervalued and will increase by 30% to $52 05 within the next year. I conducted a Discounted Cash Flow Analysis with a terminal growth rate of 3 00% and a WACC of 11 4% across 10 years to arrive at this valuation My assumptions are based upon NXT historical data and an optimistic view of NXT’s future performance.
Over the last year, Nextracker has seen its stock price beaten down by negative street sentiment; however, its core financial health and profitability has always been stable Nextracker has been able to consistently meet or beat earnings because of its financial stability during a time of policy uncertainty. What has been consistently driving financial gain in this company is innovation of technology Nextracker was founded with this idea in mind, and it currently has over 600 patents pending, which will soon materialize into additional revenue and profit for investors. Finally, the recent acquisition of Ojjo will create revenue synergies that the market has crucially undervalued. Ojjo has land support systems that allow Nextracker to deploy their solutions in brand new markets and boost revenues for Nextracker
Currently, Nextracker has over 4.5 billion dollars backlogged orders and unearned revenues. From an accounting perspective, this means that there are 4.5 billion dollars of revenue through contracts that have yet to be officially recognized on the income statement for Nextracker. Furthermore, despite the fact that these 4.5 billion dollars of revenues have not been recognized, Nextracker was still able to beat the adjusted EBITDA target by over 57%. Management at Nextracker expects that over the next two years, 90% of the 4.5 billion dollars will be recognized as services and goods are rolled out, which will truly reflect just how profitable the company is.
Justin Li| November 11, 2024
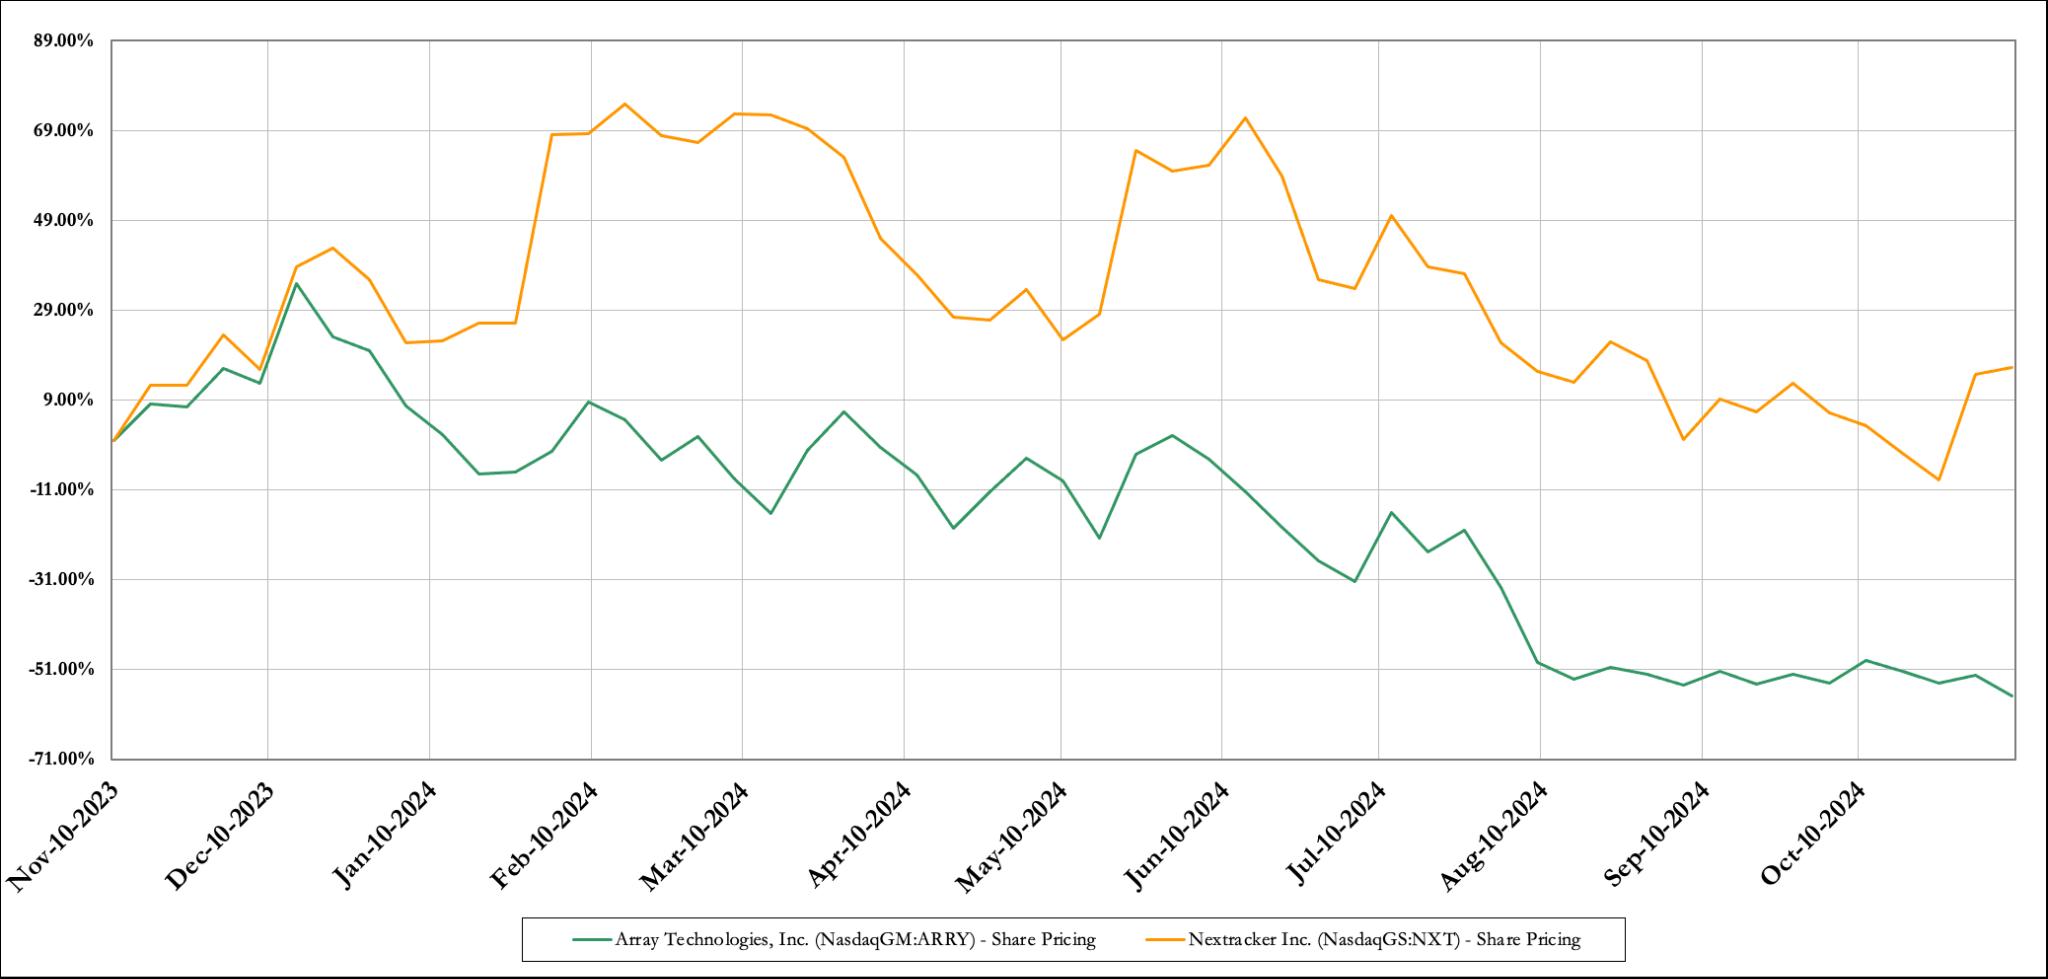
Nextracker vs. Array Monthly Share Price (YTD)
Source: S&P Capital IQ
Risk Potential
Newly elected US President Donald Trump has made it clear through both personal statements and party alignments that there will likely be some reductions to renewable tax credit incentives. This would hamper Nextracker’s business as its solar trackers need solar panels. Furthermore, with the US Congress and Supreme Court both aligning with Trump’s political party, additional policies could be passed to reduce incentives for solar energy.
The solar tracking and software industry is quite small, and while Nextracker has been fortunate enough to become a consolidated leader in the field, there is mounting competition that cannot be ignored. Nextracker faces a critical moment in its life as a company. Many strategy choices must be made to maintain its first-mover advantage, all of which could bring potential downside and loss.
Nextracker is heavily dependent on raw materials to build its trackers but also on the continued production of solar panels from other companies. As such, with rising silicon costs, disruptions in shipments from geopolitical conflicts, and skyrocketing expenses for precious metals, Nextracker’s profit margins and overall revenue could be significantly impacted in the coming years.
Sources: investors.nextracker.com | NY Times | Barrons | CFRA Equity Research| Yahoo Finance | ir.arraytechinc.com | investors.sensata.com | Capital IQ | Robinhood |investor.ftcsolar.com
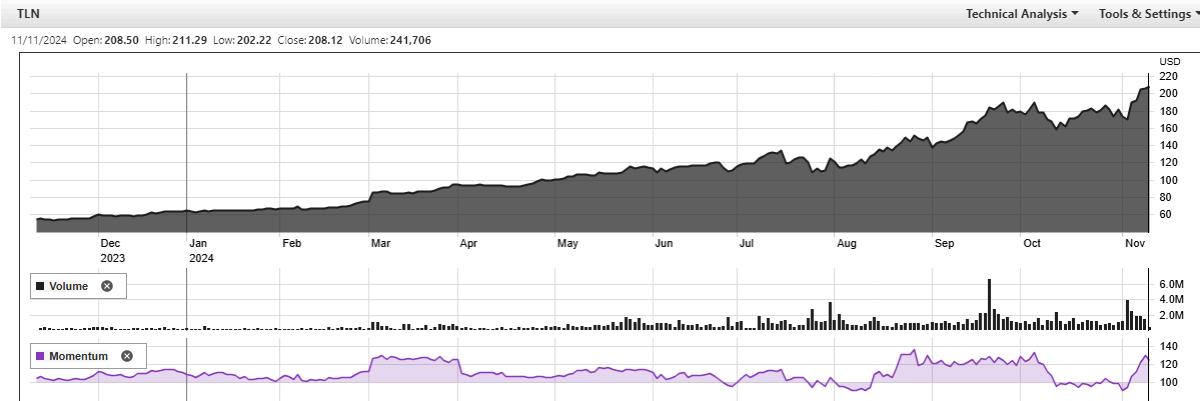
Laurent Vo| November 11, 2024
Rating: BUY
Current Price: $206.67
Price Target: $230.11
● Market Cap: $10.6B
● Beta: 1.02
● EPS: 14.22
● PE Ratio: 13.51
● 52 Week High: $214.00
● 52 Week Low: $52.01
● Talen Energy Reports Q3 Revenue Growth Driven by Capacity Price Increases
● Talen’s Q3 Earnings Exceed Forecasts on Higher Capacity Revenues
● Talen Energy Q3 Results Reflect Strong Revenue and Strategic Diversification
Competitor Statistics from Q3 2024

EV/EBITDA: 4.6
Revenue: $14.78B
EV/EBITDA: 8.5
Revenue: $10.1B
EV/EBITDA: 7.2
Revenue: $26.9B
Investment Thesis:
Talen Energy (NASDAQ: TLN) is a US -based independent power producer with a diverse portfolio spanning nuclear, natural gas, and coal-fired assets. Following a recent Chapter 11 restructuring, Talen has emerged with a fortified balance sheet and improved operational focus, positioning it well in the changing energy landscape The company has renewed its emphasis on sustainable growth including investments in data center power solutions and cryptocurrency mining, showcasing adaptability and ambition to diversify revenue streams. Despite regulatory setbacks, such as the recent denial of its proposal with Amazon by the FERC (Federal Energy Regulatory Commision), Talen’s strategic initiatives and favorable positioning within the PJM market create a solid growth outlook. Furthermore, Talen’s unhedged capacity through 2026 allows it to capture potential market upsides as energy prices fluctuate
Given these factors, I issue a Buy recommendation on Talen Energy with a price target of $230.11 The company’s balanced approach to growth and risk management, combined with favorable market trends and a strengthened financial position, make it a great stock for portfolios looking for exposure in the energy market.investment opportunity
Talen Energy’s financial position brings both opportunities and challenges, with its outlook being closely tied to interest rates On the positive side, Talen boasts strong revenue numbers of $2.11 Billion and a gross margin of 31.9%, which indicate key profitability must most importantly highlight market demand With over $1 1 Billion in EBITDA, Talen also shows excellent operational management and earnings potential. A cash flow of $587 provides Talen the mobility for new investments, which they have largely capitalized on including their new data center power solutions and cryptocurrency mining operations.
Given Talen’s current stock price and its competitors, an EPS of 14 96 is deemed solid given the capital-intensive industry they operate in. It is important to keep in mind however, that Talen’s debt-to-equity of 114 77% means that it is substantially leveraged even if they boast strong liquidity ratios. The Federal Reserve’s recent rate cut is a good indication for Talen, as lower interest rates allow them to reduce debt expenses and improve their already solid cash flows Recent repricing of its Term Loans B and C have already saved Talen an estimated $13 million annually, positioning it to benefit even further from a progressively low-interest environment
Compared to its peers, Talen Energy’s valuation metrics show a mixed positioning. Its P/E ratio of 12 63 is lower than that of many competitors, indicating that it might be undervalued relative to its earnings. However, its EV/EBITDA of 18.36 is higher, suggesting the market values its earnings at a premium, likely due to strategic assets or growth potential The P/B ratio of 3 70 is moderate compared to peers, showing a balanced valuation relative to its assets.
Sources: Talenenergy | Capital IQ | Yahoo Finance |Davis Polk | Quantisnow | S&P Global | UtilityDive | Barrons
Source: Talenenergy
Amazon situation, what now?
The bullish case for energy stocks for the year of 2024, were in part on Tech companies signing lucrative agreements to plug their data centers directly into power plants. In fact, since January 2nd, 2024, Talen’s stock price (previously $66.55) has seen an appreciation of 192%. The Talen and Amazon deal aimed at directly supplying nuclear power to Amazon’s data center in Pennsylvania The deal fell through when the FERC rejected it due to concerns about market fairness and pricing impacts This setback complicates Talen’s strategy to secure a stable and long-term revenue stream through power agreements seeking clean energy Although it leaves Talen’s nuclear energy plans on hold, there are still other ways Talen can profit from its diversified portfolio
Talen Energy is well-positioned to benefit from strong regulatory support and its role within the PJM Interconnection, which powers much of the U.S. PJM’s structure helps maintain stable energy pricing, which supports Talen’s nuclear, gas, and coal assets. The recent PJM capacity price auction significantly boosted Talen’s outlook; on July 30, 2024, prices for 2025-2026 jumped to $268 92 per megawatt-day from $49 49 This surge reflects a growing gap between supply and demand, driven by underinvestment in baseload, retiring dispatchable power, and rising demand from AI infrastructure. For Talen, this price increase translates to about $670 million in capacity revenue for 2025-2026, a $285 million year-over-year gain While prices may eventually stabilize, demand drivers suggest elevated rates could persist, positioning Talen’s revenue base for ongoing growth.
A second Trump administration is expected to bolster domestic energy production which mainly benefit traditional power sources like natural gas and coal. There are mixed views however about Trump’s support for nuclear development. Although he has historically backed nuclear innovation and signed critical legislation like the Nuclear Energy Innovation and Modernization Act, recent comments suggest he may see large-scale nuclear projects as overly complex and costly potentially leading to reduced federal funding Despite navigating an uncertain policy landscape that could limit growth in advanced nuclear initiatives, Talen’s dual-fuel and coal-fired initiatives are expected to benefit from the PJM pipeline
Sources: Talenenergy | Capital IQ | Yahoo Finance |Davis Polk | Quantisnow | S&P Global | UtilityDive | Barrons
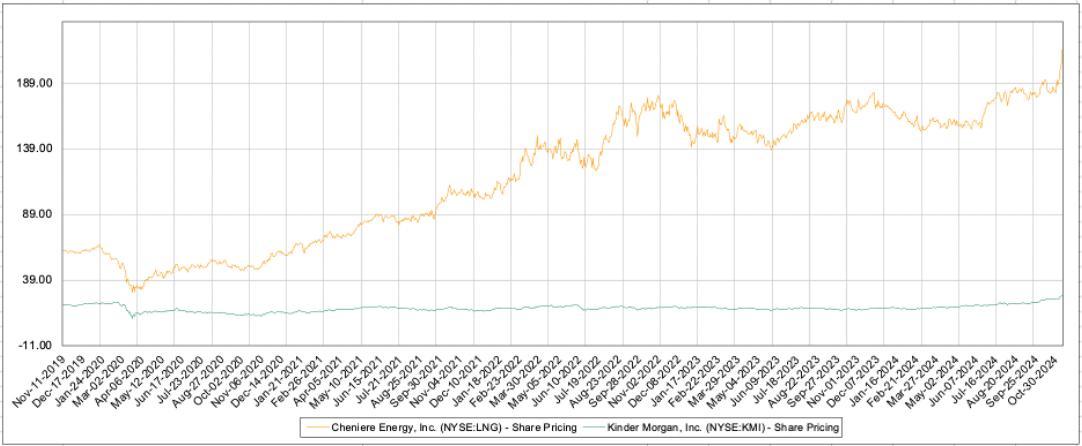
Andy
Rating: BUY
Current Price: $214.88
$248.00
Company Updates / News

● Earnings Per Share (EPS): 3.84
● 52 Week Range: 152.31 - 215.84
● Market Cap: $48.21B
● PE Ratio: 13.51
● Dividend Yield: 0.93%
● Corpus Christi, with 3 LNG Trains undergoing expansion, projected to be finished in 2025
Adjacent Market Statistics from Q3 2024

Revenue: $3.7B Market Cap: $60.0B

Revenue: $5.02B Market Cap: $63.7B

Revenue: $2.65B Market Cap: $69.36B
Cho | November 17, 2024 Sources:
Investment Thesis:
Since its uplisting on the New York Stock Exchange on December 31, 2011, Cheniere Energy (NYSE: LNG) has grown by 4,000%, establishing itself as the leading Liquefied Natural Gas (LNG) exporter in the United States
My buy recommendation is driven by three catalysts First, AI integration in production is projected to expand EBITDA margins by 3 2% from 2024 to 2028 through increased LNG yield and reduced quality control costs. Second, higher U.S. LNG production under Trump’s policies will lower domestic sourcing costs, while rising international demand will boost exports. As an exporter, Cheniere is poised to benefit, with these trends contributing an estimated 1.8% to EBITDA margin growth over the same period Lastly, with the Corpus Christi expansion completed in late 2025, declining capital expenditures will free up billions for share repurchases, reducing shares outstanding from 228 to 203 million by 2027
As of November 11, Cheniere Energy is trading at $214.88. Based on my analysis, I believe the stock is undervalued, and I estimate a target price of $248.00 within the next 12 months with a 15 41% upside I derived this target from a DCF analysis using 1) WACC of 7.83%; 2) expected revenue of $11.9 billion in 2024, with annual growth rate of 4 09% through 2028; 3) a 47% EBITDA Margin in 2024 that expands to 51% by 2028; 4) a decrease in total shares outstanding from 228 million to 205 million My assumptions are based on historical data and an optimistic outlook for Q3.
Liquefied Natural Gas (LNG) is natural gas cooled to -260°F (-162°C), reducing its volume by 600 times to facilitate storage and transportation, especially to areas without pipeline access Once delivered, it is regasified and fed into pipelines or power plants for distribution. LNG acts as a bridge fuel in energy grids, balancing real-time supply and demand by managing sudden electricity spikes and stabilizing the grid during peak periods Its reliability and scalability also make it essential for industrial settings with fluctuating energy needs. As a cleaner alternative to coal and petroleum, LNG supports the energy transition by providing a lower-carbon solution to meet demands while enabling the shift to renewable sources.
Cheniere Energy, a Houston-based liquefied natural gas (LNG) tolling and liquefaction provider (exporter), operates nine LNG export trains across its Sabine Pass facility in Louisiana and Corpus Christi facility in Texas As of 2023, the company’s total liquefaction capacity was approximately 45 million tonnes per annum (MTPA), with around 95% of its output secured under long-term, take-or-pay contracts The Corpus Christi facility is expanding to add 10 million tonnes per annum (MTPA) of capacity with anticipated completion in late 2025.
Andy Cho | November 17, 2024
This productive scale provides a significant competitive advantage over US competitors. The US LNG exports market is heavily regulated Under the Natural Gas Act (NGA), all LNG exporters must receive authorization from the Department of Energy (DOE), a process that typically takes 3 to 7 years This regulatory barrier has allowed Cheniere to operate in a relatively shielded market. In a market where new entrants cannot enter in the mid-term Cheniere dominates through its scale. The 45 mtpa production capacity outpaces competitors like Freeport LNG (15 mtpa) and Cameron LNG (12 mtpa) This significant capacity advantage enables Cheniere to meet global LNG demand more effectively.
The US LNG market is poised for growth, with several factors driving its expansion Favorable regulatory policies under President-elect Donald Trump are expected to boost U.S. LNG exports. Trump’s focus on reducing the trade deficit may pressure trade partners like the European Union and Taiwan countries with trade surpluses with the US to increase imports of U.S. LNG as a way to offset tariffs and maintain favorable trade relations. This geopolitical dynamic creates a supportive macroeconomic environment for U.S. LNG growth. Another key driver is China’s economic recovery, including 5 3% year-on-year growth in the first quarter and steady progress in the second quarter of 2024, China’s industrial expansion is expected to sustain its demand for LNG imports.
Domestically, rising US natural gas production ensures LNG sourcing costs remain low and stable Currently averaging $2 45 per MMBtu, these costs are projected to stay consistent over the next five years. Meanwhile, LNG prices in Asia are expected to increase from $11 75 to $12 25 per MMBtu during the same period This widening price differential significantly boosts the profitability of U.S. LNG exports. As the largest LNG exporter, Cheniere is well-positioned to leverage its scale and infrastructure to capitalize on this enduring trend.
LNG production is seasonally sensitive and labor-intensive, driving up maintenance costs due to the constant need for equipment monitoring and repairs. Additionally, there is a disconnect between the vast data generated equipment performance, environmental conditions, and process variables and LNG output efficiency
Cheniere can leverage AI to optimize this complex production processes, driving significant margin expansion. According to Bloomberg, AI could boost production yield by 1% per LNG train and reduce quality control costs by 50% With quality control at 4.5% of COGS as the industry standard, this equates to a 2.25% decrease in COGS, and combined with a 1% increase in LNG yield, results in a projected 3 2% EBITDA margin expansion from 2024 to 2028
With Corpus Chrisit expansion expected to completed by late 2025. Returns from this expansion should start flowing by early 2026, generating cash that Cheniere can reallocate from growth projects to share buybacks Consequently, outstanding shares will decline from 230 million to around 205 million by 2027
Andy Cho | November 17, 2024
Source: Capital IQ
Risk Potential
DOE pause on non-FTA exports: Cheniere’s ability to export to non-FTA (Non-Free Trade Agreement) countries requires approval from the US Department of Energy (DOE) Any pause or restriction on these approvals poses a significant risk, as a portion of Cheniere's revenue relies on sales to non-FTA countries.
Construction Risk: The expansion of the Corpus Christi project carries construction risks. Unexpected delays, cost overruns, or operational challenges could result in substantial financial losses, affecting both the project's profitability and timeline
Debt Schedule Risk: Cheniere is exposed to U.S. geopolitical risks, including the possibility of embargoes on U.S. LNG (liquefied natural gas) exports. Such restrictions could disrupt Cheniere’s international sales, potentially forcing the company to seek alternative markets or adjust its operations
Sources:
Kristian Suh | November 20, 2024
Rating: Buy
Current Price: $70.91
Price Target: $82.20
Company Updates / News
● Enphase Energy Launches the IQ PowerPack 1500 in the United States and Canada
● Enphase Energy Begins Shipments for IQ Battery 5Ps Produced in the United States
● Enphase Energy Unveils AI-Powered DIY Permitting Feature for Solargraf, Slashing Solar Permit Plan Creation Times by up to 95%
Competitor Statistics


Investment Thesis:
Enphase Energy is a leader in micro inverter technology, offering unparalleled efficiency and reliability in residential solar solutions Despite short-term challenges, the company is well-positioned to capitalize on long-term growth in renewable energy markets, supported by favorable policies like the Inflation Reduction Act and growing demand for integrated solar-plus-storage systems
My Buy recommendation reflects confidence in Enphase’s ability to rebound from recent headwinds. With a robust product pipeline, including the IQ9 Microinverter and AI-enhanced batteries, Enphase is positioned to benefit from a recovery in solar demand and increasing adoption of clean energy solutions globally
As of November 22, 2024, Enphase is trading at $70.91. I believe this equity is undervalued and expected to reach $82.20 within the next twelve months. I arrived at this conclusion through a comparable company analysis I used these assumptions based on historical data and an optimistic view given Enphase Energy’s position in the market
US Demand and Policy Tailwinds:
The US represents 64% of Enphase’s total revenue, driven by strong demand for solar-plus-storage solutions. While California’s NEM 3.0 initially posed headwinds, it has ultimately incentivized customers to adopt battery storage alongside solar systems, aligning perfectly with Enphase’s product offerings The Inflation Reduction Act plays a pivotal role in supporting Enphase’s growth. Its 30% tax credit and domestic manufacturing incentives enable Enphase to expand operations stateside while capturing premium pricing for U.S.-produced components. With normalized channel inventories, the U.S. market is expected to be a key driver of Enphase’s growth through 2025
While European sales saw a 15% quarterly decline in Q3 2024, Enphase is well-positioned for recovery in international markets The company’s IQ9 Microinverters and 4th-generation battery systems, set to launch in 2025, are designed to meet growing demand in markets like Germany and the Netherlands, where solar adoption continues to rise Enphase’s expansion into emerging regions, such as Asia and the Middle East, represents additional upside As global energy policies increasingly favor renewables, Enphase’s diversified product portfolio ensures it remains competitive across a variety of market conditions
Suh | November 20, 2024
Source: Yahoo Finance
Risk Potential
Interest Rate Risk: Elevated interest rates continue to weigh heavily on consumer financing for residential solar systems, a key market for Enphase. High borrowing costs discourage homeowners from adopting solar-plus-storage solutions, particularly in regions like the U.S. where solar installations are often financed through loans. Additionally, the Federal Reserve's commitment to maintaining higher rates for an extended period could delay a recovery in demand, further straining Enphase’s revenue growth in the near term.
Production Costs: As Enphase ramps up U.S.-based manufacturing to comply with IRA domestic content requirements, it faces significant operating expenses In 2024, the company reported total debt of $1.29 billion, with a debt/capitalization ratio of 56%, which remains high for a capital-intensive business Managing these costs while scaling production capacity will be critical to maintaining margins Enphase is also exposed to supply chain challenges, particularly in sourcing advanced components for its microinverters and batteries, which could further pressure operating performance if material costs rise
Sources: McKinsey & Company | CFRA Equity Research | Wall Street Journal | Yahoo Finance |Alpha Energy | Insight Trends | Bloomberg | Capital IQ | Financial Times
Erin Limb| December 4, 2024
Rating: Buy
Current Price: $254.20
Price Target: $272.50
Company Updates / News
● Market Cap: $80.24B
● Beta: 0.71
● EPS: 9.02
● PE Ratio: 28.46
● 52 Week High: $288.75
● 52 Week Low: $109.44
● Q3 2024 Results: GAAP EPS $3.82; Adjusted EPS $2.74
● 2024 Guidance Update: Adjusted EPS range raised to $8.00–$8.40
● Key Agreement: Signed 20-year PPA with Microsoft for Crane Clean Energy Center
Competitor Statistics from Q3 2024

EV/EBITDA: 16.1
Revenue: $26.25B
EV/EBITDA: 12.1
Revenue: $29.75B

EV/EBITDA: 11.6
Revenue: $22.92B

Constellation Energy Corporation (CEG) is a leading energy company specializing in clean, carbon-free power generation. The company operates a diverse fleet of nuclear, hydro, solar, and wind assets across the United States Constellation Energy serves residential, commercial, and industrial customers by providing electricity, energy management, and sustainability solutions It is committed to driving the transition to a clean energy future by leveraging its expertise and scale to reduce carbon emissions and innovate within the energy sector.
Despite facing challenges from regulatory pressures and volatile energy prices, Constellation has shown resilience through its focus on operational excellence and investment in emerging technologies. My hold recommendation reflects the belief that, while the company faces headwinds in the short term, it is well-positioned to capitalize on the growing demand for renewable energy and carbon-free solutions in the long term Additionally, upcoming projects and favorable market dynamics may enable Constellation to deliver stable performance in line with industry peers
As of December 4th, 2024, Constellation Energy Corporation (CEG) was trading at $254.20 per share. I believe this equity is fairly valued and will rise modestly to $272 50 within the current year My valuation is based on a Discounted Cash Flow Analysis using a terminal growth rate of 4 00% and a cost of equity of 8 75% over a 10-year period. These assumptions are grounded in Constellation's historical performance and a positive outlook on its potential to benefit from the growing demand for clean energy solutions.
Constellation Energy is the largest producer of carbon-free electricity in the United States, supported by its diverse portfolio of nuclear, hydro, wind, and solar assets. Its strong position in clean energy aligns with global and national decarbonization trends, creating long-term growth opportunities as demand for sustainable energy solutions accelerates.
The company’s ability to secure long-term power purchase agreements (PPAs), such as its recent 20-year deal with Microsoft, underscores its competitive edge and commitment to innovation. These agreements provide predictable revenue streams while supporting the growth of cutting-edge clean energy projects, like the Crane Clean Energy Center, further solidifying its market leadership
With newly elected President Donald Trump and other policymakers advocating for the continued operation of nuclear facilities as part of a balanced energy strategy, Constellation Energy stands to benefit from policies that support the maintenance and modernization of nuclear power plants. This could enhance the company’s ability to remain a key player in the clean energy transition while ensuring grid reliability
Erin Limb| December 4, 2024
NextEra
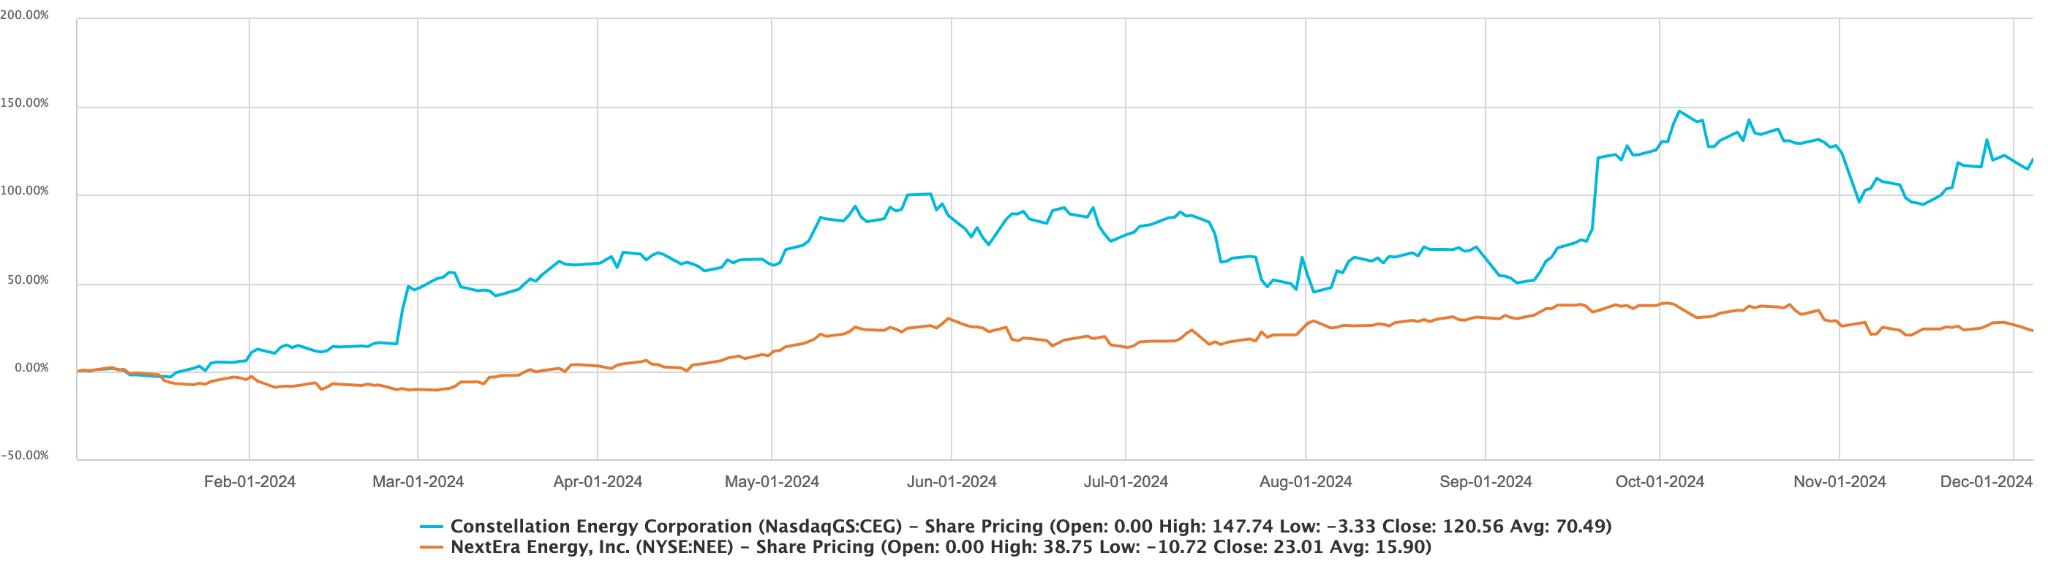
Source: S&P Capital IQ
Risk Potential
Constellation Energy’s operations are heavily influenced by government policies regarding energy production, environmental regulations, and carbon emissions. Changes in renewable energy incentives, nuclear regulations, or environmental policies could negatively impact the company’s profitability. For instance, reductions in subsidies or tax credits for renewable energy could delay or reduce returns on new projects. Additionally, any tightening of nuclear energy safety regulations or the implementation of carbon pricing mechanisms could raise operating costs or reduce the competitiveness of certain assets. Regulatory changes at the state level could also complicate operations, making it more difficult for Constellation to achieve its growth objectives
Energy prices are inherently volatile, and Constellation’s revenues depend on fluctuating electricity prices. Factors such as shifts in supply and demand, weather events, or geopolitical instability can lead to price fluctuations that directly affect profitability For example, a drop in the price of natural gas or mild weather conditions could reduce demand for Constellation’s carbon-free energy, especially in deregulated markets where energy prices are determined by supply-demand dynamics Such volatility can create uncertainty in revenue projections and impact margins, particularly if the company is unable to hedge against sudden price changes effectively
Constellation operates a broad array of energy assets, including nuclear, hydro, and renewable sources, all of which carry specific operational risks Nuclear plants, for example, face stringent safety and regulatory oversight, with any operational disruptions potentially leading to significant downtime and regulatory scrutiny Additionally, delays or technological issues in scaling up renewable energy projects could hinder growth prospects If advancements in renewable energy technologies or energy storage solutions outpace Constellation’s capabilities, it could result in higher operational costs or decreased competitiveness. These technological and operational challenges present a risk to the company’s ability to meet long-term growth objectives.
Sources: Yahoo Finance | Capital IQ
LedeandAbstract: Asthe3Qearningsseasonwrapsup, healthcareunderperformsthebroaderS&P500andRussell 2000indices,withbrightspotsinotherpharmaceuticalsbut aroughyearforbiotechnologystocks.
Earnings spotlight - battle of the trials: Abbvie shares tank after 2 phase 2 trials of experimental schizophrenia drug (Emraclidine) showed no significant improvement in symptoms.1 Schizophrenia impacts 1% of the US population. Bristol Myers Squibb manufactures a competing product called Cobenfy, which won FDA approval in September and significantly reduced symptoms during clinical trials The drug was developed after BMY acquired Karuna Therapeutics in 2023. Abbvie’s announcement caused a nearly symmetrical percent gain in the day price of BMY
2024 in Charts: Looking at Fig 1, over the past year, the Vanguard Healthcare ETF moved largely in line with the Russell 2000 until a relative deceleration in growth in September, slowing still post-election, a trend consistent with most other Healthcare ETFs Fig. 2 demonstrates that of the various healthcare subsectors, with solid outperformance of around 78% YTD for US Pharmaceuticals (Other), whereas the worst-performing sector was Biotechnology, down -2% YTD.2 Main constituents driving growth in the US Pharmaceuticals (Other) category include LifeVantage Corporation, FitLife Brands and Nature’s Sunshine Products, which mostly produce supplements health supplements. However, this large outperformance appears short-lived as most of it is coming from growth flipping positive from very negative in 2023 while profitability continues to decline. Although leading firms in the US Biotechnology subsector like Amgen and Vera Therapeutics modestly outperformed the market, long-tail industry players still suffered from regulatory uncertainty and a sustained high interest rate environment. However, we could soon see a bottom in biotechnology and opportunities to invest as rate cuts and attractive valuations boost the industry into 2025.
VictoriaGong
November28,2024
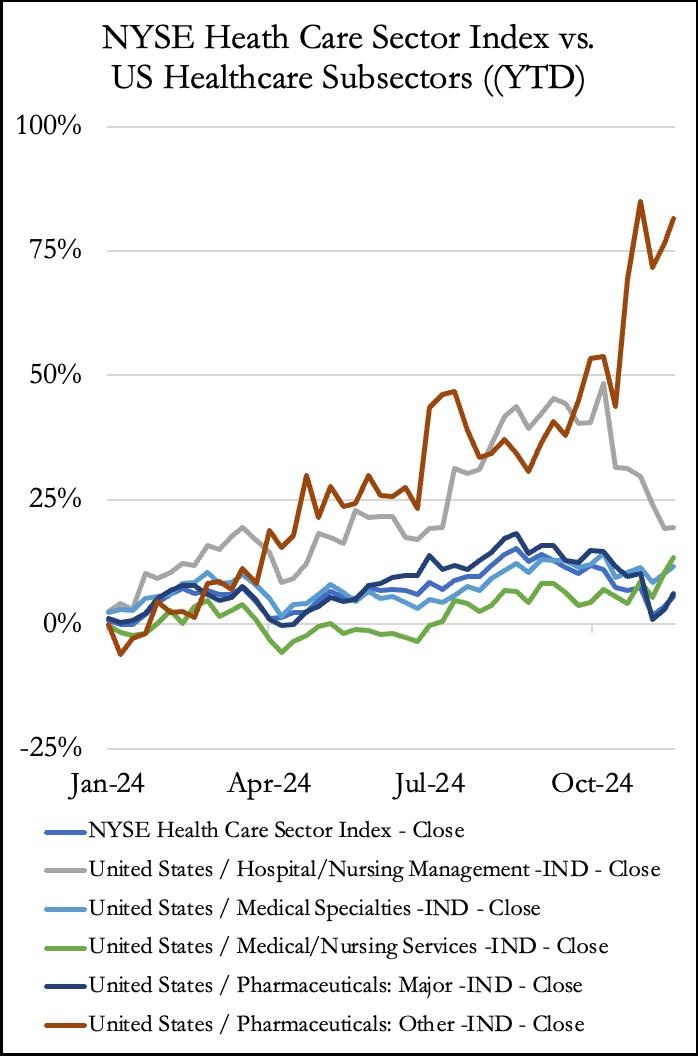
1 "AbbVieStockTumblesonFailedSchizophreniaDrugStudies BristolMyersJumps,"Barron's,November11,2024, https://www.barrons.com/articles/abbvie-stock-schizophrenia-therapy-eacb68ac.
2 FactSet,FactSetResearchSystems,accessedNovember28,2024,https://wwwfactsetcom/
3FactSet,FactSetResearchSystems
4FactSet,FactSetResearchSystems
Election update: As markets rallied over a Trump win, initial reactions appeared mixed between payors in the Affordable Care Act (ACA) vs Medicare Advantage marketplaces, which mellowed out over the month of November
4: Election impacts calm and US managed health care rises
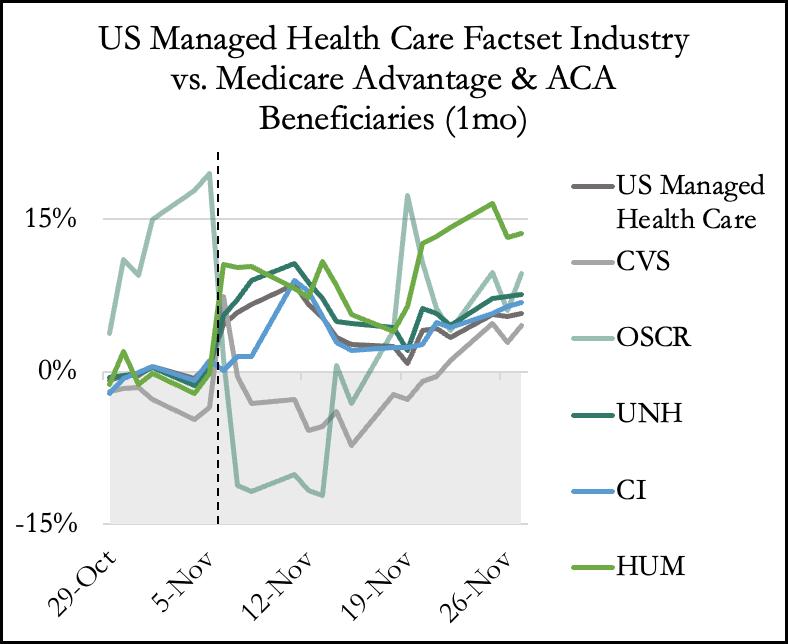
After November 5th, OSCR and CVS saw an immediate decline in share price, largely due to the Trump administration’s bearish outlook on renewing significant subsidies set to expire in 2025 associated with the ACA. Not only were the election results expected to have major impacts on ACA insurers themselves, but it discouraged Cigna from pursuing a merger with HUM. Additionally, insurers reliant on Medicare Advantage (CVS, UNH, HUM) were seen to have had an initial pop after elections that slowed throughout November. The convergence may have been catalyzed by the certainty over President-elect Trump’s choices of leaders of the HHS and CMS. The US managed health care industry finished 5.7% higher in November. As the fiscal year comes to a close, we look ahead to key catalysts and policies that would impact players in the healthcare industry.
Medicare Drug Price Negotiations Continue: February 1, 2025, is the deadline for CMS to publish the list of 15 drugs currently covered under Medicare Part D selected for price negotiation for 2027.5 This is a continuation of the drug pricing amendments of the Inflation Reduction Act of 2022, where the HHS under the Biden-Harris administration negotiated price ceilings that cut prices >50% for 10 branded drugs treating diabetes, heart failure, and other life-threatening conditions which will go into effect in 2026.6 Price negotiations will have major implications for pharmaceutical companies that have yet to experience strong pricing pressure from generic drugs due to lasting patents or market exclusion benefits.
ACA Open Enrollment Period: The 2025 ACA Open Enrollment session began on November 1 and will last until January 15. As of November 22, 2024, the Centers for Medicare & Medicaid Services (CMS) report 496,000 new enrollees as of November 22, 2024.7 As the number of ACA Marketplace enrollees receiving Advanced Premium Tax Credits (APTC) has nearly doubled since Former President Biden took office, with only ~8% of the 21.4mn enrollees unsubsidized. If the Trump Administration decides to take out subsidies it will make coverage unaffordable for those that are on the ACA marketplace and eliminate companies specializing in that market.
Conclusion: This year in healthcare has been fraught with policy changes but major developments in life-saving drugs. As the coming administration looks towards a more privatized and commercialized healthcare system, push-and-pull factors in the healthcare industry will continue to be at odds (price reductions, supply shortages, generic vs. branded drugs) and we look forward to observing increased M&A activity and next year’s clinical trials and catalysts.
5KFF,"FAQsAbouttheIn�ationReductionAct’sMedicareDrugPriceNegotiationProgram,"KFF,accessedNovember28,2024, https://wwwk�org/medicare/issue-brief/faqs-about-the-in�ation-reduction-acts-medicare-drug-price-negotiation-program/
6TheWhiteHouse,"FactSheet:Biden-HarrisAdministrationAnnouncesNewLowerPricesforFirstTenDrugsSelectedforMedicarePrice NegotiationtoLowerCostsforMillionsofAmericans,"TheWhiteHouse,August15,2024, https://www.whitehouse.gov/brie�ng-room/statements-releases/2024/08/15/fact-sheet-biden-harris-administration-announces-new-lower-pr ices-for-�rst-ten-drugs-selected-for-medicare-price-negotiation-to-lower-costs-for-millions-of-americans/
7CentersforMedicare&MedicaidServices(CMS),"Marketplace2025OpenEnrollmentPeriodReport:NationalSnapshot,"CMSgov, https://wwwcmsgov/newsroom/fact-sheets/marketplace-2025-open-enrollment-period-report-national-snapshot
Amy Ren| November 11, 2024
Rating: Hold
Current Price: $285.02
Price Target: $318.75
Company Updates / News
● Market Cap: $36.87B
● Beta: 0.39
● EPS: -2.61
● PE Ratio (TTM): -67.5
● 52 Week High: $304.39
● 52 Week Low: $141.98
● Achieved 34% year-over-year growth in global net revenue
● Revenue is $500.9, which is down 33% from 3Q 2023
● The healthcare market is experiencing rapid growth driven by technology, an aging population, and increasing prevalence of chronic diseases.
Competitor Statistics from Q3 2023

EV/EBITDA: 15.04
Revenue: $59.38B
Investment Thesis:

Alnylam Pharmaceuticals is a Cambridge-based biopharmaceutical company pioneering RNA interference (RNAi) therapies targeting genetically defined diseases. Its product lineup includes ONPATTRO, AMVUTTRA, GIVLAARI, OXLUMO, and LEQVIO, all designed to silence disease-causing genes through its proprietary RNAi platform Positioned in the ATTR-CM (transthyretin amyloidosis) market, valued over $30 billion globally, Alnylam stands to address a large unmet need, particularly as the availability of diagnostic tools like scintigraphy imaging improves patient identification
Despite promising phase III results and expectations for FDA approvals, Alnylam faces challenges Revenue in recent quarters has fallen short of forecasts, attributed to factors such as high competitive intensity and market adoption uncertainty. Additionally, the success of upcoming Medicare Part D readouts and further regulatory approval will be critical for continued growth Given these circumstances, my hold recommendation reflects the view that while Alnylam is well-positioned in an expanding market with substantial unmet needs, the company must navigate approval timelines and competitive threats to capture market share effectively.
I arrived at this valuation by performing a Discounted Cash Flow (DCF) analysis, using a terminal growth rate of 3.5% and a cost of equity of 10.2% over a 10-year forecast period. My assumptions are informed by Alnylam’s recent financial performance, strong pipeline potential, and favorable market conditions in the RNAi therapeutic sector. This valuation also factors in Alnylam’s position within the ATTR market and anticipates continued, though gradual, revenue growth as the company pursues regulatory approvals and market expansion
With advancements in diagnostics, including the increased use of non-invasive MRI and scintigraphy imaging, there is a surge in diagnosed cases of ATTR. Alnylam is well-positioned to serve a larger patient base as diagnostics improve, contributing to a faster uptake of its RNAi therapeutics Enhanced patient identification across healthcare networks will drive demand, especially for Alnylam’s drugs targeting cardiomyopathy and polyneuropathy caused by ATTR
EV/EBITD

Revenue: $60.58B

EV/Revenue: 122.04
Revenue: $19.65B
Alnylam is working on strategic collaborations that could expand its drug accessibility and reduce patient costs The anticipated Medicare Part D policy changes to cap out-of-pocket expenses for patients could be instrumental in promoting greater adoption of Alnylam's products, particularly in the elderly patient demographic These policy shifts, combined with Alnylam’s partnerships in expanding insurance coverage, are expected to support long-term revenue growth by improving affordability and accessibility
Amy Ren| November 11, 2024
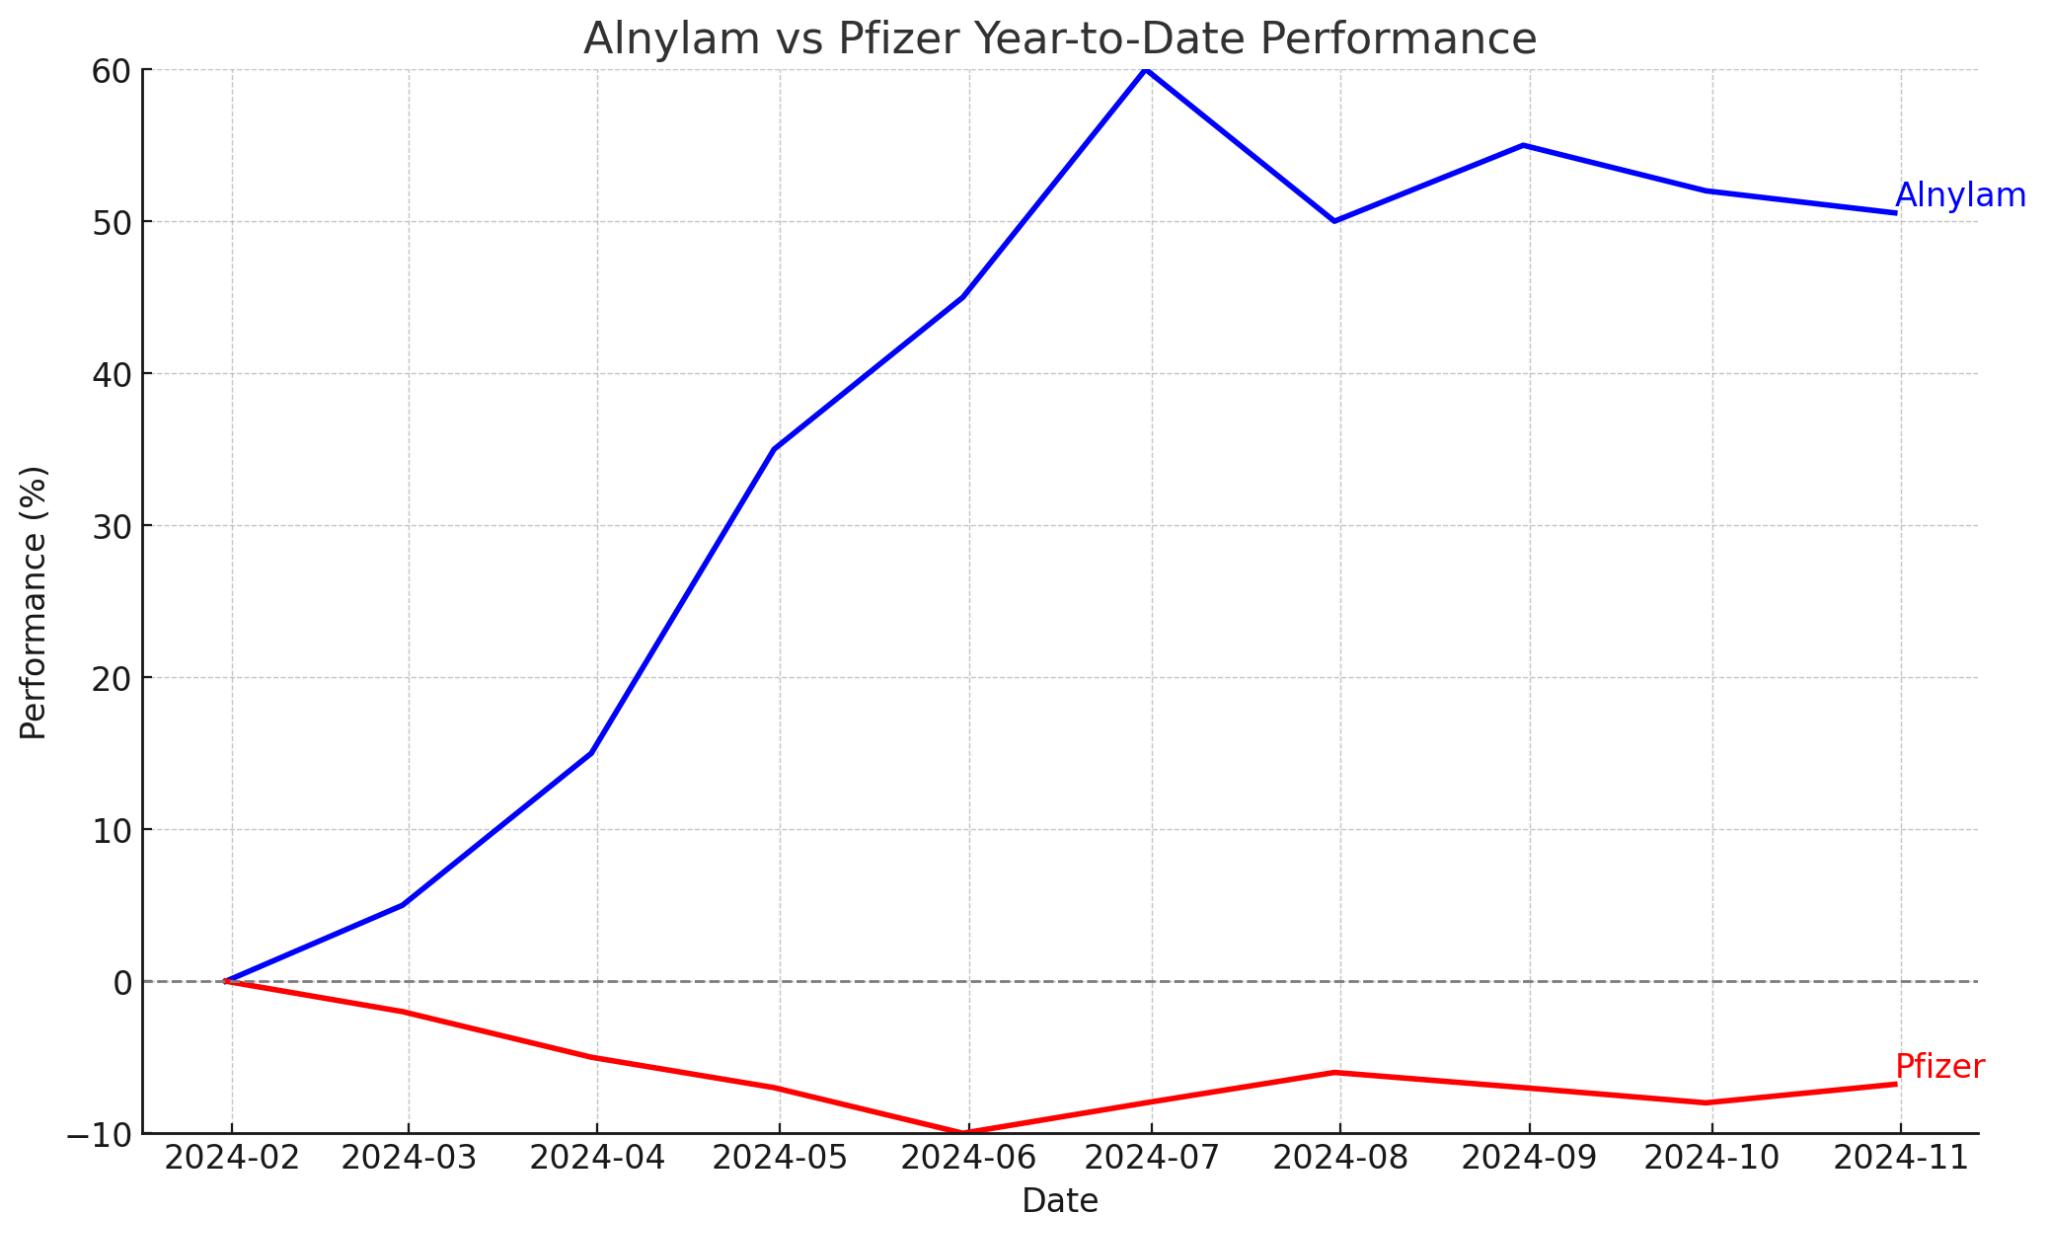
Source: Yahoo Finance
Risk Potential
Uncertain FDA Approval Timeline:
Alnylam’s growth strategy is closely tied to obtaining FDA approval for its key product, Amvuttra, in treating transthyretin amyloid cardiomyopathy (ATTR-CM). While the drug has shown positive phase III results, any unexpected regulatory hurdles—such as additional safety data requirements or an FDA Advisory Committee meeting—could delay approval timelines. This would push back revenue realization from the ATTR-CM segment and could negatively impact Alnylam’s market momentum and investor confidence.
Alnylam faces intense competition from major players like Pfizer, whose tafamidis is already FDA-approved for ATTR-CM, and BridgeBio’s acoramidis, which is advancing through clinical trials. Additionally, gene-editing therapies like Intellia’s NTLA-2001 are progressing, potentially offering a one-time treatment alternative. If these competitors succeed in differentiating their products or gain faster market traction, Alnylam may struggle to capture and retain market share, which could limit its revenue potential in the ATTR-CM space.
Alnylam’s therapies, particularly for rare diseases, carry high price tags that could restrict access if not adequately covered by insurance. The company relies on Medicare Part D readouts and insurance agreements to limit out-of-pocket costs for patients, especially those on fixed incomes. However, if Medicare and private insurers do not sufficiently cover these treatments or if out-of-pocket costs remain prohibitive, Alnylam may face slower-than-expected adoption rates, reducing its ability to penetrate and grow its target markets
Sources: Bloomberg| NY Times |Yahoo Finance | Investors.Anlylam.com | Capital IQ | Alphasights
Julian Dahl | November 17, 2024
Rating: BUY
Current Price: $1.46
Price Target: $3.58
Company Updates/News
● Market Capitalization: $208.19 M
● P/E Ratio: 677.78
● 52 week high: 21.09 (February, 2024)
● 52 week low: 0.26 (October, 2024)
● TVGN saw an increase of over 300% in late October after an announcement of a partnership with Microsoft
Statistics from Q3 2024
Revenue: $46.44 M

Revenue: $7.54 B

Revenue: $11.9 B

Tevogen Bio Holdings (TVGN) is an American company focused on clinical-stage immunotherapy and developing over-the-counter T-cell therapies to treat infectious diseases, cancers and neurological disorders. It was founded in 2020 in Warren, New Jersey. Its current CEO and founder is Ryan Saadi, a 2023 Nobel Peace Prize nominee whose primary vision is to provide accessible healthcare solutions to the broader population. While the company remains in early developmental stages, Tevogen’s acquisition of multiple patents in the T-cell therapeutics space, along with its development of promising proprietary technology makes the Nasdaq-listed company an exciting speculative investment. The stock initially went IPO at 9.93 dollars a share in 2022 but plummeted in early 2024 amidst rising competition in the T-cell therapeutics space.
Tevogen’s exciting proprietary developments and recent headlines about a partnership with Microsoft to integrate machine learning into preclinical processes distinguish the company as an emerging unicorn in the healthcare space My recommendation to buy comes from a DCF analysis utilizing company-issued projections for future earnings that exceed a billion dollars My investment thesis assumes that these projections have significant merit and my price target uses the company-issued projections as a baseline, which I have outlined in the valuation section. I would, however, classify TVGN as a highly speculative, growth stock with few indicative financials to lay out a trend for its growth, other than the issued projections. On the flip side, Tevogen’s 78% rate of common stock owned by company insiders highlights the internal confidence in the stock’s growth. Additionally, the stock has a 3.22% institutional ownership percentage with Portland Global Advisors and Polar Asset Management being among its largest investors.
As of November 17, Tevogen Bio Holdings (TVGN) shares are trading at $1.46 I believe that this equity is undervalued and expected to increase to $3.58 within the next twelve months I arrived at this conclusion by conducting a DCF analysis, utilizing values highlighted by company executives as targets for future growth The company announced specialty care and oncology therapeutic product lines which are each projected to bring in over 10 billion dollars in revenue over 5 years after their launch date However, since these figures seem overly optimistic, I used more conservative estimates of future revenue in my DCF analysis, estimating gradual growth to a billion dollars of revenue over 5 years and arrived at an EV of 1 66 Billion, using a tax rate of 21% Since there is high risk associated with the stock due to its reliance on the success of commercialization and product development, I also applied a 50% discount to my price target to account for the risk premium.
Julian Dahl | November 17, 2024
Source: NovaOneAdvisor
Market Outlook:
The chart shows the projected growth of the T-cell therapy market from 2023 to 2033, highlighting a robust CAGR. This growth reflects increasing demand for innovative immunotherapies, advancements in T-cell engineering technologies, and wider adoption of T-cell therapeutics across oncology and infectious diseases Tevogen's off-the-shelf therapies reduce the time and cost compared to autologous treatments (e.g., CAR-T) and, additionally, Tevogen is operating in a highly promising sector with strong expectations of growth in the T-cell therapy market. If Tevogen can successfully capture market share and commercialize therapies, the stock could experience significant upside, aligning with a market cap in the range of $2–$3 billion.
Investment Risks:
Since the success of Tevogen’s therapies depends on positive clinical trial results, a failed or delayed trial could severely impact investor confidence and the company’s overall valuation. Additionally, achieving FDA or EMA approval for its therapies is not guaranteed and plays a large part in the company’s success, despite Tevogen’s past successes in acquiring patents. And, since T-cell therapies are associated with severe side effects like cytokine release syndrome and neurotoxicity, their solutions could raise safety concerns that hinder approval and make it difficult for over-the-counter sales. Finally, as an investor, clinical-stage biotech companies, such as Tevogen, often have high cash burn rates with limited revenue, so Tevogen may need to raise capital frequently, leading to shareholder dilution.
Sources: Tevogen Bio Holdings | PitchBook| Google Finance | Yahoo Finance | NovaOneAdvisor | Capital IQ | FinancialTimes
Industrials in Q3 have shown resilience despite a challenging macroeconomic environment, driven by supply chain realignments, geopolitical tensions, and evolvingsustainabilityregulations.Keysubsectorslike aerospace, construction equipment, and logistics experienced mixed results as companies navigated in�ationary pressures, �uctuating demand, and ongoing labor shortages. Looking back on 2024, the industrialsectorremainspoisedforgradualrecoveryas companiescontinuetoadapttothesedisruptions,yet everything is subject to change at the discretion of newlyre-electedPresidentDonaldJ.Trump.
1. Geopolitical Dynamics
Continued tension in Eastern Europe and rising conflicts in the Indo-Pacific have called for increased defense spending globally. In the U.S., the defense budget climbed 7% YoY in Q3, a trend beneficial for the likes of Raytheon Technologies and Lockheed Martin. Similarly, geopolitical changes have aided the aerospace subsector, with backlogs for commercial aircraft from Boeing and Airbus at record levels as global air travel continues to recover. It still faces bottlenecks in critical materials, including titanium and semiconductors, that are holding production growth in check.
2. Investment in Infrastructure
But most U.S. construction equipment makers are still recording steady revenues powered by U.S. infrastructure projects under the Infrastructure Investment and Jobs Act, whereas, in China-a significant market-the slowdown brought its economic growth down. Moreover, elevated interest rates have curbed the progress in the private construction activities of North America, while the public infrastructures helped dissipate parts of the risk.
US Clean Energy Build Falls 17% in the Absence of Inflation Reduction Act’s Tax Credits (Source: Bloomberg NEF)
Global defense spending forecasted through 2028 (Source: DSM Forecasting International)
The global logistics sector continued to see disruption as companies looked to diversify supply chains amid geopolitical risks North America Nearshoring activity gained momentum, benefiting rail operators and trucking companies Union Pacific, for example, reported volume growth in Q3 on the back of intermodal freight growth related to Mexico's manufacturing expansion. Automation technologies remain a key focus, with companies such as Siemens and Honeywell investing heavily in smart factories and warehouse solutions.
As we have less than 50 days to go, the big question remains on everybody's mind, which area will President Donald J. Trump's new administration prioritize most when he reoccupies the oval office in January. Trump, himself, has noted that he is looking to minimize regulation wherever possible which would include the infamous Inflation Reduction Act (IRA) that currently subsidizes the energy transition to electric vehicles and renewable energy. Time will tell if technology can evolve but if not, it will be back to drill baby drill.
One of the biggest trends to continue affecting the industrial sector will be the reshoring and nearshoring of supply chains Policies that would incentivize domestic manufacturing, building on prior themes of economic nationalism, will likely be favored by the Trump administration. When combined with ongoing federal investments under the IIJA, these initiatives could lead to major opportunities for U.S.-based construction equipment, transportation, and logistics companies. However, the possible decrease in regulation under Trump may expedite infrastructure projects but also brings up challenges regarding ESG compliance. This dichotomy creates a double-edged sword for firms, which can harness the opportunities or fall prey to the risks involved, based on their adaptability to the regulatory environment.
With sustained labor shortages and wage inflation, industrial firms are turning increasingly to automation to improve productivity and decrease their reliance on human capital. Advanced robotics, AI, and smart manufacturing investments could further be boosted by the Trump administration's deregulatory stance On the flip side, this increase in automation will add to tensions with labor unions, which have been on the rise as of late Companies will need to navigate this delicate balance, as union-led strikes and labor disputes continue to mount throughout the industrial sector For example, there have already been signs of their strength from the Teamsters and UAW, labor unrest could be increased with any anti-union policies by Trump.
US production seasonally adjusted and indexed to 2012 (Sources: Washington Post & the Federal Reserve)
Emily-Jane Luo| November 11, 2024
Rating: Buy
Current Price: $127.32
Price Target: $166.33
Company Updates / News
● Earnings Per Share (EPS): 1.50
● 52 Week Range: 39.51 - 125.81
● Market Cap: 47.199B
● PE Ratio: 83.92
● Dividend Yield: 0.08%
● Vertiv’s Q3 earnings beat expectations
● Q3 quarterly organic growth came in at +19% showing ~5pts of sequential acceleration off 2Q24 organic growth of +14%
● Core organic growth was driven by EMEA (+25%) and Americas (+21%), due to continued strength in hyperscale and colocation markets
Competitor Statistics from Q3 2024

Revenue: $6.34B
Market Cap: $144.91B

Revenue: $9.09BB
Mark Cap: $143.19 b
Market Cap: $50.13B

Since Vertiv’s listing in the New York Stock Exchange on February 10, 2020, the stock has grown more than 1040%. The company is strategically positioned in the IT infrastructure market, which supports critical industries like data centers, communication networks, and industrial facilities. This sector is benefiting from growing demand due to trends in AI and cloud investments, making Vertiv a compelling stock to watch for future opportunities
My buy recommendation reflects a belief that Vertiv will continue to perform well, given the rising relevance of digital infrastructure and AI opportunities.
As of November 11th, Vertiv Holdings Co is trading at $127 32 I believe this equity is undervalued and will increase to $ 166.33 within this year. I arrived at this conclusion by conducting a DCF analysis with a 3% growth, cost of equity of 9 07%, and a WACC of 9 36% across 5 years My assumptions are based on historical data and an optimistic view given Vertiv’s successful Q3 earnings.
The AI boom and increasing digitalization are driving significant demand for data centers, which need advanced cooling and power solutions. As the largest provider of Power and Thermal Management and the second-largest in electrical equipment for data centers, Vertiv stands to benefit significantly with the advantage of scale. This leadership allows it to gradually increase prices. Last year, sales of Vertiv’s cooling products reached over $5 billion, representing a significant portion of its total revenue The market for data center cooling products alone is expected to reach $30 billion this year, with projected growth in the low double digits annually over the next eight years Data center capital expenditures reached $215 billion globally last year, with 25% directed toward infrastructure like electrical and thermal systems Vertiv's core areas
Management has set a conservative FY24 and medium-term framework, potentially leading to substantial upside to consensus earnings expectations Vertiv’s recent earnings report demonstrated strong financial growth, with a 13% increase in sales and nearly a 50% jump in earnings, both surpassing analyst forecasts. Profit margins are also improving, driven by higher product prices and increased sales volumes, which support robust operational performance. Given the conservative guidance, Vertiv has significant potential to exceed estimates in upcoming quarters as margins continue to expand
Emily-Jane Luo| November 11, 2024
Source: S&P Capital IQ
Risk Potential
Vertiv has a history of operational misexecution, with multiple earnings misses between 2019 and 2022 of double-digit percentages, causing a drop of over 30% in stock price at one point. Although recent quarters have shown improvement, any future operational lapses could harm investor confidence and negatively impact the stock, especially given high expectations for sustained growth.
The demand for data center capacity is booming, but supply limitations could hinder growth. There are numerous challenges in obtaining new permits and securing reliable power sources, especially for AI-driven data centers that are highly energy-intensive. Delays in permitting and power constraints could stall new projects, impacting Vertiv’s ability to capitalize on growing demand.
Companies with more than 10% of their revenue coming from China are particularly vulnerable to revenue volatility due to geopolitical and regulatory uncertainties. With approximately 14% of its sales generated in China, Vertiv faces heightened exposure to these risks, making the region a significant but potentially unstable market for the company. Tensions between the U.S. and China, including potential tariffs, trade restrictions, and regulatory shifts, could disrupt Vertiv's revenue stream from China.
Sources: IBISWorld| Barrons| Nasdaq| Yahoo Finance | Business Insider | Frost & Sullivan | Capital IQ | Zachs Investment Research | FactSet
May Ton| November 30, 2024
Rating: Buy
Current Price: $63.82
Price Target: $75.83
Company Updates / News
● Earnings Per Share (EPS): 1.97
● Market Cap: $41.18B
● PE Ratio: 8.85
● 52 Week Range: 36.34 – 66.25
● Fuel Price ($/gal): $2.2 – $2.4
● Delta expects December quarter pre-tax profit to grow 30% to $1.4B and an 11% –13% increase in the operating margin
● Delta Q3 recorded a nearly $3B of free cash flow generation YTD
● Delta Q3 revenue delivered $14.6B with adjusted TRASM being down 3.6% versus 2023

Since Delta’s listing in the New York Stock Exchange on May 03, 2007, the stock has grown more than 234%. Leading the most premium revenue and costs per seat mile in the North America industry, Delta has the largest frequent-flyer program of the network carriers, bringing in high-margin revenue. Post pandemic, the Airlines sector is gradually recovering to robust leisure and international travel demand. This creates an opportunity for Delta to deliver its services with its growing fleet and networks, earning a unit revenue premium to its peers.
My buy recommendation reflects a belief that Delta Air Lines will continue to perform well, given the rising demand for traveling in the 2024 Q4 and Delta’s strategic business operation.
As of November 30th, Delta Air Lines is trading at $63.82. I believe this equity is undervalued and will increase to $75.83 within this year. I arrived at this conclusion by conducting a comparable companies analysis with EV/EBITDA of 7.1x, D/E ratio of 1.05 and EV/Sales of 1.07x
Competitor Statistics from Q3 2024

Revenue: $13.6B Market Cap: $9.62B R $9.09BB
Cap: $19.41B
With a diversified revenue source, Delta witnessed September quarter revenue of $14.6B. The revenue source primarily led by premium and loyalty accounted for 57% of the total revenue with loyalty revenue increasing by 6% YoY Delta’s partnership with American Express bolsters its revenue diversification through loyalty programs, providing steady income streams that are less susceptible to operational cost fluctuations Thanks to the increasing international travel volume from Paris Olympics 2024 and Delta’s joint venture with LATAM to boost Latin flight demand, the cargo revenue grew by 27% YoY Additionally, Delta has expanded its fleets by adding 27 modern and fuel-efficient aircrafts including A321NEO, A330-900 and A350-900, boosting fleet efficiency and larger RASM to drive up the total annual revenue.
Delta has demonstrated strong return to the international travel business post-pandemic with revenues from these markets outpacing the domestic one. Through both Delta’s partnership with LATAM and Scandinavian Airlines Systems (SAS) and Saudia Airlines, Delta is provided with access to high-demand international routes, enhancing its market share in these lucrative regions. This strategic expansion positions Delta to capitalize on lucrative international markets, reinforcing its leadership in the global aviation industry.
May Ton| November 30, 2024
DAL vs AAL vs LUV Daily Share Price
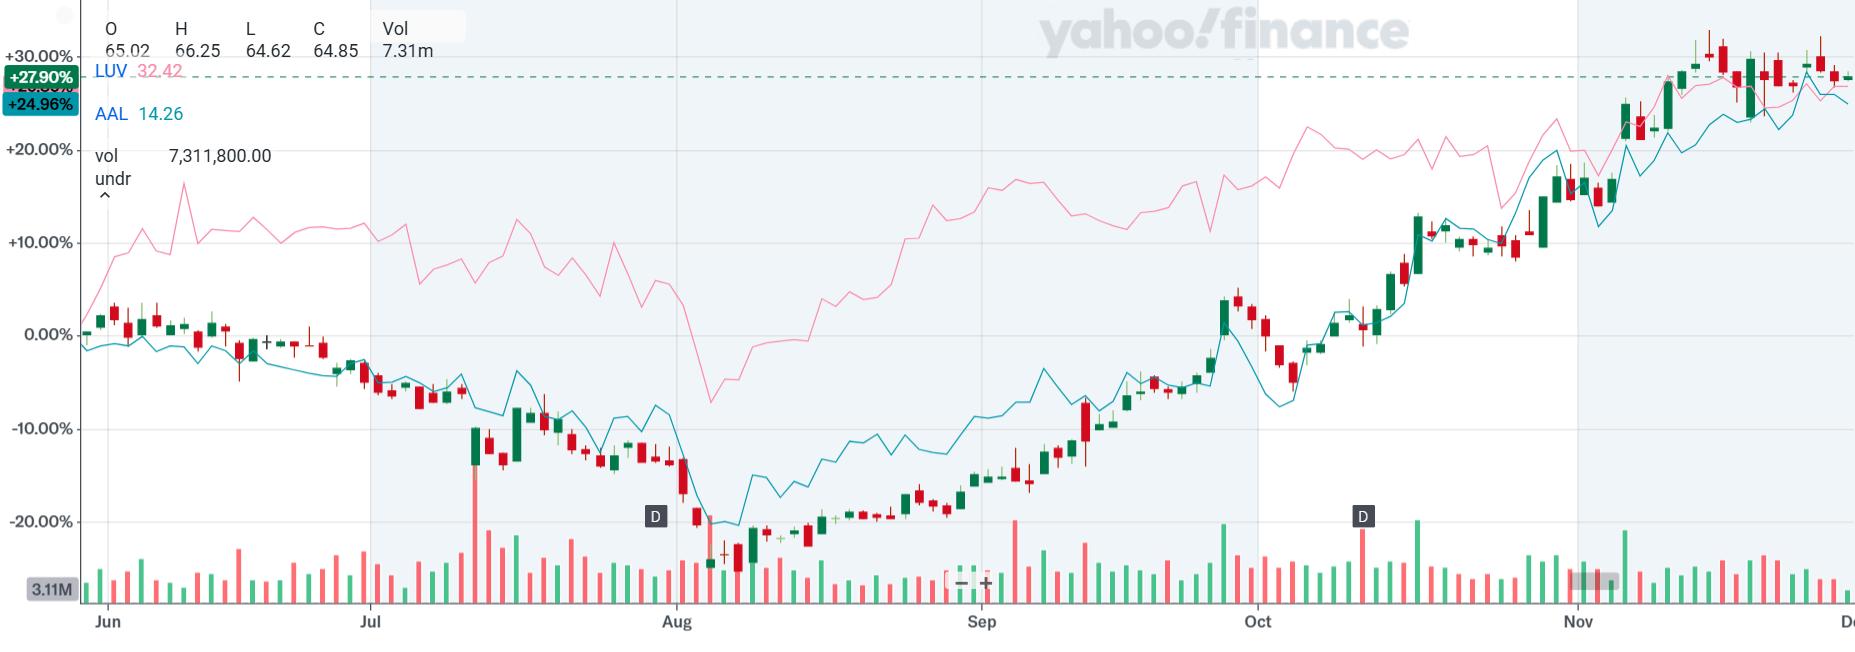
Source: Yahoo Finance
Risk Potential
The direct revenue impact of the CrowdStrike Outage incident to Delta was $380MM, driven by refunding and compensating customers by means of cash and SkyMiles. With over 7,000 flight cancellations, the expense creeped up to $170MM due to customer expense compensation. This indicated the sensitivity and vulnerability of the industry and Delta specifically to the shutdown of such nature, causing a drastic disruption to its operations and financial viability
The airlines industry is a highly price-competitive, capital-intensive and labor-intensive one, making it harder for airline to create more profit beyond its cost of capital while maintaining a premium service to the customers Despite Delta’s effort to boost its revenue from its diverse sources, its cost continued to pile up While the labor cost increased by 12.5% and the operating costs rose by 5.4%, Delta’s quarter operating revenue decreased by 12%.
Delta faces significant exposure to the fluctuations in the fuel prices, one of the most volatile cost factors in the Airlines business While the company commits to the fleet modernization strategy through constantly adding modern and fuel-efficient aircrafts, the unpredictability of global oil markets can impact profitability Historical trends show that elevated fuel costs, as seen during macroeconomic disruptions like the Russia-Ukraine conflict, have a direct and adverse effect on operating margins
Sources: Yahoo Finance | Delta Air Lines Investor Relations | Business Insider |Capital IQ | FactSet | Pitchbook
Ahana Shrestha| November 30, 2024
Rating: Buy
Current Price: $375.42
Price Target: $391.27
News
● Earnings Per Share (EPS): 2.53
● 52 Week Range: $224.61 –$379.99
● Market Cap: $148.3B
● PE Ratio: 39.94
● Dividend Yield: 1.0%
● Eaton’s Q3 earnings exceeded $175B on 49 projects, up 48% over Q2
● Q3 organic sales were up 8% year-over-year, with operating profit up 11%
● Sales were bolstered by the increasing demand for cloud computing capacities at data centers, up 14% from 2023
Competitor Statistics from Q3 2024

Revenue: $32.2B Market Cap: $104.9B

Revenue: $17.5B Market Cap: $75.9B

Eaton is a global power management company that provides electrical, hydraulic, and mechanical power solutions across multiple industries With products across data center, utility, industrial, commercial, machine building, residential, aerospace, and mobility markets, Eaton is well-positioned to capitalize on the megatrends of electrification, clean energy transition, digitalization, and the AI-fueled expansion of data centers.
My buy recommendation reflects a belief that Eaton will continue to perform well, given the ongoing technological transformations and infrastructure investments.
As of November 29th, Eaton Corporation is trading at $375.42. I believe this equity is undervalued and will increase to $391 27 within this year I arrived at this conclusion by conducting a comparable companies analysis with an EV/EBITDA of 27.4x, an EV/Revenue ratio of 6.4x, and an EV/Sales ratio of 6.36x.
Eaton Corporation is strategically positioning itself at the forefront of the data center revolution, particularly in the rapidly expanding AI and edge computing markets Through targeted investments like its acquisition of NordicEPOD in Europe, the company has enhanced its ability to supply critical power products and services to a broader client base They also launched a modular data center product line specifically designed for edge computing and AI applications. With public sector spending in this sector set for significant growth, Eaton's modular data center solution enables operators to deploy new data centers in days rather than months, dramatically reducing traditional time and cost barriers. The company estimates a 17% sales increase from data centers and distributed IT by next year, reflecting the massive potential in this market segment driven by AI's increasing computational demands.
Eaton Corporation is capitalizing on global electrification and renewable energy growth with innovations like the xStorage system for commercial decarbonization and its collaboration with Tesla to launch the AbleEdge suite This solution streamlines solar and energy storage installations, enabling intelligent load management and offering cost savings to customers Moreover, the rising adoption of solar panels, EVs, and heat pumps, coupled with stricter energy efficiency regulations, is fueling demand in residential markets. With renewable energy capacity projected to grow 740 GW annually through 2035 and global power demand expected to increase by 30%, Eaton is strategically positioned to lead the clean energy transformation.
Ahana Shrestha| November 30, 2024
Source: S&P Capital IQ
Potential
Eaton’s global end markets, including manufacturing, construction, aerospace, and transportation, are subject to cyclical fluctuations Economic downturns, such as a pullback in customer capital expenditures due to higher interest rates, can reduce demand for Eaton’s products. While the company’s broad geographic and product diversification offers some protection, these market cycles can still impact profitability and growth
Eaton operates in highly competitive markets that demand continuous innovation and technological adaptation. The company faces potential risks from emerging competitors, rapid technological changes, and the need for sustained investment in research and development Erosion of pricing power, increased competitive pressures, and the potential obsolescence of existing product lines could challenge Eaton's market position, particularly in rapidly evolving sectors like electrical infrastructure, renewable energy, and industrial automation
Eaton faces significant challenges from global supply chain complexities and geopolitical tensions. Despite its robust diversification strategy, the company remains exposed to material availability constraints, delivery delays, and potential disruptions from international trade uncertainties This creates unpredictability in sourcing critical components, potentially affecting the company's operational efficiency, cost structure, and ability to meet customer demand in key markets.
Sources: Eaton Corporation Investor Relations| Yahoo Finance | Business Insider | IBIS World | Capital IQ
Abstract: Financials in Q3 has experienced a drasticshift awayfromthepreviouslyexistingparadigminthewakeof changingpricepressures Investorswerecautioustodeploy signi�cantcapitalinthesummergivenhighratesandagreat deal of market uncertainty leading to a high level of dry powderaccumulation.HowevertheFedabatedandcutrates by 50 basis points driving an explosion inmarketactivity. MuchofthegrowthbetweentheratecutandtheNovember electionwasmutedasinvestorswaitedforfuturepoliciesto bemoreclear.
Following a year or more of AI speculation and a market dominated by a few names in technology, investors are looking towards more traditional value oriented names This shift away from AI speculation coupled with a low funds rate environment and strong investor appetite may manifest in increased investment in Exchange Traded Funds (ETFs). Active fund managers (AM) have seen significant outflows to ETFs and other more passive strategies for various tax and flexibility reasons over the past few months.
Over the past few months investment management and wealth management firms have consolidated through M&A activity with 576 deals in the space this year. This consolidation has been driven by the pursuit of scale and the competitive advantages of a large internal infrastructure. Per Cerulli the top 5 wealth managers control 57% of the AUM of broker dealers in the space. The Trump cabinet is likely to further accelerate this, as more laissez faire leadership at the FTC will lead to more M&A activity broadly and a more lax attitude towards consolidation.
The broad performance of the financials sector is up YTD although the sector is very interest rate dependent and heavily impacted by shifts in the macroeconomic outlook. In 2025 investors are looking to policy shifts and to drive significant movement in the sector. Given the poor performance of many alternative vehicles over the past few months, investors are looking to a less capital scarce environment to drive returns and provide liquidity
Recent Dry Powder and Capital Accumulation
Source: CTVC
ETFs vs. AM Preference
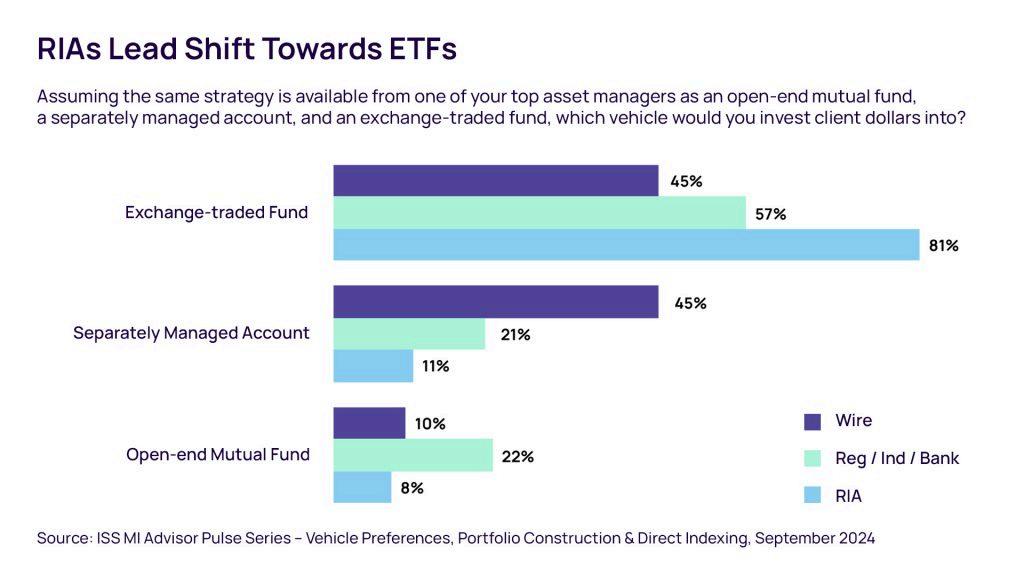
Source: Markets Media
Financials Sector Returns YTD
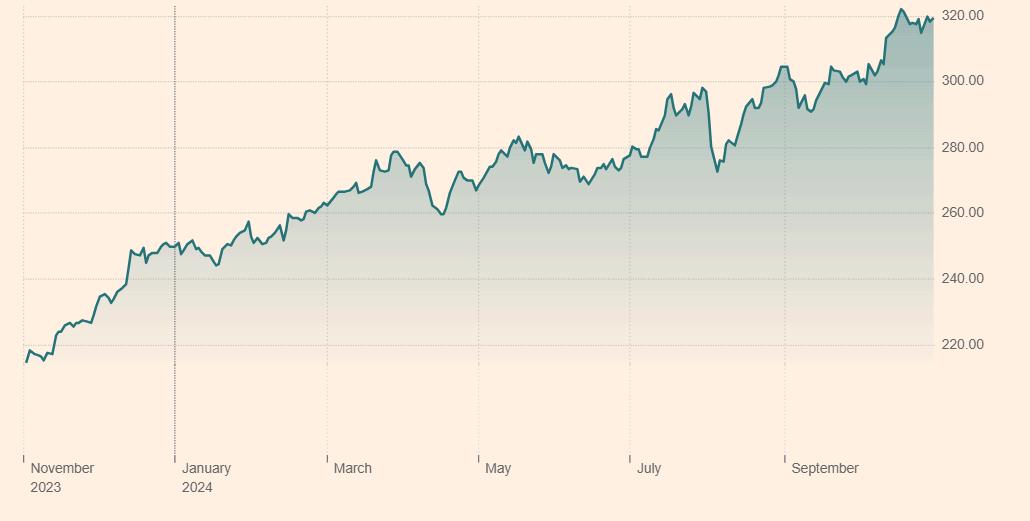
Source: US Financials Total Return ETF
Eric Chen|November 29, 2024
Rating: Hold
Current Price: $266.04
Price Target: $268.38
● Market Cap: $58.65B
● Beta: 0.63
● EPS: 18.94
● PE Ratio: 13.27
● 52 Week High: $167.08
● 52 Week Low: $269.56
● Travelers’ Q3 earnings beat expectations
● Core income reached $1.2 billion ($5.24 per share), a 46% surprise over the consensus estimate of $3.59
Statistics from Q3 2024
Price/Book: 8.0x

EV/EBITDA: 9.4x
Revenue: $26.1B
Sources:

Travelers ranks as a leading company in the property and casualty insurance market, ranking 6th with $38.6 billion in direct premiums written and a total market share of 4 02% as of 2023 The company has faced ongoing challenges due to the increasing frequency of severe storms and rising claims cost as well as inflation and elevated reinsurance costs. However, Travelers has benefited from its strong investment gains in 2023 Furthermore, the company has focused on effective risk management strategies, which includes improved catastrophe modeling and its enterprise risk management (ERM) initiatives Travelers has depicted strong long-term financial performance despite market challenges due to its effective underwriting and risk management strategies. In addition, with ongoing pressures from natural catastrophes and inflation, the company's investment yield and net income remain strong My hold recommendation reflects the belief that, though Travelers maintains a sound risk mitigation strategy, macroeconomic pressures and rising reinsurance costs may limit growth potential in the short-term
As of November 29th , 2024, Travelers closed at $266 04 per share Using a comparable company analysis, I calculated the mean values of three financial multiples for a peer set of 10 companies. The three multiples I implemented were Price to Book (P/B), Price to Earnings (P/E), and EV/EBITDA The ticker symbols for the 10 companies are as follows: HIG, CB, PGR, CINF, ALL, ACGL, AFG, CNA, AIG, and TRV I computed the implied share price for each multiple and assigned a percent by weight to each multiple I designated 55% to P/B, 30% to EV/EBITDA, and 15% to P/E. Finally, I determined the weighted average of the three multiples to derive an implied share price of $268 38
Travelers' personal lines division has demonstrated improvement in its core metrics, particularly in auto insurance, where profitability surged as a product of pricing adjustments and reduced loss costs in physical damage coverages. The auto segment’s combined ratio reached 93 2% in Q3 2024, a 7 8% improvement from the previous year. This improvement reflects the company’s adjustments in high-risk geographies, such as increased deductibles and tightened eligibility criteria, aimed at balancing profitability and mitigating volatility in catastrophe-exposed areas Strong retention rates in auto further support the recovery and profitability across Travelers' personal lines portfolio
The recent acquisition of Corvus, a leading cyber-insurance underwriter, in January 2024 has expanded Travelers' Bond & Specialty segment, bringing notable growth in cyber insurance capabilities as well as maintaining strong retention in management liability lines This acquisition has strengthened Travelers’ market positioning and boosted new business generation by over 80%
Eric Chen|November 29, 2024
Travelers Companies (TRV) vs Progressive Corporation (PGR) Monthly Share Price (YTD)
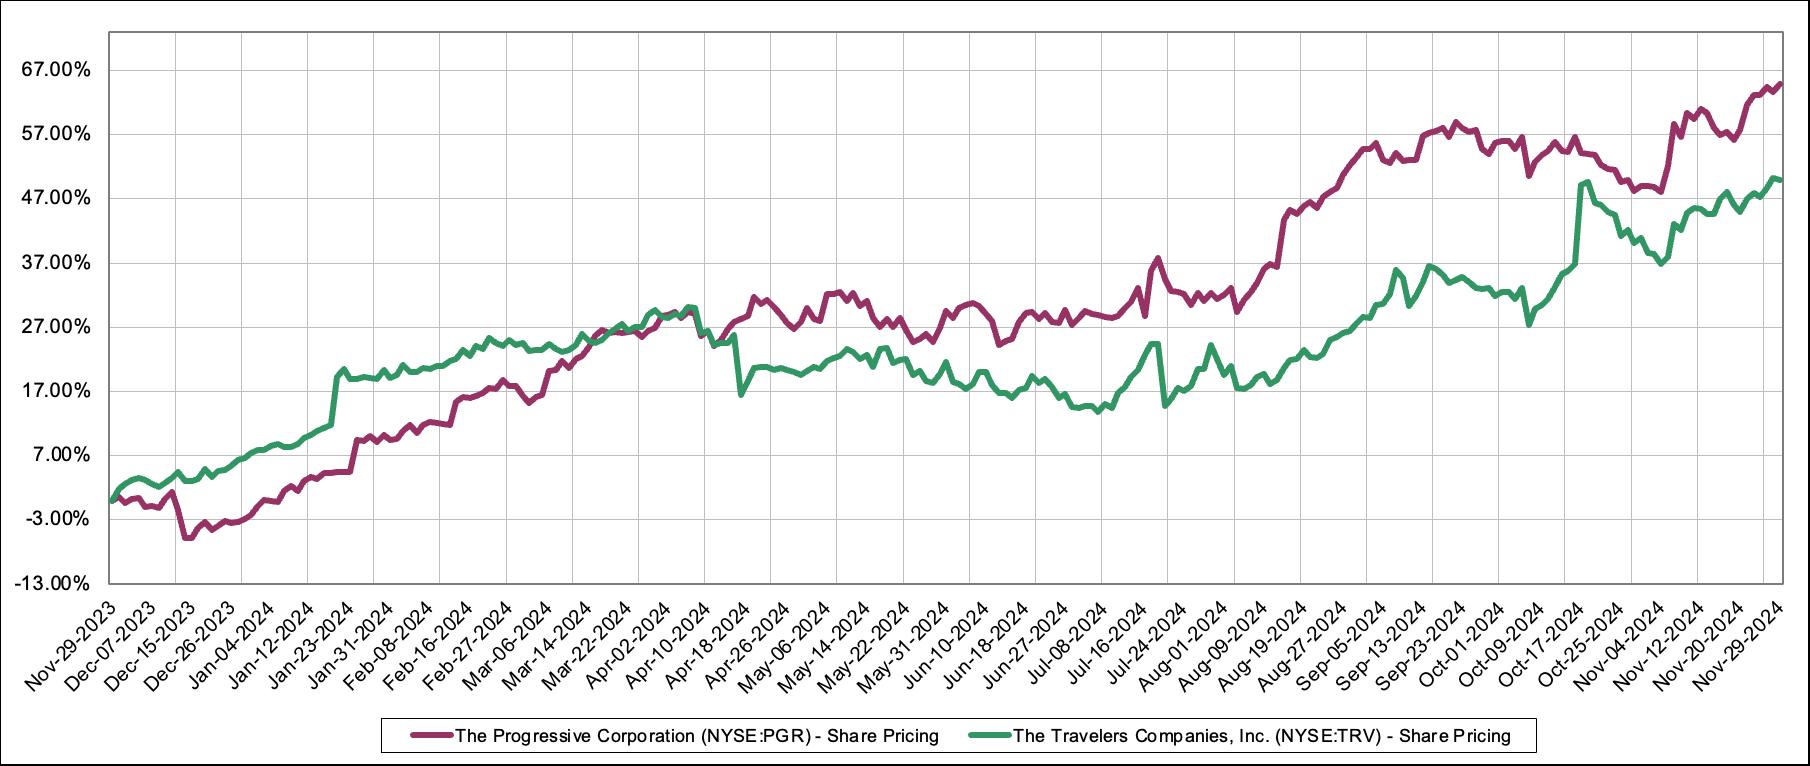
Source: S&P Capital IQ
Risk Potential
Travelers remains significantly exposed to losses from natural catastrophes, especially with recent hurricanes contributing to its highest-ever year-to-date catastrophe loss in Q3 2024 Frequent severe weather events introduce heightened volatility into Travelers' financial performance, underscoring the need for advanced risk modeling and selective underwriting in high-risk regions While efforts to raise deductibles and limit coverage in catastrophe-prone areas are underway, the sustained volatility from climate-related events could further strain reinsurance costs and pressure underwriting profitability As a property and casualty insurance provider, an increase in reinsurance costs would make it difficult for Travelers to transfer its risk through reinsurance contracts in disaster-prone regions, forcing the company to retain more risk
With its expanded cyber insurance offerings, particularly through the Corvus acquisition, Travelers is navigating an increasingly complex cyber risk landscape Rising cybersecurity incidents amplify the challenge of pricing and underwriting policies accurately in this fast-evolving sector While robust data analytics and underwriting capabilities are advantageous in Travelers’ cyber strategy, the rise in claim severity and the competitive nature of the cyber insurance market remain key areas of risk that could impact Travelers’ margins in this segment
Travelers' profitability is impacted by regulatory environments in high-risk states that limit pricing flexibility and inhibit timely premium adjustments to match rising claims costs. Restrictions on rate increases in catastrophe-prone regions may prevent Travelers from fully offsetting rising operational expenses, affecting margin stability Additionally, increasing regulatory requirements surrounding data protection, particularly within the cyber segment, introduce compliance risks that may elevate administrative costs and operational complexity
Sources: investor.travelers.com | naic.org | Bloomberg | CapIQ | Yahoo Finance
Konrad Hartung| November 14, 2024
Rating: Buy
Current Price: $61.91
Price Target: $74.19
● Market Cap: $153.23B (₹12,937 58 B)
● USD/INR: 84.43
● Beta: 0.83
● EPS: $3.16 (₹266 79)
● PE Ratio: 19.59
● NIM: 3.83%
● NPL: 1.29%
● 52 Week High: $67.44
● 52 Week Low: $52.16
● NIM falls after the merger with HDFC Ltd
● 10% increase y/y NII
● Share of NPL increases by 0.03%, showing deteriorating asset quality
Competitor Statistics from 2024 Q3

NPL: 2.28%
NIM: 4.15%

NPL: 2.40%
NIM: 3.03%

NPL: 3.12%
NIM: 3.13%
HDFC Bank is the largest private bank in India, the 3rd largest company on the Indian stock market by market capitalization, and makes up over 12% of Nifty50, India’s largest index fund HDFC Bank recently merged with HDFC Ltd, India’s biggest mortgage lender. HDFC Bank and its subsidiaries cover the whole market in terms of financial services ranging from banking, insurance, and loans to corporate finance and financial advisory
My buy recommendation reflects the unique position of HDFC Bank in taking advantage of India’s fast-growing economy and financial sector HDFC Bank has also seen an average of 22% y/y growth in profit and 17% y/y growth in EPS. While many Indian banks have considerable volatility or weakness in their growth, HDFC Bank has consistently been a top performer in Indian Finance These solidify the argument that HDFC Bank is the premier Indian Bank.
As of November 14th , 2024, HDFC Bank Ltd was trading at $61 91 per share on the NYSE I believe that this equity is undervalued and will increase to $74.19. I built a Discounted Dividend Model with a terminal growth rate of 15%, a moderate estimate, as HDFCB’s y/y growth of EPS averaged 17% I calculated a cost of equity of 9.04% across 10 years using the CAPM model using India’s 10-year treasury yield of 6.92% as the value for risk-free return and 9.48% as the stock market's average rate of return I arrived at my terminal value by considering the growth of EPS and that the current P/E value of 19.84 will decrease to about 17 over the next five years due to growing earnings and P/E coming closer to the industry average
The merger of HDFC Bank and Housing Development Finance Corporation Ltd enables HDFC Bank to cross-sell its products to its broad customer base. A majority of HDFC Ltd's customers do not yet have an account with HDFC Bank It will, however, take at least a year for the Synergies to take effect and for the upsides of cross-selling to consumers to show. The merged entity will also be able to have a lower cost of funding due to the high volume of CASA. The merger also resulted in an increase in mortgages as a percentage of total loans As mortgages are subsidized by the government through decreased risk weight, there is a decrease in aggregate capital costs through a lower Capital Adequacy Ratio. Another impact of the increased weight of mortgages is a lower NIM, which is weighed out through the decreased capital buffers. For investors, the merger was immediately EPS accretive, with stable EPS growth of 9 4% post-merger
Diversification has always been a big priority for HDFC Bank and has been the reason why HDFC Bank has seen such steady growth in the past. The integration of HDFC Ltd will further prepare HDFC Bank for future stability
HDFCB’s LDR has peaked post-merger from moving levels of around 86% to 110%.
Srinivasan Vaidyanathan, HDFCB’s CFO, has said it will take the bank 2-3 years to return to levels in the high 80s, focussing on stable growth
An immediate effect of the merger is the regulatory restraints of being a bank. HDFC Ltd did not have restrictions on its CRR and SLR Because of HDFCB’s regulations, more funds will have to be kept as reserves, decreasing profitability
Konrad Hartung| November 14, 2024
Source: S&P Capital IQ Pro
HDFCB’s stock is listed as an ADR on the NYSE through JP Morgan with a ratio of 3:1, meaning that each ADS on the NYSE is equal to three shares on the NSE. Through the ADR, American citizens have a simple way to hold stock in a foreign company ADRs bought on the NYSE can be converted into stocks on the NSE All dividends work in the same way as other US securities. Due to its listing of Level 3 ADRs, HDFC Bank has to file 20-F and 6-K statements regularly.
India’s financial services industry is experiencing strong growth from the increase in India’s wealth, with the number of HNWIs forecast to triple by 2030 and many Indian cities economies on track to be comparable in size to middle-income countries. The rapid digitalization in the whole country and an increase in digital financial offerings make this industry more accessible to India’s more rural population The introduction of the digital ID “Aadhaar”, gave rise to easy digital banking and simplified transactions. India’s high savings rate of around 30% contributes to the high potential of the Financial Services Industry in India
As HDFC Bank Ltd conducts almost all of its business in India, its value is very reliant on the relative value of the Rupee in USD While predictions before the election projected a stable course, the uncertainty connected to the future actions of President Trump makes this risk an essential consideration Recent shifts and the possibility of higher USD interest rates set by the Federal Reserve have significantly strengthened the dollar. As Trump’s economic agenda plans for incentives and tariffs, this could set inflation off to a new start, creating a need for said high rates A strong dollar would burden American investors in HDFC Bank, as it would now virtually lose value due to the change in the dollar's value. A possible solution would be hedging against those risks with Currency forward contracts or similar hedging methods. These would infer a cost, though, decreasing the potential upsides of investing in HDFC Bank
Sources:
HDFC Bank Ltd | Yahoo Finance | premium capitalmind in | fred stlouisfed org | Capital IQ | ceicdata | The Economist | Reuters | IMF
Rating: Buy
Current Price: $171.90
Price Target: $211.65
● P/E: 9.76
● Equity Value: $458.16M
● EPS: $17.62
● 52 Week Low: $135.44
● 52 Week High: $173.98
Competitor Statistics from Q3 2024

Diamond Hill Investment Group (DHIL) continues to stand out in the competitive landscape of active investment strategies, particularly in volatile markets Despite the growth of passive strategies, DHIL’s proven ability to deliver consistent returns through disciplined, value-driven active management sets it apart. The company’s long-term approach–focused on identifying undervalued assets–positions it well to capitalize on opportunities that passive strategies may overlook. This makes it an attractive choice for investors looking for more than just market exposure DHIL’s strategy emphasizes deep fundamental research and high-conviction investing, often maintaining a concentrated portfolio of 30-50 holdings Their focus on high-quality businesses trading below intrinsic value helps mitigate downside risk while maximizing returns, with past successes in sectors like industrials and financials underscoring their ability to exploit market inefficiencies out for its emphasis on deep, fundamental research, combined with a commitment to high-conviction investing.
As of November 29th, Diamond Hill Investment Group (DHIL) is trading at $171.90. I believe this equity is undervalued and expected to increase to $211.65 over the next five years. Key inputs for this conclusion include:
● Risk-Free Rate (4.2%): Based on the 10-year U.S. Treasury yield
● Beta (1.1): Reflects DHIL’s moderate sensitivity to market volatility
● WACC (9%): Calculated using CAPM for cost of equity and DHIL’s low debt levels for cost of debt
● Tax Rate (21%): Aligns with U.S federal corporate tax rate
R $18.686B

AUM: $10.4T
Revenue: $6.93B
AUM: $9.3T

Revenue: $25.2B
AUM: $4.5T
● Operating Margin (10%): Consistent with historical performance
● Revenue Growth (4%): Reflects conservative estimates aligned with industry trends
Diamond Hill Investment Group has seen steady growth in total assets, reflecting a disciplined and strategic approach to portfolio management. As of September 30, 2024, DHIL reported total assets of $240.81M, with total liabilities of $74.32M, providing healthy working capital. Its enterprise value has increased from $372.69M in Q1 2024 to $430.84M in Q3 2024, underscoring its ability to create value. The company’s track record of prudent decision-making and consistent performance has built investor confidence.
In the current environment of decreasing interest rates, DHIL stands to benefit from lower borrowing costs and potentially higher asset values, particularly in equity markets, where DHIL specializes. As fixed-income investments become less attractive, more investors may turn to equities,
aligning with DHIL’s growth-focused strategy Additionally, lower rates can reduce debt costs for companies, improving profitability and supporting DHIL’s active management approach. This environment could give DHIL an edge over competitors more exposed to fixed-income markets
Historic Market Price for DHIL:
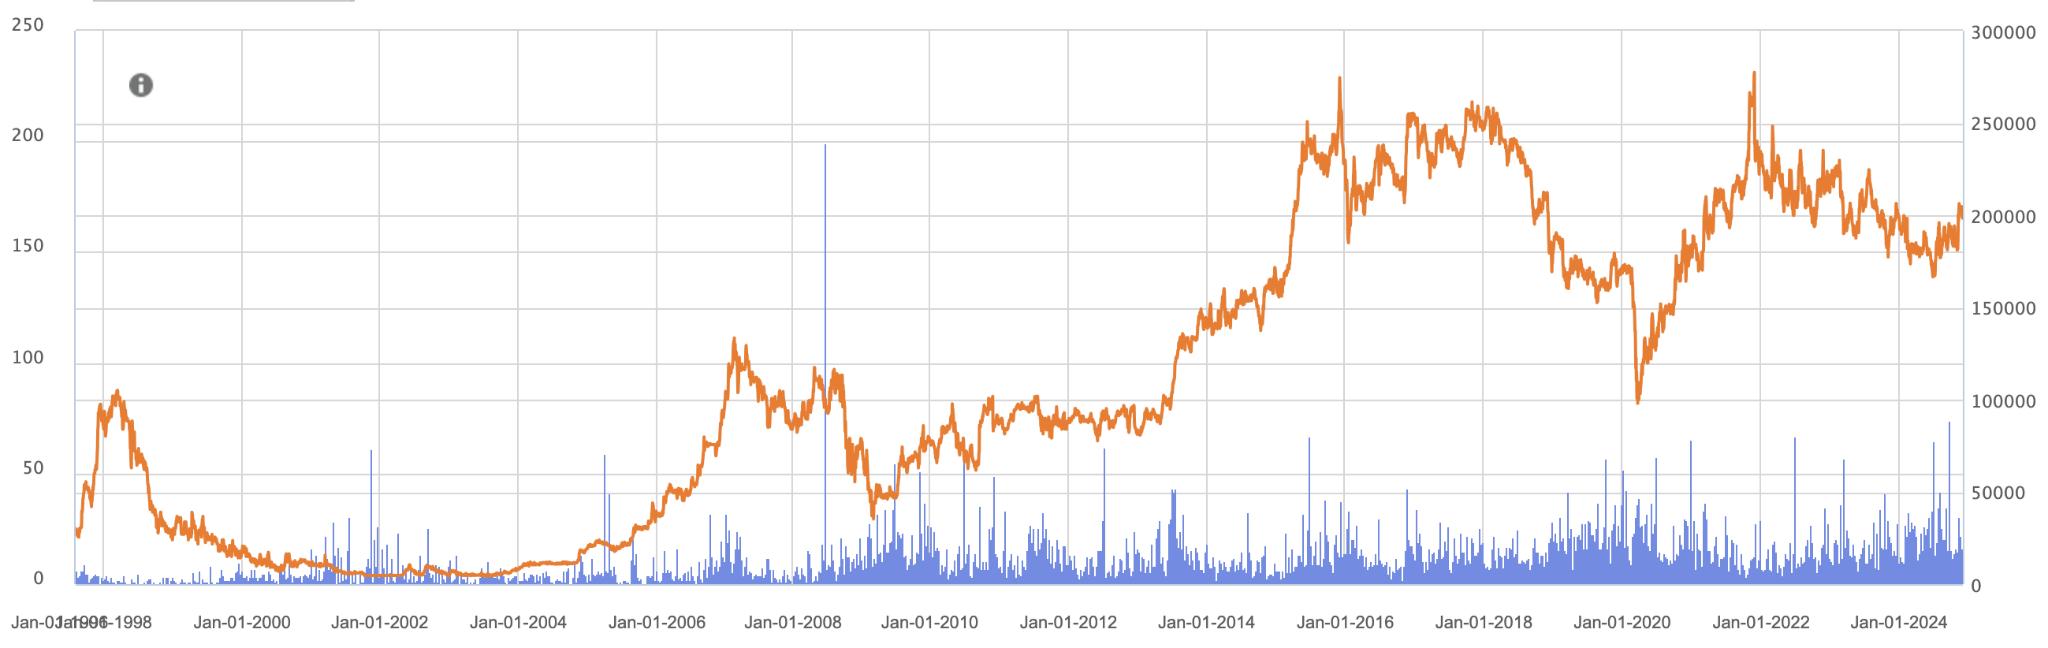
Source: S&P Capital IQ Pro
Market Volatility: Market volatility poses significant risks to DHIL, as the firm’s performance is closely tied to market conditions. Sharp declines in equity markets or extreme volatility can lead to reduced asset values and lower fees, impacting revenue. However, DHIL’s management has a track record of navigating these challenges through diversified investment strategies, careful risk management, and a long-term focus. The leadership team’s ability to adjust to market fluctuations, minimize downside risk, and capitalize on opportunities helps mitigate the impact of market volatility on the firm’s performance.
Regulatory Risks: As the Biden administration nears its end and with the return of the Trump administration, regulatory changes could significantly impact DHIL’s outlook. Under Trump, the FTC is likely to adopt a more business-friendly approach, with less focus on strict antitrust enforcement, which could reduce regulatory hurdles for DHIL, creating a more favorable environment for investment decisions. However, this shift in leadership may also bring uncertainty, and DHIL will need to remain agile to navigate potential changes in policy and regulatory priorities.
Competition: DHIL, as a slightly leaner asset manager, can leverage its agility and flexibility to respond more quickly to market changes and client needs compared to larger competitors. This nimbleness allows the firm to innovate and customize its investment strategies more efficiently, offering tailored solutions that may be harder for larger firms to replicate Additionally, DHIL’s smaller size enables it to maintain a more personalized client experience, fostering stronger relationships and potentially attracting investors who value bespoke services over mass-market offerings Despite the competitive pressures from giants like BlackRock, Vanguard, and Fidelity, these advantages could help DHIL carve out a niche and continue to grow in the market.
Sources: Diamond Hill Investor Relations | Bloomberg | Yahoo Finance | SEC Filings | CFRA Equity Research | PitchBook | S&P Capital IQ | IBIS | Frost & Sullivan | Deep Chip | Edgar
Augustus Paluzzi | December 11, 2024
Rating: Buy
Price Target: $97.94
● P/E: 19.06
● Equity Value: $86B
● EPS: $4.19
● 52 week Low, High: $55.29, $87.92
● Shares Outstanding: 1B
Competitor Statistics from Q4 2023

P/E ratio: $52.23
Market Cap: $51B

P/E ratio: $45.33 Market Cap: $477B
P/E ratio: $13.75 Market Cap: $69B
PayPal (PYPL) offers customers a platform on which they can easily transfer money to one another and manage their finances. The firm’s primary sources of revenue are transaction fees, loan receivables, and premium features Over the next few years I project that more people will shift towards mobile payment exchange, and will gravitate towards paypal for the user-friendly interface and strong merchant offerings
My buy recommendation reflects a belief that the firm’s post-covid streamline revenue has been growing quickly, and additionally, the firm’ management team and existing financial regulations will insulate the firm from more new entrants While the market already has Venmo and CashApp, these apps have a large backing and more entrants are unlikely. Merchants also are incentivized to support all mobile payment options. With the anticipation of lower future interest rates the firm is well positioned to capitalize on a strong market.
With a strong EBIT margin and strong growth rates in most income statement line items. The firm does however have a bond rating of A- and lacks access to enough truly cheap debt. However, the cost of equity is higher at around 12% for the firm giving a WACC of 8.47% which was used as the discount rate. The projected cash flows after the discount rate was applied were 2132.71, 2438.30, 2775.40, 3146.81, 3555.56 (numbers in millions of dollars). Both the Gordon growth and multiples method were used, but the Gordon growth method produced a more reasonable implied upside at 12.2% or $10.60 given the target price of $97.94. Both diluted and undiluted shares were considered and projections were made for both EBITDA multiples and Gordon Growth, ultimately the Gordon growth enterprise value was more realistic The Firm does not state capital expenditure on its income statement but does have a technological development line item which is very similar, and was used in cash flow calculations This is because the firm is a software company and as such has very limited PP&E or tangibles Overall, based on all different approaches the firm is currently undervalued based on its future cash flows
The US federal reserve is currently targeting a lower interest rate and has already cut the rate by 50 BPs This will create a bullish arm for the firm’s lending operations such as payday loans and cash advances, encouraging more engagement from customers. This is also a very good sign for consumer spending which will boost revenues for merchant customers
Augustus Paluzzi | December 11, 2024
Overview:
In 2024 the firm had an increasing market share and has demonstrated strong YTD growth, contributing to a view of being undervalued as a factor of the actual underlying equity. The firm’s shares have realized notable YTD growth.
Graph
Source: DCF Model
The firm has seen strong year-to-year revenue growth across several of its divisions which has bolstered the firm's earnings performance increasing bullish sentiment on the firm. The firm also maintains a great deal of cash reserves in the form of cash and short-term investments, which provides a cushion to future liquidity issues if they occur
Sources: PayPal Investor Relations | Yahoo Finance | Statista | Bloomberg | SEC gov | Capital IQ | Financial Times
Commercial Real Estate and Hospitality companies are typically represented in the stock market as REITs, or Real Estate Investment Trusts REITs can be specific to the type of property, such as office, industrial, retail, hotel, or residential, and can perform differently based on the type of properties they own, manage, or operate. Following the election and market volatility related to interest rates, REITs delivered consistent, solid performance across most sectors. The higher performance in the retail sector softens the lower performance in the hotels sector. As Q3 of 2024 comes to a close, we are able to use the S&P 500 Equity All REIT Returns Indices to analyze the performance of REIT stocks.
Q3 was notably characterized by the Fed interest rate cuts. Historically, periods of high interest rates have been favorable in commercial real estate and REIT stock performance, demonstrated as REITs delivered positive returns in 85% of the periods with rising 10-year Treasury yields, from 1992 to 2021, according to the Nareit All-Equity REIT Index.
However, after the aggressive rate hikes that occurred following 2022, it became more difficult for REITs to take on new debt or maintain debt obligations, and new portfolio acquisitions spiked in price Overall, this led to lower REIT valuations, triggering a vicious cycle during and following 2022
After the Fed interest rate cut, REITs have become more hopeful about banks lightening their lending conditions and a stabilization in financing costs Lower interest rates will lead to lower refinancing costs, and thus higher earning growth than was seen after 2022 Lower interest rates are also predicted to create an environment of improved cost of equity capital, which will lead to an increased rate of property acquisitions for REITs
The overall US office sector performance has made substantial progress in its post-COVID recovery Q3 2024 was the first quarter in two years that had positive net absorption for office properties and had a lower vacancy growth rate than Q2, but this was due to the lower amount of new construction completed, according to Colliers’s Q3 Office Outlook Using the Dow Jones Equity All REIT Indices, the YTD returns of the office REIT sector is 36.4%, outperforming several other sectors such as hotels and industrials, but falling behind malls.
December1,2024
REIT Total Returns compared to U S 10-Year Treasury (Source: Nareit)
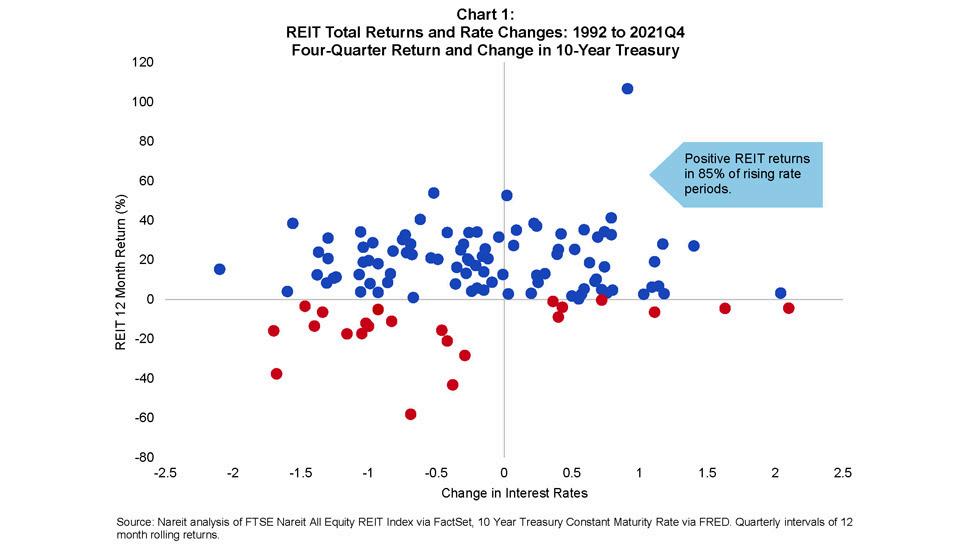
REIT Total Returns and Interest Rate Changes: from 1992 to 2021 (Source: Nareit)
For the office sector, the continuation of return-to-office mandates is expected to boost occupancy These mandates are expected to continue, and following the 2024 election results, new policy creation by Trump can clarify the expectations of certain lines of business, potentially demanding greater in-office presence, and generating higher returns for office REITs
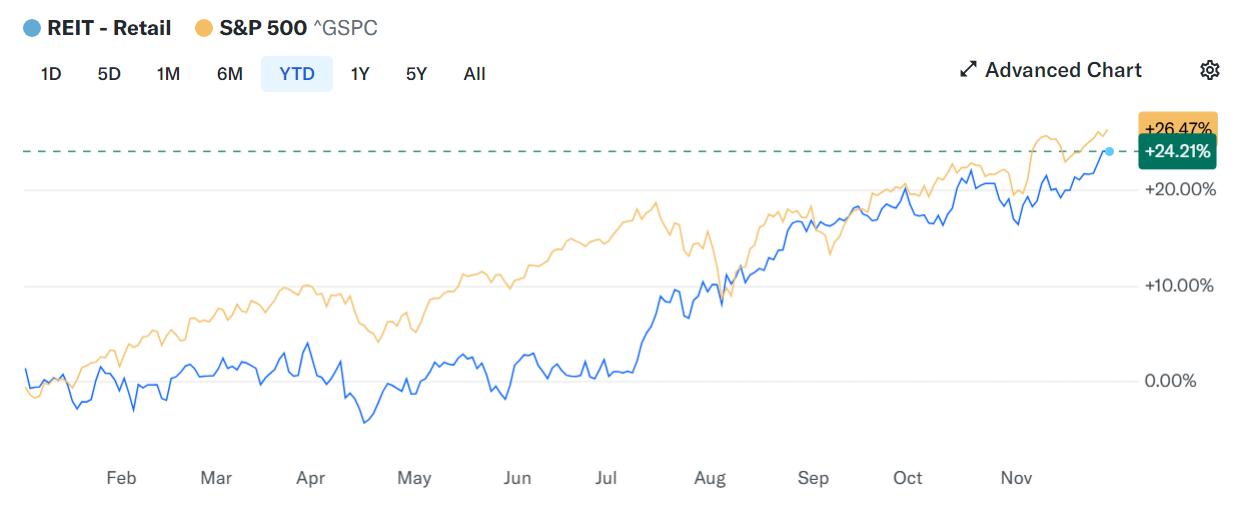
From the Dow Jones Equity All REIT Malls Index, the YTD return for malls was the highest of all of the sectors at 65 1% and factory outlets had a YTD return of 52 9% in Q3 2024 In terms of shopping center performance, Cushman and Wakefield indicate that the national vacancy rate is at a historic low of 5 4%, indicating a new struggle for potential tenants to find available, high quality space Q3 also had negative net absorption, which can be attributed to the Southern region, as conditions following Hurricane Helene led to a high volume of negative net absorption However, it is clear that demand for retail space is there, but not as hot as it was from 2022-2023; by the end of Q3, major retailer bankruptcies had surpassed the total for all of 2023 Retail rent growth has also stabilized back to 2017-2019 average rent growth percentages, indicating that the future outlook for retail provides opportunities for even further recovery and growth.
Coming off of Q3, hotels and hotel REITs underperformed. From the Dow Jones Equity REIT index, the hotel sector return was only a YTD return of 18 3%, with a QTD return of 9 9% This can be attributed to a few factors; according to CBRE, the expected summer travel spike did not materialize in 2024, causing Q3 to experience a 0 8% occupancy decline and a 0 2% decline in RevPAR
One trend that has been present in 2024 for hotels is higher performance for business-centric chains and hotels in business-focused locations, while leisure and resort properties underperformed in comparison However, no location or property type has yet reached its 2019 occupancy levels, indicating that hotel performance can recover further Another trend that could potentially be cannibalizing hotel room night demand is the 8% increase in demand for short-term rentals, which has attracted more price conscious, extended-stay travelers
Overall, the lingering factor that will impact future REIT performance is the potential policies and actions of President-elect Donald Trump. Trump’s policy platform is currently viewed by the market as pro-inflationary and pro-growth, indicating that we may see inflation and interest rates increase under Trump We can see the effects of Trump’s potential policies matriculate an impact on many REITs, specifically residential and industrial
For residential REITs, the Trump victory immediately brought a bump for multifamily and single-family REITs If we do see rising interest rates during Trump’s term, it will raise mortgage rates and decrease the affordability of homeownership This will ultimately create an increase in renting by necessity, which comes as a positive to residential/apartment rental REITs
The impact on industrial REIT stocks is mixed; on the one hand, if Trump is able to increase US exports, demand for warehouse/distribution space in the US will increase However, Trump’s past tariffs hurt domestic manufacturers as there were higher costs associated with imported inputs, such as raw materials. It is likely that this could happen again, negatively impacting U.S. manufacturers, and thus the industrial real estate sector.
Isabella Mourelle| November 12, 2024
Rating: Hold
Current Price: $250.13
Price Target: $283.38
Company Updates / News
● Market Cap: $74.97B
● Beta: 1.02
● EPS: 8.83
● PE Ratio: 18.45
● 52 Week High: $254.87
● 52 Week Low: $137.16
Competitor Statistics from Q3 2022

EV/EBITDA: 28.9
Revenue: $1.24B
Revenue: $762M

EV/EBITDA: 22.6
Revenue: $1.64B
Hilton Hotels is a global hospitality brand with 7,000 properties across 122 countries and territories. The brand offers a range of accommodations and amenities from luxury to budget-friendly hotels Hilton’s strategy focuses on delivering exceptional guest experiences by offering loyalty programs, like Hilton Honors, and leveraging its benefits to businesses However, Target has been struggling to maintain its profitability in recent quarters Hilton has faced challenges in maintaining profitability amid fluctuating travel demand and increased operational costs. My hold recommendation reflects the belief that while there are macroeconomic pressures and competitive challenges, Hilton has opportunities to perform in line with the market as travel demand recovers and the brand continues to expand globally.
As of November 12th , 2024, Hilton Worldwide Holdings was trading at $250.13 per share I believe that this equity is fairly valued and will increase slightly to $283 38 within the current year. I arrived at this conclusion by conducting a comparable companies analysis, comparing Marriot to Hilton, Hyatt, MGM Resorts, and Wynn Resorts, with a 1 8% growth assumption My assumptions are based on Hilton’s historical data and an optimistic view of Hilton’s future performance in the recovering travel market
In its last quarter, Hilton recently expanded its global footprint by opening 24,000 new rooms across 132 hotels Hilton now has more new rooms under construction than any other hotel company, with approximately one in every five hotel rooms under construction worldwide joining the Hilton portfolio Additionally, the company plans to debut its first hotels in Paraguay, Nepal, and Laos this year as it continues broadening its reach into emerging travel destinations. Furthermore, popular Hilton brands, such as Hampton by Hilton, are celebrating its 40th anniversary, and newer lifestyle brands like LivSmart Studios, Tempo, and Spark by Hilton are poised for expansion across key U.S. markets. This growth aligns with Hilton’s strategy to attract a broad range of travelers and strengthen its global market presence
Hilton has announced an industry-first leading partnership with Be My Eyes, providing AI-powered virtual assistance and customer support to enhance the experiences for guests who are blind or low-vision. This partnership offers quests in the United States and Canada with direct access to a dedicated team of Hilton reservations and customer care agents. Visually impaired guests can now access real-time support for tasks like identifying thermostat settings, operating coffee machines, or locating hotel amenities through the Be My Eyes app This will be available at Hilton brands such as Waldorf Astoria, Conrad, DoubleTree, and Hampton by Hilton, ensuring a more accessible, welcoming stay for all guests
Isabella Mourelle| November 12, 2024
Hilton vs. Marriot Monthly Share Price (YT
Source: S&P Capital IQ
Risk Potential
Data Breach:
Hilton Hotels experienced a data breach in January 2023 that compromised the Hilton Honors loyalty program. A cybercriminal claimed to have accessed the data of 3.7 million members, exposing details such as names, addresses, room preferences, and booking dates Hilton must strengthen cybersecurity measures and improve transparency to address this issue and prevent future breaches
Hilton Hotels experiences fluctuating demand based on travel seasons, significantly impacting revenue and operational efficiency Increased bookings can strain staff and resources during peak seasons, leading to potential service delays and higher operational costs Conversely, off-peak seasons result in lower occupancy rates, reducing revenue and creating inefficiencies in utilizing staff and facilities. To mitigate these challenges, Hilton must focus on dynamic pricing strategies, seasonal promotions, and diversified offerings, such as hosting conferences or events during slower periods, to stabilize demand year-round.
Hilton Hotels relies heavily on third-party online booking platforms to drive reservations, which can diminish direct customer engagement and reduce profitability due to commission fees. This dependency also exposes Hilton to risks such as over-reliance on external algorithms and competition for visibility among other hotels. Additionally, customer data collected through these platforms may not always be accessible to Hilton, limiting its ability to personalize the guest experience.
Sources: Corporate.target.com| NY Times | Yahoo Finance | Capital IQ | ir.hilton.com|
Kaden Liu| November 29, 2024
Rating: Buy
Current Price: $10.21
Price Target: $11.03
● Market Cap: $1.5B
● EPS: $0.34
● 52 Week High: $11.78
● 52 Week Low: $8.73
● RLJ’s Q3 Earnings beat investor expectations
● Recent FFO reporting at $0.40 per share beat the Zacks
Consensus Estimate of $0.35 per share
● Q3 RevPAR increased 2.0% compared to 2023, overall RevPar growth is two times the industry average
Competitor Statistics from Q3 2024
Investment Thesis:

RLJ Lodging Trust is a hotel-focused REIT with 96 premium-branded, high-margin, full-service hotels across major urban markets like New York, Chicago, and Los Angeles Their geographic diversification taps into both business and leisure demand, driving higher revenue per room while appealing to diverse clientele. Supported by an experienced management team skilled in acquisitions, renovations, and rebranding, RLJ consistently enhances property quality and profitability This buy recommendation aligns with RLJ's strong fundamentals and favorable positioning in the current macroeconomic climate
RLJ's dividend yield has steadily increased over recent years, peaking at 3 4% in 2023 before dropping to 1.5% in 2024. This decline aligns with higher acquisition activity, as RLJ spent $158 million on acquisitions in 2024 compared to $0 in 2023 and $59 million in 2022. The company's current P/FFO ratio of 7.9x is low relative to competitors, suggesting undervaluation. A NAV model of RLJ’s current assets and liabilities estimates RLJ’s target price at $11 03
Hotels are often the riskiest among the five core commercial asset classes (Multifamily, Industrial, Office, Retail, Hotel) due to their strong correlation with GDP and reliance on discretionary spending. In recessions, consumers prioritize essentials like food and housing, making multifamily properties the most stable However, recent economic indicators suggest recovery despite high interest rates. U.S. GDP grew 2 8% in Q3, driven by robust consumer and government spending, while inflation eased to a three-year low, with a 2 4% CPI increase in September These trends indicate growing economic strength and a potential boost for hotel demand.
P/FFO:


P/FFO: 12.7x
Market Cap: $1.4B

P/FFO: 12.69x
Market Cap: $1.8B
Hotels often come with high fixed and variable costs that can lead to relatively thin margins compared to other industrial, multifamily, and retail buildings This can especially be seen with luxury hotels; although flashy, they incur high operating costs due to higher staffing, amenities, and constant capital expenditures. RLJ Lodging’s business model serves to mitigate these risks By focusing on premium-branded, focused-service and compact full-service hotels, RLJ is able to bring the perfect balance of luxury through brand names, while maintaining higher profit margins due to a more efficient operating model and less volatile cash flows By focusing more on business travel over leisure travel, RLJ Lodging is less dependent upon the holiday season for revenue and benefits from a seven-day-a-week demand
Kaden Liu| November 29, 2024
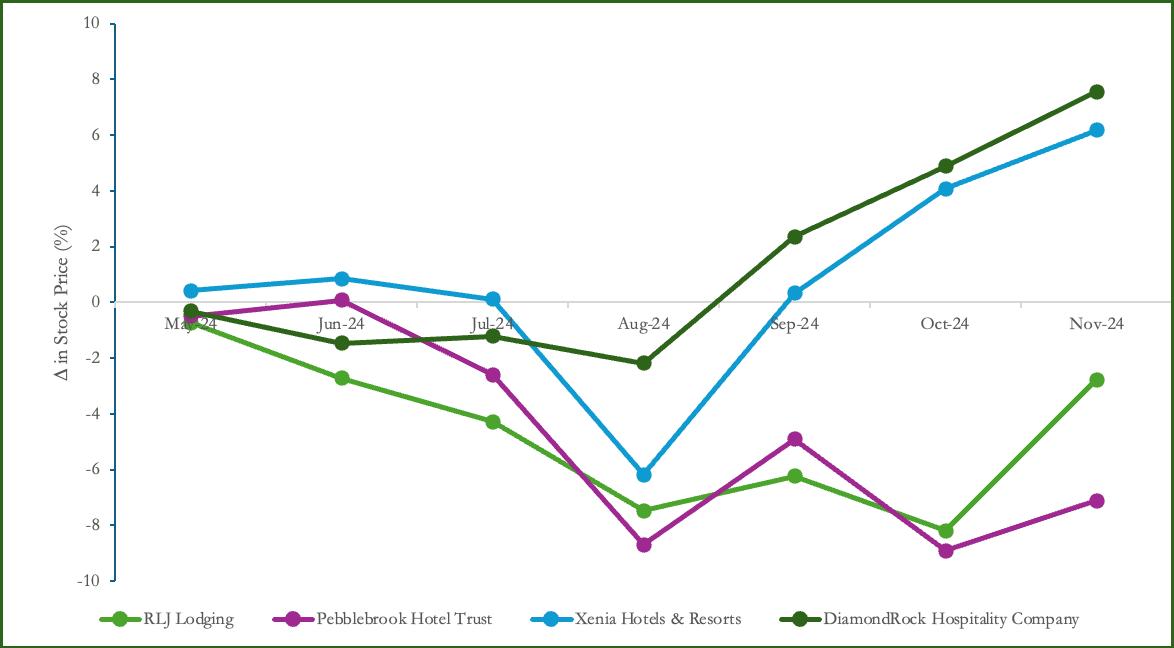
Source: S&P Capital IQ
Risk Potential
High Borrowing Cost:
Despite recent Fed rate cuts, the 10-Year Treasury yield has climbed 60 bps to 4.3–4.4%, up from 3.6% in September, driven by investor focus on the federal deficit rather than rate cuts Under Trump, the deficit grew from 3.1% to 4.6%, reaching a record 5.5% of GDP in June Concerns over Trump’s fiscal policies have pushed Treasury yields higher, pressuring RLJ to refinance debt and pursue acquisitions
With the recent election results, we can expect to see a lower regulation environment, tax cuts, and tariffs This all serves to widen our current budget deficits, leading to potential inflation. While the policies could create a short-term rise in a market that currently has a stable/optimistic outlook, the future after Trump’s policies are in place is uncertain. Inflation can lead to rising operational costs, including labor, utilities, and maintenance, all of which can place heavy pressure on the profit margins of RLJ Lodging.
Battle between Fed and Trump:
Fed Chair Jerome Powell and Trump have clashed over interest rate policy, with Trump seeking more control through deregulation, tax cuts, and increased deficit spending. Powell, refusing to step down, may slow rate cuts in opposition, complicating borrowing for firms like RLJ Lodging. This could hinder their ability to refinance debt and invest in hotel properties, limiting earnings potential.
Sources: investor.rljlodgingtrust.com|WSJ|CFRA Equity Research| Yahoo Finance|Capital IQ|Robinhood|drhc.com| pebblebrookhotels com|xeniareit com|
Rating: Buy
Current Price: $139.99
Price Target: $150.00
● Market Cap: $42.84B
● EV/EBITDA: 24 48
● Forward P/E: 26.32
● Return on Assets: 4.15%
● Quarterly Revenue Growth (YoY): 14.80%
● Dividend Yield: 0%
from Q3 2024

EV: $30 37B
Revenue: $9.04B
EV: $9.98B
Revenue: $1 18B

EV: $1B
Revenue: $168.51M

CBRE maintains its position as the world’s largest commercial real estate services provider, offering a diverse range of services, including customized consulting, client financial advisory, real estate asset management, and property design and construction. The company’s extensive in-house capabilities enable it to capture more market share and effectively cross-sell services. Given CBRE’s robust service portfolio and positive financial outlook, the company is well-positioned for continued growth, making it a compelling investment opportunity.
CBRE leads the real estate services industry with six core offerings: customized consulting, client financial advisory, real estate asset management, and property design and construction Notably, its property design and construction service boasts a 7:1 Value-to-Fee ratio globally CBRE’s extensive in-house capabilities allow it to capture more market share and effectively cross-sell services For 2024, CBRE expects to achieve core earnings per share (EPS) between $4 95 and $5 05, indicating mid-teens percentage growth at the midpoint of the range, up from 2023 EPS of $3 15, but still notably short of 2022 EPS of $5 69
As of the third quarter of 2024, CBRE reported a core EPS of $1 20, surpassing analysts’ expectations of $1 06 and reflecting a 66 7% increase from the same quarter in 2023 This strong performance led the company to raise its full-year core EPS outlook to a range of $4.95 to $5.05, up from the previous guidance of $4.70 to $4.90. These figures indicate that CBRE is on track to meet its updated 2024 EPS expectations, demonstrating significant growth over 2023, though still below the 2022 levels.
The financial metrics comparing Q3 2023 to Q3 2024 demonstrate several notable improvements Revenue increased from $7,868 million to $9,036 million, marking a 14 8% rise, while net revenue saw a 20% increase from $4,430 million to $5,318 million Moreover, GAAP net income rose by 17 8%, from $191 million to $225 million Additionally, core EBITDA increased by 57 8%, from $436 million to $688 million These positive figures reflect the company’s robust performance and its ability to generate strong revenue and profitability
Source: Yahoo Finance
Risk Potential:
Climate Risks: The increasing frequency and severity of climate-related events, such as hurricanes, floods, and wildfires, pose significant challenges to the commercial real estate sector. Properties located in vulnerable areas are at heightened risk of physical damage, leading to increased insurance premiums and potential devaluation Additionally, the transition to a low-carbon economy introduces regulatory and reputational risks, as stakeholders demand more sustainable practices. Recognizing these challenges, CBRE has partnered with Climate X, a risk analysis platform, to enhance its climate risk assessment capabilities This collaboration enables CBRE’s sustainability specialists to translate climate risk scenarios into actionable insights, assisting clients in evaluating locations and identifying potential threats from climate risks.
Economic Uncertainty: Economic slowdowns and fluctuating interest rates can significantly impact real estate investment activity. Higher interest rates lead to increased borrowing costs, potentially dampening demand for commercial properties and affecting CBRE’s transaction volumes. CBRE’s 2024 U.S. Real Estate Outlook anticipates economic growth slowing, with the Federal Reserve expected to reduce short-term interest rates to around 4 25% by year-end 2024 and to 3 5% in 2025. However, the pace of these reductions may be slower than in previous cycles due to the resilience of the U.S. economy If downside risks materialize, the Fed could lower rates more quickly, but the overall environment remains uncertain
Regulatory Challenges: CBRE has been involved in legal proceedings related to its valuation services For instance, liquidators of China Evergrande Group initiated legal action against CBRE over valuation reports produced for Evergrande and its subsidiaries in 2018 Such legal challenges can lead to financial penalties and reputational damage, impacting the company’s operations and stakeholder trust CBRE’s Valuation & Advisory Services division provides comprehensive valuation, advisory, and consulting services, including expert witness testimony in legal proceedings. The company emphasizes the importance of accurate and reliable valuations, as they are critical to the success of real estate investments
Sources: CBRE Webpage | Yahoo Finance | SEC gov | Capital IQ | Financial Times | LinkedIn - Nakisa Real Estate