Corcoran Sawyer Smith
Q4 2022 Market Report
JERSEY CITY
5-Year Overview
2022 2021 %CHG (YR) 2020 %CHG (YR) 2019 %CHG (YR) 2018 %CHG (YR)
CLOSED SALES 2,212 2,516 -12% 1,758 +26% 2,007 +10% 2,107 +5%
DAYS ON MARKET 35 43 -20% 43 -20% 46 -24% 44 -21%
MEDIAN CONDO SALE PRICE $600,000 $572,500 +5% $553,000 +8% $513,750 +17% $499,000 +20%
AVERAGE CONDO SALE PRICE $662,220 $619,594 +7% $588,092 +13% $573,586 +15% $560,057 +18%
MEDIAN CONDO PPSF $574 $550 +4% $536 +7% $522 +10% $514 +12%
AVERAGE CONDO PPSF $609 $581 +5% $555 +10% $547 +11% $552 +10%
MEDIAN 1 FAMILY SALE PRICE $625,000 $530,000 +18% $470,000 +33% $417,096 +50% $387,500 +61%
AVERAGE 1 FAMILY SALE PRICE $771,693 $661,045 +17% $562,249 +37% $523,169 +48% $491,818 +57%
MEDIAN 2-4 FAMILY SALE PRICE $721,000 $685,000 +5% $625,000 +15% $540,000 +34% $515,000 +40%
AVERAGE 2-4 FAMILY SALE PRICE $837,172 $786,359 +6% $723,497 +16% $628,829 +33% $592,529 +41%
Following a record year, 2022 started with a robust spring market on track to another record-breaking year, but with the Federal Reserve raising interest rates to combat inflation, the market saw a sharp drop in transactions in the second half of the year. However, with the steady demand from buyers and a reduced number of inventory, the prices held, and the properties sold in record time in Jersey City in 2022. Once again, the Jersey City real estate market has exhibited its resilience to economic fluctuations and national market trends.
2022 saw an increase in property values across the board. In 2022, the median sales price for single-family houses increased by 18%, the median sales price for 2-4 family houses increased by 5%, and the average dollar per square foot in condominiums also increased by 5% from 2021. Properties sold in a record 35 days, 8 days faster than those sold in 2021.
The median sales prices increased in every neighborhood of Jersey City in 2022. Downtown saw a 6% increase and The Heights saw a 4% increase from 2021. Most impressively however, Bergen-Lafayette, West Bergen, Greenville and Journal Square all saw double digit increases of 18%, 16%, 13% and 10% respectively from 2021.
4Q2022 | JERSEY CITY | 2
2022 Overall Neighborhood Breakdown
Downtown
2022 2021 %CHG (YR)
MEDIAN PRICE $825,000 $775,000 +6%

AVERAGE PRICE $954,784 $886,694 +8%
AVERAGE PPSF $808 $758 +7%
The Heights
2022 2021 %CHG (YR)
MEDIAN PRICE $700,000 $675,000 +4%
AVERAGE PRICE $703,743 $656,260 +7%
AVERAGE PPSF $516 $470 +10%
Journal Square
2022 2021 %CHG (YR)
MEDIAN PRICE $456,000 $415,000 +10%
AVERAGE PRICE $508,487 $477,865 +6%
AVERAGE PPSF $433 $385 +12%
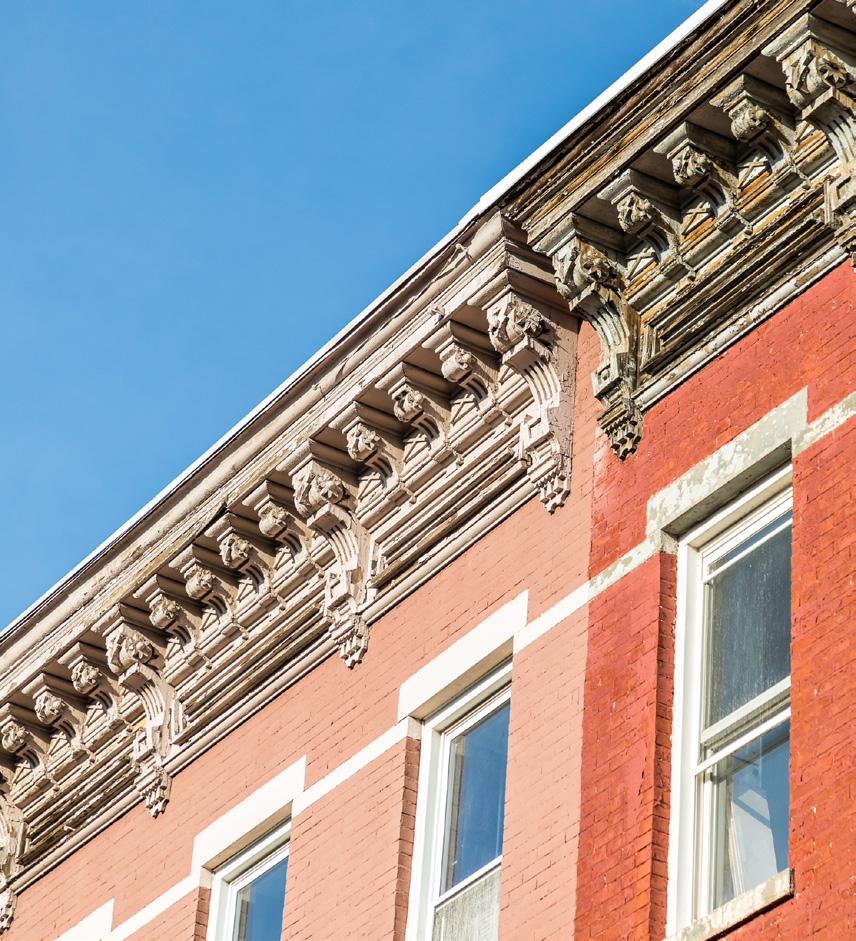
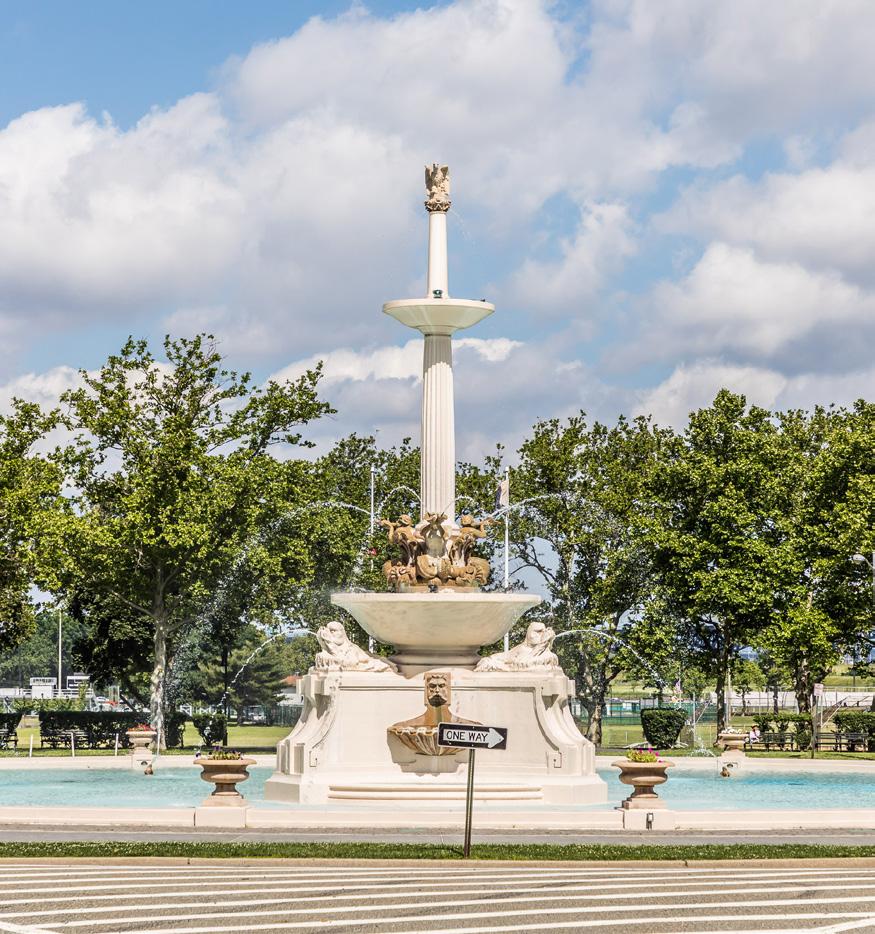
Bergen-Lafayette
2022 2021 %CHG (YR)
MEDIAN PRICE $627,000 $531,000 +18%
AVERAGE PRICE $630,911 $595,957 +6%
AVERAGE PPSF $437 $442 -1%
West Bergen
2022 2021 %CHG (YR)
MEDIAN PRICE $500,000 $429,950 +16%
AVERAGE PRICE $519,020 $456,020 +14%
AVERAGE PPSF $328 $331 -1%
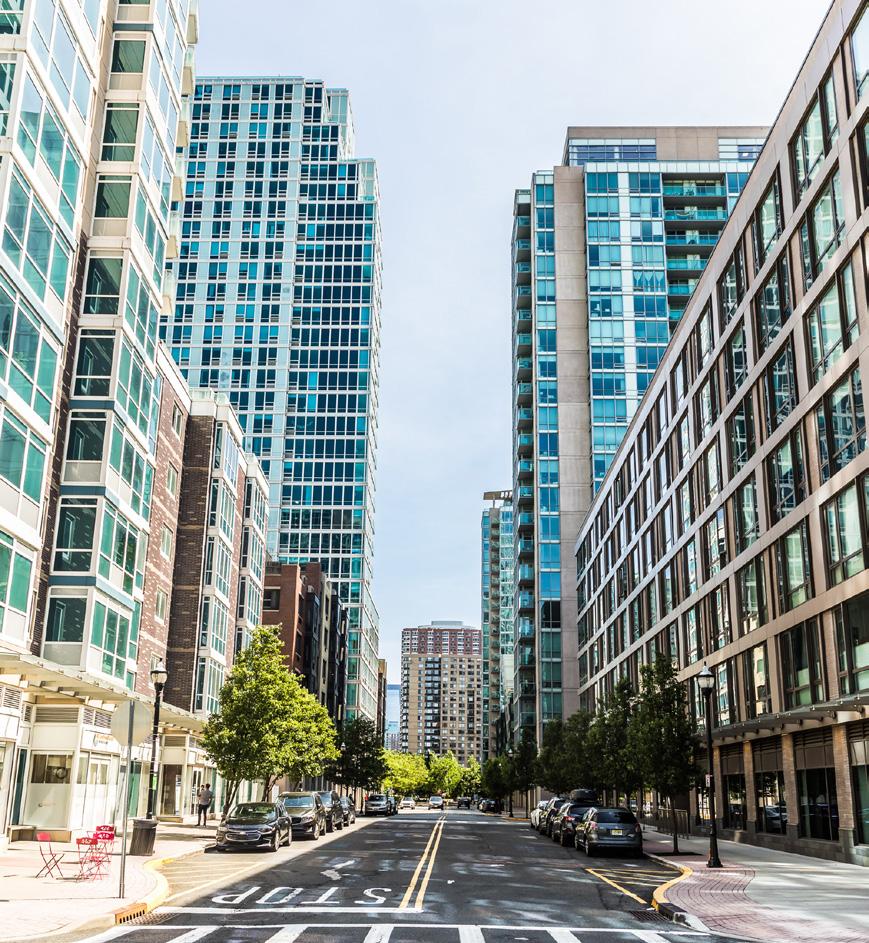
Greenville
2022 2021 %CHG (YR)
MEDIAN PRICE $510,000 $450,000 +13%
AVERAGE PRICE $542,000 $486,053 +12%
AVERAGE PPSF $361 $314 +15%
4Q2022 | JERSEY CITY | 3
The fourth quarter was challenging for sure. With sharply decreased inventory and rising interest rates, the market saw fewer transactions, fewer bidding wars, longer days on the market and slightly reduced prices from the previous quarter yet still higher prices than a year ago.
In the fourth quarter, the number of transactions decreased by 30% from the same quarter in 2021 and by 23% from the previous quarter. The number of new deals also decreased in the fourth quarter by 37% from the same quarter a year ago and by 30% from the previous quarter. The sales volume decreased accordingly to $295M in the fourth quarter, a decrease of 23% from $385M a year ago and a decrease of 26% from $397M of the previous quarter which included contracts prior to the Federal Reserve’s interest hikes.
The properties that closed in the fourth quarter of 2022 stayed on the market two days longer than those that closed in the same quarter 2021 and 11 days longer than those closed in the previous quarter.
The inventory decreased by 14% from the same quarter in 2021 and by 10% from the previous quarter. The decreased inventory kept the selling prices steady. The median price rose by 8% from the fourth quarter of 2021 and remained the same as the third quarter of 2022. The average sold price per square foot in condominiums increased by 3% from the same quarter a year ago but decreased by 3% from the previous quarter.
4Q2022 | JERSEY CITY | 4
SALES | PAGE 5-6 INVENTORY | PAGE 7 PRICES | PAGE 8 NEIGHBORHOOD BREAKDOWN | PAGE 9-20 Contracts Signed 359 -37% YEAR OVER YEAR -30% QUARTER OVER QUARTER Closed Sales 418 -30% YEAR OVER YEAR -23% QUARTER OVER QUARTER Inventory 746 -14% YEAR OVER YEAR -10% QUARTER OVER QUARTER Days on Market 42 +5% YEAR OVER YEAR +35% QUARTER OVER QUARTER Median Price $640K +8% YEAR OVER YEAR -0% QUARTER OVER QUARTER Average PPSF $588 +5% YEAR OVER YEAR -3% QUARTER OVER QUARTER The CorcoranSS Report | 4Q | 2022 | Jersey City
of Q4
Overview
Sales
• During the fourth quarter of 2022, the sales volume decreased by 23% from the same quarter last year and by 26% from the third quarter.
• Jersey City saw a slight decrease of 37% in new contracts from the same quarter last year and 30% decrease from the third quarter.
• Properties stayed on the market for 42 days on average, only 2 days more than the same quarter last year.
4Q22 4Q21 %CHG (YR) 3Q22 %CHG (QTR)
CLOSED SALES 418 595 -30% 544 -23%
SALES VOLUME $295M $385M -23% $397M -26%
CONTRACTS SIGNED 359 567 -37% 514 -30%
DAYS ON MARKET 42 40 +5% 31 +35%
4Q2022 | JERSEY CITY | 5
700 560 420 280 140 0 50 40 30 20 10 0 NUMBER OF CLOSED SALES DAYS ON MARKET Closed Sales CLOSED SALES AVERAGE DAYS ON MARKET 600 500 400 300 200 100 0 Contracts Signed NUMBER OF CONTRACTS SIGNED CONTRACTS
4Q18 4Q19 4Q20 4Q21 4Q22 4Q18 4Q19 4Q20 4Q21 4Q22
SIGNED
Condominium Sales
Days on Market by Price Range
4Q22 4Q21 %CHG (YR) 3Q22 %CHG (QTR)
CLOSED SALES 261 370 -29% 361 -28%
SALES VOLUME $170M $222M -24% $241M -29%
DAYS ON MARKET 41 42 -2% 29 +41%
1-Family Sales
4Q22 4Q21 %CHG (YR) 3Q22 %CHG (QTR)
CLOSED SALES 50 81 -38% 66 -24%
SALES VOLUME $39.4M $49M -19% $54.1M -27%
DAYS ON MARKET 41 33 +24% 26 +58%
2-4 Family Sales
CLOSED SALES 107 144 -26% 117 -9%
SALES VOLUME $85.9M $113.6M -24% $102M -16%
DAYS ON MARKET 46 42 +10% 38 +21%
UNDER $400K
$400K TO $700K $700K TO $1M $1M TO $1.5M $1.5M TO $2M $2M+
4Q22 44 days 40 days 39 days 47 days 36 days 101 days
4Q21
UNDER $400K
$400K TO $700K $700K TO $1M $1M TO $1.5M $1.5M TO $2M $2M+
37 days 41 days 41 days 43 days 47 days 40 days
Days on Market by Bedroom Type
CHANGE
4Q21 4Q22 4Q21 %CHG (YR) 3Q22 %CHG (QTR)
CHANGE (YEAR-OVER-YEAR) % 4Q22 4Q21 38 days
4Q21
4Q2022 | JERSEY CITY | 6
STUDIO 1 BED 2 BED 3+ BED
(YEAR-OVER-YEAR) % 4Q22
4Q22 66 days 44 days 41 days 38 days 43 days 44 days 38 days STUDIO 1 BED 2 BED 3+ BED +53% -2% -1% +8%
+18% +11% -3% -5% +151% -23%
4Q2022 | JERSEY CITY | 7
$1M
STUDIO 1 BEDROOM 2 BEDROOM 3+ BEDROOM STUDIO 1 BEDROOM 2 BEDROOM 3+ BEDROOM 86 9 149 15 155 83 244 142 113 102 130 162 47 117 52 11 16 6 4 Breakdown of Active Listings BY ASKING PRICE RANGE BY BEDROOM TYPE 4Q21 4Q21 4Q22 4Q22 CHANGE (YEAR-OVER-YEAR) % 4Q22 4Q21 -42% -10% -36% -13% +50% -31% -40% -11% -42% -37% 800 700 600 500 400 300 200 100 0 NUMBER OF UNITS 132 0 80 160 240 320 400 0 50 100 150 200 250 0 50 100 150 200 250 0 75 150 225 300 4Q18 4Q19 4Q20 4Q21 4Q22 Inventory ACTIVE LISTINGS 4Q22 4Q21 %CHG (YR) 3Q22 %CHG (QTR) INVENTORY 746 856 -13% 831 -10% 4Q20 4Q19 4Q18 INVENTORY 907 795 1,105
Inventory • In the fourth quarter 2022, the inventory declined by 13% from the same quarter last year and by 10% from the third quarter. UNDER $400K $400K TO $700K $700K TO $1M $1M TO $1.5M $1.5M TO $2M $2M+ UNDER $400K $400K TO $700K $700K TO $1M
TO $1.5M $1.5M TO $2M $2M+
Condominium Prices
Prices
• With rising interest rates and uncertainty in the market, prices fell slightly from the previous quarter, but remained well above the prices from a year ago.
• The median condominium price increased by 13% from a year ago, but decreased by 2% from the previous quarter. The average dollar per square foot increased by 3% from a year ago, but decreased by 3% from the previous quarter.
• The median price of single-family houses increased by 23% from the same quarter last year, but decreased by 3% from the third quarter of 2022.
4Q22 4Q21 %CHG (YR) 3Q22 %CHG (QTR)
MEDIAN PRICE $640,000 $590,000 +8% $640,000 -0%
AVERAGE PRICE $707,168 $647,338 +9% $730,540 -3%
MEDIAN PPSF $533 $511 +4% $577 -8%
AVERAGE PPSF $588 $560 +5% $608 -3%
Median and Average Price
MEDIAN PRICE AVERAGE PRICE
PRICES 4Q22 4Q21 %CHG (YR) 3Q22 %CHG (QTR)
MEDIAN PRICE $590,000 $520,000 +13% $605,000 -2%
AVERAGE PRICE $652,117 $601,394 +8% $667,912 -2%
MEDIAN PPSF $533 $536 -1% $577 -8%
AVERAGE PPSF $592 $574 +3% $608 -3%
MEDIAN PRICE BY BEDROOM
STUDIO $281,889 $325,426 -13% $269,591 +5%
1 BEDROOM $446,799 $446,988 -0.04% $450,674 -1%
2 BEDROOM $662,405 $663,468 -0.16% $691,731 -4%
3 BEDROOM $899,697 $839,793 +7% $955,752 -6%
1-Family Prices
PRICES 4Q22 4Q21 %CHG (YR) 3Q22 %CHG (QTR)
MEDIAN PRICE $600,000 $489,000 +23% $617,500 -3% AVERAGE PRICE $789,610 $605,138 +30% $820,317 -4%
2-4 Family Prices
PRICES 4Q22 4Q21 %CHG (YR) 3Q22 %CHG (QTR)
MEDIAN PRICE $705,000 $682,875 +3% $735,000 -4% AVERAGE PRICE $802,929 $789,126 +2% $873,132 -8%
4Q2022 | JERSEY CITY | 8
$800K $640K $480K $320K $160K $0 SALE PRICE
$650 $600 $550 $500 $450 $400 PRICE PER SQUARE FOOT 4Q18 4Q19 4Q20 4Q21 4Q22
4Q22
AVERAGE PPSF MEDIAN PPSF Price Per Square Foot
4Q18 4Q19 4Q20 4Q21
• Inventory decreased by 35% from the same quarter last year, and similarly, the number of transactions decreased by 36%.
• Median price rose by 22% from a year ago and the average price per square foot increased by 4%. •
sold at a similar pace as a year ago.
4Q2022 | DOWNTOWN | JERSEY CITY | 9 Downtown
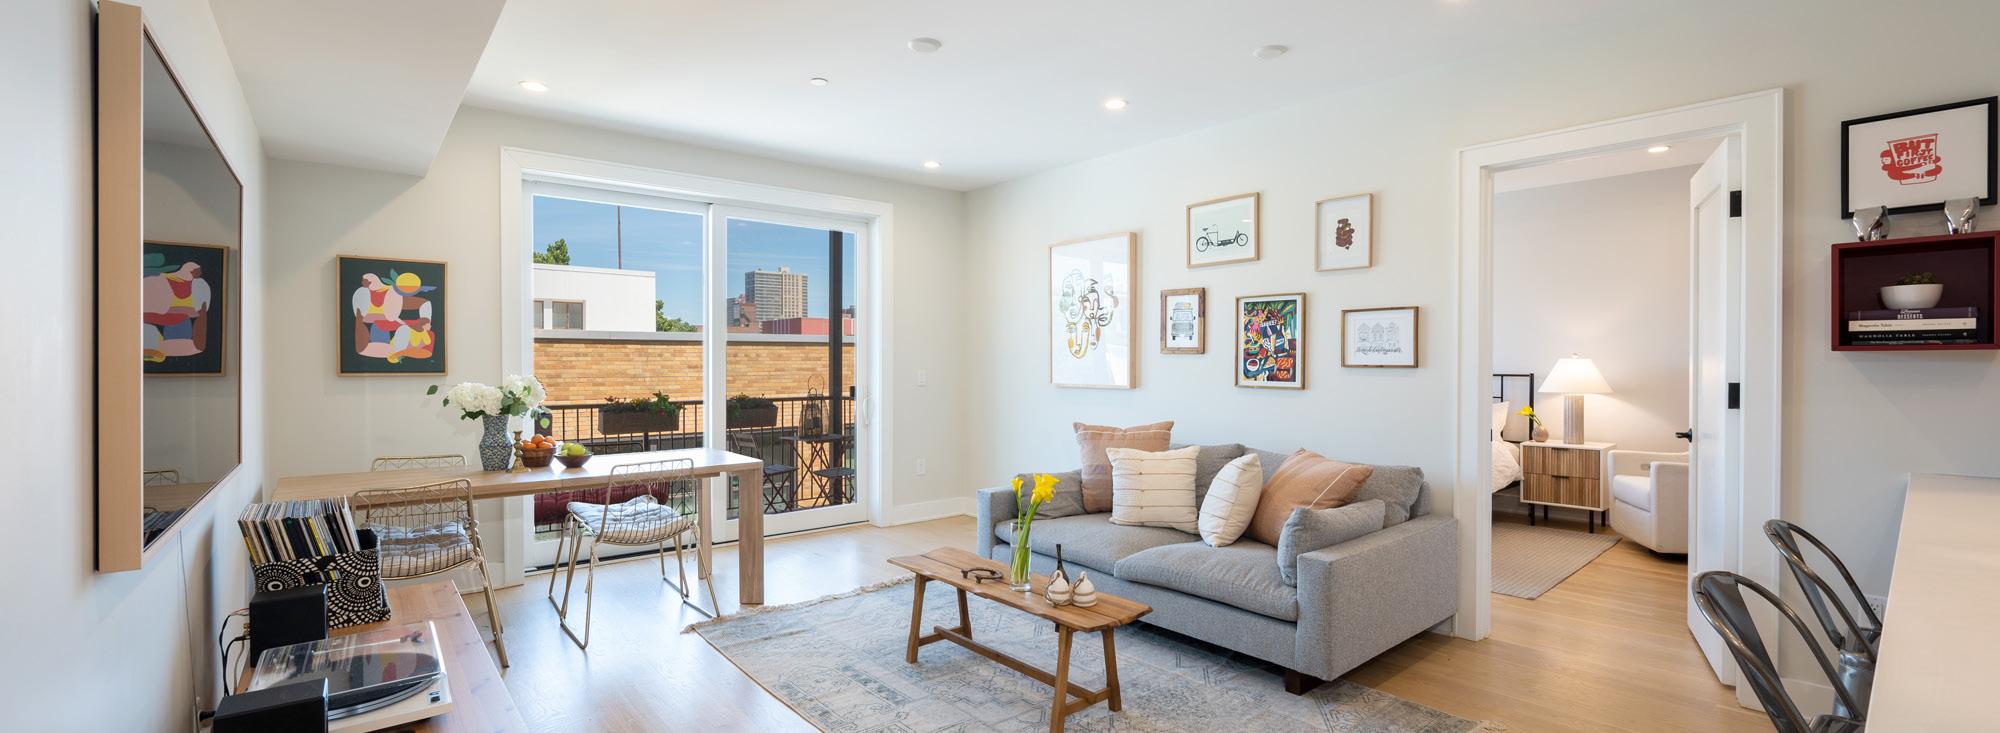
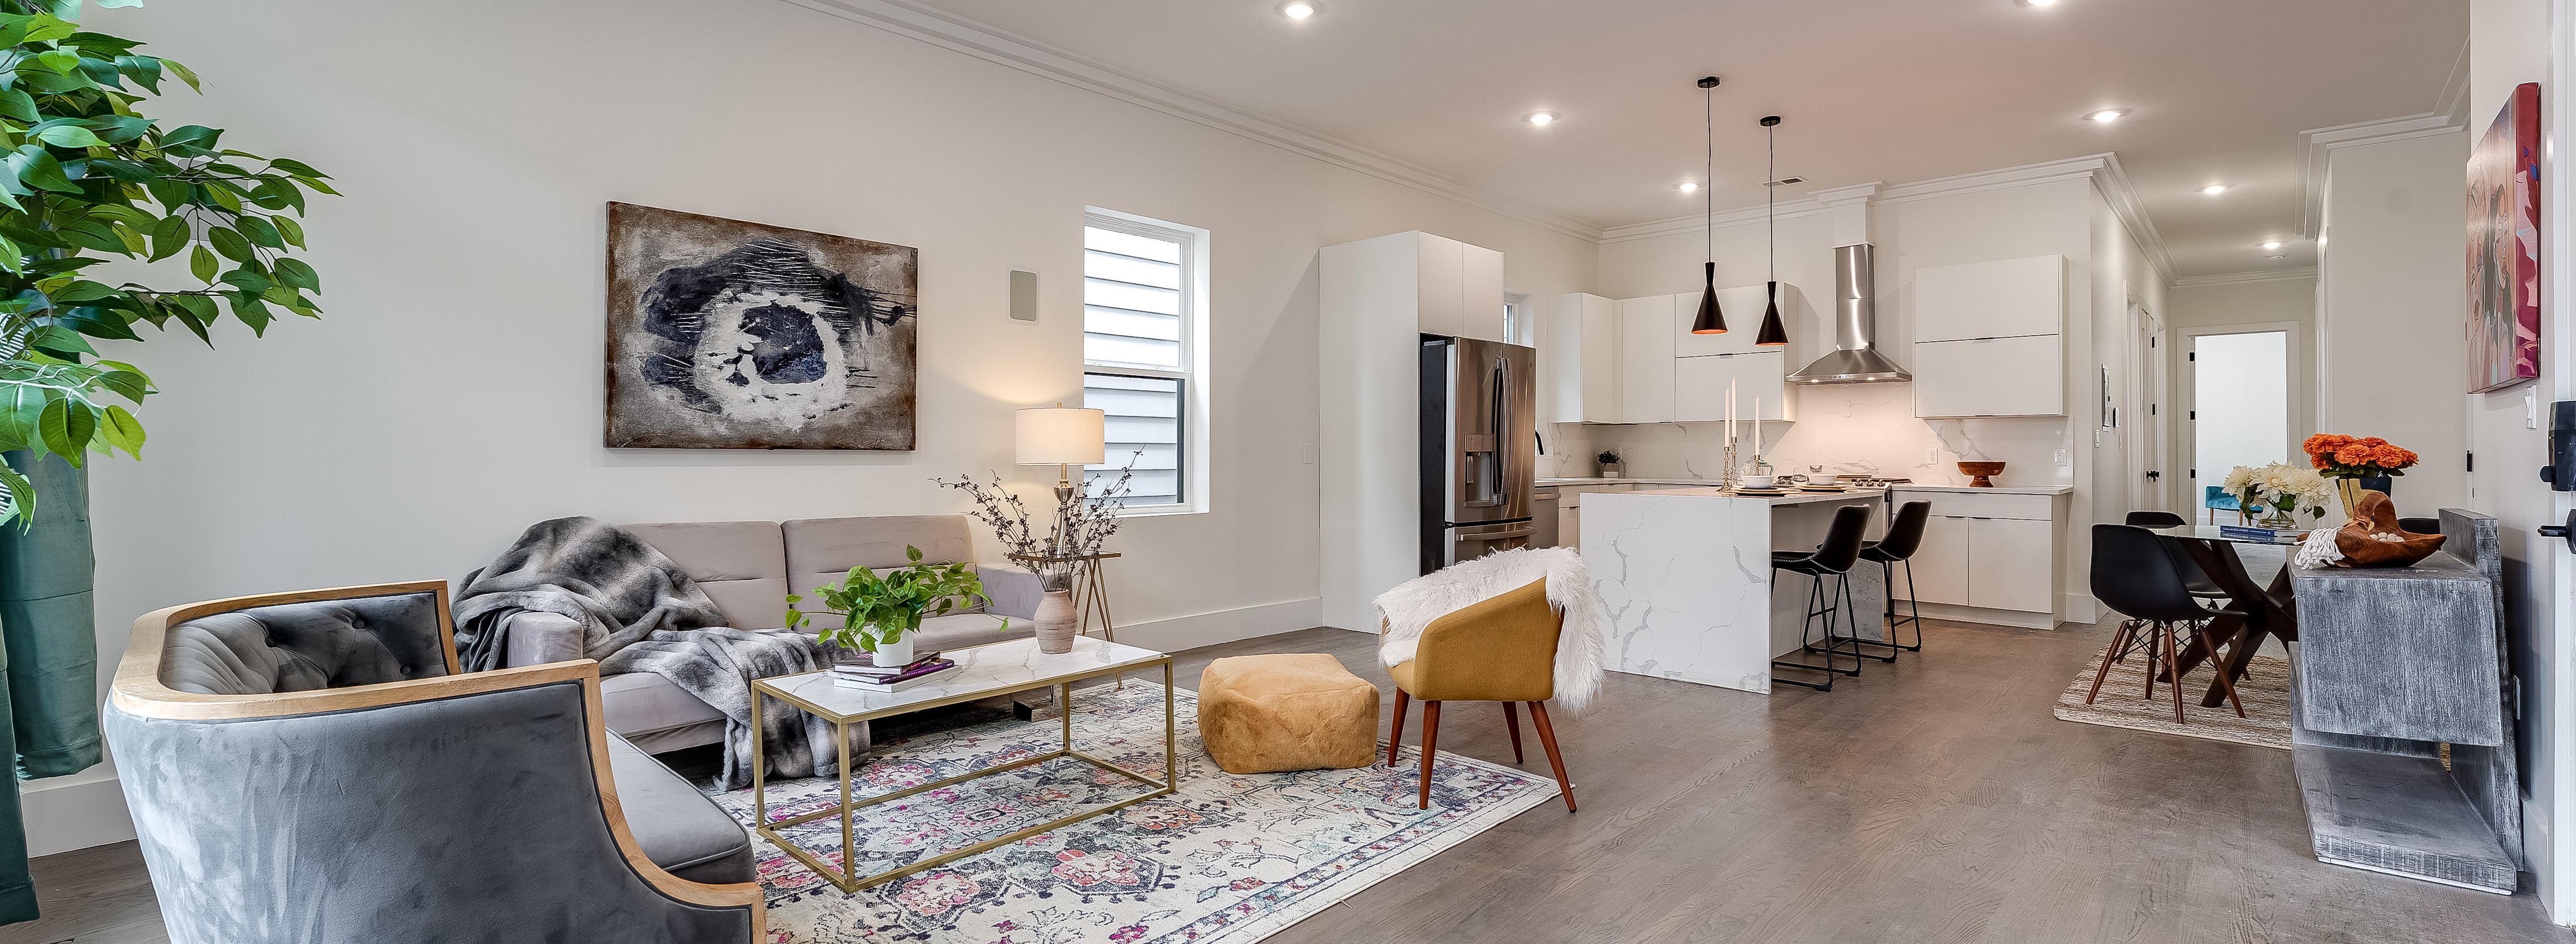
Sales 129 -36% YEAR OVER YEAR Market Share of Sales 31% -8% YEAR OVER YEAR Inventory 182 -35% YEAR OVER YEAR Median Price $915K +22% YEAR OVER YEAR Average PPSF $791 +4% YEAR OVER YEAR 366 6th St #402 | $1.24M Listing Presented
Days on Market 46 +2% YEAR OVER YEAR
Properties
by Selina Vargas
4Q2022 | DOWNTOWN | JERSEY CITY | 10 Downtown Prices by Property Type Downtown Average Price by Bedroom CONDOMINIUM STUDIO 1 BEDROOM 2 BEDROOM 3 BEDROOM 4Q22 $342,250 $602,875 $885,482 $1,358,929 CONDOMINIUM 1 FAMILY CHANGE (YEAR-OVER-YEAR) % MEDIAN PPSF AVERAGE PPSF MEDIAN PRICE 4Q22 4Q21 AVERAGE PRICE 4Q22 4Q21 $710K $765K +8% $980K $1.512M +54% $777 $739 +5% $788K $827.5K $1.132M $1.670M +5% +48% $791 $761 +4% -18% +8% +5% -2% STUDIO 1 BEDROOM 2 BEDROOM 3 BEDROOM 4Q21 $415,178 $575,445 $905,686 $1,262,431 MEDIAN PRICE AVERAGE PRICE 2-4 FAMILY 4Q22 4Q21 $1.550M $1.610M +4% $1.526M $1.860M +22% MEDIAN PRICE AVERAGE PRICE -28% -2% -1% -3% STUDIO 1 BEDROOM 2 BEDROOM 3 BEDROOM 3Q22 $477,000 $606,483 $910,834 $1,386,273 CHANGE (YEAR-OVER-YEAR) % CHANGE (QUARTER-OVER-QUARTER) %
4Q2022 | THE HEIGHTS | JERSEY CITY | 11
Heights
development units, inventory
• Properties
• Inventory, median price, and average price per square foot
Sales 98 -21% YEAR OVER YEAR Market Share of Sales 23% +12% YEAR OVER YEAR Inventory 244 +11% YEAR OVER YEAR Median Price $697K +7% YEAR OVER YEAR Average PPSF $489 +7% YEAR OVER YEAR 104 Lincoln St #1 | $900K Listing Presented by Megan Gülick Days on Market 42 +20% YEAR OVER YEAR
The
• With a steady supply of new
rose by 11% from a year ago.
sold 20% slower than the fourth quarter of 2021.
saw an increase from the same quarter last year.
4Q2022 | THE HEIGHTS | JERSEY CITY | 12 The Heights Prices by Property Type The Heights Average Price by Bedroom CONDOMINIUM CONDOMINIUM 1 FAMILY CHANGE (YEAR-OVER-YEAR) % MEDIAN PPSF AVERAGE PPSF MEDIAN PRICE 4Q22 4Q21 AVERAGE PRICE 4Q22 4Q21 $486K $650K +34% $628K $698.5K +11% $489 $461 +6% $533.9K $625.5K $700.4K $679.2K +17% -3% $495 $459 +8% MEDIAN PRICE AVERAGE PRICE 2-4 FAMILY 4Q22 4Q21 $761.5K $800K +5% $783.9K $790K +1% MEDIAN PRICE AVERAGE PRICE CHANGE (YEAR-OVER-YEAR) % CHANGE (QUARTER-OVER-QUARTER) % STUDIO 1 BEDROOM 2 BEDROOM 3 BEDROOM 4Q22 $249,000 $320,809 $426,366 $797,258 -41% +0.3% +12% -6% STUDIO 1 BEDROOM 2 BEDROOM 3 BEDROOM 4Q21 $419,666 $286,849 $455,896 $794,984+4% -19% -16% STUDIO 1 BEDROOM 2 BEDROOM 3 BEDROOM 3Q22$395,250 $506,814 $767,145

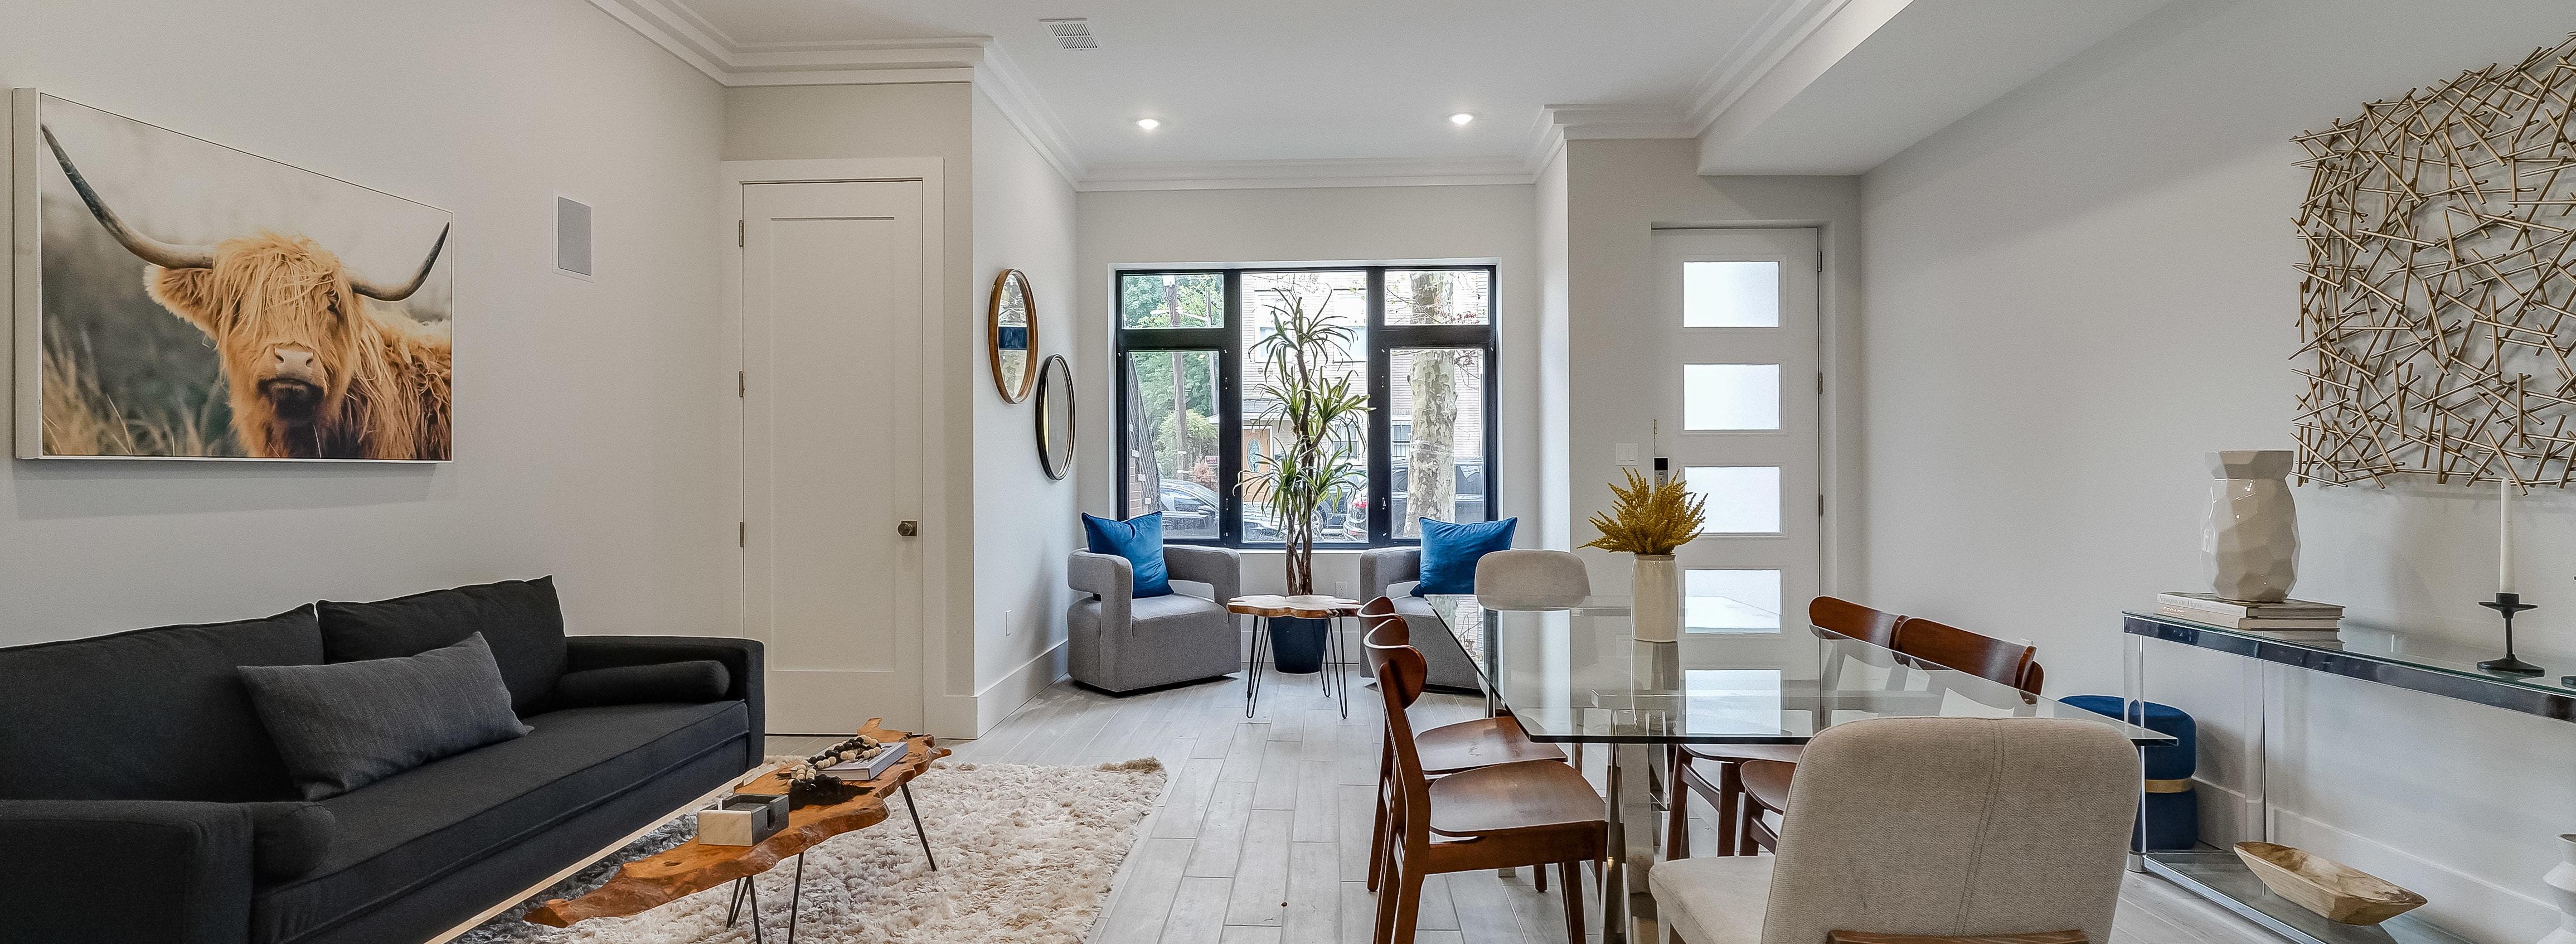
4Q2022 | JOURNAL SQUARE | JERSEY CITY | 13 Journal Square • Inventory decreased by 16% and the number of transactions decreased by 20% from a year ago. • Properties stayed on the market 45 days on average. • Median price and average price per square foot saw an increase from the same quarter last year. Sales 82 -20% YEAR OVER YEAR Market Share of Sales 20% +13% YEAR OVER YEAR Inventory 114 -16% YEAR OVER YEAR Median Price $475K +8% YEAR OVER YEAR Average PPSF $433 +6% YEAR OVER YEAR Days on Market 45 +5% YEAR OVER YEAR 196 Delaware Ave #2 | Asking $599K Listing Presented by
Gülick
Megan
4Q2022 | JOURNAL SQUARE | JERSEY CITY | 14 Journal Square Prices by Property Type Journal Square Average Price by Bedroom CONDOMINIUM STUDIO 1 BEDROOM 2 BEDROOM 3 BEDROOM 4Q22 $214,667 $293,345 $453,877 $710,714 CONDOMINIUM 1 FAMILY CHANGE (YEAR-OVER-YEAR) % MEDIAN PPSF AVERAGE PPSF MEDIAN PRICE 4Q22 4Q21 AVERAGE PRICE 4Q22 4Q21 $335K $330K -1% $752.5K $665.5K -12% $433 $401 +8% $377.2K $394.8K $742.6K $679.7K +5% -8% $435 $405 +7% +2% +22% -2% +7% STUDIO 1 BEDROOM 2 BEDROOM 3 BEDROOM 4Q21 $210,333 $298,583 $422,709 $583,091 MEDIAN PRICE AVERAGE PRICE 2-4 FAMILY 4Q22 4Q21 $662.5K $750K +13% $711.6K $761.9K +7% MEDIAN PRICE AVERAGE PRICE +12% +21% +13% +9% STUDIO 1 BEDROOM 2 BEDROOM 3 BEDROOM 3Q22 $191,813 $260,442 $418,074 $589,750 CHANGE (YEAR-OVER-YEAR) % CHANGE (QUARTER-OVER-QUARTER) %
4Q2022 | BERGEN-LAFAYETTE | JERSEY CITY | 15
Inventory decreased by 20% from the same quarter last year.
Median sale price saw an increase of 26%
the
quarter
year.
On average, properties stayed on the market for 40 days. Sales 19 +46% YEAR OVER YEAR Market Share of Sales 5% +108% YEAR OVER YEAR Inventory 32 -20% YEAR OVER YEAR Median Price $550K +26% YEAR OVER YEAR Average PPSF $440 -3% YEAR OVER YEAR Days on Market 40 +54% YEAR OVER YEAR 191 Halladay St #1 | $770K Listing Presented by
Gülick
Bergen-Lafayette •
•
from
same
last
•
Megan
4Q2022 | BERGEN-LAFAYETTE JERSEY CITY | 16 Bergen-Lafayette Prices by Property Type Bergen-Lafayette Average Price by Bedroom CONDOMINIUM 1 BEDROOM 2 BEDROOM 3 BEDROOM 4Q22 $425,500 $383,250 $691,667 CONDOMINIUM 1 FAMILY CHANGE (YEAR-OVER-YEAR) % MEDIAN PPSF AVERAGE PPSF MEDIAN PRICE 4Q22 4Q21 AVERAGE PRICE 4Q22 4Q21 $387.2K $495K +28% $560K $380K -32% $427 $472 -10% $377K $516.3K $571.6K $380K +37% -34% $440 $454 -3%+19% -9% 1 BEDROOM 2 BEDROOM 3 BEDROOM 4Q21 $362,333 $421,000MEDIAN PRICE AVERAGE PRICE 2-4 FAMILY 4Q22 4Q21 $830K $650K -22% $830K $687.6K -17% MEDIAN PRICE AVERAGE PRICE -1% -46% +1% 1 BEDROOM 2 BEDROOM 3 BEDROOM 3Q22 $435,000 $715,000 $687,500 CHANGE (YEAR-OVER-YEAR) % CHANGE (QUARTER-OVER-QUARTER) %
West Bergen
• Properties sold 3 days faster than the third quarter of 2021.
• Median sale price increased by 25% and the average dollar per square foot saw an increase of 16% from the same quarter last year.
• Properties sold 3 days faster than the third quarter of 2021.
• Inventory remained similar to the same quarter of 2021.
4Q2022 | WEST BERGEN | JERSEY CITY | 17
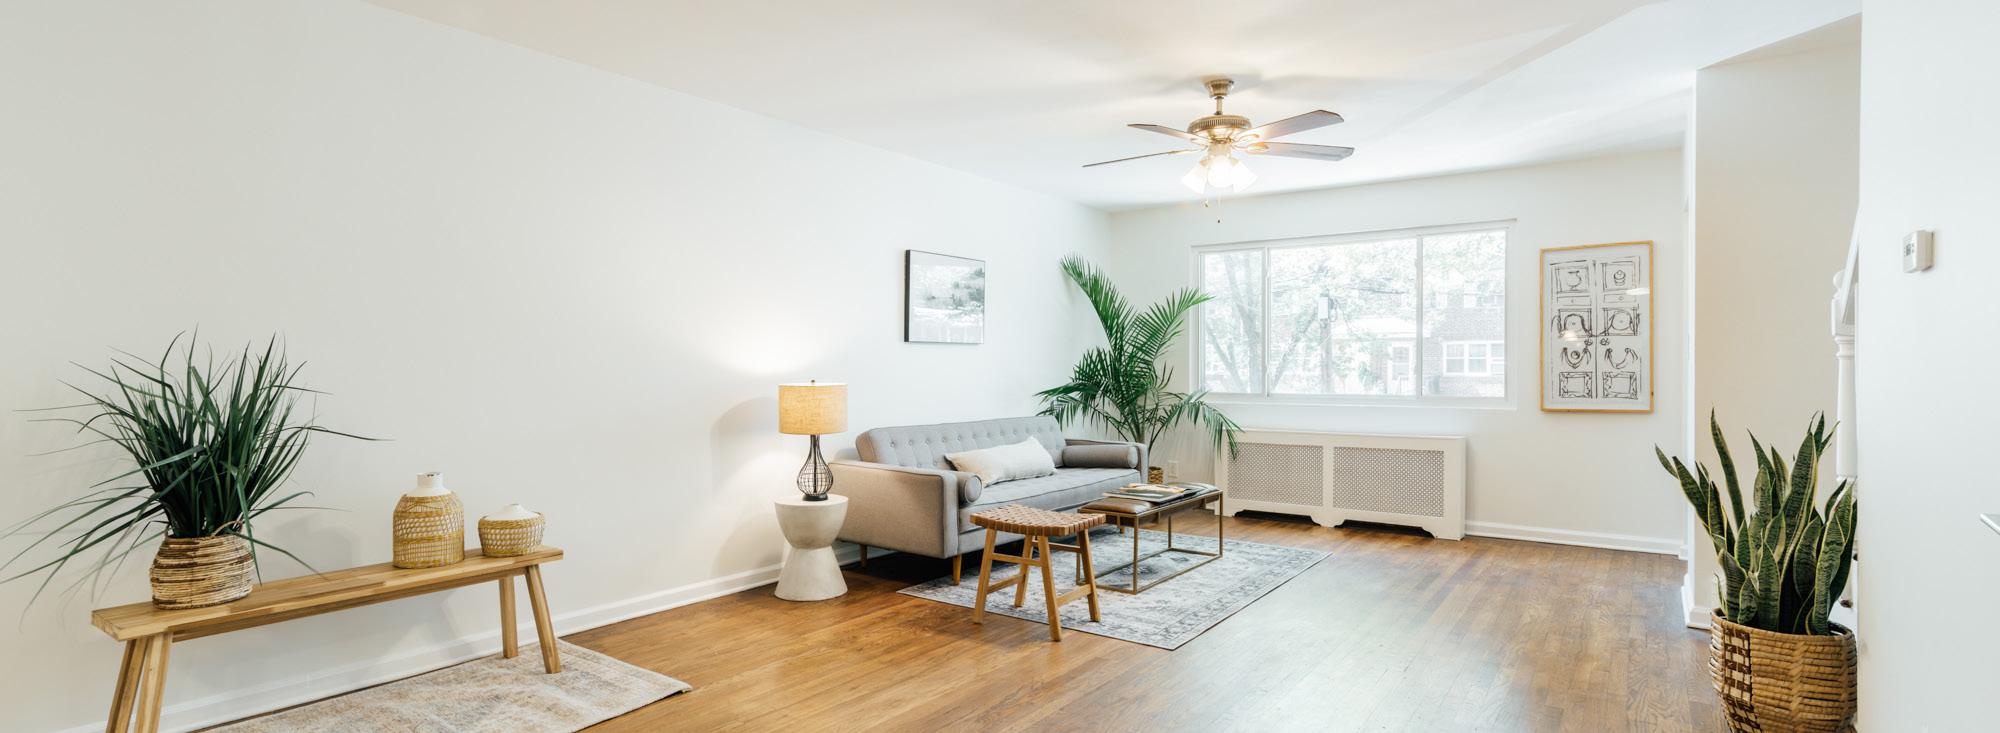
Sales 38 -45% YEAR OVER YEAR Market Share of Sales 12% -22% YEAR OVER YEAR Inventory 63 +3% YEAR OVER YEAR Median Price $505K +25% YEAR OVER YEAR Average PPSF $354 +16% YEAR OVER YEAR Days on Market 34 -11% YEAR OVER YEAR 56 College St | $499K Listing Presented by Francine Lauri
4Q2022 | WEST BERGEN | JERSEY CITY | 18 West Bergen Prices by Property Type West Bergen Average Price by Bedroom CONDOMINIUM STUDIO 1 BEDROOM 2 BEDROOM 3 BEDROOM 4Q22 $275,000$420,000 $530,000 CONDOMINIUM 1 FAMILY CHANGE (YEAR-OVER-YEAR) % MEDIAN PPSF AVERAGE PPSF MEDIAN PRICE 4Q22 4Q21 AVERAGE PRICE 4Q22 4Q21 $387.5K $400K +3% $395K $485K +23% $349 $294 +19% $392.2K $416K $409.4K $461K +6% +13% $356 $307 +16% -3% +8%+5% STUDIO 1 BEDROOM 2 BEDROOM 3 BEDROOM 4Q21 $284,500 $248,000 $398,370 $492,667 MEDIAN PRICE AVERAGE PRICE 2-4 FAMILY 4Q22 4Q21 $550K $587K +7% $524.2K $612.5K +17% MEDIAN PRICE AVERAGE PRICE-16%+3% STUDIO 1 BEDROOM 2 BEDROOM 3 BEDROOM 3Q22$181,667 $406,190 $630,000 CHANGE (YEAR-OVER-YEAR) % CHANGE (QUARTER-OVER-QUARTER) %
4Q2022 | GREENVILLE JERSEY CITY | 19
transactions
Median sale price and average dollar per square foot
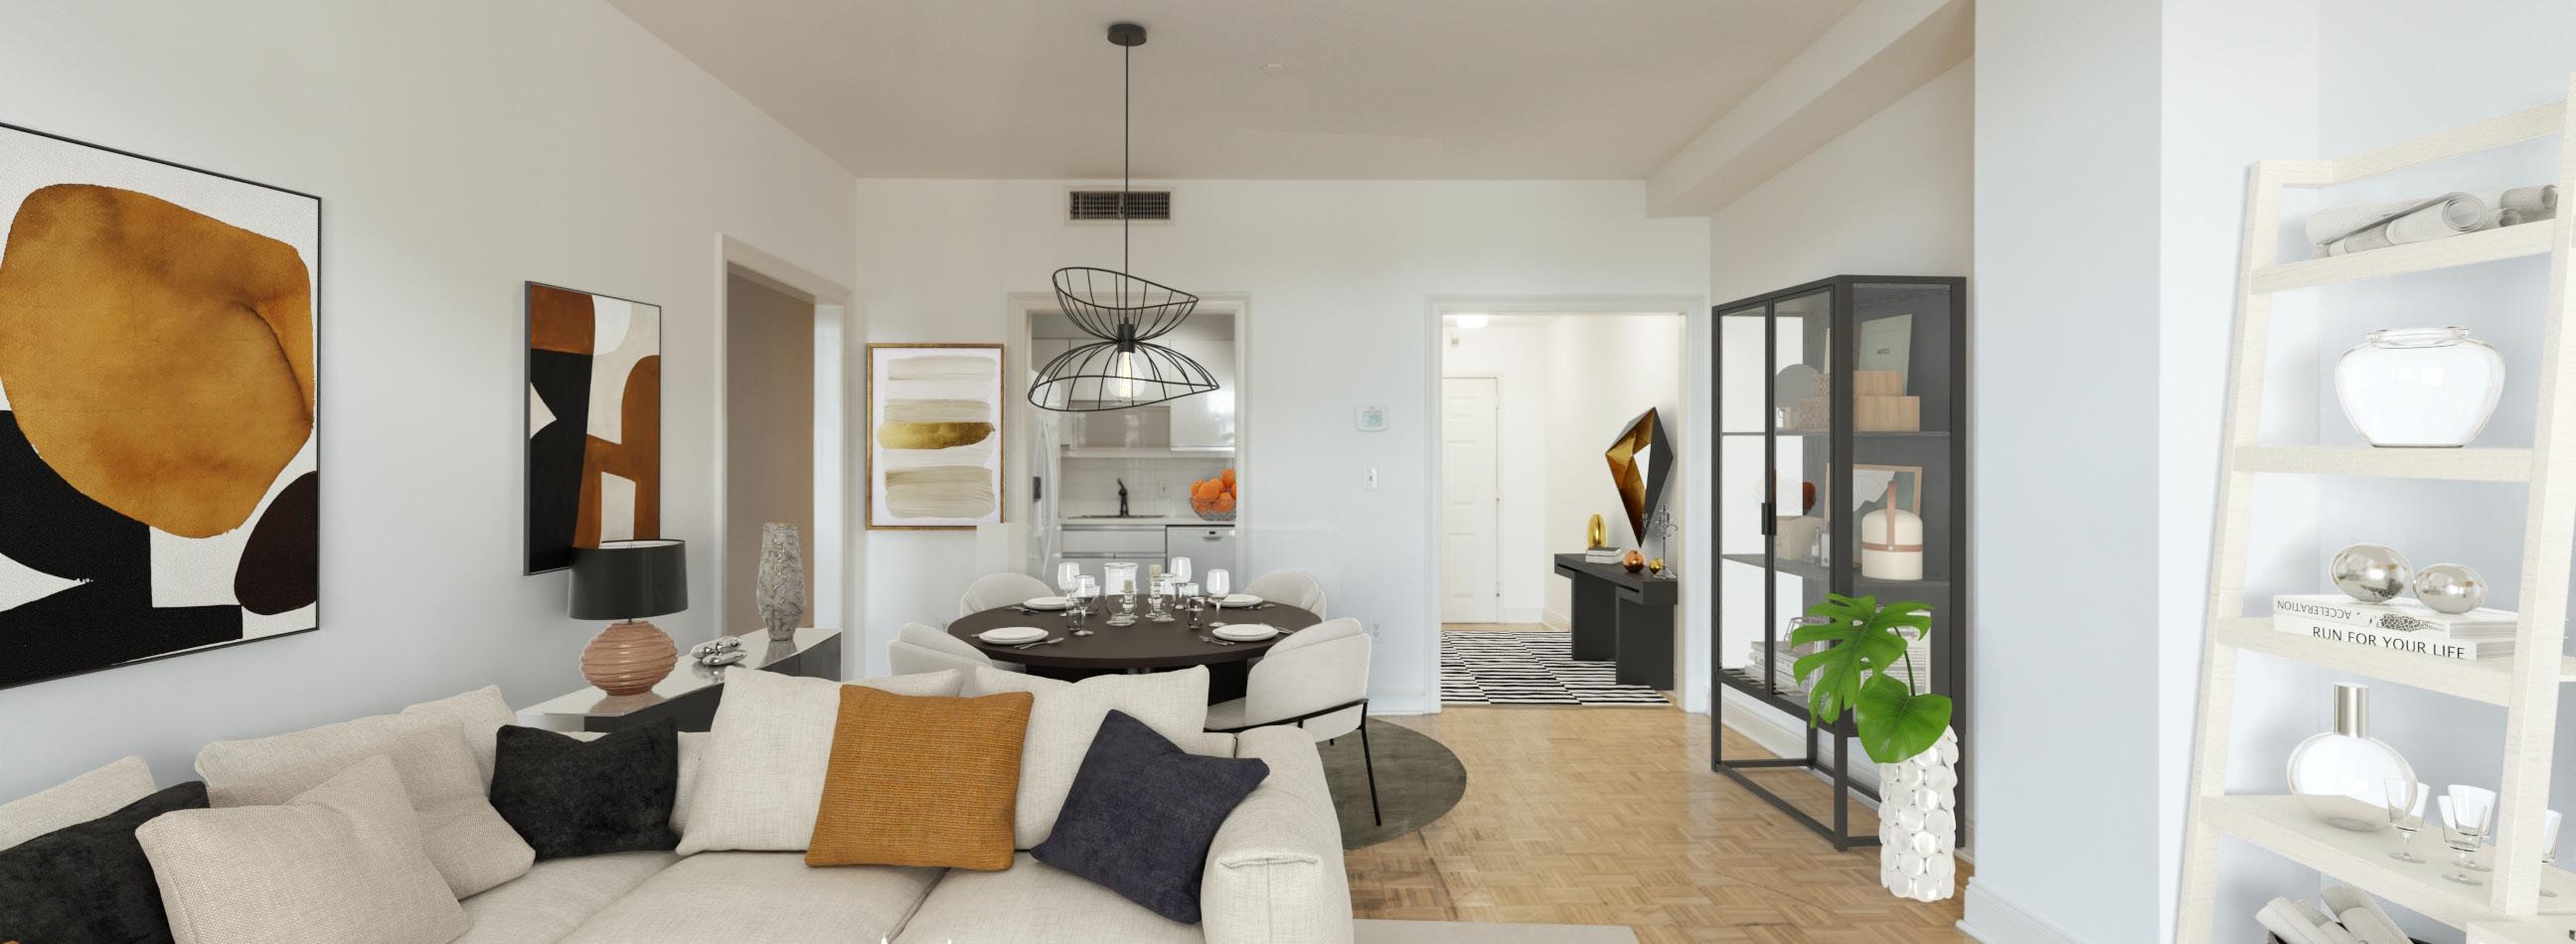
Sales 52 -40% YEAR OVER YEAR Market Share of Sales 14% -14% YEAR OVER YEAR Inventory 111 -11% YEAR OVER YEAR Median Price $467K +4% YEAR OVER YEAR Average PPSF $359 +10% YEAR OVER YEAR Days on Market 37 -8% YEAR OVER YEAR 208 Shearwater Ct W #47 | $350K Listing Presented by Arpita Mendez
Greenville • The number of
in the fourth quarter of 2022 decreased by 40% and inventory decreased by 11% from the same quarter last year. • Properties sold in just 37 days. •
saw an increase from the same quarter last year.
4Q2022 | GREENVILLE | JERSEY CITY | 20 Greenville Prices by Property Type Greenville Average Price by Bedroom CONDOMINIUM 1 BEDROOM 2 BEDROOM 3 BEDROOM 4Q22 $305,429 $435,227 $712,300 CONDOMINIUM 1 FAMILY CHANGE (YEAR-OVER-YEAR) % CHANGE (YEAR-OVER-YEAR) % MEDIAN PPSF AVERAGE PPSF MEDIAN PRICE 4Q22 4Q21 AVERAGE PRICE 4Q22 4Q21 $435K $410.9K -6% $400K $390K -3% $359 $348 +3% $451K $566K $410.6K $417.2K +26% +2% $364 $339 +7% +7% +1% -5% 1 BEDROOM 2 BEDROOM 3 BEDROOM 4Q21 $302,500 $458,663 $665,800 MEDIAN PRICE AVERAGE PRICE 2-4 FAMILY 4Q22 4Q21 $568K $525K -8% $560.6K $574.9K +3% MEDIAN PRICE AVERAGE PRICE -4% -13% -16% 1 BEDROOM 2 BEDROOM 3 BEDROOM 3Q22 $319,333 $500,531 $845,557 CHANGE (QUARTER-OVER-QUARTER) %
Executive and Support Team


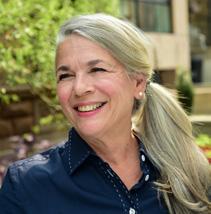

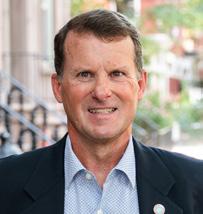

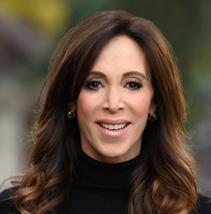
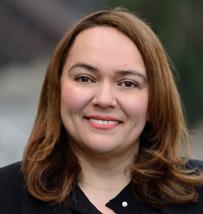
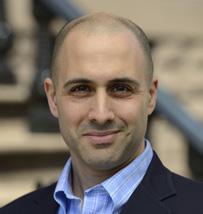


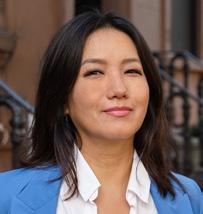
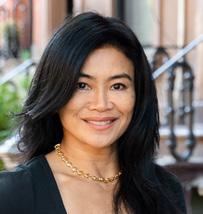




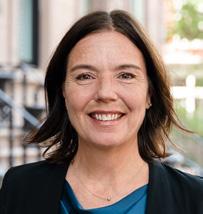
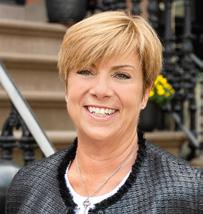








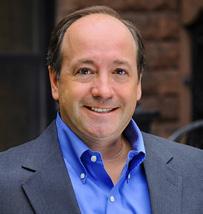

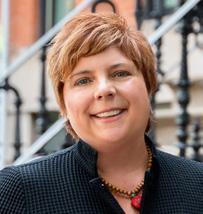





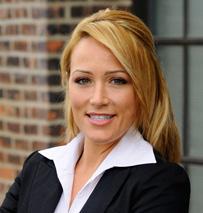

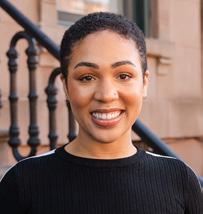
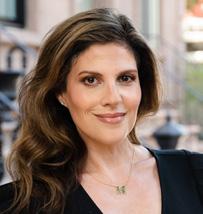

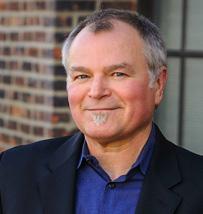

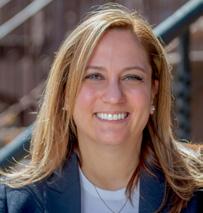


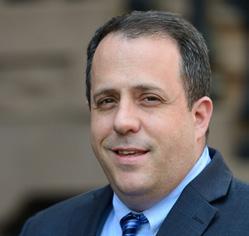

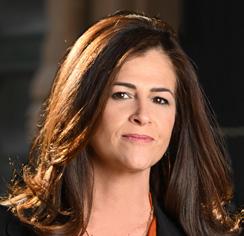

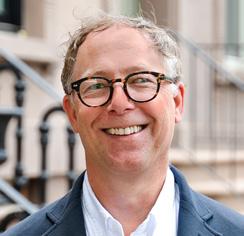
Our Talented Team of Experts

















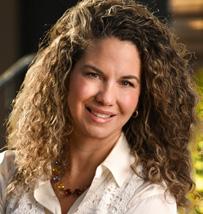


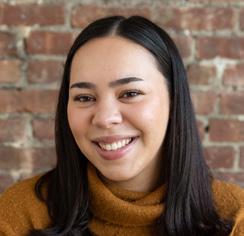

4Q2022 | JERSEY CITY | 21
Sawyer Smith Principal Broker & Founder
Alex Chang Chief Happiness Officer
Katherine Silver Executive VP & Managing Broker
Jon Sisti Managing Broker
Dane Calcagni Executive Assistant & Community Relations
Mark Lawton Agent Coordinator Jaylen Molina Marketing Coordinator Adrienne Doyle Marketing Coordinator
Adriana Saber Alyson Morrissey Amanda Richard Amy DeAngelo Arpita Mendez Bo Dziman Brian Garcia Bruce Goodrich Caisy Falzone Daniel Konuch Daniela DePalma Daniella Storzillo David Domanich David Tucker Desiree Vega Donovan Cain Dylan Mader Einat Shmuel-Hamerman Elizabeth Cain Erin Bailey Francine Lauri George Haug George 'Buz' Keenan Gerard Stier Gregory Gohen Clarence Hampton Heather Levine Holly Kutilek Irene Perello Jacqueline Petruzzelli James Alvarez Janine Berger Jason Flesher Jennifer Giattino Jessica Hoppe Joseph Sisti Johanna Restrepo Katrina Spiratos Kyra Huxel Leda Duif Leilani Chin Liz Montalbano Marge Crimmins Marianne Hee Marie Rodrigues-Oldham Matthew Testa Megan Gulick Meredith Foster Michael Stefano Mildred Bourdoin Nancy Holland Nicholas Newman Preeti Poddar Rachel Kim Raymond Lynch Richard Basili Rita Sisti Ryan Wilman Sean Munroe Selina Vargas Sidney Jackson Stacy Wallace-Albert Stephen Braccioforte Stewart Liebman Syamak 'Mac' Ayoubi Ted Meyer Tien Nguyen Tom Gibbons Yessenia Agudelo Zach Jennings Not Pictured: Alexandra Petruzella Carin Zaleski Caroline Caulfield Harold Berlowe Lindsay Wiener Meghan Crehan Nicholas Romano Rosemary Caulfield Terry Buckley William Garcia Anat Patishi
Methodology
METRICS
SOURCE
CLOSED AND CONTRACTS SIGNED figures for the current quarter are based on reported transactions at the time the report is prepared and additional listings may be reported after this time period that can affect this data.
DAYS ON MARKET averages how long a unit takes to sell and is calculated from subtracting list date from contract date. Units on the market longer than three years and shorter than one day are considered outliers and removed from the data to prevent significant skewing.
AVERAGE PRICE PER SQUARE FOOT is the average price divided by the average square footage. This is only calculated from listings that have a reported square footage and includes only condominiums. We have deemed this data less relevant for single and multi-family listings and there is not enough data reported to provide an accurate number for those listings.
MEDIAN PRICE AND PRICE PER SQUARE FOOT are the middle or midpoint price where half of sales fall below and half fall above this number.
INVENTORY is a count of all units with a listing date within the measured time period. These listings were on the market within the quarter but may now be under contract or sold.
Figures in this report are based on publicly reported active, pending, and closed sales information via the Hudson County
Multiple Listing Service. The neighborhood designations are based on the determinations of the MLS Areas. Based on information from the MLS for the period of October 2021 through December 2022 as well as selected data from 2018 through 2022.
DISCLAIMER
Real estate agents affiliated with Corcoran Sawyer Smith are independent contractors and are not employees of Corcoran Sawyer Smith. All material presented herein is intended for information purposes only and has been compiled from sources deemed reliable. Though information is believed to be correct, it is presented subject to errors, omissions, changes or withdrawal notice.
Each office is independently owned and operated.
4Q2022 | JERSEY CITY | 22


