
Q3 2022 Market Report
HOBOKEN
With the rising interest rates and the tightening inventory, the number of transactions fell during the last quarter. The sale prices remained strong, and the properties sold at a healthy pace.
In the third quarter of 2022 in Hoboken, the transaction volume decreased by 30% from the same quarter of the previous year and by 23% from the second quarter. The number of new deals going in contract also decreased by 24% from the same quarter last year and by 30% from the second quarter.
However, the inventory decreased in the third quarter by 20% from the same quarter last year and by 33% from the second quarter. The properties didn’t stay on the market long either. The days on the market for the properties that closed in the third quarter was only 26 days on average. Condominiums sold at $787 per square foot, a 5% increase from the same quarter last year and a 2% decrease from the second quarter this year. Notably, the median sale price for single family homes was $2.25M, a 34% increase from a year ago and a 10% increase from the second quarter this year. The average single family sale price was $2.45M, a 37% increase from the same quarter last year and a 9% increase from the last quarter.
3Q2022 | HOBOKEN | 2
SALES | PAGE 3 INVENTORY | PAGE 5 PRICES | PAGE 6 NOTABLE SALES | PAGE 7 Contracts Signed 195 -24% YEAR OVER YEAR -30% QUARTER OVER QUARTER Closed Sales 249 -30% YEAR OVER YEAR -23% QUARTER OVER QUARTER Inventory 216 -20% YEAR OVER YEAR -33% QUARTER OVER QUARTER Days on Market 26 -13% YEAR OVER YEAR +8% QUARTER OVER QUARTER Median Price $810K +3% YEAR OVER YEAR +1% QUARTER OVER QUARTER Average PPSF $787 +5% YEAR OVER YEAR -2% QUARTER OVER QUARTER The CorcoranSS Report | 3Q | 2022 | Hoboken Overview
Sales
• During the third quarter of 2022, the sales volume decreased by 17% from the same quarter last year and by 11% from the second quarter.
• The number of transactions was down by 30% from the same quarter last year and by 23% from the previous quarter this year.
• The number of new contracts signed in the third quarter also decreased by 24% from the same quarter last year and 30% from the previous quarter.
• Properties stayed on the market only for 26 days average this quarter.
3Q22 3Q21 %CHG (YR) 2Q22 %CHG (QTR)
CLOSED SALES 249 354 -30% 324 -23%
SALES VOLUME $274M $330M -17% $308M -11%
CONTRACTS SIGNED 195 258 -24% 277 -30%
DAYS ON MARKET 26 30 -13% 24 8%
3Q2022 | HOBOKEN | 3
400 320 240 160 80 0 40 32 24 16 8 0 NUMBER OF CLOSED SALES DAYS ON MARKET Closed Sales CLOSED SALES AVERAGE DAYS ON MARKET 300 250 200 150 100 50 0 Contracts Signed NUMBER OF CONTRACTS SIGNED
3Q18 3Q19 3Q20 3Q21 3Q22 3Q18 3Q19 3Q20 3Q21 3Q22
CONTRACTS SIGNED
Condominium Sales
Days on Market by Price Range
3Q22 3Q21 %CHG (YR) 2Q22 %CHG (QTR)
CLOSED SALES 222 324 -31% 305 -27%
SALES VOLUME 207M 271M -24% 270M -23%
DAYS ON MARKET 25 29 -14% 23 9% 3Q22 3Q21 %CHG (YR) 2Q22 %CHG (QTR)
1-Familly Sales
CLOSED SALES 17 14 21% 13 31%
SALES VOLUME 41.7M 25M 67% 29.1M 43% DAYS ON MARKET 33 31 6% 32 3%
2-4 Family Sales
CLOSED SALES 10 16 -38% 6 67%
SALES VOLUME 25.2M 33.9M -26% 9.2M 174%
DAYS ON MARKET 30 36 -17% 61 -51%
UNDER $400K
$400K TO $700K $700K TO $1M $1M TO $1.5M $1.5M TO $2M $2M+
+174% -54%
UNDER $400K
-10% 0% -7%
-34%
3Q21 3Q22 74 days 26 days 23 days 21 days 23 days 38 days
$400K TO $700K $700K TO $1M $1M TO $1.5M $1.5M TO $2M $2M+
27 days 29 days 23 days 46 days 35 days 41 days
Days on Market by Bedroom Type
3Q21 3Q22 3Q21 %CHG (YR) 2Q22 %CHG (QTR)
STUDIO 1 BED 2 BED 3 BED
-8% -33%
+8% -23%
CHANGE (YEAR-OVER-YEAR) % 3Q22 3Q21 3Q22 48 days 28 days 24 days 22 days
52 days 26 days 31 days
CHANGE (YEAR-OVER-YEAR) % 3Q22 3Q21 33 days
3Q2022 | HOBOKEN | 4
STUDIO 1 BED 2 BED 3 BED
3Q2022 | HOBOKEN | 5 3Q22 3Q21 %CHG (YR) 2Q22 %CHG (QTR)
216 269 -20% 321 -33%
STUDIO 1 BEDROOM 2 BEDROOM 3+ BEDROOM STUDIO 1 BEDROOM 2 BEDROOM 3 BEDROOM 7 3 13 4 66 46 100 67 64 96 72 124 29 41 43 24 19 19 22 Breakdown of Active Listings BY ASKING PRICE RANGE BY BEDROOM TYPE 3Q21 3Q21 3Q22 3Q22 CHANGE (YEAR-OVER-YEAR) % 3Q22 3Q21 -46% -33% -34% -11% -14% +26% -25% -20% -31% -23% 360 315 270 225 180 135 90 45 0 NUMBER OF UNITS 51 0 14 28 42 56 70 0 25 50 75 100 125 0 20 40 60 80 100 0 25 50 75 100 3Q18 3Q19 3Q20 3Q21 3Q22 Inventory ACTIVE LISTINGS
INVENTORY
Inventory • The inventory stayed low during the third quarter with 20% less properties on the market from the same quarter last year and 33% less properties from the second quarter of this year. UNDER $400K $400K TO $700K $700K TO $1M $1M TO $1.5M $1.5M TO $2M $2M+ UNDER $400K $400K TO $700K $700K TO $1M $1M TO $1.5M $1.5M TO $2M $2M+
Condominium Prices
Prices
• The sale prices remained strong in the third quarter with an increase in median and average price.
• The median price for single family homes increased by 34% from the same quarter last year and by 10% from the previous quarter.
• The average dollar per square foot in condominium sales saw a 3% increase from the same quarter last year and a slight 2% decrease from the previous quarter.
3Q22 3Q21 %CHG (YR) 2Q22 %CHG (QTR)
MEDIAN PRICE $810,000 $785,000 3% $800,000 1%
AVERAGE PRICE $1,100,318 $932,653 18% $951,267 16%
MEDIAN PPSF $757 $737 3% $770 -2%
AVERAGE PPSF $787 $750 5% $802 -2%
PRICES 3Q22 3Q21 %CHG (YR) 2Q22 %CHG (QTR)
MEDIAN PRICE $742,500 $750,000 -1% $774,000 -4% AVERAGE PRICE $933,050 $837,131 11% $884,952 5%
MEDIAN PPSF $757 $737 3% $770 -2% AVERAGE PPSF $787 $750 5% $802 -2%
MEDIAN PRICE BY BEDROOM
STUDIO $452,214 $400,900 13% $408,500 11%
1 BEDROOM $572,556 $548,090 4% $527,414 9%
2 BEDROOM $821,737 $834,598 -2% $890,854 -8%
3 BEDROOM $1,526,671 $1,164,123 31% $1,536,262 -1%
1-Family Prices
PRICES 3Q22 3Q21 %CHG (YR) 2Q22 %CHG (QTR)
MEDIAN PRICE $2,250,000 $1,674,500 34% $2,050,000 10% AVERAGE PRICE $2,451,894 $1,787,446 37% $2,240,769 9%
2-4 Family Prices
PRICES 3Q22 3Q21 %CHG (YR) 2Q22 %CHG (QTR)
MEDIAN PRICE $1,925,000 $2,060,000 -7% $1,512,500 27% AVERAGE PRICE $2,516,000 $2,119,031 19% $1,528,333 65%
Median and Average Price
3Q2022 | HOBOKEN | 6
MEDIAN PRICE AVERAGE PRICE
$1.2M $960K $720K $480K $240K $0 SALE PRICE
MEDIAN PPSF Price Per
$800 $760 $720 $680 $640 $600 PRICE PER SQUARE FOOT 3Q18 3Q19 3Q20 3Q21 3Q22
AVERAGE PPSF
Square Foot
3Q18 3Q19 3Q20 3Q21 3Q22
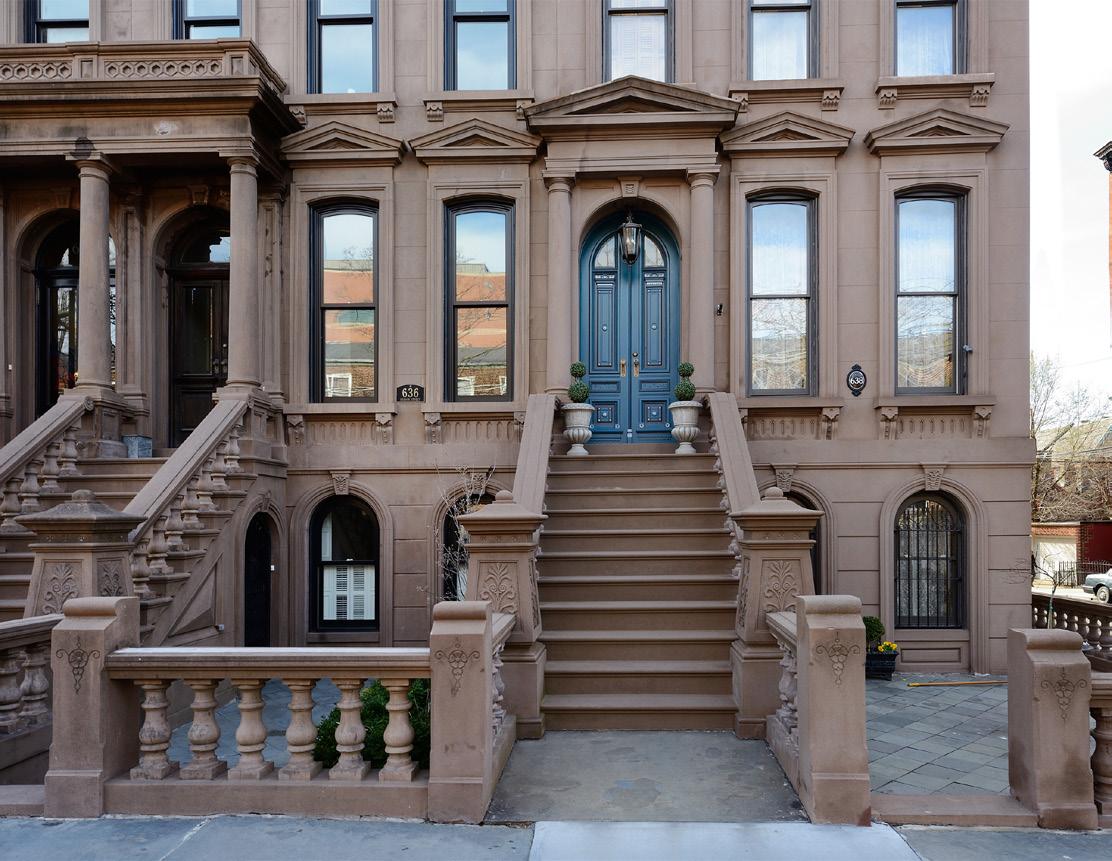


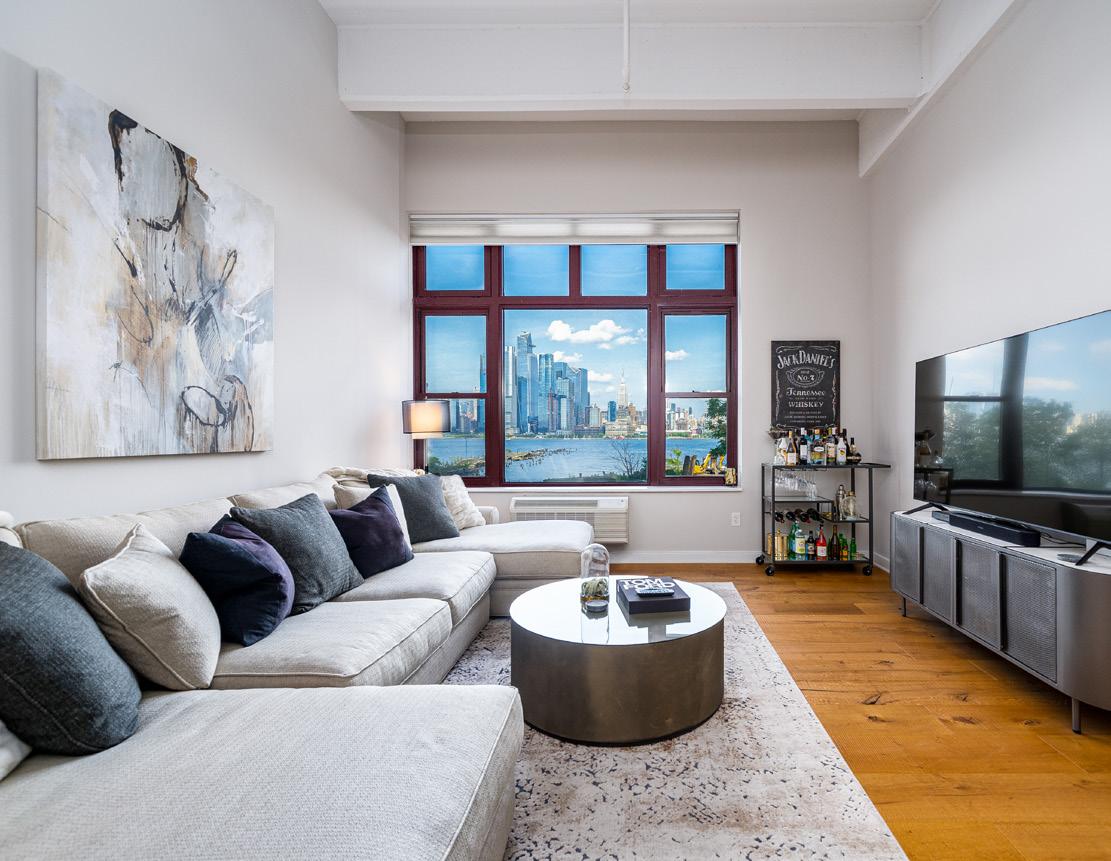
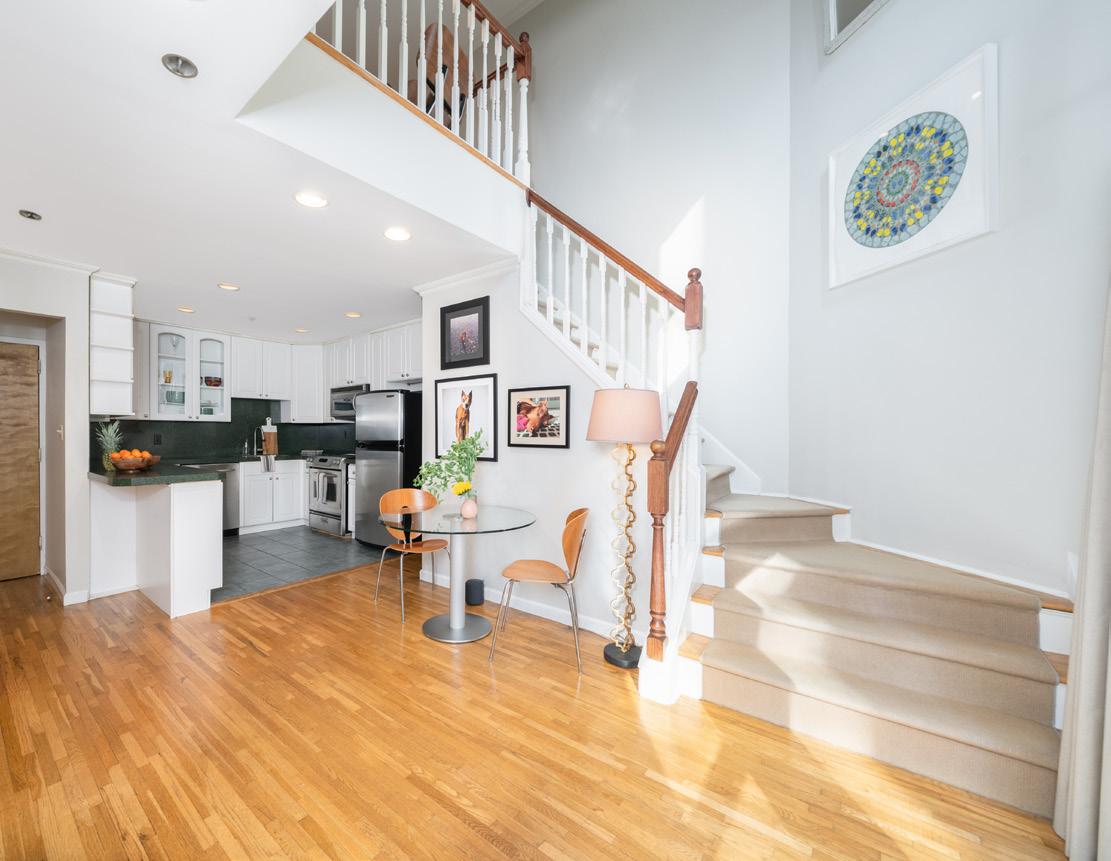
3Q2022 | HOBOKEN | 7 Notable Listings 517 Garden St | Asking $3.75M Listing Presented by Jon Sisti 638 Hudson St | Asking $3.75M Listing Presented by Jon Sisti 1500 Hudson St #2I | $1.39M Listing Presented by Jennifer Giattino 154 6th St | $1.36M Listing Presented by Dylan Mader 715 Grand St #3B | $1.625M Listing Presented by Dylan Mader 151 2nd St #1-2B | Asking $799K Listing Presented by Jacqueline Petruzzelli
Methodology
METRICS
SOURCE
CLOSED AND CONTRACTS SIGNED figures for the current quarter are based on reported transactions at the time the report is prepared and additional listings may be reported after this time period that can affect this data.
DAYS ON MARKET averages how long a unit takes to sell and is calculated from subtracting list date from contract date. Units on the market longer than three years and shorter than one day are considered outliers and removed from the data to prevent significant skewing.
AVERAGE PRICE PER SQUARE FOOT is the average price divided by the average square footage. This is only calculated from listings that have a reported square footage and includes only condominiums. We have deemed this data less relevant for single and multi-family listings and there is not enough data reported to provide an accurate number for those listings.
MEDIAN PRICE AND PRICE PER SQUARE FOOT are the middle or midpoint price where half of sales fall below and half fall above this number.
INVENTORY is a count of all units with a listing date within the measured time period. These listings were on the market within the quarter but may now be under contract or sold.
Figures in this report are based on publicly reported active, pending, and closed sales information via the Hudson County
Multiple Listing Service. The neighborhood designations are based on the determinations of the MLS Areas. Based on information from the MLS for the period of July 2021 through September 2022 as well as selected data from 2018 through 2022.
DISCLAIMER
Real estate agents affiliated with Corcoran Sawyer Smith are independent contractors and are not employees of Corcoran Sawyer Smith. All material presented herein is intended for information purposes only and has been compiled from sources deemed reliable. Though information is believed to be correct, it is presented subject to errors, omissions, changes or withdrawal notice.
Each office is independently owned and operated.
3Q2022 | HOBOKEN | 8