

Featured On the Cover
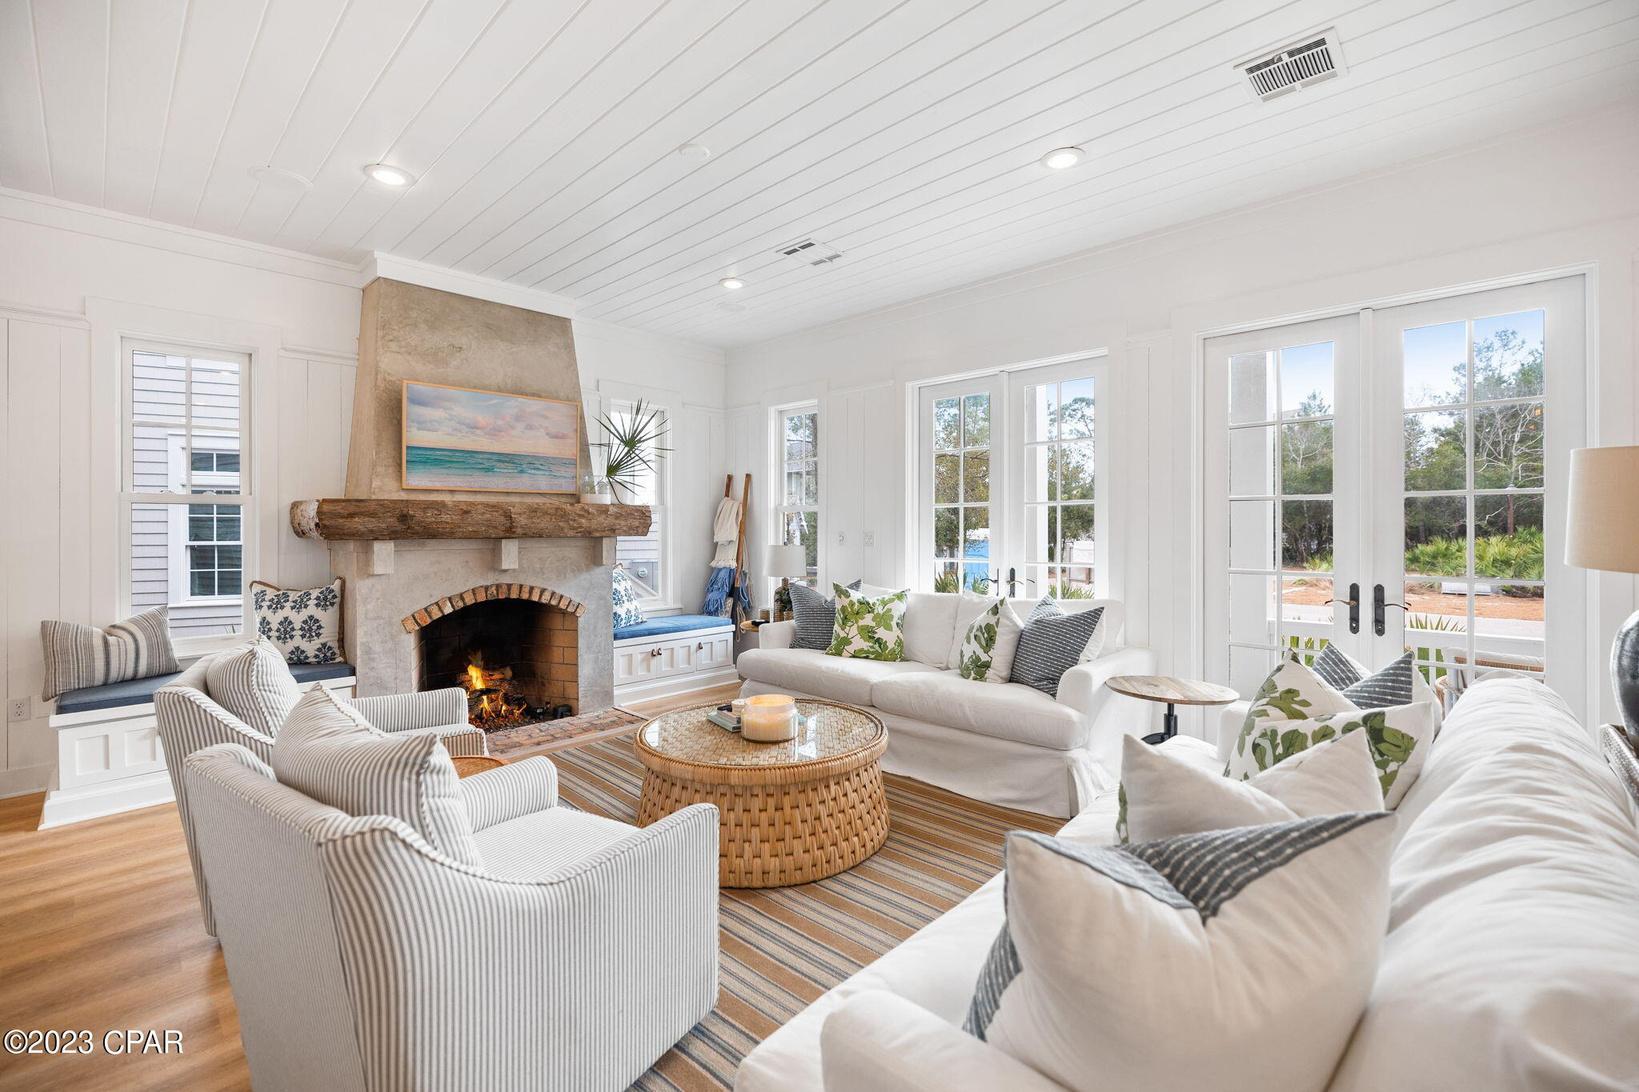
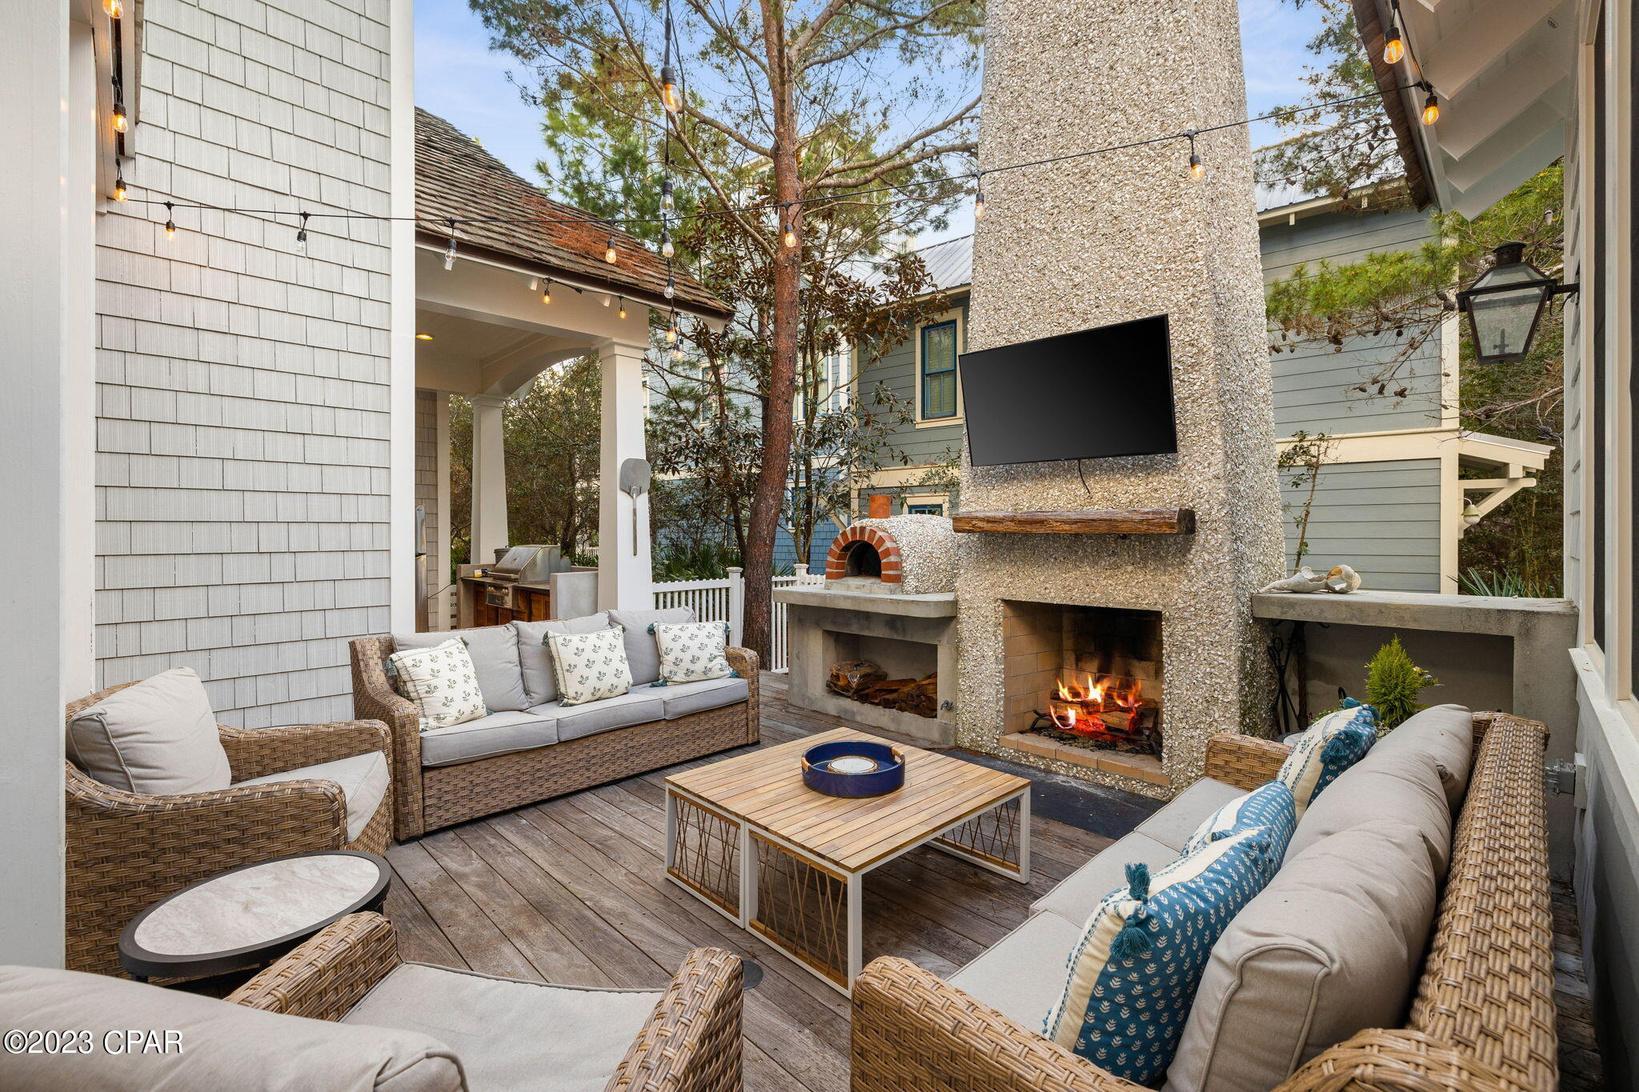
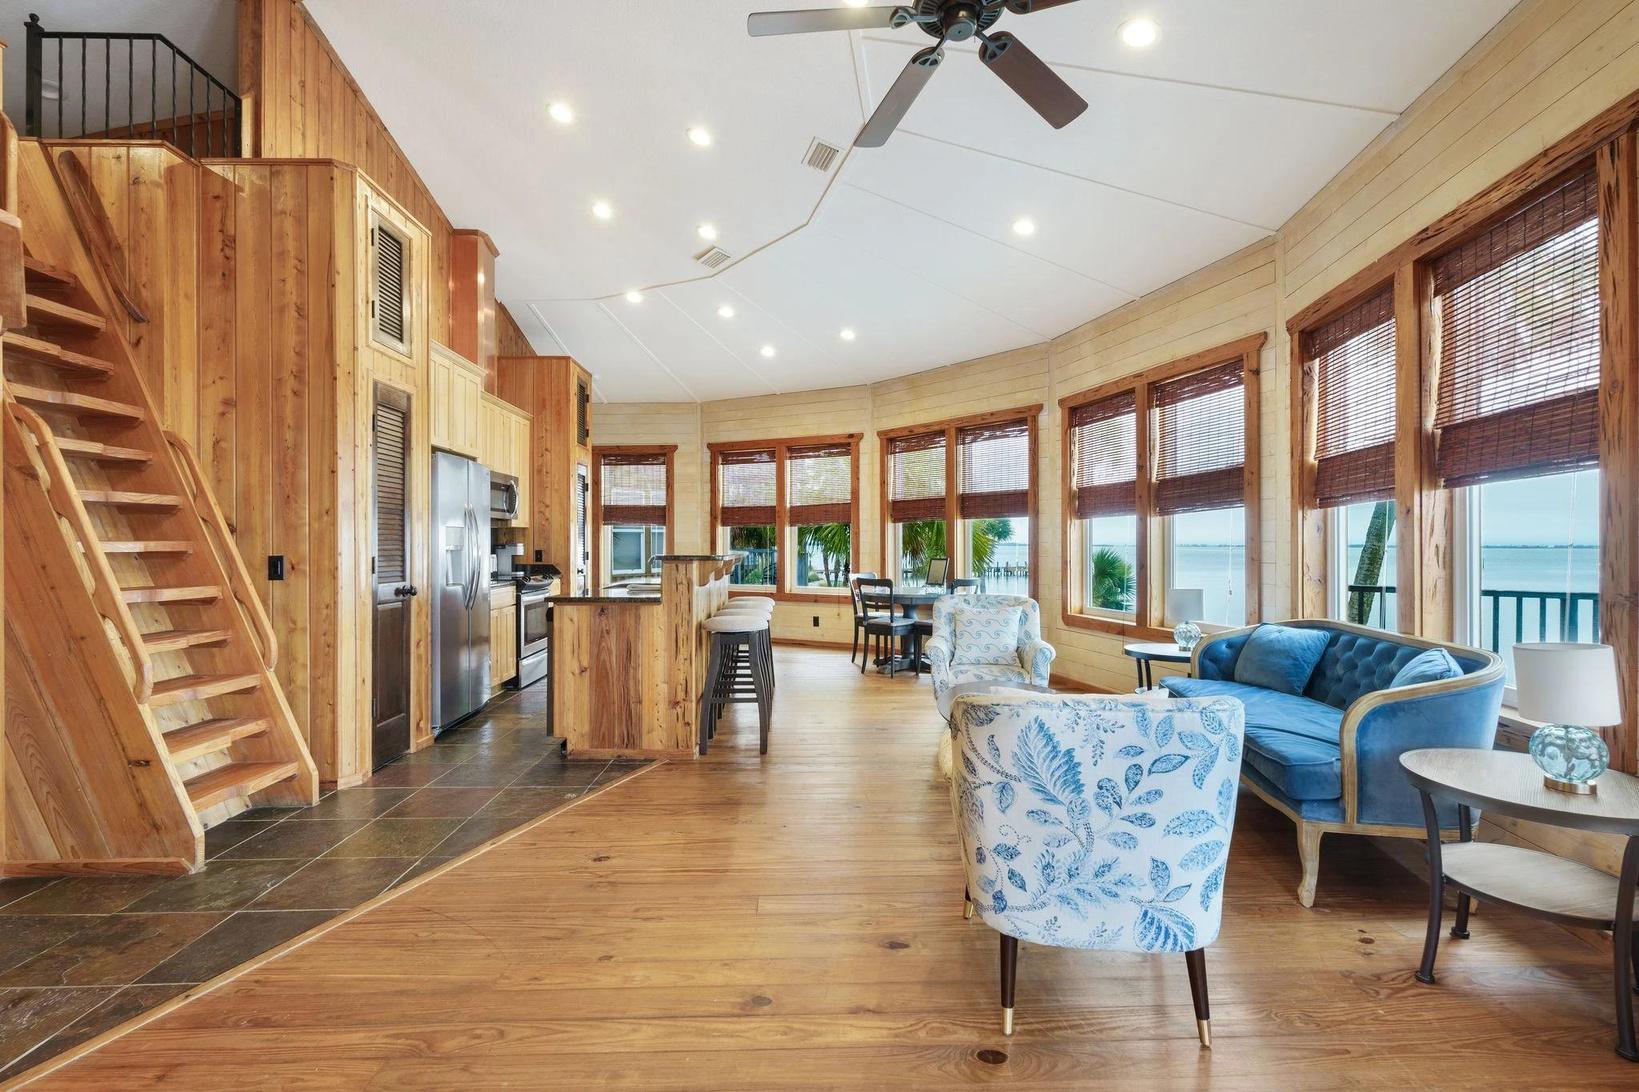
63 Creek Bridge Way
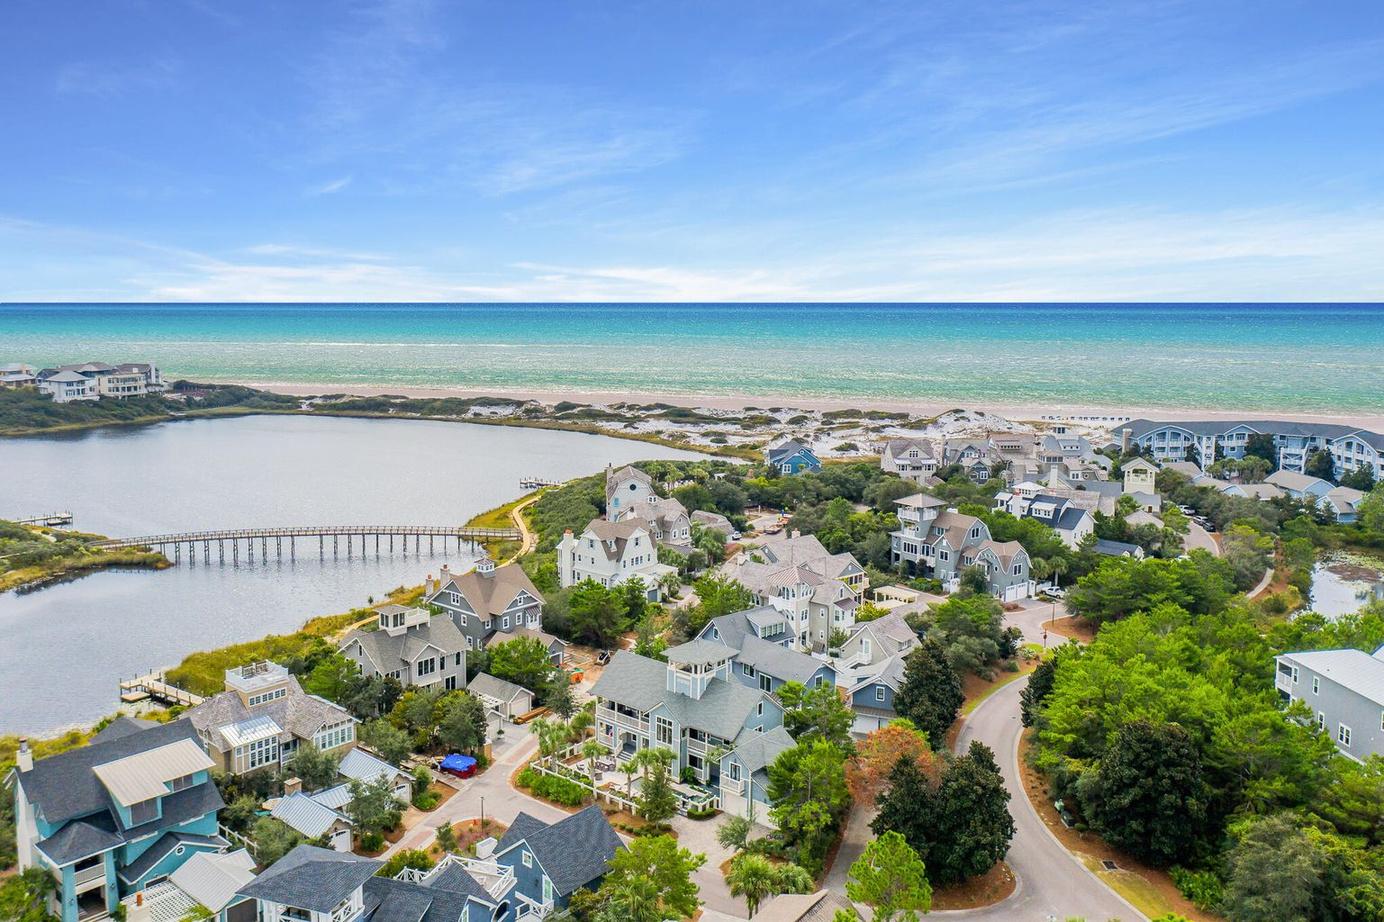
WaterSound Bridges
Carly Sostheim, REALTOR®

Offered at $4,100,000
"Imagine spending the evening beside the tabby stucco-shelled fireplace, smelling the aroma coming from the wood-fire pizza oven, or even cooking out with family and friends on the outdoor grill.
"The luxurious master suite grants private access to the outdoors through a covered, screened-in balcony"
PAGE 2 | 2023 FIRST QUARTER REVIEW
" This masterpiece would be an incredible investment property or a second home."
Scan To Learn More


Corcoran Reverie Noteworthy Statistics 2023 FIRST QUARTER REVIEW | PAGE 2 TABLE OF CONTENTS Featured Property .............. Page 1 Noteworthy Statistics Page 2 Nashville Market Review .............. Page 3 30A Market Review .............. Page 13 Sta isticsbasedontotalcosedsalesvoumeandindvidualoffceclosedsalesvolumewhereapplcabeasreportedbyEmeraldCoastAssocationofRealtors &Real racson01/10/2023forthetimeperiodbeginningon01/01/2022and endngon12/31/2022 Sourcedataisdeemedrelablebutnotguaranteed Destin Market Review .............. Page 21 Panama City Beach Market Review Page 31 Panama City Market Review .............. Page 37 2023 TOP 500 BY VOLUME TOP MOVER TRANSACTION BILLIONAIRE'S CLUB NATION'S BEST TOP MOVER VOLUME
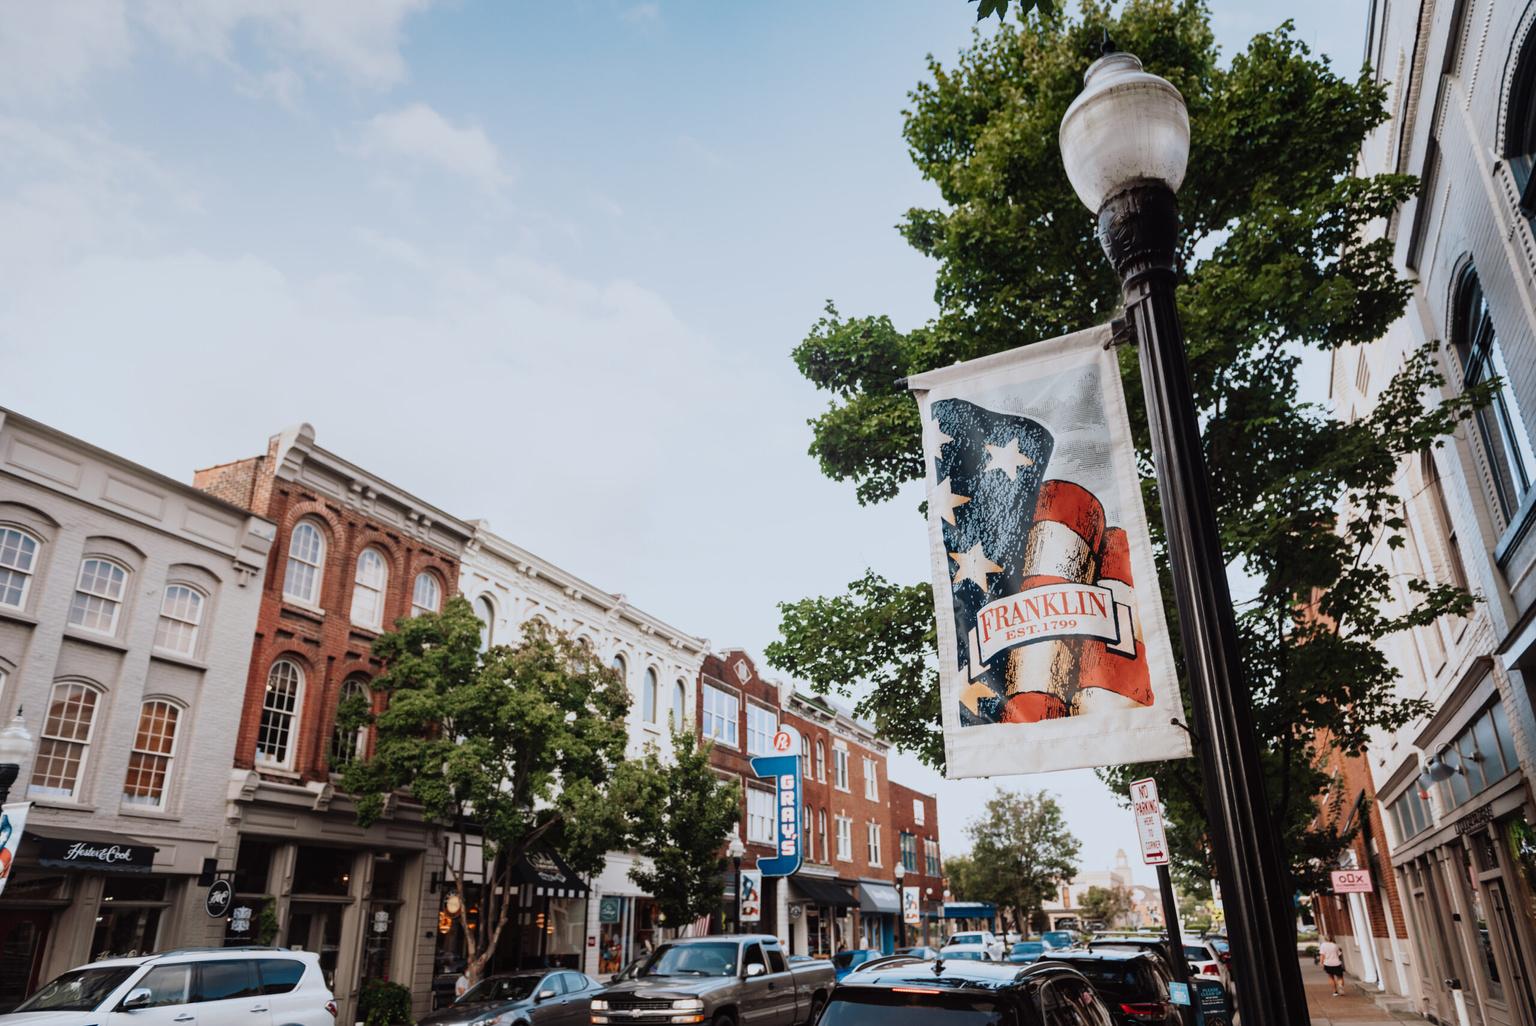
Nashville,Tennessee
storytellers dreams
Acityof and whereallarewelcome.
Now more than ever, Nashville is on the radar. Named one of the “Best Places to Travel” by Travel + Leisure, one of the “Top Places to Go” by The New York Times and one of the “Destinations You Don’t Want to Miss Out On” by Conde Nast Traveler, Nashville offers everything from an electrifying multigenre music scene, award-winning cuisine, historic homes, world-class art, a myriad of attractions, unique shopping, college and professional sports, and more.

A city with a backbeat and a twang that never forgets its roots. As the “Country Music Capital of the World,” Nashville is world-renowned for its music and honky-tonks Although music influences virtually every aspect of modern life in the cosmopolitan city, Nashville has a diverse and storied history. While many people know that the city was founded on Christmas Eve in 1779, most do not know that President Roosevelt crafted the phrase “good to the last drop.”
Nashville is widely known as Music City–and for good reason. But music’ s not the only thing that makes the city famous. Whether you ’ re a foodie, a history buff, or simply looking for a fun vacation destination, Nashville offers exciting and unique experiences for all ages and interests. If you appreciate art, Nashville’ s got something for you, too. Whether it’ s a walking tour of the city’ s many murals or a day spent at a world-renowned museum, there’ s plenty of beauty to take in around Music City Nashville’ s got sports fans covered, too Whether you ’ re a fan of football, hockey, racing, or baseball, there’ s a team for you to root for in Music City.
PAGE 3 | 2023 FIRST
QUARTER REVIEW


Number of Sales Average Sales Price +9% YEAR OVER YEAR $765K Percentage of List Sold 97% Average List Price +14% YEAR OVER YEAR $790K Average Price per Sq Foot +103% YEAR OVER YEAR $640 Average Days on Market +146% YEAR OVER YEAR 32 Median Sales Price +3% YEAR OVER YEAR $565K 2023 FIRST QUARTER REVIEW | PAGE 4


Number of Sales R Average Sales Price +8% YEAR OVER YEAR $465K Percentage of List Sold 97% Average List Price +13% YEAR OVER YEAR $476K Average Price per Sq Foot +8% YEAR OVER YEAR $384 Average Days on Market +131% YEAR OVER YEAR 30 Median Sales Price -2% YEAR OVER YEAR $353K PAGE 5 | 2023 FIRST QUARTER REVIEW
Williamson County SINGLE-FAMILY RESIDENCE SALES JANUARY 2023- MARCH 2023 Number of Sales -16% YEAR OVER YEAR 819 AverageSalesPrice -1% YEAR OVER YEAR $1.09M PercentageofListSold 98% AverageListPrice +4% YEAR OVER YEAR $1.11M 2023 FIRST QUARTER REVIEW | PAGE 6 Al 2023 data is provided by Realtracs as provided by Greater Nashv lle Assoc ation of Realtors and is deemed reliable as of April 10, 2023 but is not guaranteed and should be ndependent y ver fied AveragePriceperSqFoot -1% YEAR OVER YEAR $312 AverageDaysonMarket +227% YEAR OVER YEAR 36 MedianSalesPrice +7% YEAR OVER YEAR $875K
City of Franklin SINGLE-FAMILY RESIDENCE SALES JANUARY 2023- MARCH 2023 Number of Sales -1% YEAR OVER YEAR 361 AverageSalesPrice -10% YEAR OVER YEAR $1.05M PercentageofListSold 98% AverageListPrice -6% YEAR OVER YEAR $1.08M AveragePriceperSqFoot -7% YEAR OVER YEAR $330 AverageDaysonMarket +200% YEAR OVER YEAR 30 MedianSalesPrice +9% YEAR OVER YEAR $925K Al 2023 data is provided by Realtracs as prov ded by Greater Nashvi le Association of Rea tors and s deemed reliable as of Apr l 10, 2023 but is not guaranteed and should be independently verified PAGE 7 | 2023 FIRST QUARTER REVIEW
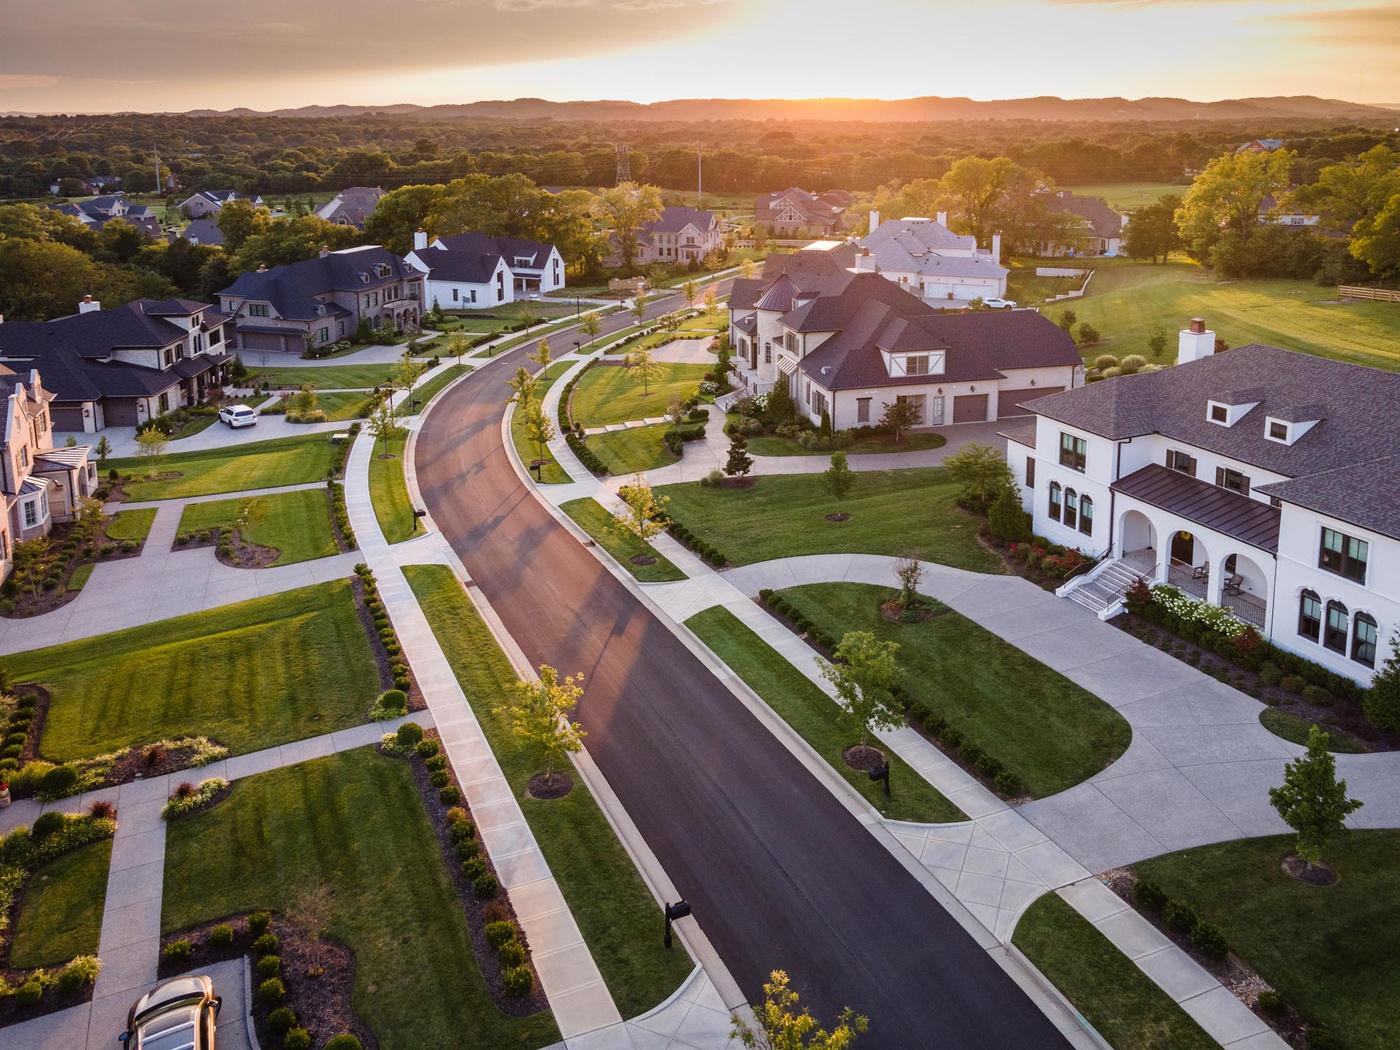
Brentwood SINGLE-FAMILY RESIDENCE SALES JANUARY 2023- MARCH 2023 Number of Sales -28% YEAR OVER YEAR 133 AverageSalesPrice +7% YEAR OVER YEAR $1.54M PercentageofListSold 97% AverageListPrice +10% YEAR OVER YEAR $1.54M AveragePriceperSqFoot +7% YEAR OVER YEAR $337 AverageDaysonMarket +200% YEAR OVER YEAR 36 MedianSalesPrice +3% YEAR OVER YEAR $1.15M All 2023 data s provided by Realtracs as prov ded by Greater Nashvi le Associat on of Rea tors and s deemed reliab e as of Apri 10, 2023 but is not guaranteed and should be independently ver fied 2023 FIRST QUARTER REVIEW | PAGE 8
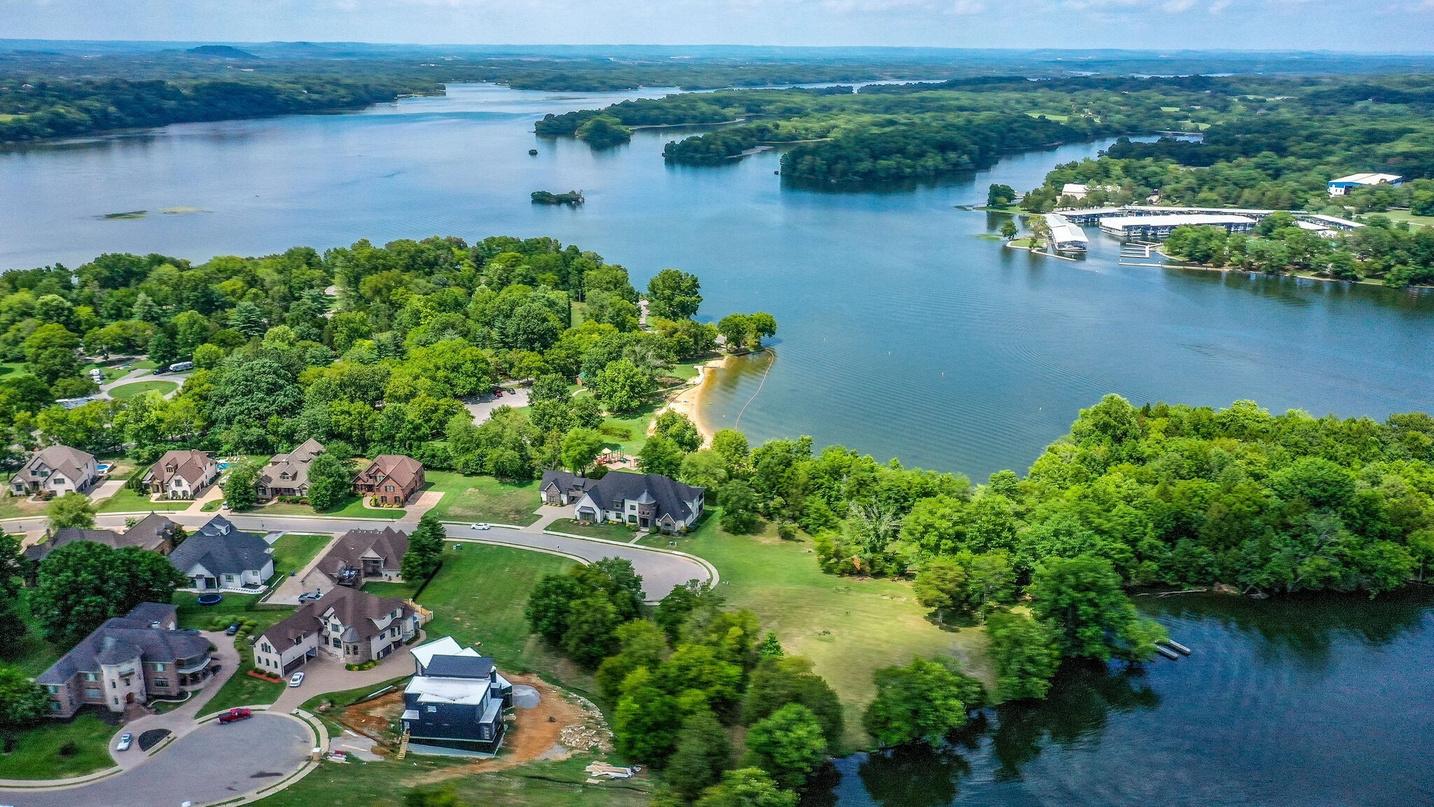
Wilson County SINGLE-FAMILY RESIDENCE SALES JANUARY 2023- MARCH 2023 Number of Sales -27% YEAR OVER YEAR 526 AverageSalesPrice -2% YEAR OVER YEAR $500K PercentageofListSold 98% AverageListPrice +1% YEAR OVER YEAR $509K AveragePriceperSqFoot +1% YEAR OVER YEAR $219 AverageDaysonMarket +190% YEAR OVER YEAR 29 MedianSalesPrice +2% YEAR OVER YEAR $459K Al 2023 data is provided by Realtracs as prov ded by Greater Nashvi le Association of Rea tors and s deemed reliable as of Apr l 10, 2023 but is not guaranteed and should be independently verified PAGE 9 | 2023 FIRST QUARTER REVIEW

Davidson County SINGLE-FAMILY RESIDENCE SALES JANUARY 2023- MARCH 2023 Number of Sales -26% YEAR OVER YEAR 1,752 AverageSalesPrice +9% YEAR OVER YEAR $653K PercentageofListSold 98% AverageListPrice +14% YEAR OVER YEAR $672K AveragePriceperSqFoot +80% YEAR OVER YEAR $505 AverageDaysonMarket +2% YEAR OVER YEAR 34 MedianSalesPrice +3% YEAR OVER YEAR $471K 2023 FIRST QUARTER REVIEW | PAGE 10 Al 2023 data is provided by Realtracs as provided by Greater Nashv lle Assoc ation of Realtors and is deemed reliable as of April 10, 2023 but is not guaranteed and should be ndependent y ver fied
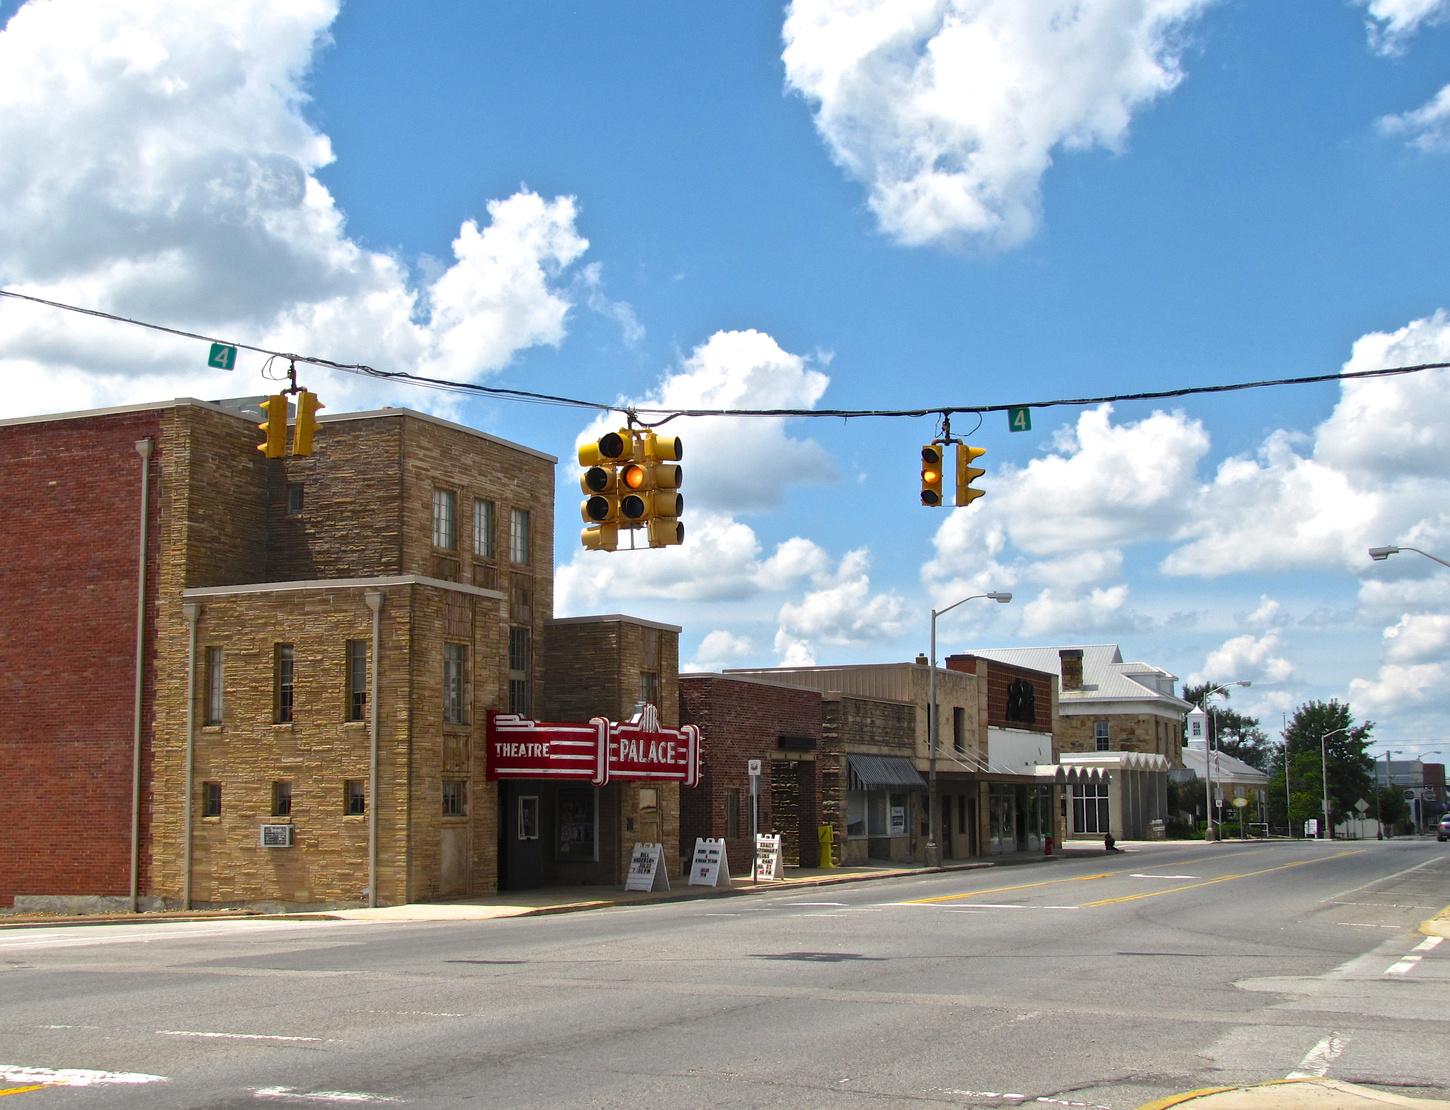
City of Crossville SINGLE-FAMILY RESIDENCE SALES JANUARY 2023- MARCH 2023 Number of Sales +50% YEAR OVER YEAR 24 AverageSalesPrice -21% YEAR OVER YEAR $235K PercentageofListSold 94% AverageListPrice -19% YEAR OVER YEAR $245K AveragePriceperSqFoot -6% YEAR OVER YEAR $153 AverageDaysonMarket +11% YEAR OVER YEAR 49 MedianSalesPrice -9% YEAR OVER YEAR $230K All 2023 data s provided by Realtracs as provided by Greater Nashvi le Associat on of Realtors and is deemed re iab e as of Apri 10, 2023 but s not guaranteed and shou d be independently ver fied PAGE 11 | 2023 FIRST QUARTER REVIEW


2023 FIRST QUARTER REVIEW | PAGE 12
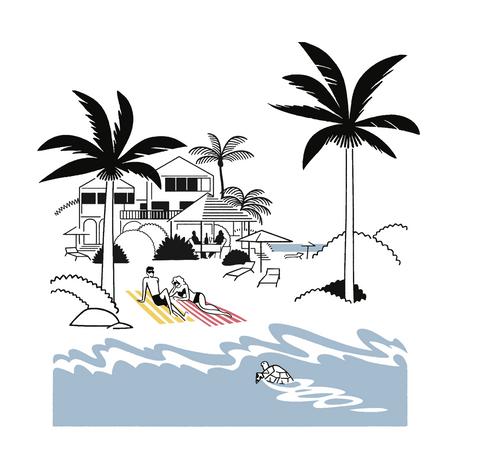
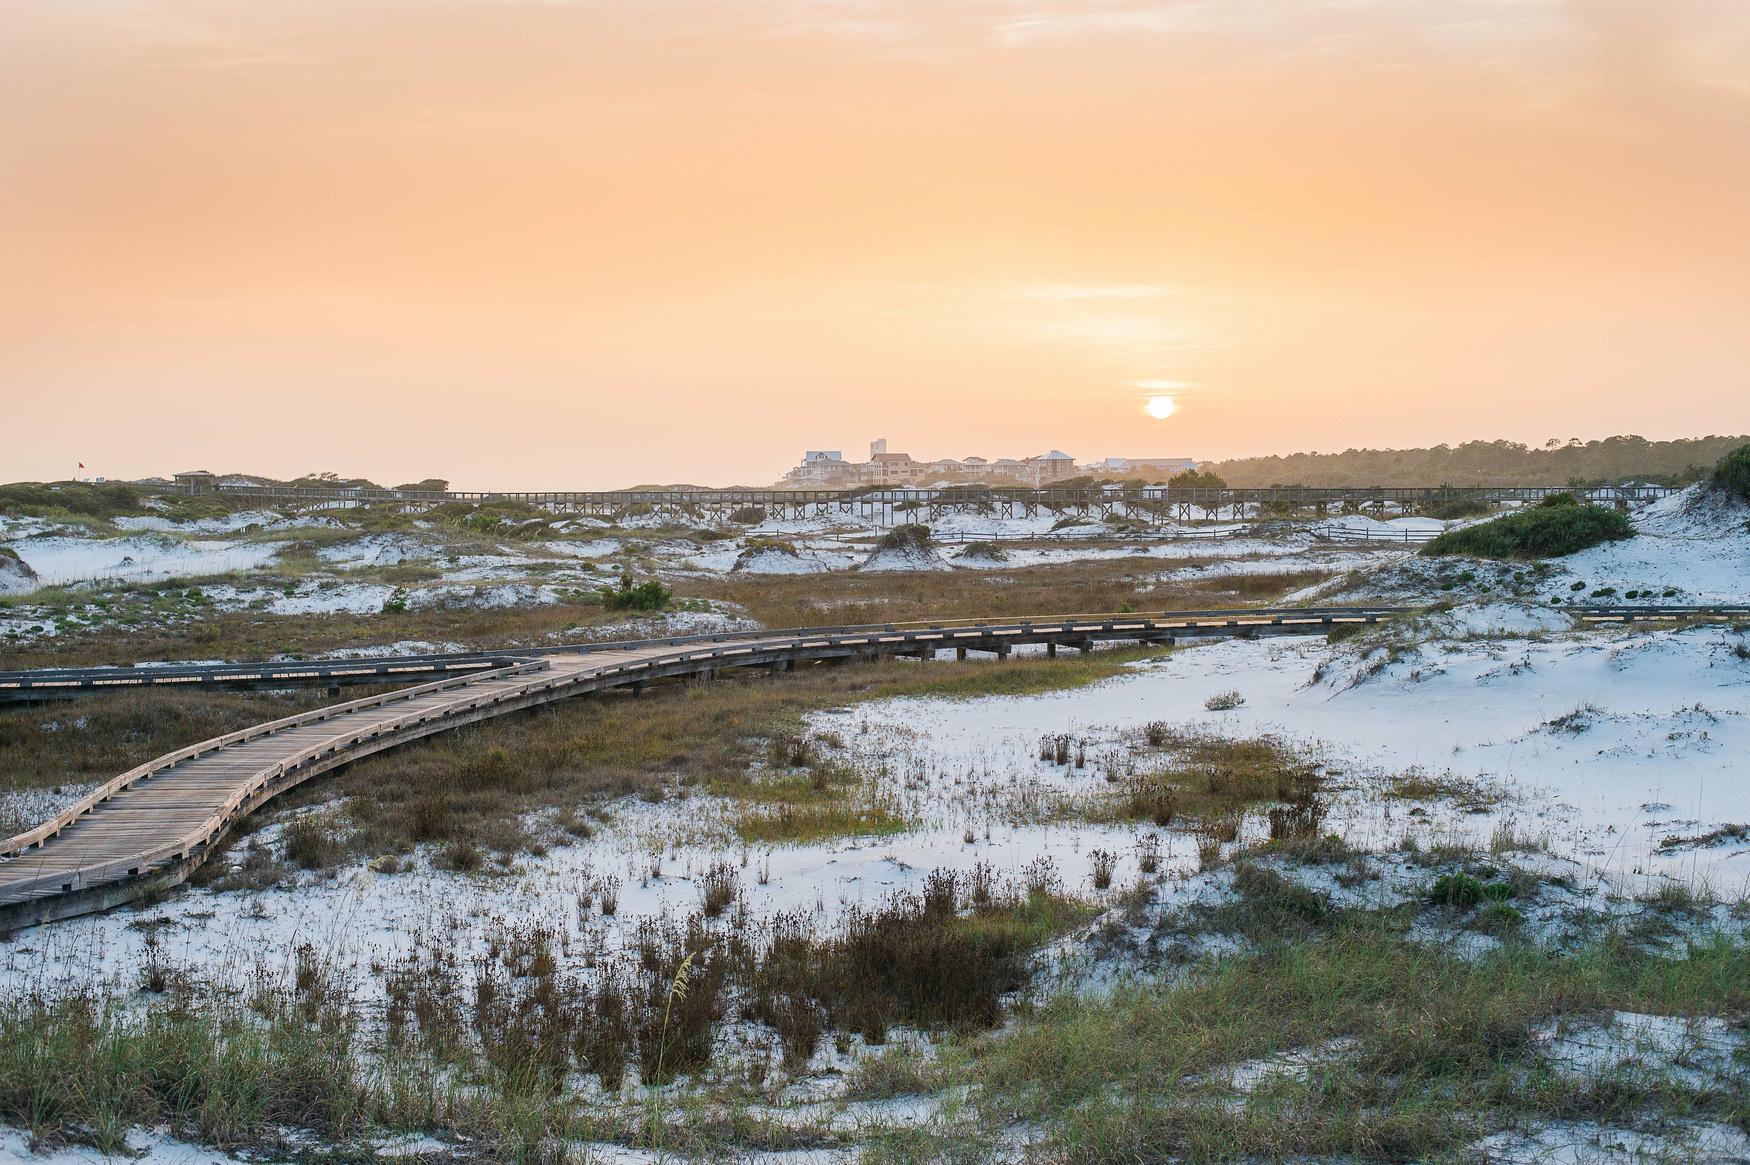
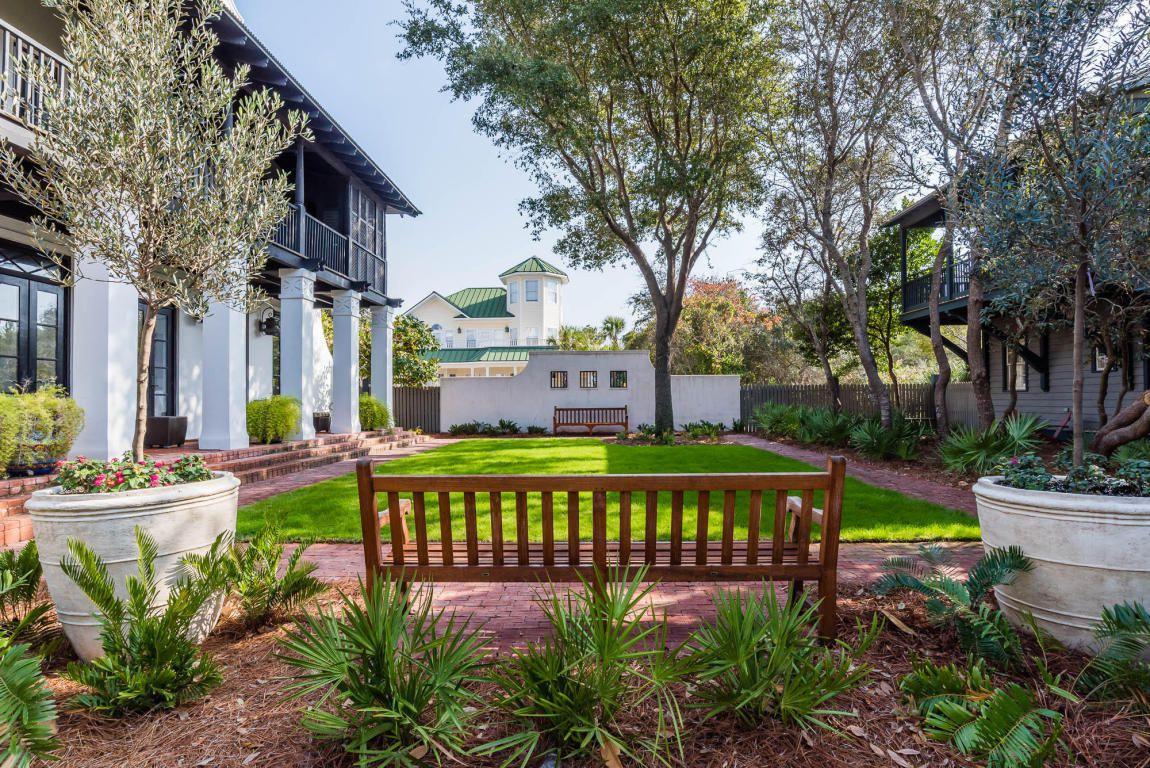
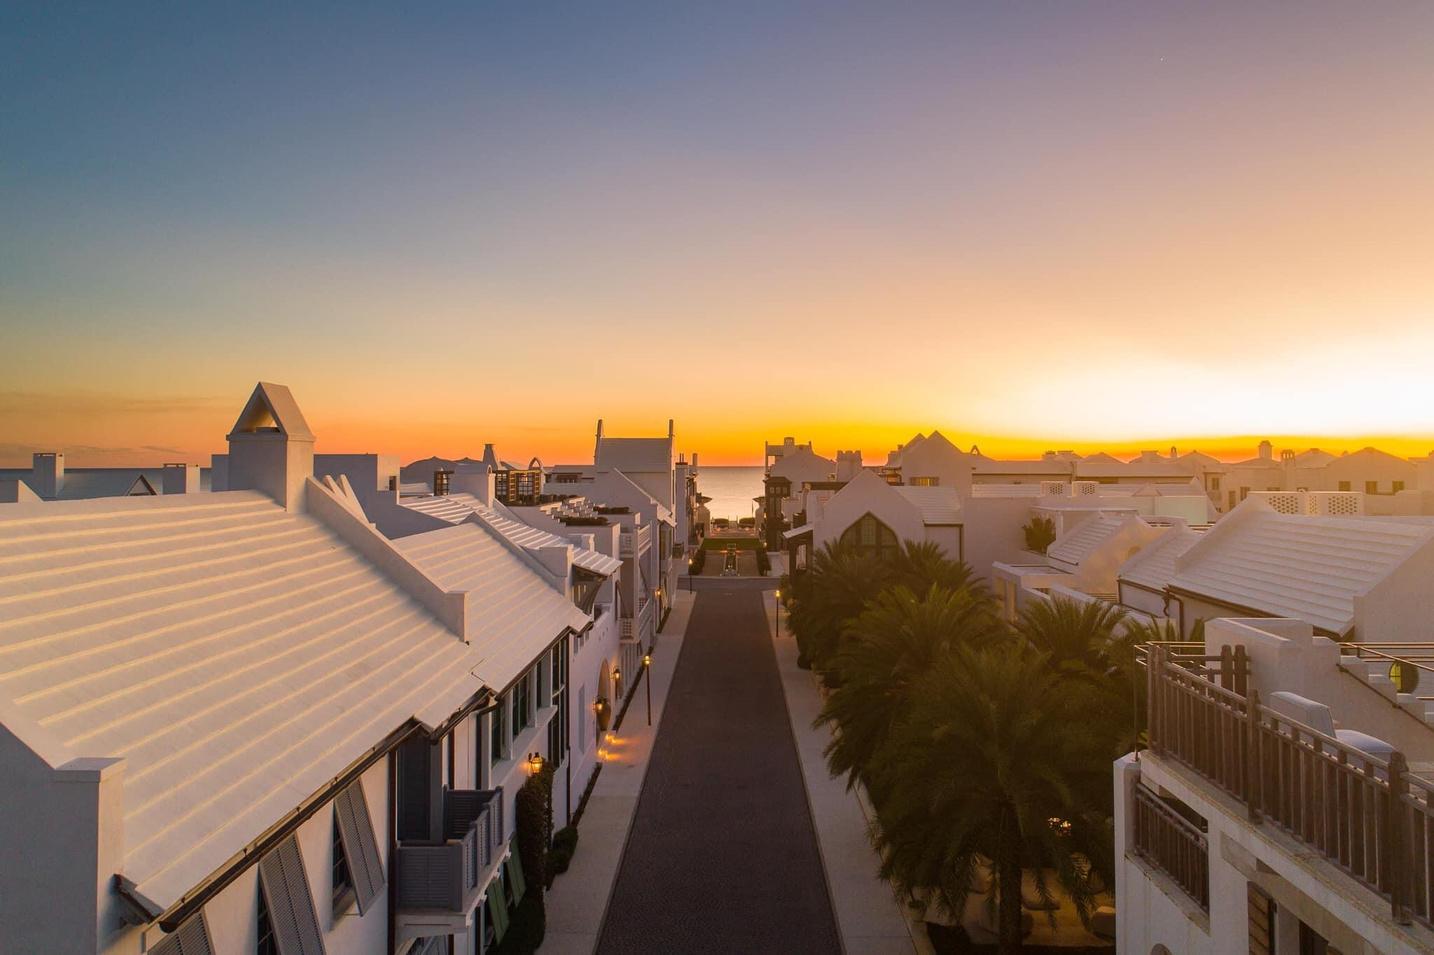
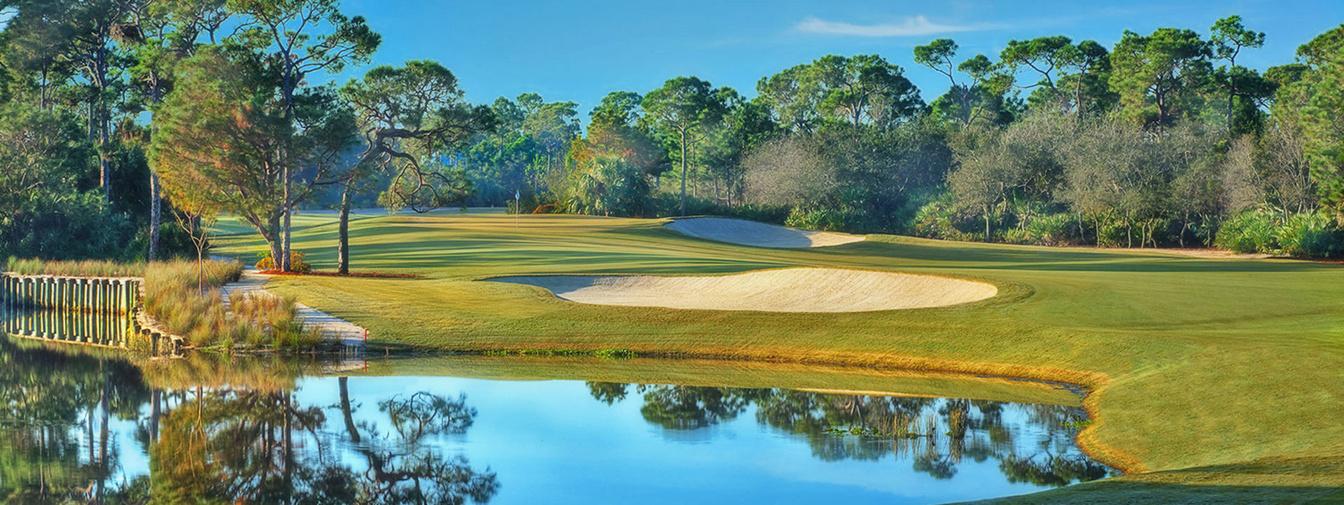
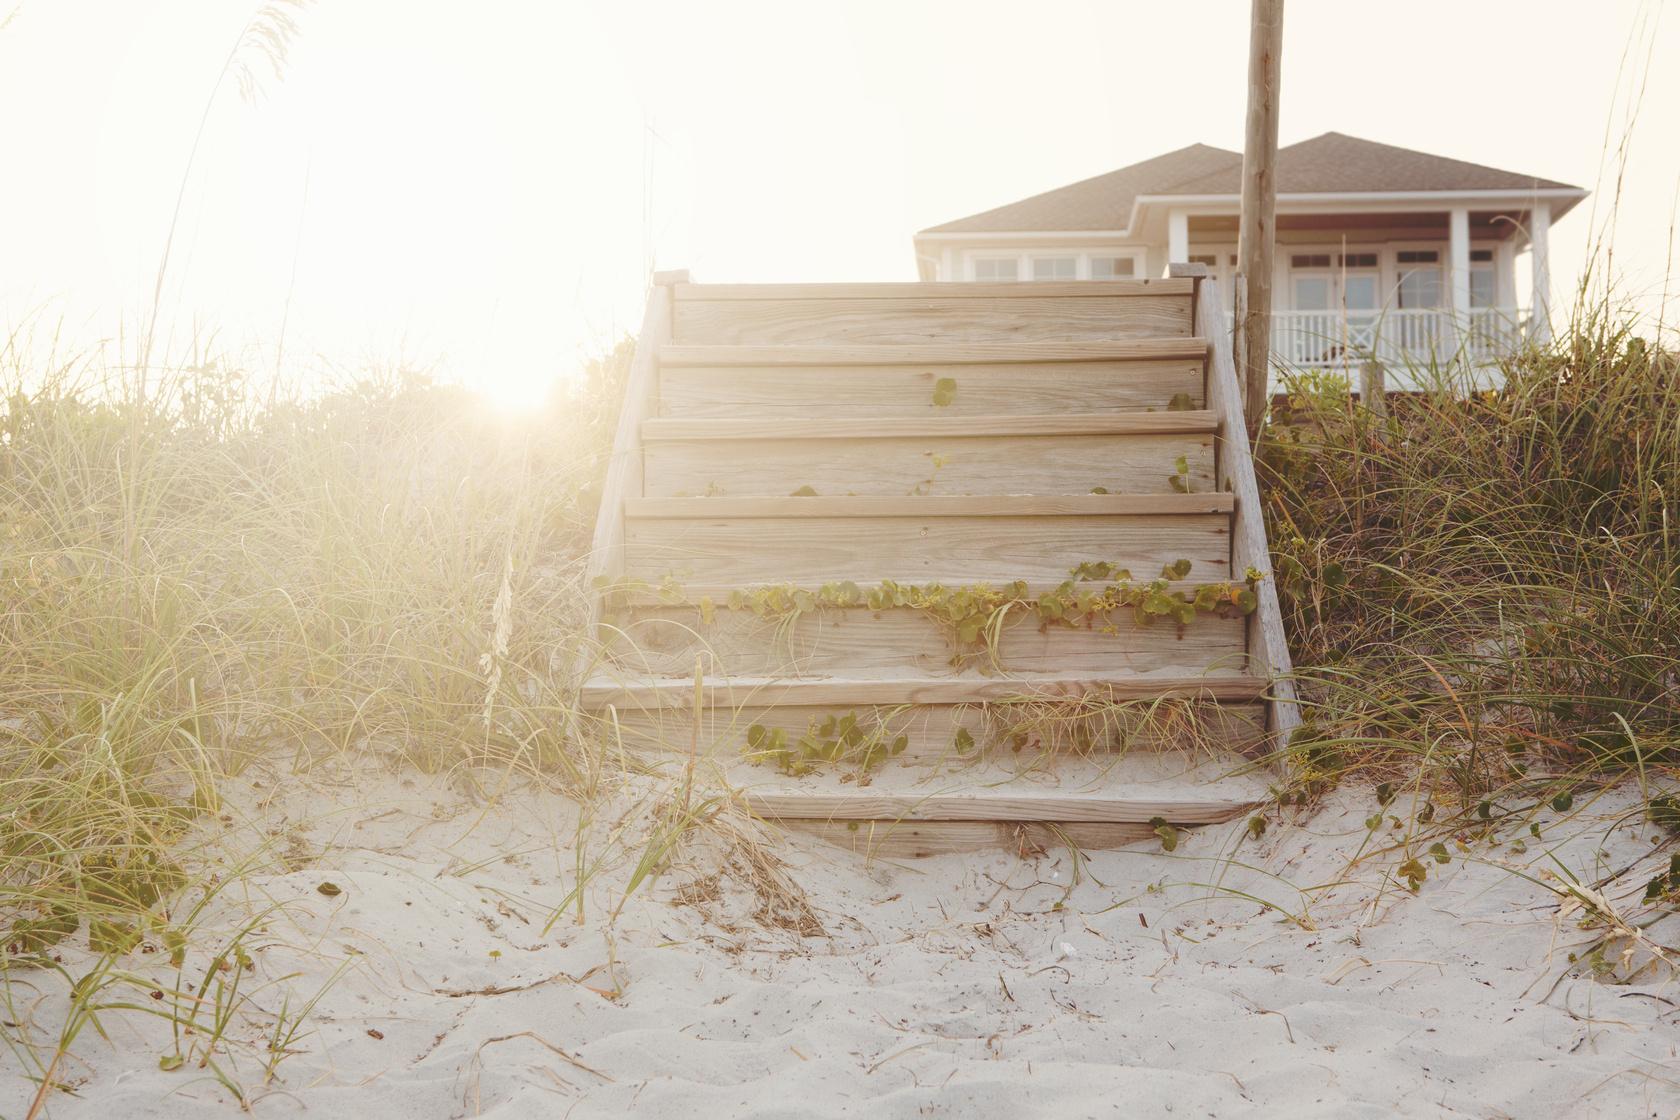
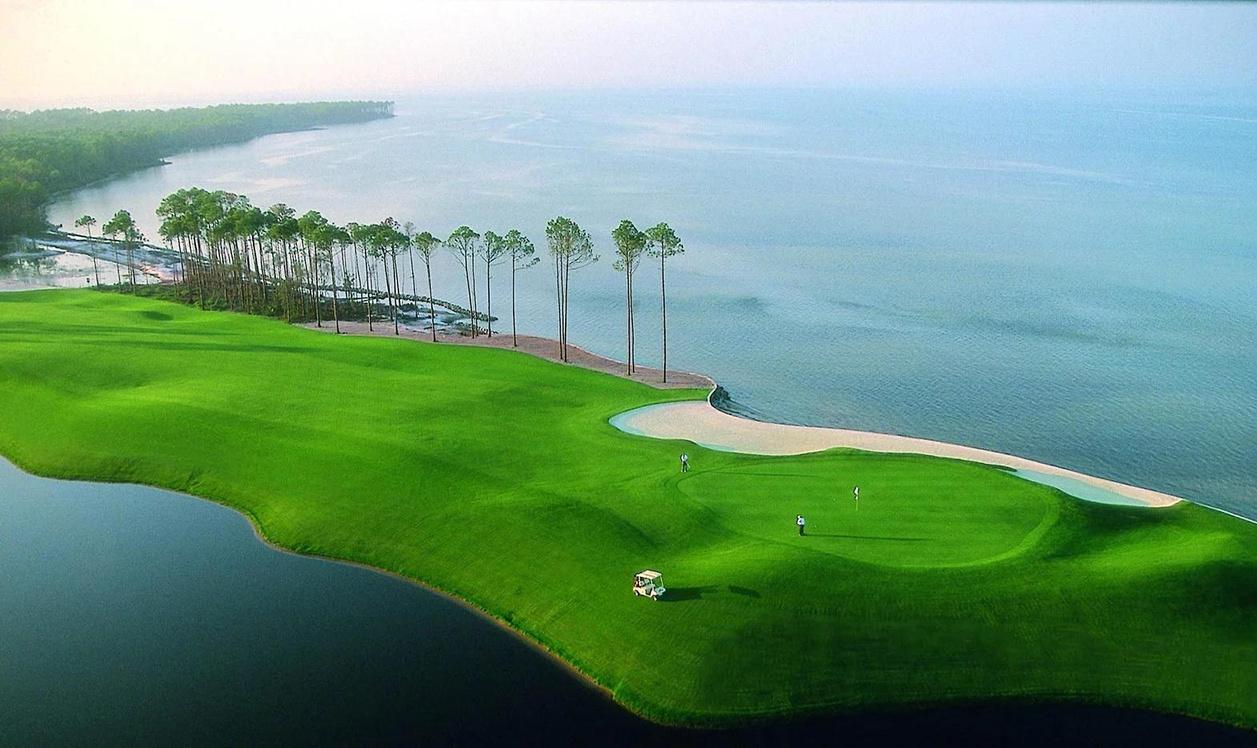
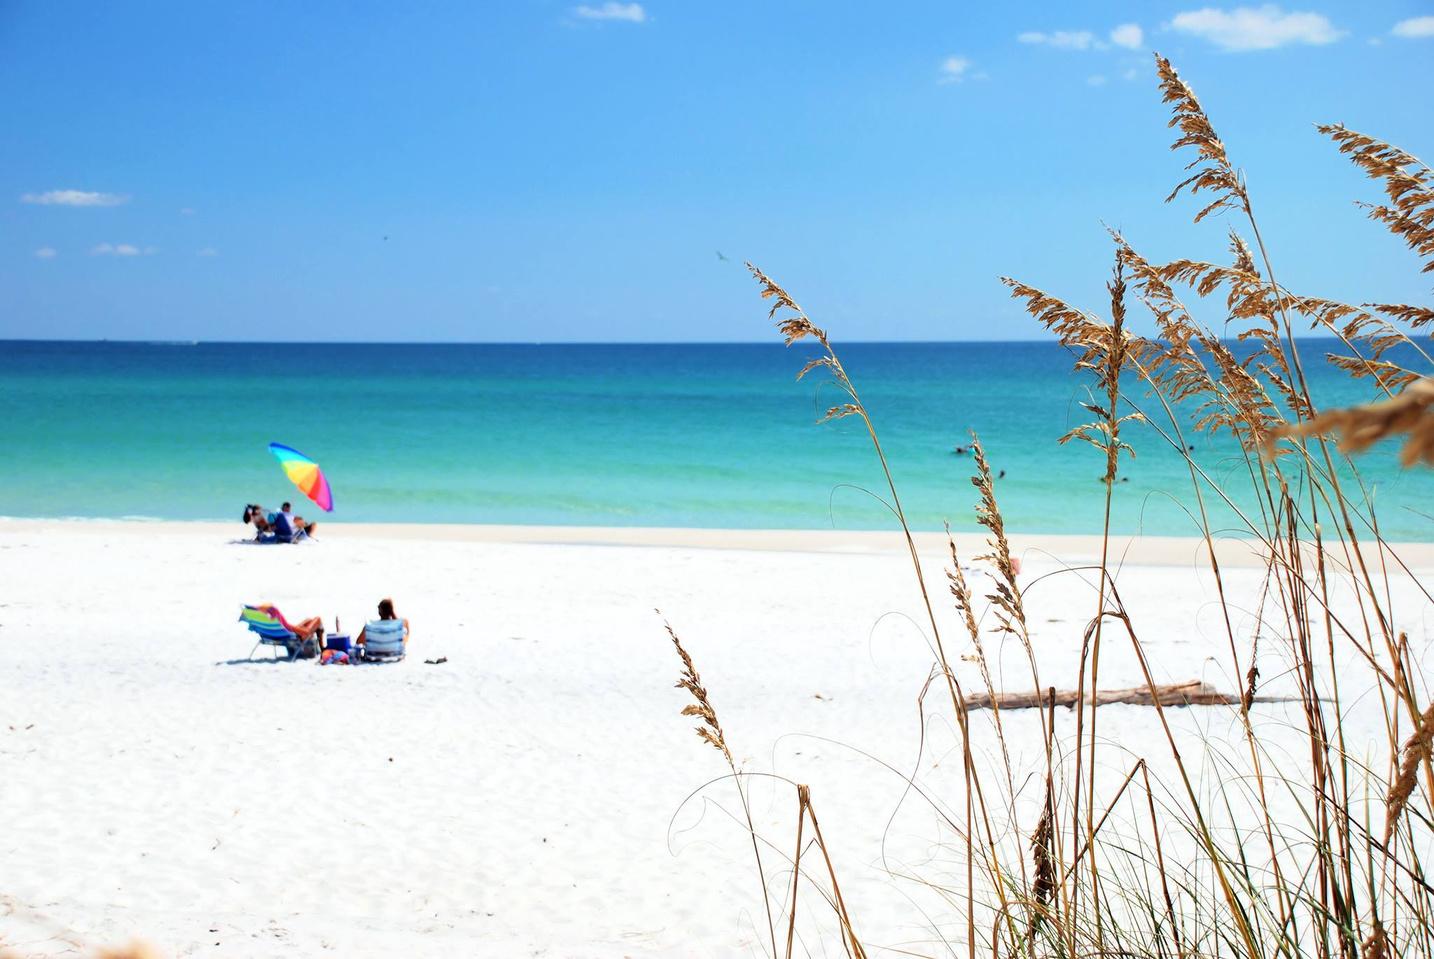
ScenicHighway30A,FL
By taking the scenic route along 30A, whether by car, bicycle or on foot, you ’ll journey past four state parks, 27 miles of greenway trails, eleven rare coastal dune lakes, and twelve beach communities. And you ’ll behold miles of stunningly beautiful beaches. It is an exciting and eclectic mix of hot Caribbean colors and soft pastels, with architecture to match each beach community’ s aesthetic, whether it be Old Florida’ s traditional 2-3 story homes, or the cottages of Seaside with white picket fences and pedestrian pathways to New Urbanism, or its miles of greenway trails connecting state parks, preserves and residential areas.
Remarkably, all of Scenic 30-A’ s famous beaches are certified as Blue Wave Beaches, akin to the Good Housekeeping Seal of Approval when it comes to cleanliness and safety. Scenic 30-A’ s shimmering sugar-fine sands combined with shades of turquoise-blue and emerald-green waters are breathtakingly beautiful, sun up or sundown. These beaches are naturally beautiful no dredging and filling have replaced the crystalline grains of sand that squeak when you walk on them. Beach nourishment, the formation of sand dunes, and other educational programs to Keep Off the Dunes are critical to protecting the Gulf Shores and Scenic 30-A’ s reputation as a tourist destination known for its world-class beaches.
2023 FIRST QUARTER REVIEW | PAGE 13
“Atsea,Ilearnedhow apersonneeds,nothow ” -RobinLeeGraham little much

Number of Sales -47% YEAR OVER YEAR 211 Average Sales Price -4% YEAR OVER YEAR $2.02M Percentage of List Sold 94% Average Active Price -5% YEAR OVER YEAR $3.35M Average Price per Sq Foot +1% YEAR OVER YEAR $762 Average Days on Market +36% YEAR OVER YEAR 68 Median Sales Price 0% YEAR OVER YEAR $1.40M Single Family Residence Sales 2023 First Quarter 2023 FIRST QUARTER REVIEW | PAGE 14
Rosemary Beach SINGLE-FAMILY RESIDENCE SALES JANUARY 2023- MARCH 2023 Number of Sales -83% YEAR OVER YEAR 3 AverageSalesPrice -4% YEAR OVER YEAR $4.28M PercentageofListSold 96% AverageActivePrice +10% YEAR OVER YEAR $6.09M AveragePriceperSqFoot +43% YEAR OVER YEAR $1,742 AverageDaysonMarket -86% YEAR OVER YEAR 12 MedianSalesPrice -3% YEAR OVER YEAR $3.82M A l 2023 data s provided by FLEX/MLS as prov ded by Centra Panhandle Assoc ation of Re ators / Emera d Coast Associat on of Rea tors and s deemed rel able as of April 10, 2023 but is not guaranteed and should be independently verif ed PAGE 15 | 2023 FIRST QUARTER REVIEW
Alys Beach SINGLE-FAMILY RESIDENCE SALES JANUARY 2023- MARCH 2023 Number of Sales -50% YEAR OVER YEAR 3 AverageSalesPrice +37% YEAR OVER YEAR $6.10M PercentageofListSold 96% AverageActivePrice +27% YEAR OVER YEAR $6.10M AveragePriceperSqFoot +25% YEAR OVER YEAR $1,655 AverageDaysonMarket +3,750% YEAR OVER YEAR 77 MedianSalesPrice +51% YEAR OVER YEAR $6.00M 2023 FIRST QUARTER REVIEW | PAGE 16 Al 2023 data is provided by FLEX/MLS as provided by Central Panhand e Associat on of Relators / Emerald Coast Assoc ation of Realtors and is deemed reliab e as of Apr l 10, 2023 but is not guaranteed and should be independently verif ed
WaterSound Beach SINGLE-FAMILY RESIDENCE SALES JANUARY 2023- MARCH 2023 Number of Sales -54% YEAR OVER YEAR 5 AverageSalesPrice +45%YEAR OVER YEAR $5.38M PercentageofListSold 95% AverageActivePrice +65% YEAR OVER YEAR $5.46M AveragePriceperSqFoot +47% YEAR OVER YEAR $1,427 AverageDaysonMarket +231 % YEAR OVER YEAR 159 MedianSalesPrice +32% YEAR OVER YEAR $5.25M A l 2023 data s provided by FLEX/MLS as prov ded by Centra Panhandle Assoc ation of Re ators / Emera d Coast Associat on of Rea tors and s deemed rel able as of April 10, 2023 but is not guaranteed and should be independently verif ed PAGE 17 | 2023 FIRST QUARTER REVIEW
Number of Sales -34% YEAR OVER YEAR 73 AverageSalesPrice +65% YEAR OVER YEAR $1.84M PercentageofListSold 98% AverageActivePrice -14% YEAR OVER YEAR $1.43M AveragePriceperSqFoot +43% YEAR OVER YEAR $1,249 AverageDaysonMarket +105% YEAR OVER YEAR 76 MedianSalesPrice +15% YEAR OVER YEAR $927K 30A CONDOMINIUM SALES JANUARY 2023- MARCH 2023 2023 FIRST QUARTER REVIEW | PAGE 18 Al 2023 data is provided by FLEX/MLS as provided by Central Panhand e Associat on of Relators / Emerald Coast Assoc ation of Realtors and is deemed reliab e as of Apr l 10, 2023 but is not guaranteed and should be independently verif ed
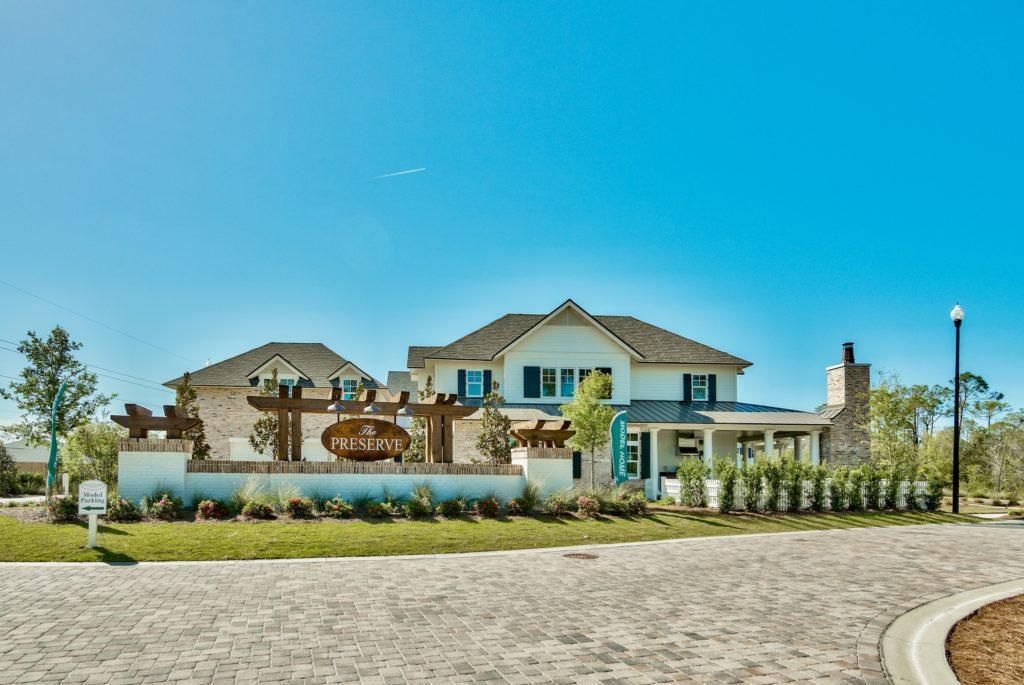
WaterSound Origins SINGLE-FAMILY RESIDENCE SALES JANUARY 2023- MARCH 2023 Number of Sales +22% YEAR OVER YEAR 44 AverageSalesPrice +12% YEAR OVER YEAR $1.15M PercentageofListSold 99% AverageActivePrice -2% YEAR OVER YEAR $1.45M AveragePriceperSqFoot +12% YEAR OVER YEAR $461 AverageDaysonMarket +128% YEAR OVER YEAR 32 MedianSalesPrice +6% YEAR OVER YEAR $989K SoWal.com A l 2023 data s provided by FLEX/MLS as prov ded by Centra Panhandle Assoc ation of Re ators / Emera d Coast Associat on of Rea tors and s deemed rel able as of April 10, 2023 but is not guaranteed and should be independently verif ed PAGE 19 | 2023 FIRST QUARTER REVIEW
Seagrove Beach SINGLE-FAMILY RESIDENCE SALES JANUARY 2023- MARCH 2023 Number of Sales -8% YEAR OVER YEAR 48 AverageSalesPrice -28% YEAR OVER YEAR $1.23M PercentageofListSold 98% AverageActivePrice -42% YEAR OVER YEAR $2.29M AveragePriceperSqFoot -16% YEAR OVER YEAR $492 AverageDaysonMarket +62% YEAR OVER YEAR 42 MedianSalesPrice +3% YEAR OVER YEAR $1.05M 2023 FIRST QUARTER REVIEW | PAGE 20 Al 2023 data is provided by FLEX/MLS as provided by Central Panhand e Associat on of Relators / Emerald Coast Assoc ation of Realtors and is deemed reliab e as of Apr l 10, 2023 but is not guaranteed and should be independently verif ed
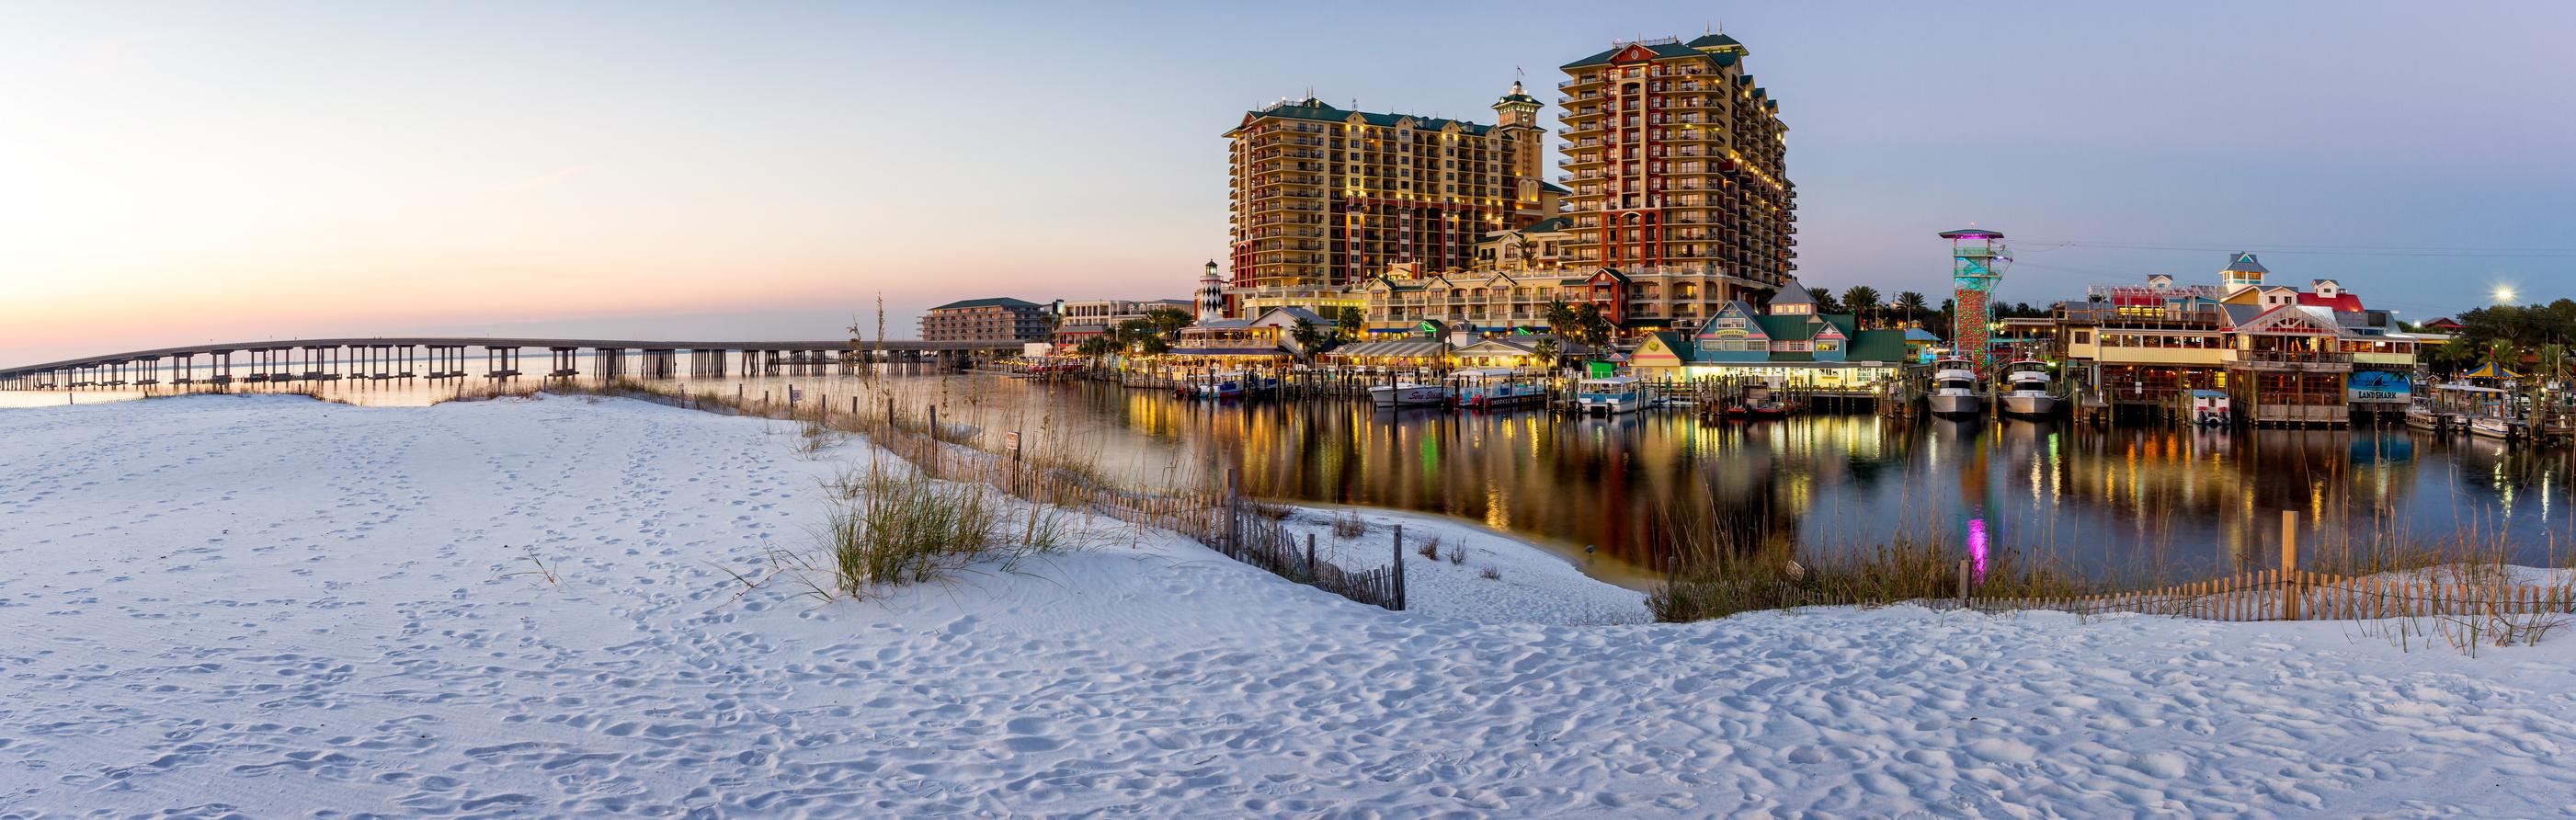
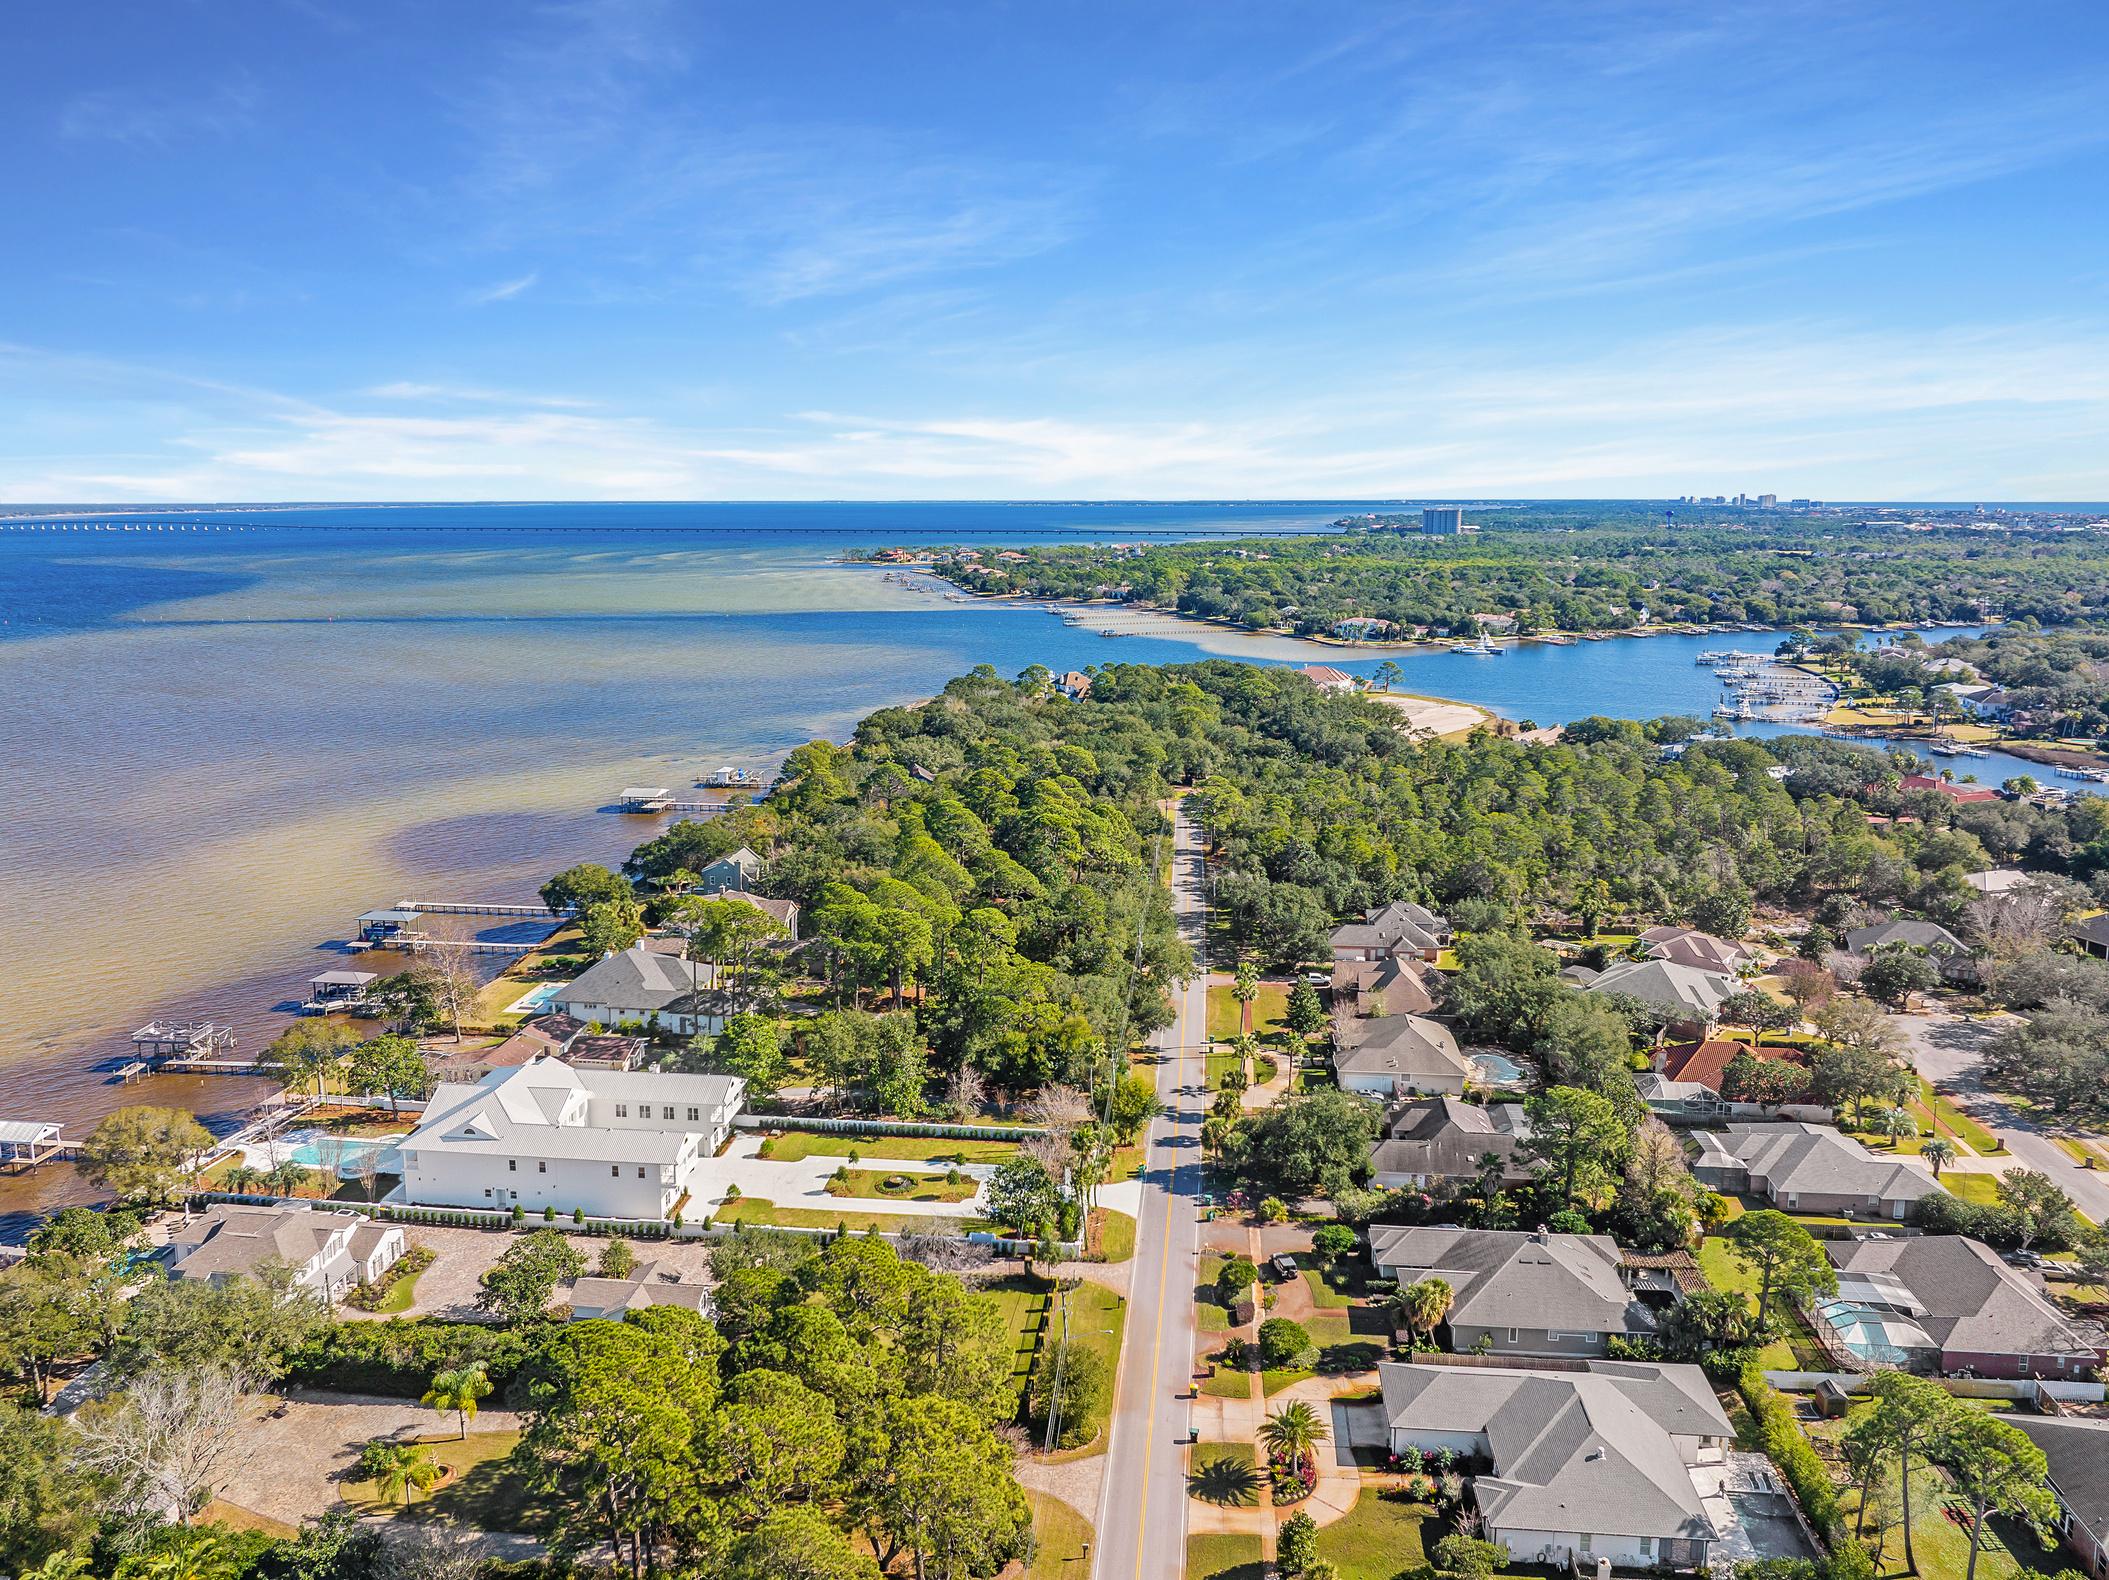
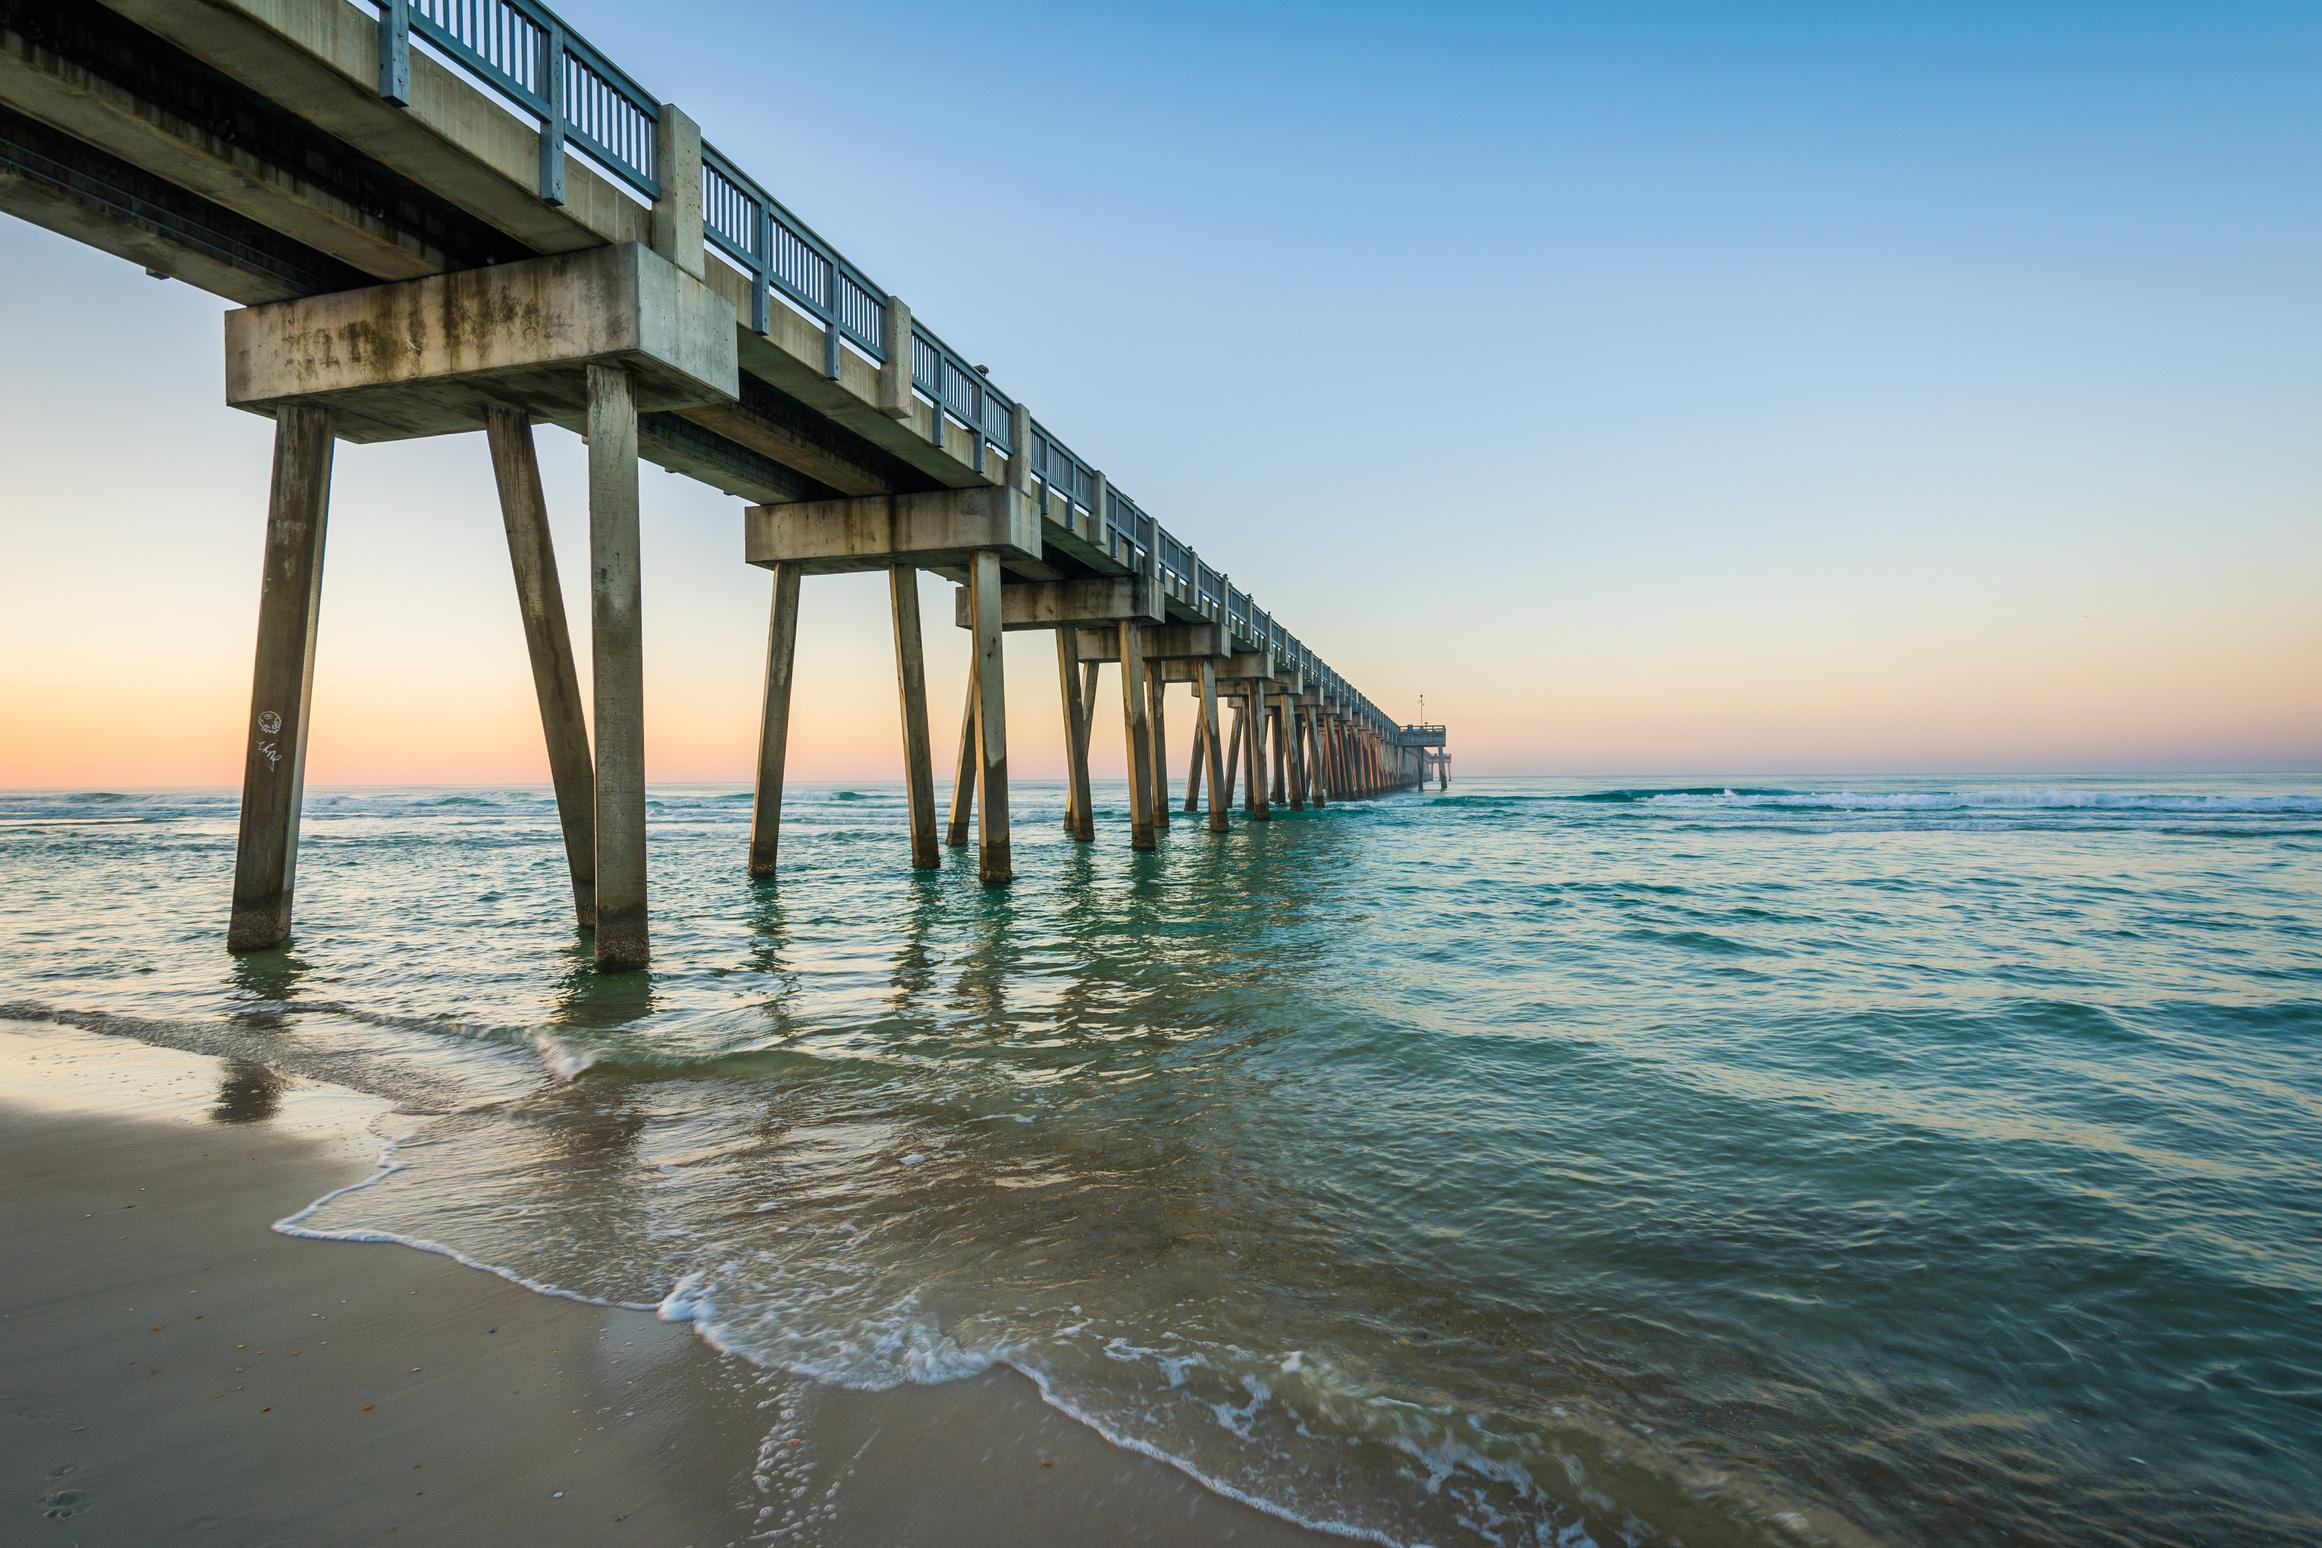
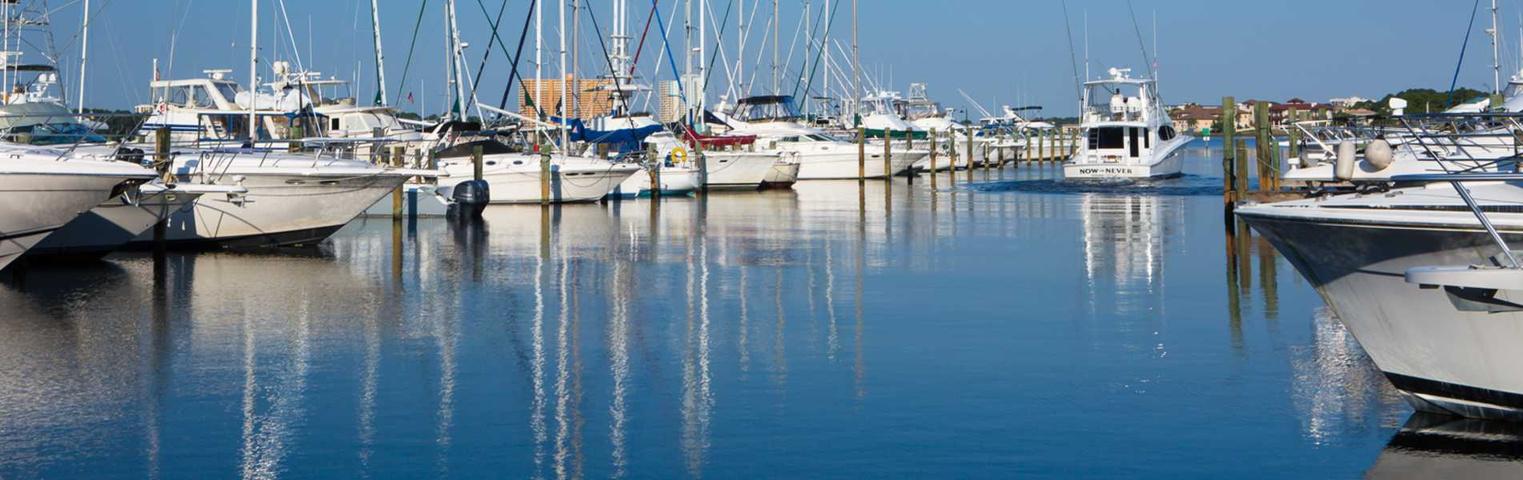
Theworlds fishingVillage luckiest Destin,
FL
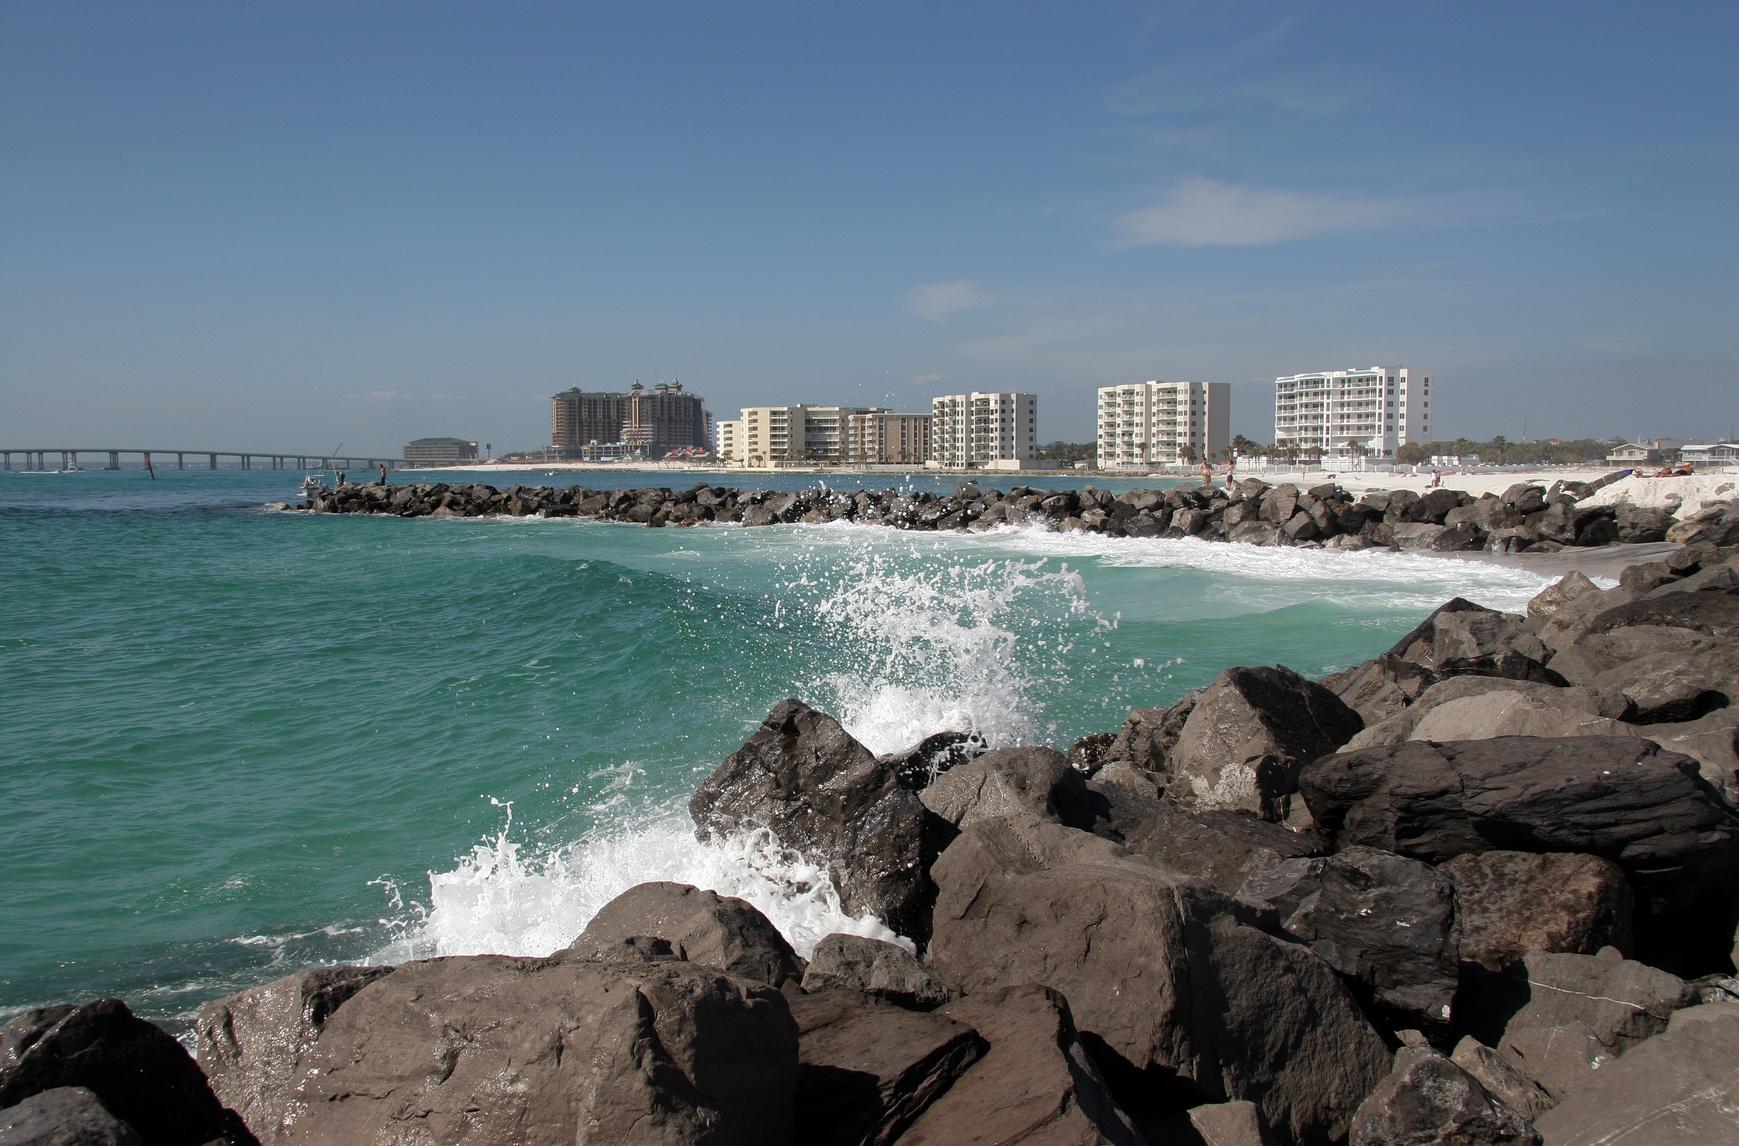
Destin, located in the northernmost part of Florida on the Gulf of Mexico has an abundance of beautiful beaches, crystal clear water, and verdant golf courses. There are five beachfront parks with amenities and 12 access points. Pick your pleasure from Henderson Beach to Topsail Hill. Or lavish yourself with a Gulf-front resort.
The origins of Destin's nickname as the "World's Luckiest Fishing Village" are just as interesting as the moniker itself. Originally a "little fishing community" on the Gulf of Mexico, the town of Destin was named after a fisherman named Leonard Destin. Captain Destin carried with him a sense of identity and place from his native New England. For this reason, a miniature town was built that resembled a New England colonial village. In fact, the Henderson State Park Inn, often regarded as Destin's finest resort, is only one of several structures and hotels that has managed to preserve the city's historic character and ambiance
Calm waters and shallow depths and numerous fish are because the edge of the Continental Shelf -- the gathering place for blackfin tuna, grouper, amberjack, and king mackerel -- is just 20 miles offshore Don't forget about Crab Island, what used to be an island, has been eroded by particles of sand that have accumulated in the Gulf of Mexico, leaving just a sandy spot where hundreds of vessels anchor annually.
2023 FIRST QUARTER REVIEW | PAGE 21

Number of Sales -38% YEAR OVER YEAR 74 Average Sales Price -8% YEAR OVER YEAR $1.20M Percentage of List Sold 95% Average Active Price -34% YEAR OVER YEAR $1.93M Average Price per Sq Foot +1% YEAR OVER YEAR $466 Average Days on Market +43%YEAR OVER YEAR 63 Median Sales Price -3% YEAR OVER YEAR $970K Destin Single Family Residence Sales 2023 First Quarter 2023 FIRST QUARTER REVIEW | PAGE 22

Destin CONDOMINIUM SALES JANUARY 2023- MARCH 2023 Number of Sales -44% YEAR OVER YEAR 124 AverageSalesPrice +31% YEAR OVER YEAR $744K PercentageofListSold 96% AverageActivePrice -18% YEAR OVER YEAR $986K 2023 FIRST QUARTER REVIEW | PAGE 24 All 2023 data is provided by FLEX/MLS as provided by Central Panhand e Association of Relators / Emerald Coast Assoc ation of Realtors and is deemed reliab e as of Apr l 10, 2023 but is not guaranteed and should be independently verif ed AveragePriceperSqFoot +24% YEAR OVER YEAR $566 AverageDaysonMarket +35% YEAR OVER YEAR 66 MedianSalesPrice +38% YEAR OVER YEAR $625K
Kelly Plantation SINGLE-FAMILY RESIDENCE SALES JANUARY 2023- MARCH 2023 Number of Sales -73% YEAR OVER YEAR 3 AverageSalesPrice -11% YEAR OVER YEAR $1.22M PercentageofListSold 95% AverageActivePrice -31% YEAR OVER YEAR $3.73M All 2023 data is prov ded by FLEX/MLS as provided by Central Panhandle Association of Relators / Emerald Coast Association of Realtors and is deemed reliab e as of Apr l 10, 2023 but is not guaranteed and shou d be independently verif ed AveragePriceperSqFoot +5% YEAR OVER YEAR $372 AverageDaysonMarket +38% YEAR OVER YEAR 65 MedianSalesPrice -28% YEAR OVER YEAR $1.00M PAGE 25 | 2023 FIRST QUARTER REVIEW
Regatta Bay SINGLE-FAMILY RESIDENCE SALES JANUARY 2023- MARCH 2023 Number of Sales -60% YEAR OVER YEAR 2 AverageSalesPrice +26% YEAR OVER YEAR $1.53M PercentageofListSold 96% AverageActivePrice +88% YEAR OVER YEAR $2.90M 2023 FIRST QUARTER REVIEW | PAGE 26 Al 2023 data is provided by FLEX/MLS as provided by Central Panhand e Associat on of Relators / Emerald Coast Assoc ation of Realtors and is deemed reliable as of April 10, 2023 but is not guaranteed and should be independently verif ed AveragePriceperSqFoot +31% YEAR OVER YEAR $445 AverageDaysonMarket +25% YEAR OVER YEAR 121 MedianSalesPrice +20%YEAR OVER YEAR $1.53M
Number of Sales -60% YEAR OVER YEAR 2 AverageSalesPrice $1.53M PercentageofListSold 96% AverageActivePrice +88% YEAR OVER YEAR $2.90M AveragePriceperSqFoot +31% YEAR OVER YEAR $445 AverageDaysonMarket +25% YEAR OVER YEAR 121 MedianSalesPrice $1.53M Walton County | Bayfront SINGLE-FAMILY RESIDENCE SALES JANUARY 2023- MARCH 2023 +26% YEAR OVER YEAR +20% YEAR OVER YEAR All 2023 data is prov ded by FLEX/MLS as prov ded by Central Panhandle Association of Relators / Emerald Coast Associat on of Rea tors and is deemed re iable as of Apri 10, 2023 but is not guaranteed and shou d be independently verified PAGE 27 | 2023 FIRST QUARTER REVIEW
Number of Sales -58% YEAR OVER YEAR 5 AverageSalesPrice $1.57M PercentageofListSold 90% AverageActivePrice -12% YEAR OVER YEAR $4.07M AveragePriceperSqFoot +12% YEAR OVER YEAR $420 AverageDaysonMarket +50% YEAR OVER YEAR 120 MedianSalesPrice $1.65M Okaloosa County | Bayfront SINGLE-FAMILY RESIDENCE SALES JANUARY 2023- MARCH 2023 +18% YEAR OVER YEAR +33% YEAR OVER YEAR 2023 FIRST QUARTER REVIEW | PAGE 28 Al 2023 data is provided by FLEX/MLS as provided by Central Panhand e Associat on of Relators / Emerald Coast Assoc ation of Realtors and is deemed reliab e as of Apr l 10, 2023 but is not guaranteed and should be independently verif ed
Number of Sales -35% YEAR OVER YEAR 34 AverageSalesPrice +15% YEAR OVER YEAR $1.73M PercentageofListSold 95% AverageActivePrice -27% YEAR OVER YEAR $1.79M AveragePriceperSqFoot +9% YEAR OVER YEAR $590 AverageDaysonMarket +14% YEAR OVER YEAR 48 MedianSalesPrice +59% YEAR OVER YEAR $1.53M SanDestin SINGLE-FAMILY RESIDENCE SALES JANUARY 2023- MARCH 2023 A l 2023 data s provided by FLEX/MLS as prov ded by Centra Panhandle Assoc ation of Re ators / Emera d Coast Associat on of Rea tors and is deemed rel able as of Apri 10 2023 but s not guaranteed and should be ndependent y ver fied PAGE 29 | 2023 FIRST QUARTER REVIEW
Number of Sales -40% YEAR OVER YEAR 73 AverageSalesPrice $1.55M Percentage of List Sold 95% AverageActivePrice -16% YEAR OVER YEAR $1.91M AveragePriceperSqFoot +9% YEAR OVER YEAR $551 AverageDaysonMarket +145% YEAR OVER YEAR 93 MedianSalesPrice $1.20M Miramar Beach SINGLE-FAMILY RESIDENCE SALES JANUARY 2023- MARCH 2023 +18% YEAR OVER YEAR +11% YEAR OVER YEAR 2023 FIRST QUARTER REVIEW | PAGE 30 A l 2023 data s provided by FLEX/MLS as provided by Central Panhandle Assoc ation of Re ators / Emera d Coast Association of Realtors and s deemed rel able as of April 10 2023 but s not guaranteed and should be ndependent y ver fied
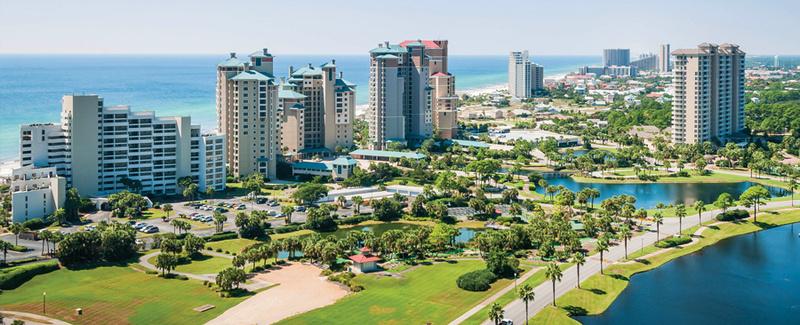
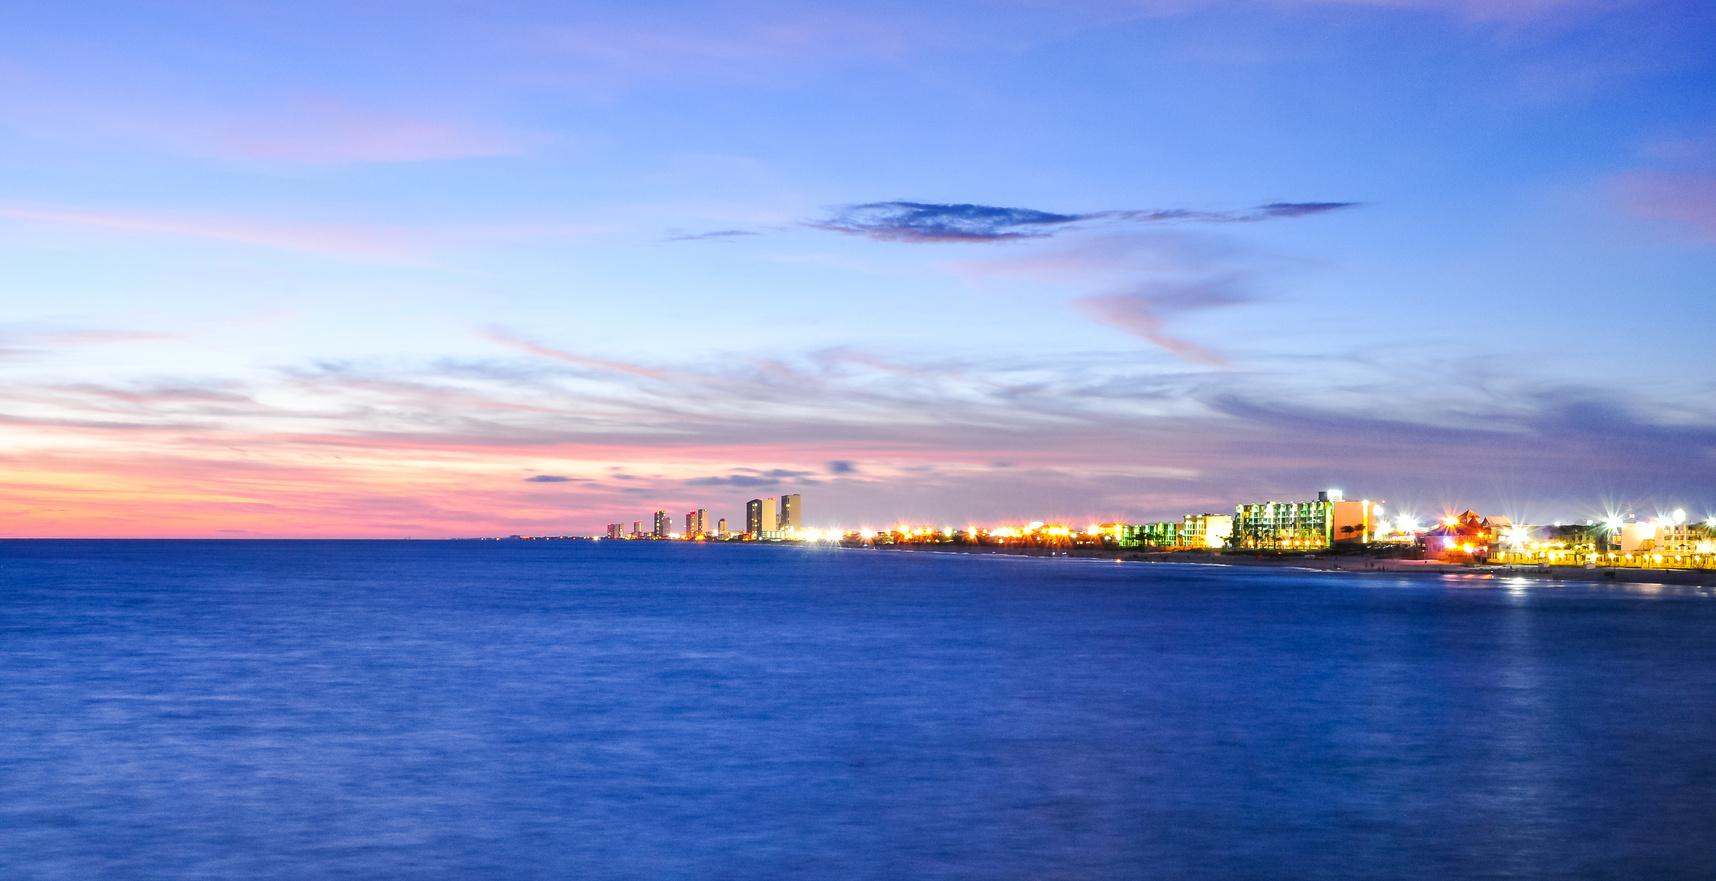
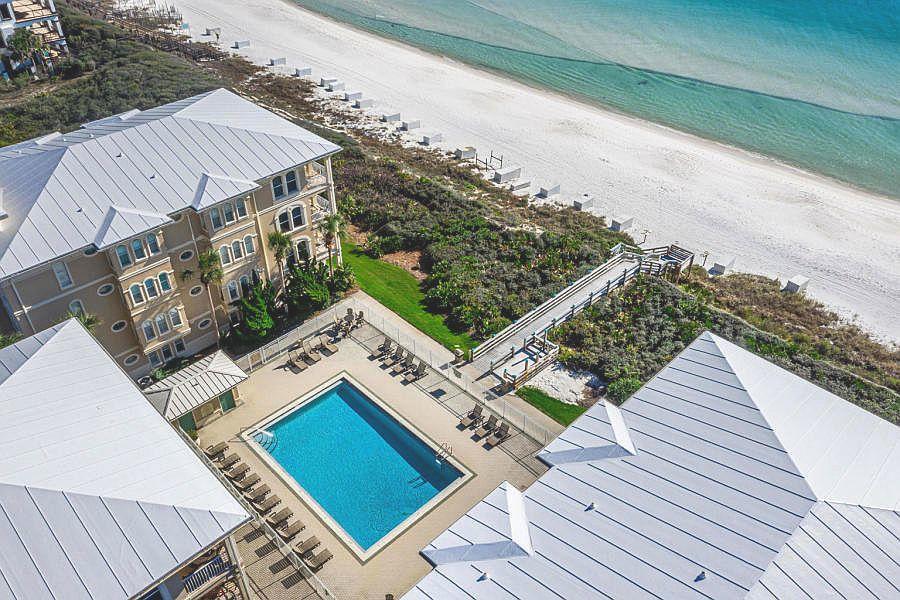
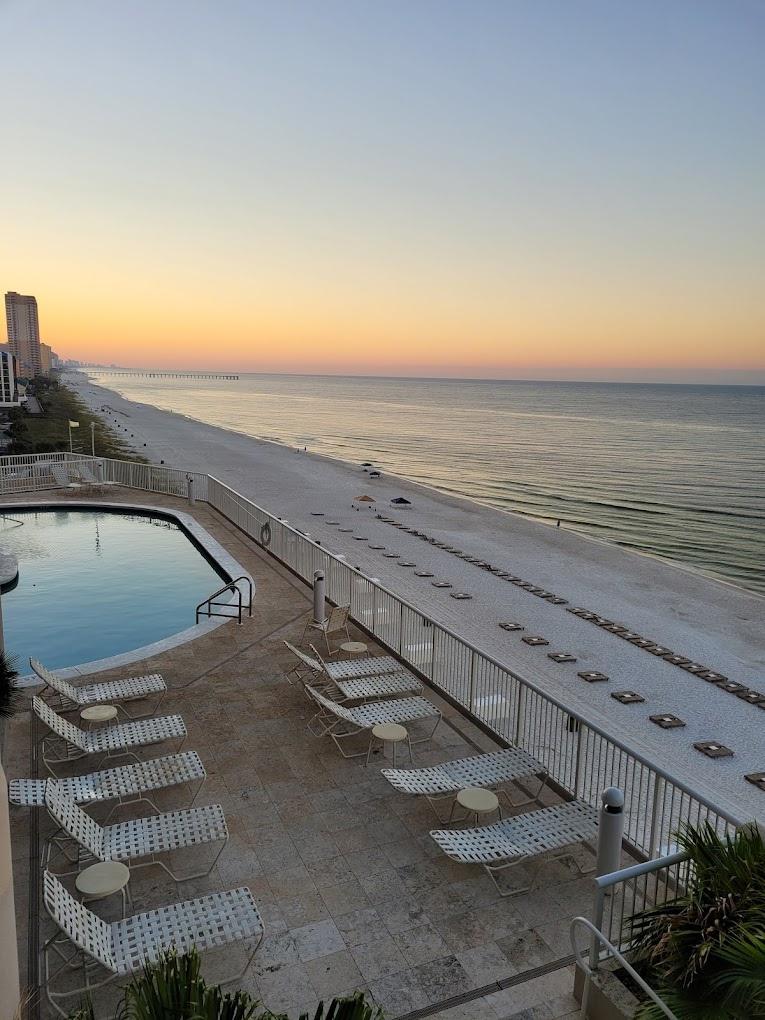
PanamaCityBeach,FL
sand surf
Where meetsthe you ’llfinditall.
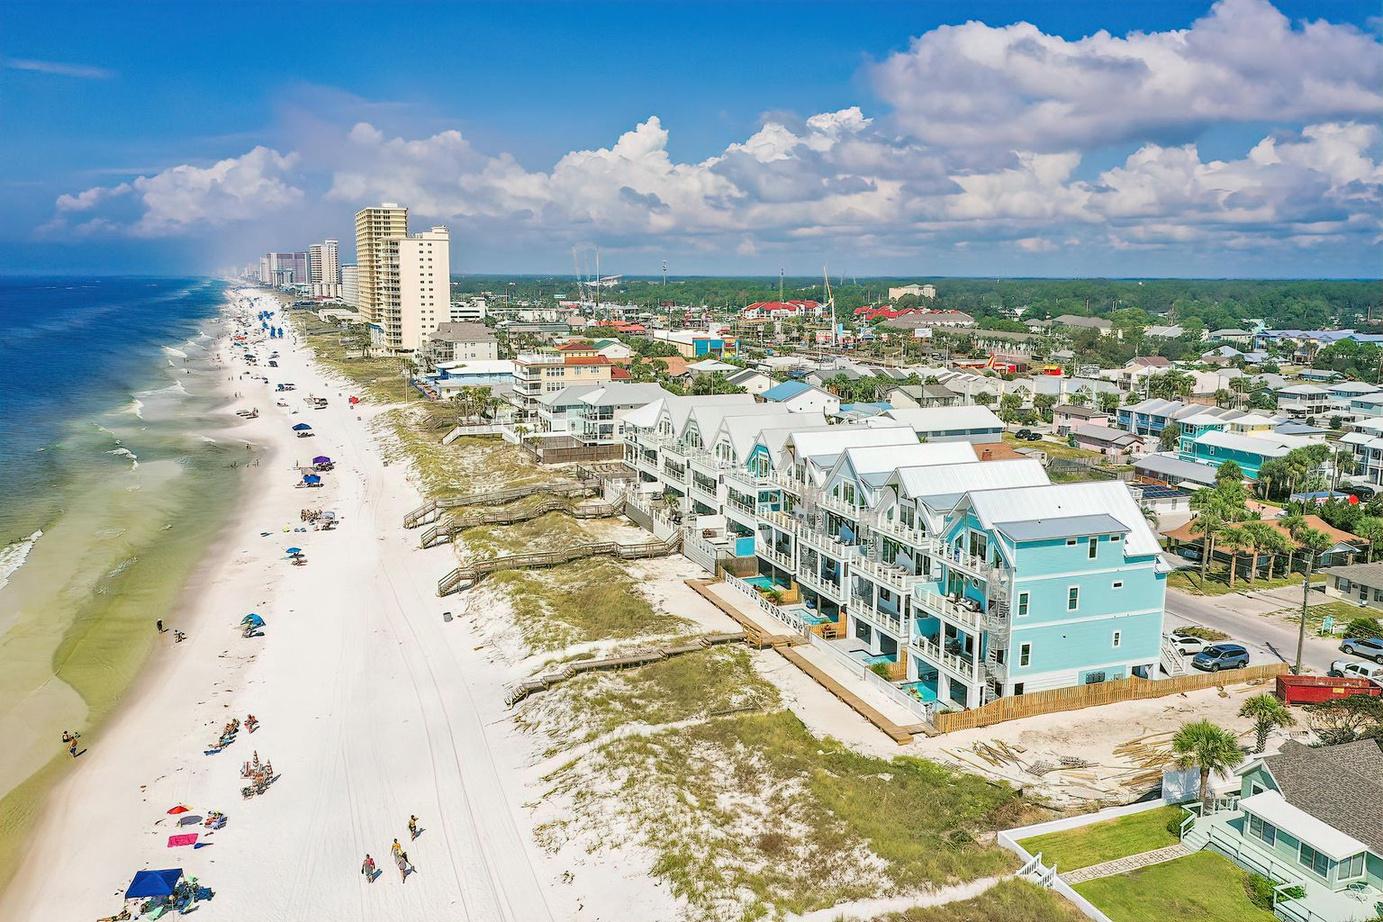
Panama City Beach, featuring 27 miles of white sand beaches along the turquoise waters of the Gulf of Mexico, is home to two state parks (St. Andrews State Park and Camp Helen State Park), dozens of public beach access points, waterfront restaurants that serve up fresh local seafood, and legendary attractions
St. Andrews State Park has been named the #2 Beach in America by Trip Advisor. The 1,260-acre park has forests, sand dunes covered with sea oats, fresh and saltwater marshes, a lagoon swimming area, fishing jetties, hiking trails, 1.5 miles of beach, and two campgrounds. Opened in 1951, St. Andrews was once the site of a World War II Military Reservation and has won the World's Best Beach Award.
The waters at Panama City Beach are famous with fishermen and scuba divers who enjoy the benefits of dozens of offshore artificial reefs. With a coastline that angles slightly toward the west, you can watch the sunset over the Gulf of Mexico every day of the year
PAGE 31 | 2023 FIRST QUARTER
REVIEW
Average Sales Price Percentage of List Sold Average Active Price Average Price per Sq Foot Average Days on Market Median Sales Price Number of Sales -21% YEAR OVER YEAR +14%YEAR OVER YEAR $674K 97% -34% YEAR OVER YEAR $1.02M +6% YEAR OVER YEAR $327 +103% YEAR OVER YEAR 81 +15% YEAR OVER YEAR $524K Panama City Beach Single Family Residence Sales 2023 First Quarter 2023 FIRST QUARTER REVIEW | PAGE 32 240

Panama City Beach Gulf Front SINGLE-FAMILY RESIDENCE SALES JANUARY 2023- MARCH 2023 Number of Sales +20% YEAR OVER YEAR 6 AverageSalesPrice +16% YEAR OVER YEAR $3.67M PercentageofListSold 97% AverageActivePrice -31% YEAR OVER YEAR $5.00M AveragePriceperSqFoot -6% YEAR OVER YEAR $873 AverageDaysonMarket +764% YEAR OVER YEAR 121 MedianSalesPrice +25% YEAR OVER YEAR $3.43M 2023 FIRST QUARTER REVIEW | PAGE 34 Al 2023 data is provided by FLEX/MLS as provided by Central Panhand e Associat on of Relators / Emerald Coast Assoc ation of Realtors and is deemed reliab e as of Apr l 10, 2023 but is not guaranteed and should be independently verif ed
Panama City Beach CONDOMINIUM SALES JANUARY 2023- MARCH 2023 Number of Sales -48% YEAR OVER YEAR 296 AverageSalesPrice +9% YEAR OVER YEAR $490K AverageActivePrice -11% YEAR OVER YEAR $528K AverageDaysonMarket +74% YEAR OVER YEAR 73 MedianSalesPrice +5% YEAR OVER YEAR $440K PercentageofListSold 96% AveragePriceperSqFoot +10% YEAR OVER YEAR $438 A l 2023 data s provided by FLEX/MLS as prov ded by Centra Panhandle Assoc ation of Re ators / Emera d Coast Associat on of Rea tors and s deemed rel able as of April 10, 2023 but is not guaranteed and should be independently verif ed PAGE 35 | 2023 FIRST QUARTER REVIEW
Panama City Beach | The Palazzo CONDOMINIUM SALES JANUARY 2023- MARCH 2023 Number of Sales +67% YEAR OVER YEAR 5 AverageSalesPrice +29% YEAR OVER YEAR $896K AverageActivePrice 0% YEAR OVER YEAR $752K AverageDaysonMarket +140% YEAR OVER YEAR 60 MedianSalesPrice +44% YEAR OVER YEAR $920K PercentageofListSold 97% AveragePriceperSqFoot +26% YEAR OVER YEAR $613 2023 FIRST QUARTER REVIEW | PAGE 36 Al 2023 data is provided by FLEX/MLS as provided by Central Panhand e Associat on of Relators / Emerald Coast Assoc ation of Realtors and is deemed reliab e as of Apr l 10, 2023 but is not guaranteed and should be independently verif ed
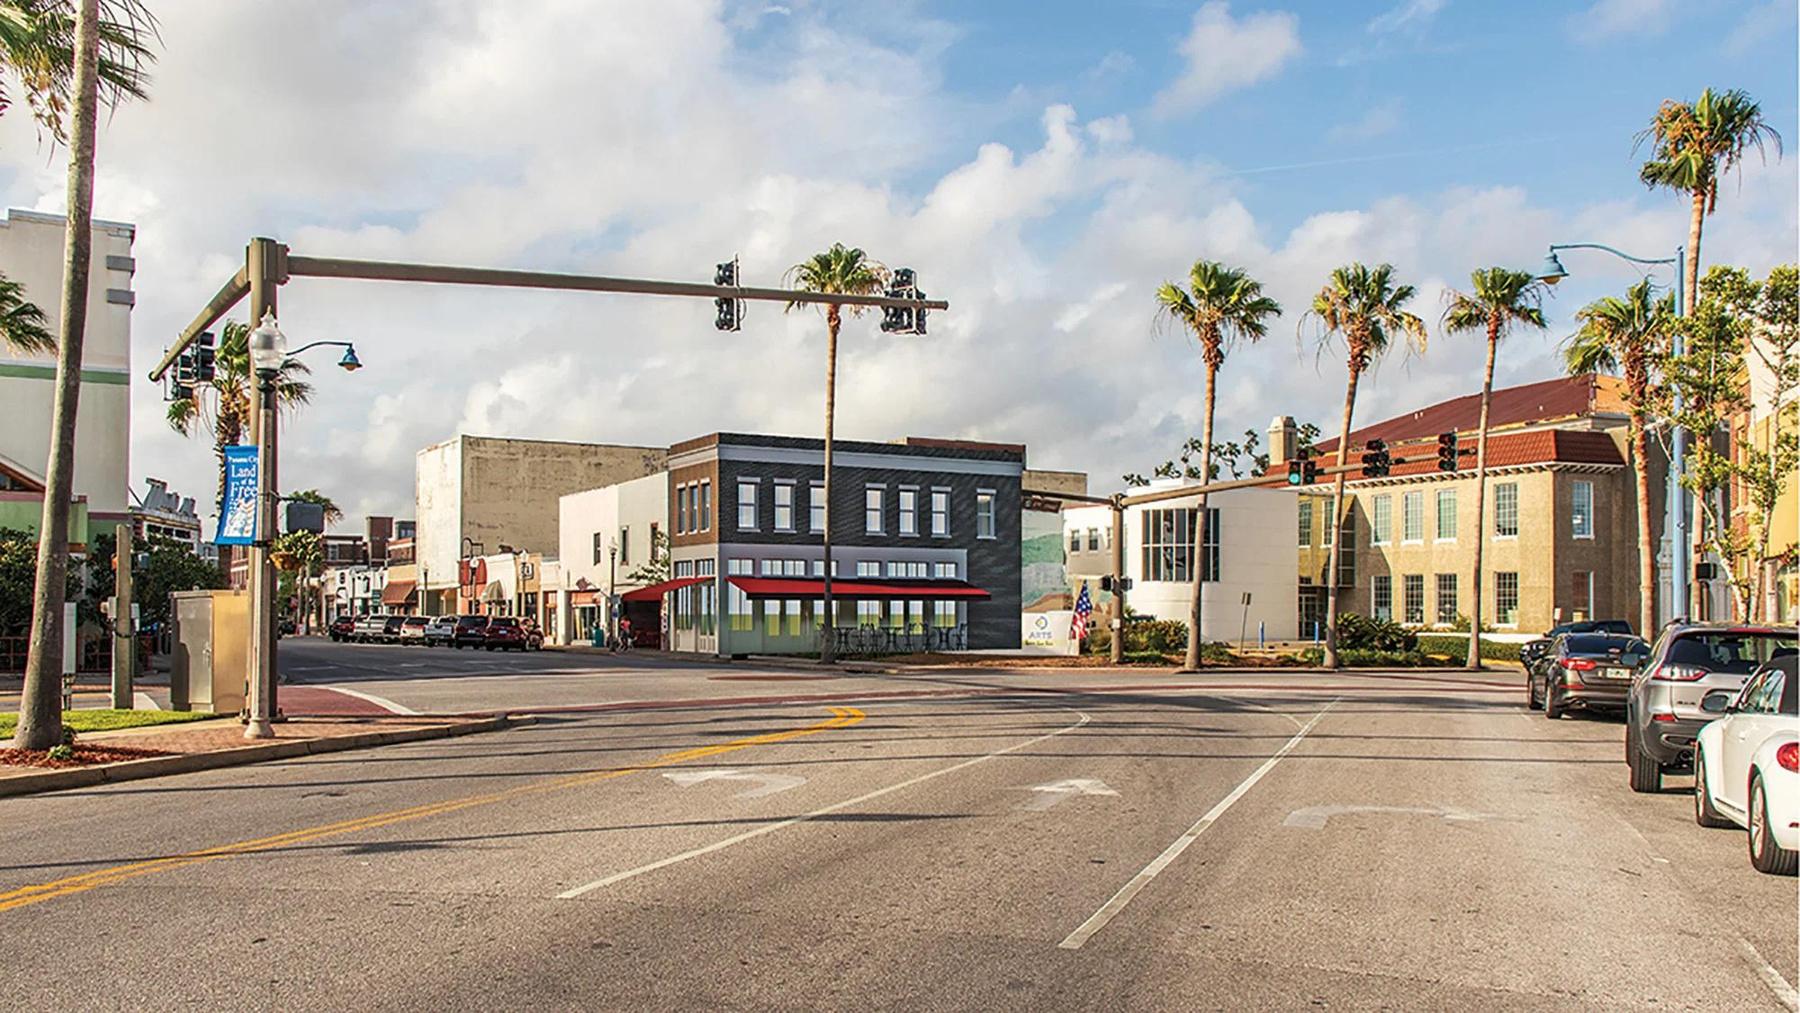
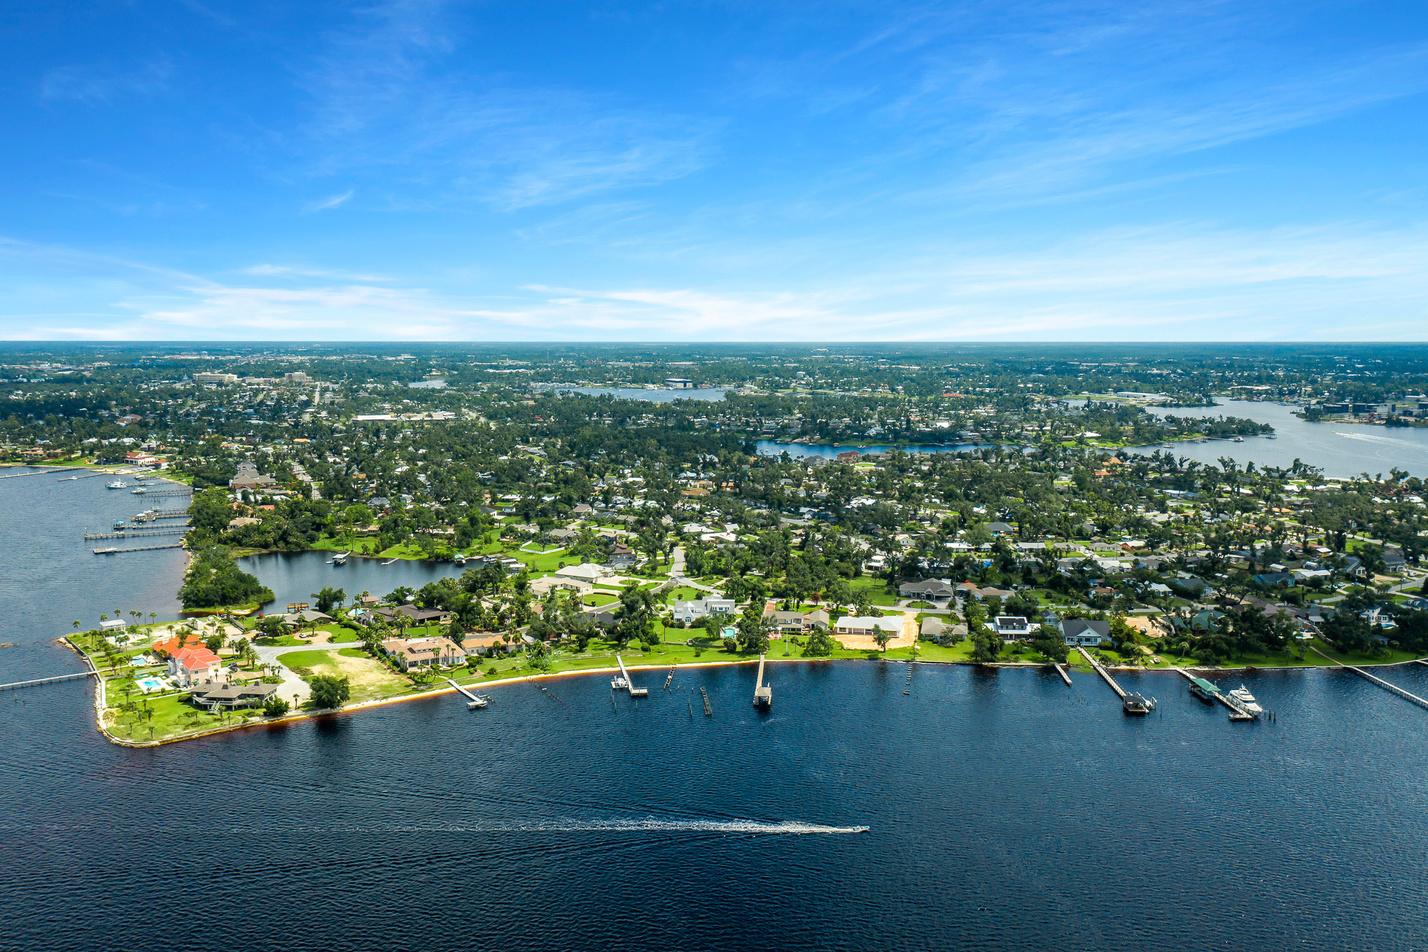
PanamaCity,FL
sand surf
Where meetsthe you ’llfinditall.
Panama City Beach, featuring 27 miles of white sand beaches along the turquoise waters of the Gulf of Mexico, is home to two state parks (St. Andrews State Park and Camp Helen State Park), dozens of public beach access points, waterfront restaurants that serve up fresh local seafood, and legendary attractions.
St. Andrews State Park has been named the #2 Beach in America by Trip Advisor. The 1,260-acre park has forests, sand dunes covered with sea oats, fresh and saltwater marshes, a lagoon swimming area, fishing jetties, hiking trails, 1.5 miles of beach, and two campgrounds. Opened in 1951, St. Andrews was once the site of a World War II Military Reservation and has won the World's Best Beach Award.
The waters at Panama City Beach are famous with fishermen and scuba divers who enjoy the benefits of dozens of offshore artificial reefs. With a coastline that angles slightly toward the west, you can watch the sunset over the Gulf of Mexico every day of the year.
PAGE 37 | 2023 FIRST QUARTER
REVIEW
Number of Sales -26% YEAR OVER YEAR 404 Average Sales Price +6% YEAR OVER YEAR $337K Percentage of List Sold 98% Average Active Price -7% YEAR OVER YEAR $411K Average Price per Sq Foot +6% YEAR OVER YEAR $175 Average Days on Market +56% YEAR OVER YEAR 67 Median Sales Price +3% YEAR OVER YEAR $310K Panama City Single Family Residence Sales 2023 First Quarter 22023 FIRST QUARTER REVIEW | PAGE 38
Number of Sales +22% YEAR OVER YEAR 22 AverageSalesPrice +30% YEAR OVER YEAR $411K PercentageofListSold 95% AverageActivePrice +15% YEAR OVER YEAR $536K AveragePriceperSqFoot +26% YEAR OVER YEAR $206 AverageDaysonMarket +75% YEAR OVER YEAR 63 MedianSalesPrice +14% YEAR OVER YEAR $315K The Cove SINGLE-FAMILY RESIDENCE SALES JANUARY 2023- MARCH 2023 A l 2023 data s provided by FLEX/MLS as prov ded by Centra Panhandle Assoc ation of Re ators / Emera d Coast Associat on of Rea tors and s deemed rel able as of April 10, 2023 but is not guaranteed and should be independently verif ed PAGE 39 | 2023 FIRST QUARTER REVIEW
Bay Point SINGLE-FAMILY RESIDENCE SALES JANUARY 2023- MARCH 2023 Number of Sales +6% YEAR OVER YEAR 17 AverageSalesPrice +9% YEAR OVER YEAR $816K PercentageofListSold 95% AverageActivePrice +37% YEAR OVER YEAR $1.39M AveragePriceperSqFoot +14% YEAR OVER YEAR $302 AverageDaysonMarket +209% YEAR OVER YEAR 108 MedianSalesPrice +11% YEAR OVER YEAR $752K 2023 FIRST QUARTER REVIEW | PAGE 40 Al 2023 data is provided by FLEX/MLS as provided by Central Panhand e Associat on of Relators / Emerald Coast Assoc ation of Realtors and is deemed reliab e as of Apr l 10, 2023 but is not guaranteed and should be independently verif ed


Find your way home with Corcoran Reverie 30A Office 5410 E Co Hwy 30A, Ste 103, Santa Rosa Beach, Florida 32459 o 850.213.5030 Destin Office 4014 Commons Drive W, Ste 100, Destin, Florida 32541 o 850.424.3094 Panama City Office 315 Harrison Ave, Panama City, Florida 32401 o 850.309.1330 Nashville Office 40 Burton Hills Blvd, Ste 230, Nashville, Tennessee 37215 o 615.250.7880
