The Reverie Review
Q3 2024 | Market Report


Q3 2024 | Market Report
DISCLAIMER: SOURCE: TRENDGRAPHIX BASED ON DATA SUPPLIED BY THE EMERALD COAST ASSOCIATION OF REALTORS MULTIPLE LISTING SERVICE AND CENTRAL PANHANDLE ASSOCIATION OF REALTORS MULTIPLE LISTING SERVICE. THE INFORMATION, DATA, AND FIGURES CONTAINED HEREIN ARE PROVIDED FOR GENERAL INFORMATIONAL PURPOSES ONLY. WHILE EVERY EFFORT HAS BEEN MADE TO ENSURE THE ACCURACY, COMPLETENESS, AND RELIABILITY OF THE INFORMATION, CORCORAN REVERIE MAKES NO REPRESENTATIONS OR WARRANTIES, EXPRESS OR IMPLIED, REGARDING THE ACCURACY, ADEQUACY, VALIDITY, RELIABILITY, AVAILABILITY, OR COMPLETENESS OF ANY INFORMATION PROVIDED.


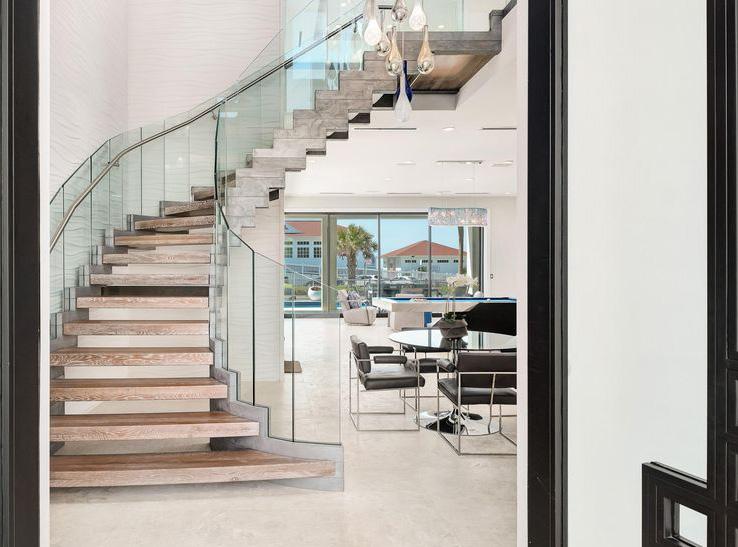
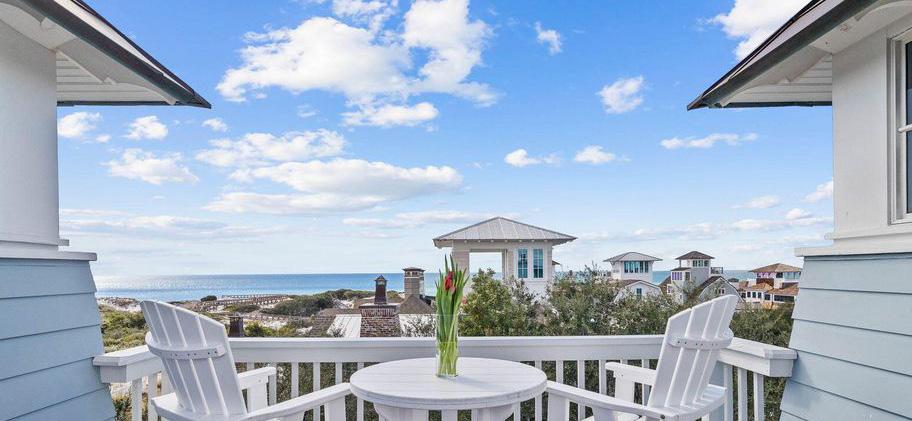
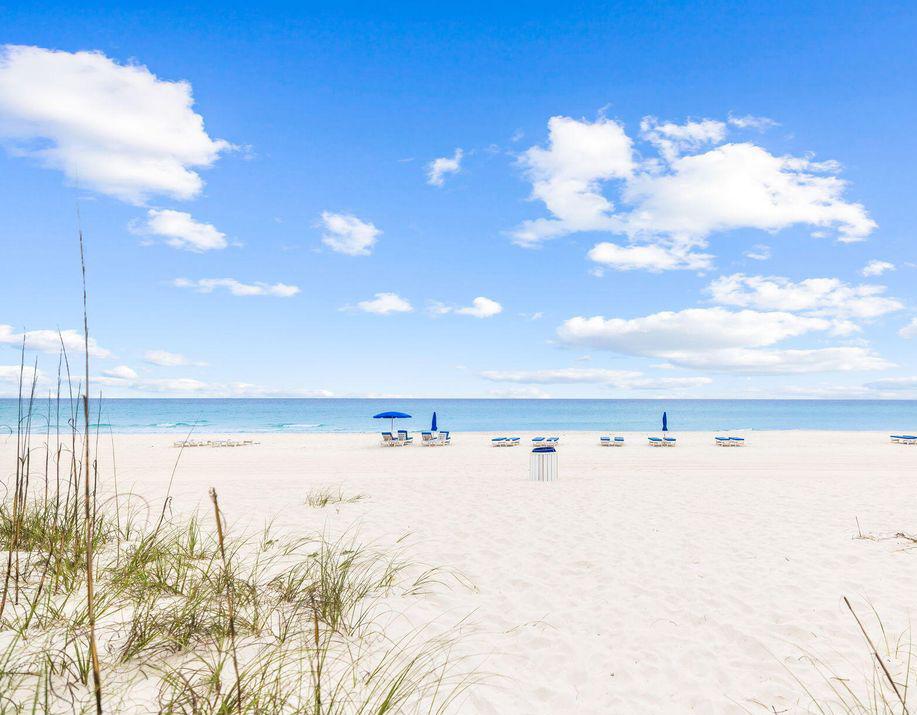
A place unlike anywhere else.
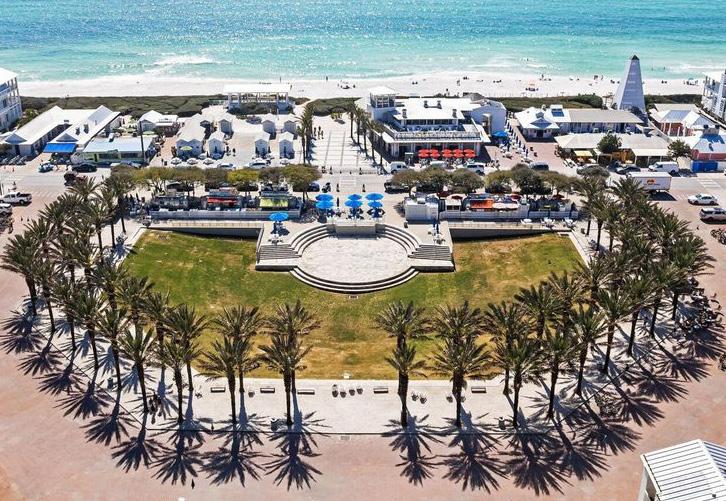
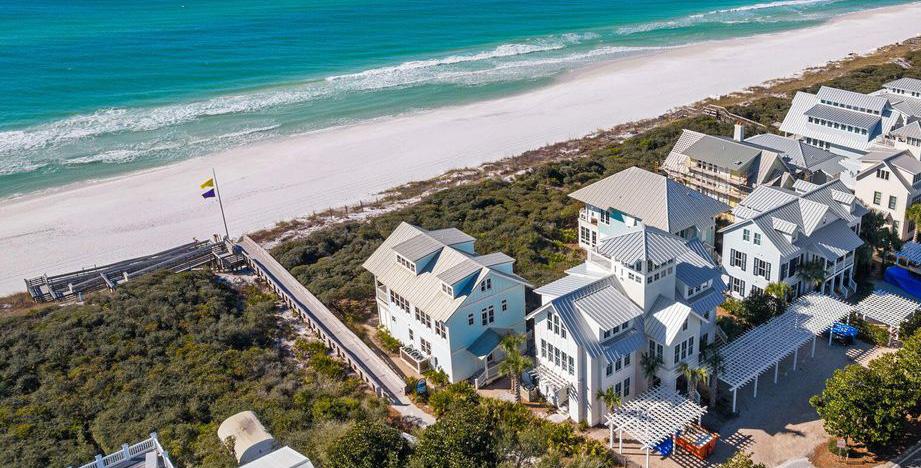
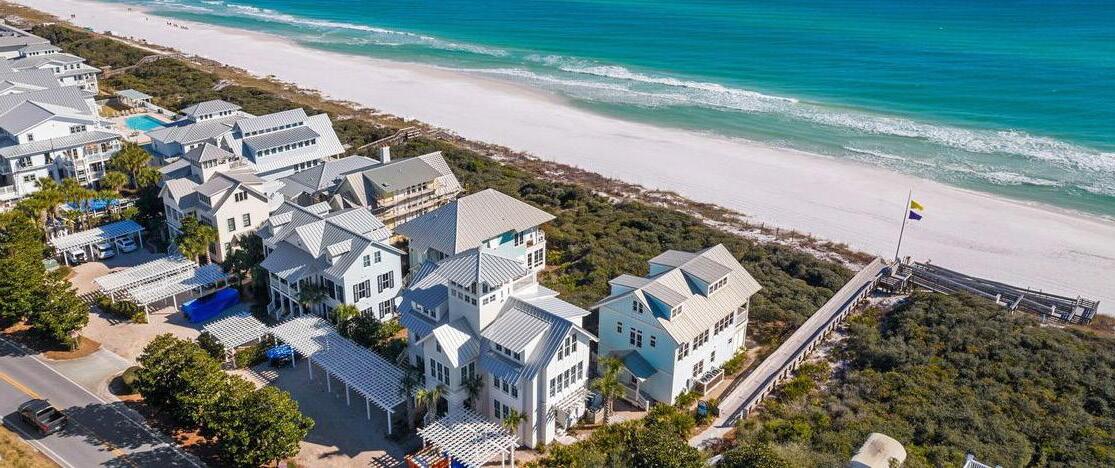
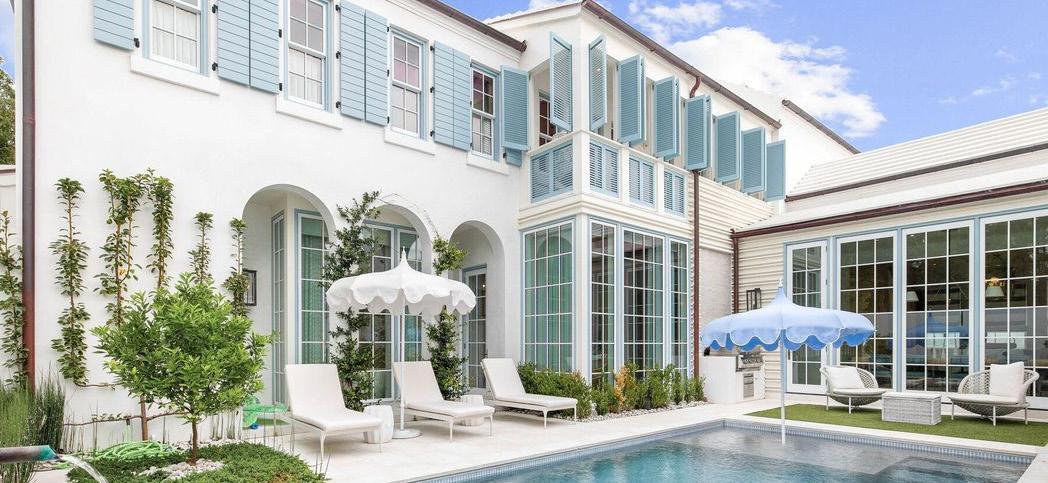
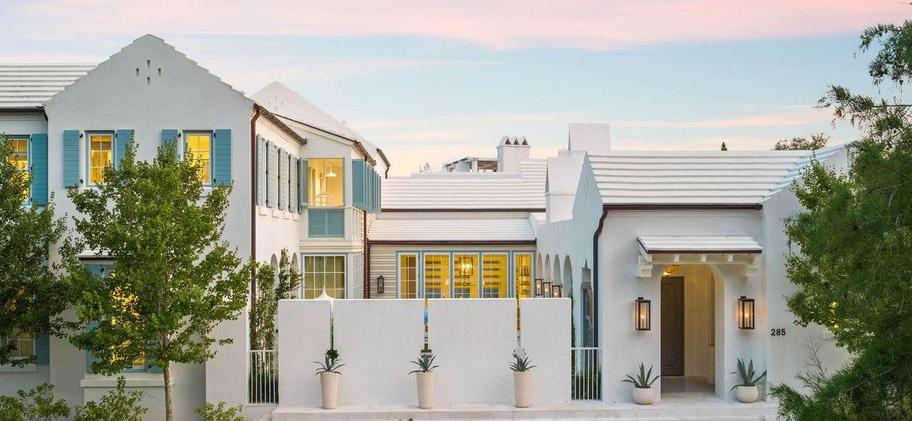
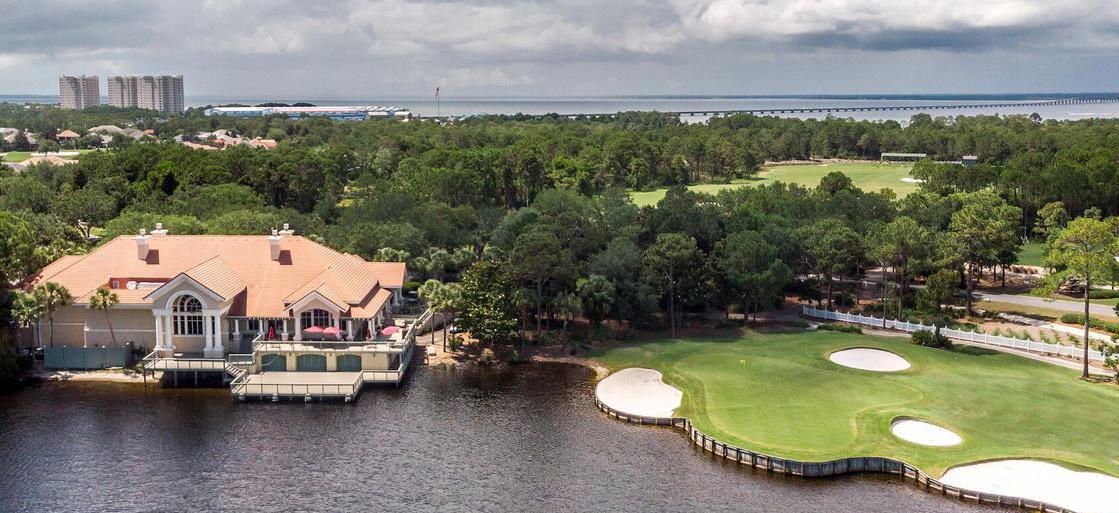
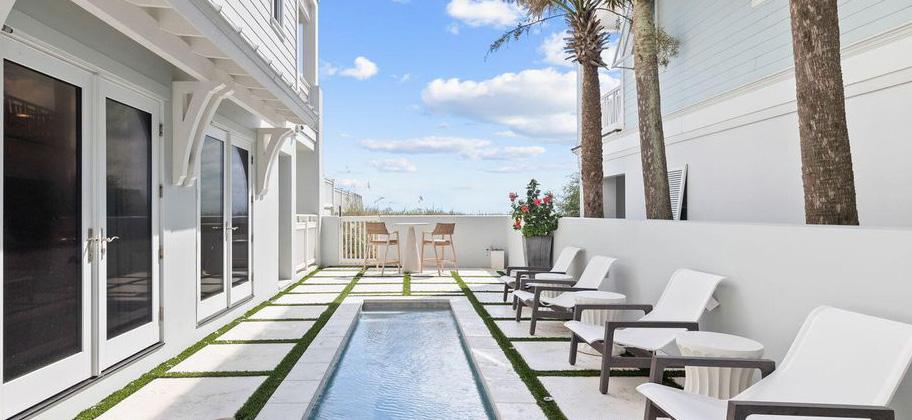
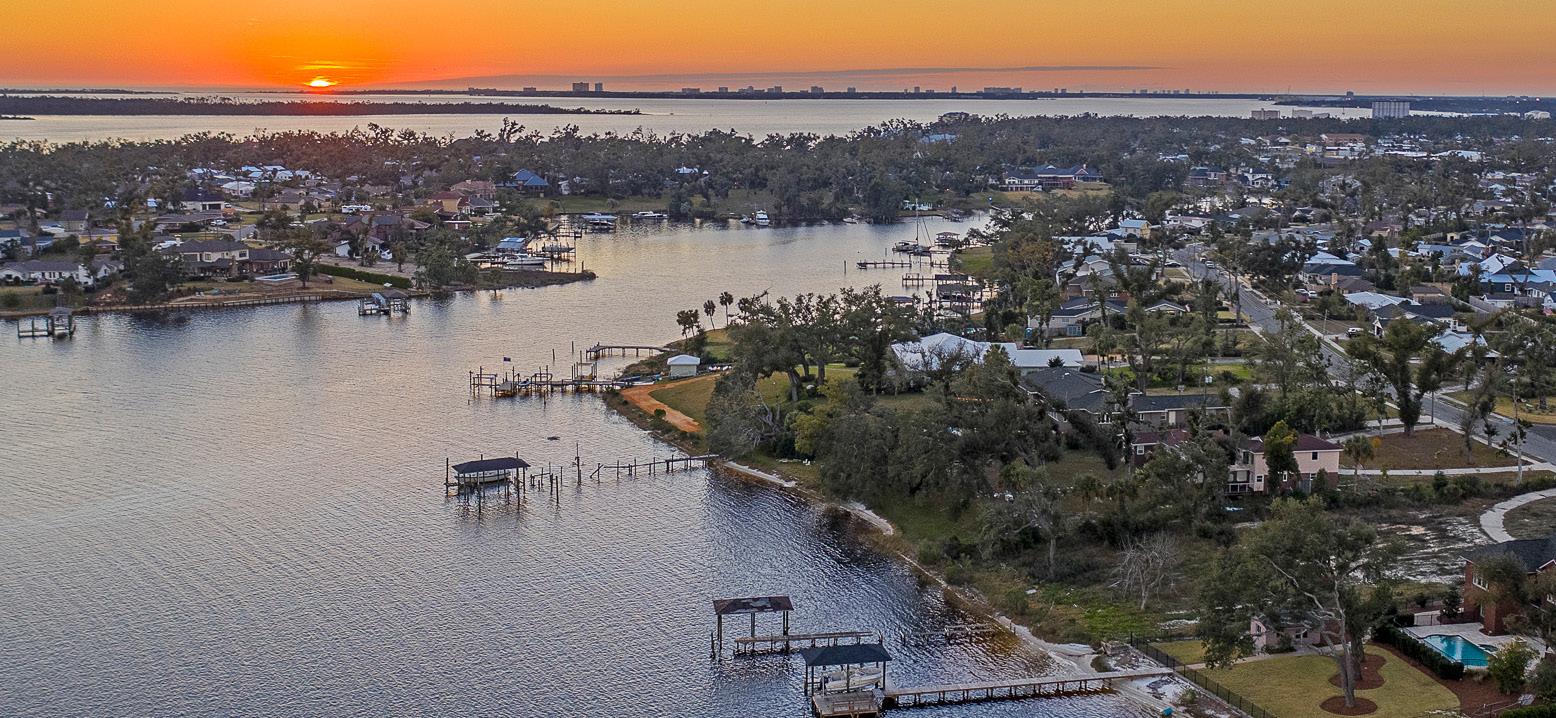
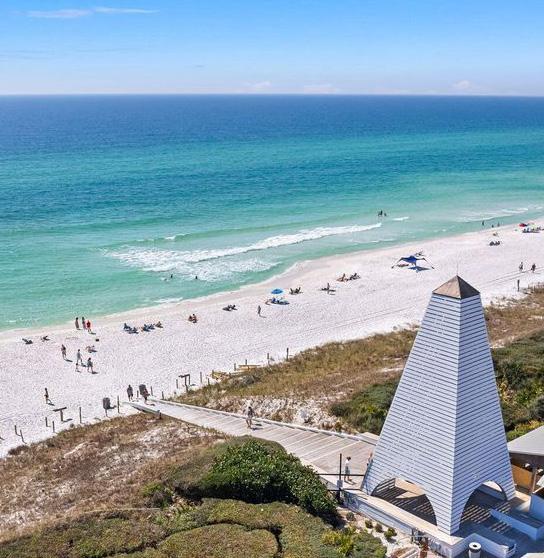
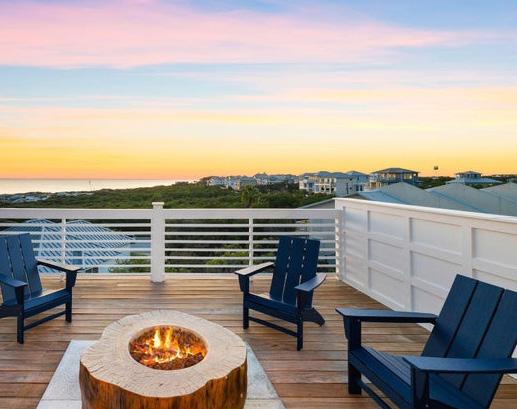
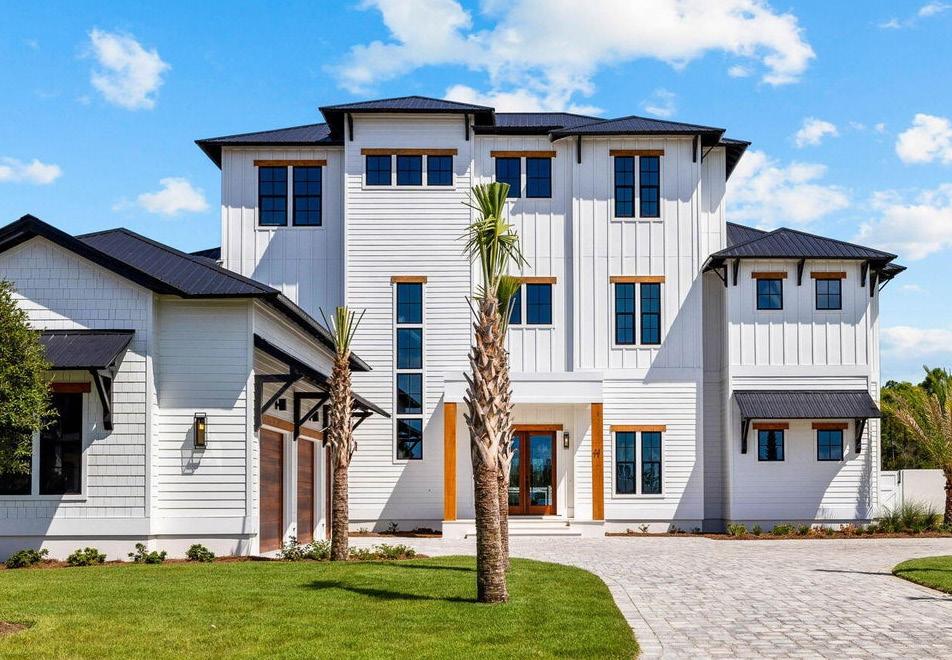
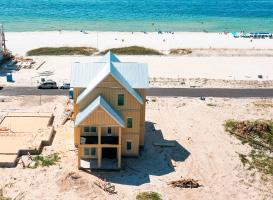
Scenic Highway 30A continues to captivate investors with its unparalleled beauty and exclusive charm. This 28.5-mile stretch along Florida’s Emerald Coast is renowned for its pristine white-sand beaches, crystal-clear turquoise waters, and rare coastal dune lakes. Envision waking up to the serene sounds of the Gulf, spending your days paddleboarding, kayaking, or biking through picturesque trails, and enjoying the quaint, upscale ambiance of communities like Rosemary Beach, Seaside, and Alys Beach. The area offers a unique blend of luxury living and small-town charm, making it a highly desirable destination for those seeking the finest in coastal living. The robust rental market, characterized by high occupancy rates and premium rental prices, continues to provide attractive income opportunities for investors.
Northwest Florida’s economic stability, bolstered by a thriving tourism sector and a favorable tax environment with no state income tax, enhances 30A’s appeal. The area’s continuous development, including new luxury projects and infrastructure improvements, promises to further elevate property values and investment potential. Scenic Highway 30A offers an exceptional blend of natural beauty, vibrant community life, and strong financial returns, solidifying its status as a premier location for both luxury living and investment.
• Closed Sales Decline with Increasing Days on Market - Closed sales dropped significantly by 19% year-over-year and 21% quarter-over-quarter in Q3 2024, falling to 215 from 265 in Q3 2023. Meanwhile, the average days on market surged by 48% year-over-year, reaching 95 days. This indicates a substantial slowdown in market activity, with properties staying on the market longer, reflecting cautious buyer behavior amid changing economic conditions.
• Contracts Signed Decrease Reflects Buyer Hesitancy - Contracts signed decreased by 7% yearover-year and 6% quarter-over-quarter, suggesting a dip in buyer confidence. This may be influenced by the high costs of borrowing, despite some relief in interest rates toward the end of the quarter. The overall trend shows buyers are less eager to commit compared to the same period last year.
• Sales Volume Reflects Slower Market - Total sales volume in Q3 2024 fell by 20% year-over-year to $506M, down from $629M in Q3 2023. This decrease is even more pronounced compared to Q2 2024, with a 25% drop in sales volume, emphasizing the impact of fewer transactions and lower buyer demand in the market.
• Luxury Market Resilience - Despite the challenges reflected in decreased closed sales and contracts signed, the continued increase in days on market and stable new listings suggest that sellers are not willing to drop their prices significantly. The Scenic Highway 30A area remains attractive, with potential for buyers who have the flexibility to navigate the longer time frames and leverage current market dynamics.
• Stable Median and Average Sale Prices with Slight Quarter-Over-Quarter Adjustment - In Q3 2024, the median sale price rose by 3% year-over-year to $1.50M, while the average sale price remained steady at $2.358M. The slight 4% decrease in both median and average sale prices compared to the previous quarter reflects some market recalibration, but values are still holding strong compared to last year.
• Increased Listing Prices Show Seller Confidence - New median and average list prices have increased year-over-year (+8% and +10%, respectively) and quarter-over-quarter (+9% and +4%, respectively). These increases demonstrate that sellers are confident in the long-term value of their properties and recognize the premium nature of the Scenic Highway 30A market.
• Navigating a Changing Market - While transaction volumes are down (closed sales -19% YOY, contracts signed -7% YOY), this can also be seen as an opportunity for sellers who present their properties strategically. Buyers are becoming more discerning, but highquality listings in desirable locations continue to command attention. Sellers who price appropriately and highlight the unique appeal of their properties can still attract serious buyers.
• Luxury Market Opportunities - The luxury segment remains strong, with the average list price now exceeding $3M, reflecting a focus on high-end value. For sellers, this means that positioning properties to align with buyer expectations—while understanding current market dynamics—will be key to maximizing returns. The growth in list prices shows that there’s still substantial value in the market, and properties that stand out can lead the way.
UNDER $500K
$500K TO $1M
$1M TO $3M
$3M TO $5M
$5M+ $10M+
$500K
$500K TO $1M
$1M TO $3M
$3M TO $5M
$5M+
$10M+
Properties in the mid-range ($1M to $3M) have seen a significant increase in the average days on market, rising by 88% year-over-year to 111 days, indicating a substantial slowdown in buyer activity for this segment. Meanwhile, ultra-luxury properties ($10M+) also experienced a notable rise in days on market, up 61% from last year, now averaging 171 days. Conversely, properties in the lower price ranges (under $500K) have reduced their time on market by 41%, now averaging 70 days, suggesting that more affordable properties are moving faster as buyers seek value in a higher-priced market. The luxury segment ($3M to $5M) has remained relatively stable, with a slight 3% decrease in days on market, pointing to consistent demand in this high-value bracket.
The market share for properties priced between $1M and $3M has continued to grow, now comprising 53% of all sales, up from 39% in Q3 2021. This segment clearly dominates the Scenic Highway 30A market, indicating strong buyer preference for properties within this price range. Meanwhile, the share of properties under $500K has declined significantly, dropping to just 1% in Q3 2024, reflecting limited availability and a market-wide increase in property values. The $5M+ segment has also seen growth, now accounting for 12% of the market share, up from 9% in Q3 2022, highlighting steady interest in ultra-luxury properties. The shift towards higher price ranges emphasizes the upscale nature of Scenic Highway 30A, where mid to high-end properties drive most transactions.
• Active Listings Increase, Focused on High-End Market - Active listings rose by 27% year-over-year in Q3 2024, reaching 914 properties. With the market share showing a shift towards the $1M+ price segments, it’s clear that the increase in inventory is largely driven by higher-value listings, particularly those in the $3M-$5M and $5M+ ranges, which have seen notable growth in market presence.
• Stable New Listings with Emphasis on Luxury Segments - New listings in Q3 2024 remained relatively stable year-over-year (+1%), but the focus on luxury properties is evident. The $5M+ segment grew significantly (+22%), and the $10M+ category saw a 38% increase in new listings. This aligns with the market share data, which highlights that higher price segments now dominate the market, with increased seller activity in these categories.
• Lower and Mid-Range Inventory Decline Reflects Market Shift - Listings in the under $500K and $500K-$1M price ranges have decreased, consistent with their reduced market share. These segments now represent a smaller portion of the market as rising prices push more transactions into the higher brackets, and sellers focus on premium value offerings where demand remains stronger.
• Sellers Positioning for Luxury Demand - The increase in new listings in the $3M+ segments, along with a growing market share in these price ranges, indicates that sellers are catering to premium buyers who remain active despite broader market slowdowns. The current inventory growth offers a robust selection for luxury buyers, emphasizing the high-end nature of Scenic Highway 30A’s real estate landscape.
$500K TO $1M
$1M TO $3M
$3M TO $5M
$5M+
$10M+
$500K TO $1M
$1M TO $3M
$3M TO $5M $5M+


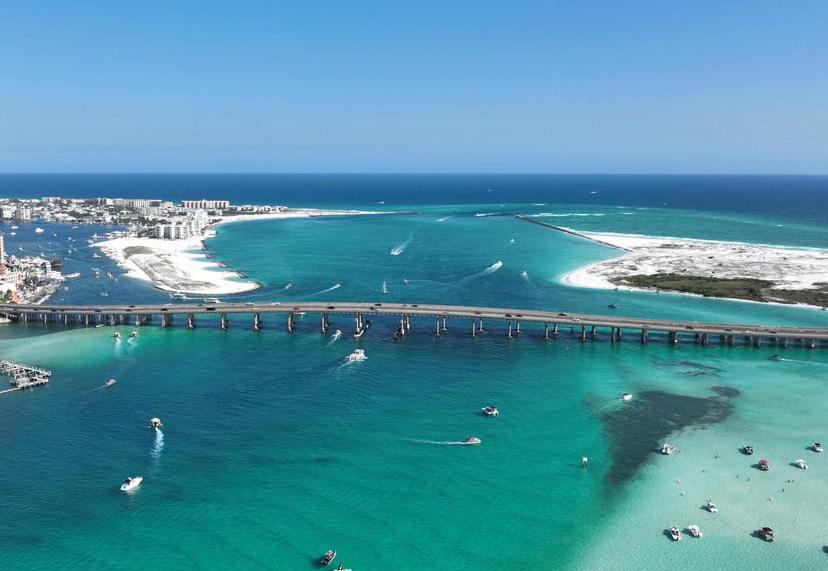
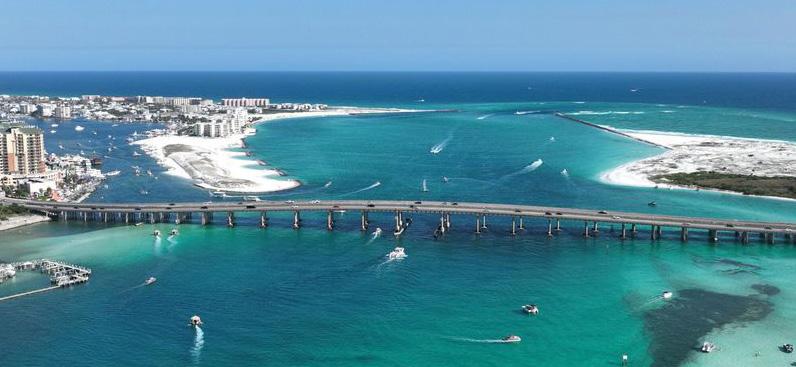
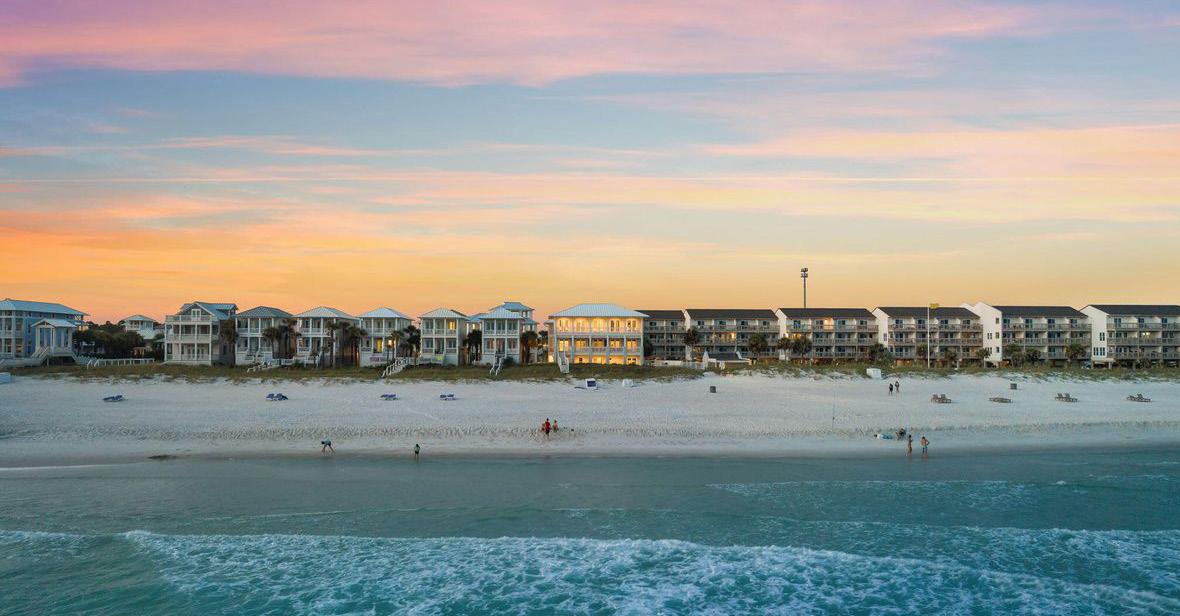
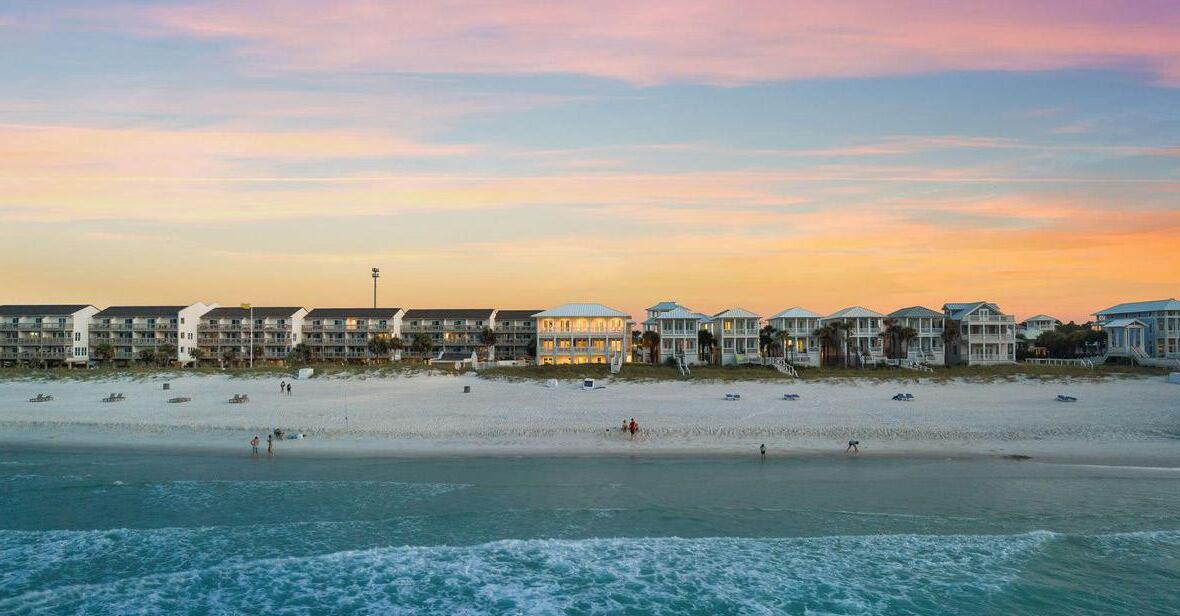
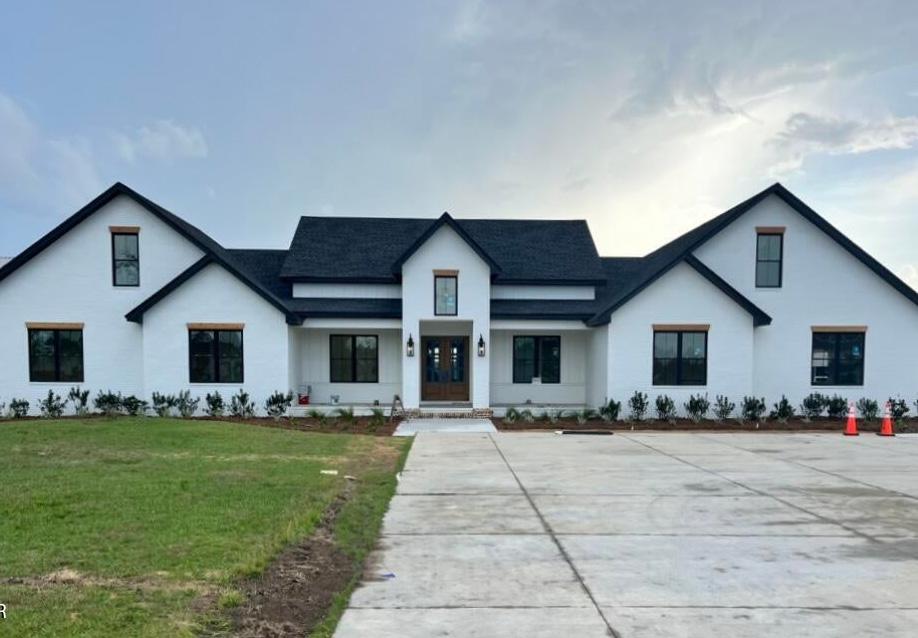
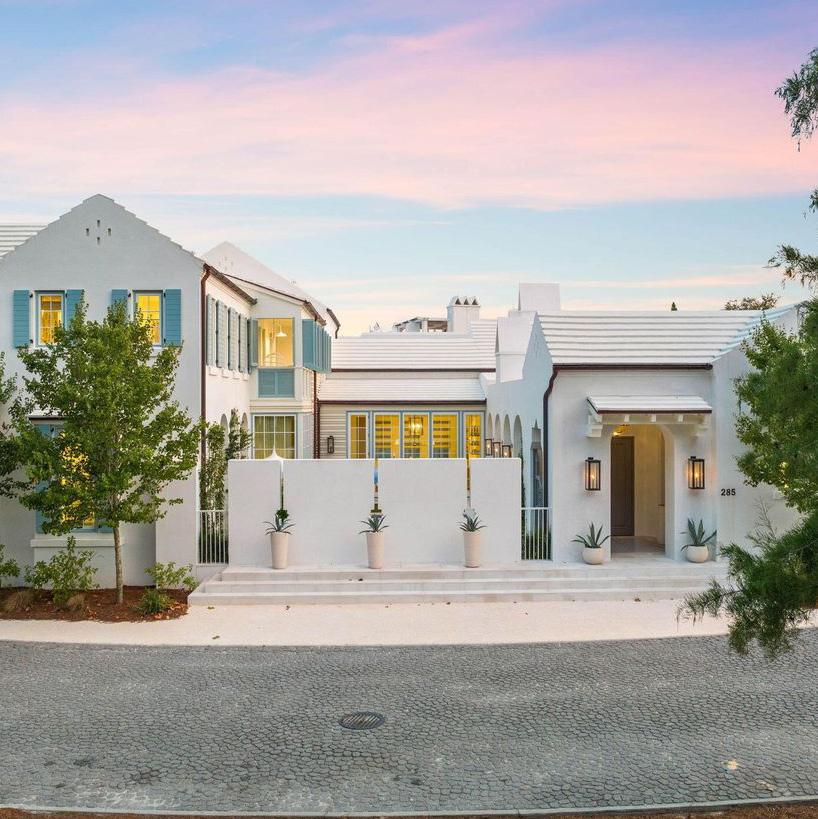
Nestled along the stunning Emerald Coast, Destin, Florida, offers a unique blend of natural beauty, upscale living, and robust financial returns, making it a premier destination for luxury real estate investment. Renowned for its pristine white-sand beaches and crystal-clear emerald waters, Destin provides a picturesque backdrop that attracts visitors and investors alike. The area’s scenic beauty, coupled with year-round sunshine, makes it an idyllic location for both vacationers and permanent residents seeking an upscale coastal lifestyle.
Destin is a vibrant and close-knit community, offering an array of exclusive amenities and activities. From world-class golf courses and deep-sea fishing to luxury shopping at Destin Commons and fine dining at award-winning restaurants, the lifestyle in Destin is nothing short of extraordinary. Destin boasts a lively harbor district with bustling nightlife, marinas, and a variety of entertainment options. This dynamic atmosphere, along with a rich calendar of events, ensures there’s always something to look forward to, enhancing the appeal and value of investing in this energetic coastal haven.
• Closed Sales Decline Substantially - Closed sales dropped by 23% year-over-year in Q3 2024, with only 57 sales recorded, compared to 74 in Q3 2023. The quarter-over-quarter decline is even more pronounced, with a 33% decrease from Q2 2024, when 85 sales were recorded. This sharp drop indicates a significant cooling in buyer activity in the Destin market.
• Contracts Signed Reflect Buyer Caution Amid Broader Economic Conditions - Contracts signed experienced a notable 30% year-over-year decline, reaching 55 in Q3 2024, down from 79 the previous year. This 36% quarter-over-quarter drop reflects a combination of seasonal shifts in a tourist-driven market and broader economic factors, such as inflation and elevated borrowing costs, that have made buyers more cautious. With Destin’s seasonal appeal, fluctuations are expected, but the current drop highlights the complexity of balancing these economic forces.
• Sales Volume Reflects Market Slowdown - Sales volume fell by 24% year-over-year to $67.2M in Q3 2024, down from $88.71M in Q3 2023. The quarter-over-quarter decline was similarly sharp at 27%, reflecting a significant reduction in high-value transactions as fewer properties changed hands.
• Days on Market Surge - The average days on market increased by 62% year-over-year, rising from 53 days in Q3 2023 to 86 days in Q3 2024. Compared to the previous quarter, days on market increased by 6%, indicating that properties are taking longer to sell as buyers weigh their options and move cautiously in this market climate.
• Significant Drop in Median Sale Price - The median sale price in Q3 2024 decreased by 38% year-over-year, falling from $1.05M to $653K. Quarter-overquarter, the median price dropped by 18%, indicating a notable shift in the composition of sales towards lower-priced properties, likely reflecting market adjustments and buyer affordability concerns.
• Average Sale Price Remains Stable - Despite the sharp decline in the median sale price, the average sale price increased by 5% year-over-year, reaching $1.184M in Q3 2024, up from $1.124M in Q3 2023. Quarter-over-quarter, the average sale price also saw an 8% rise, suggesting that while more lower-priced properties have sold, high-end sales continue to prop up the average.
• New List Prices Show Divergence - The new median list price declined slightly by 1% year-over-year to $975K, and dropped by 22% quarter-over-quarter, signaling some caution among sellers adjusting to market realities. In contrast, the new average list price rose by 15% year-over-year to $1.593M, showing that higher-end sellers remain confident in maintaining their price expectations despite broader market shifts.
• Widening Gap Between Median and Average Prices - The growing gap between the declining median sale price and rising average sale price points to a bifurcation in the market. This suggests that while lower-priced properties are moving more quickly, the luxury segment remains resilient, with higher-end sales still supporting the overall market.
CHANGE (YEAR-OVER-YEAR) 3Q24 3Q23
UNDER $500K
$500K TO $1M
$1M TO $3M
$3M TO $5M
In Q3 2024, properties across all price ranges in Destin stayed on the market longer. The $500K-$1M segment saw the biggest jump, with days on market increasing by 318% to 117 days from 28 last year. The $3M-$5M range also saw a rise, up 76% to 134 days. Even lower-priced properties under $500K experienced a 24% increase, now averaging 73 days. This data points to slower buyer activity and longer decision-making times in the current market.
In Q3 2024, properties priced between $1M and $3M continued to lead the market, making up 39% of sales, showing a steady preference for mid-range luxury homes. Homes priced under $500K now represent just 26% of the market, reflecting a decrease from previous years, as availability in this segment continues to shrink. The $3M-$5M range, though smaller, still accounted for 5% of sales, indicating ongoing interest in higher-end properties. Meanwhile, properties in the $500K-$1M range held 28% of the market, up from 22% in Q3 2023, suggesting that demand for more moderately priced homes remains strong. The overall shift toward higher price points highlights how rising property values and limited lowerpriced inventory are reshaping Destin’s real estate landscape.
• Active Listings Increase - Despite the drop in new listings, active listings rose by 12% year-over-year, reaching 215 in Q3 2024 compared to 192 in the previous year. This suggests that while fewer new properties are hitting the market, existing listings are staying active for longer.
• Breakdown of New Listings by Price Range - The decline in new listings was most significant in the $500K-$1M segment, which saw a 36% drop year-over-year. The $1M-$3M range also declined by 21%. In contrast, new listings in the $3M-$5M range saw a slight increase of 4%, highlighting growing activity in the luxury market, even as overall new listings decrease.
• Limited New Listings Under $500K - The number of new listings under $500K remained relatively flat, with a slight decrease of 5% year-over-year, showing continued scarcity in the lower-priced segment of the market.

TO $5M


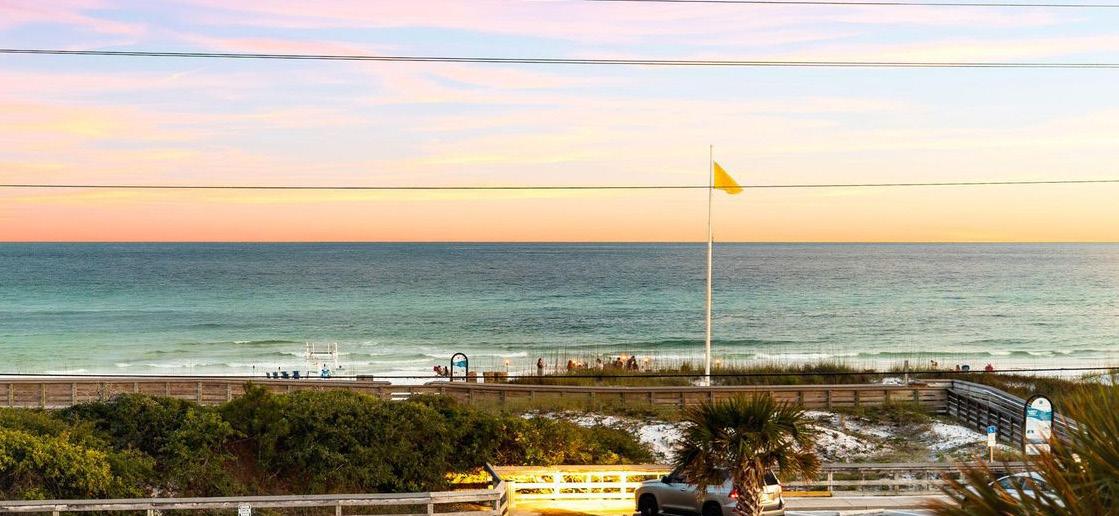
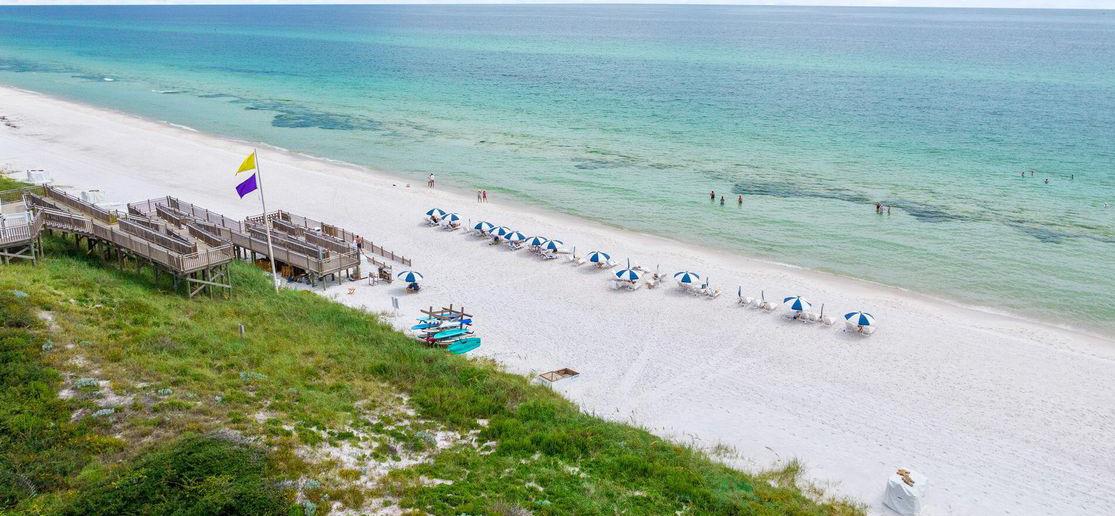
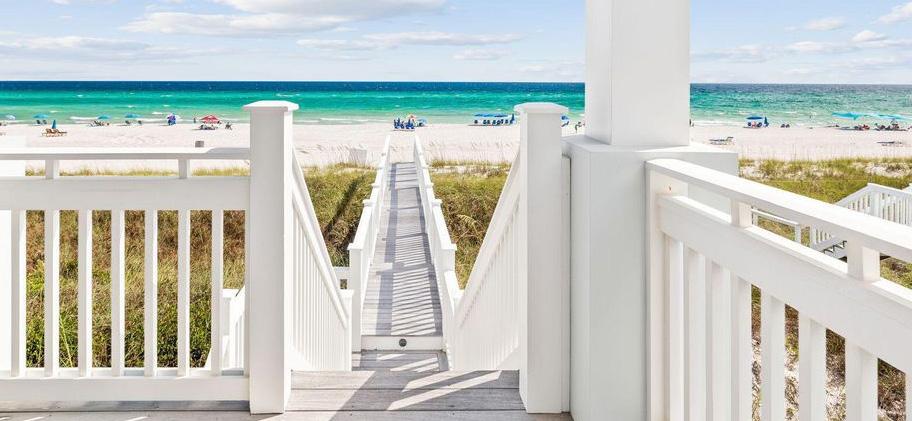
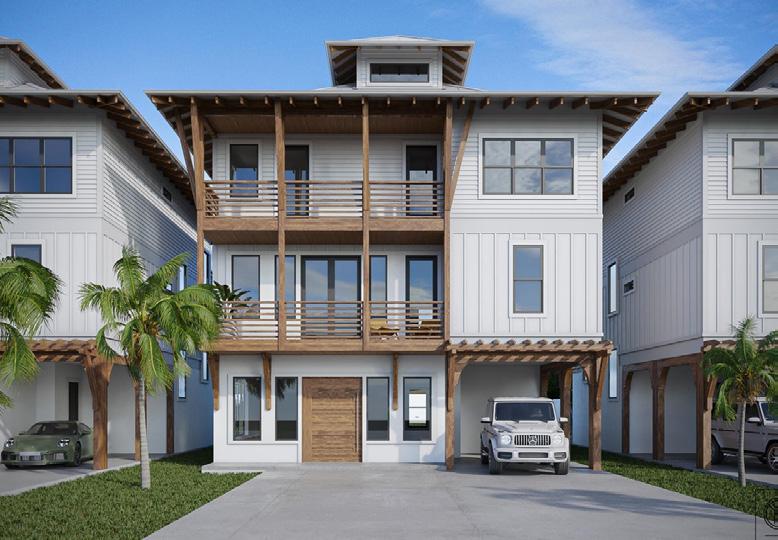
Where the sand meets the surf, you’ll find it all.
This coastal paradise is renowned for its 27 miles of pristine white-sand beaches, crystal-clear emerald waters, and stunning sunsets. Outdoor enthusiasts will appreciate the opportunities for water sports, fishing, and eco-tours through nearby state parks and conservation areas. The community is warm and welcoming, with a rich tapestry of events and activities year-round, including music festivals, art shows, farmers’ markets, and cultural celebrations.
Panama City Beach offers an array of attractions and renowned dining experiences. Pier Park is a premier shopping, dining, and entertainment complex, featuring over 120 stores, a variety of restaurants, an IMAX theater, and an amusement park. Nature lovers can explore St. Andrews State Park, known for its excellent snorkeling and scuba diving spots, and Shell Island, a secluded retreat accessible only by boat. Dining highlights include Firefly, an award-winning fine dining restaurant, Pineapple Willy’s, famous for its beachfront dining and seafood, and Runaway Island, popular for its fresh seafood with a Caribbean twist. Investing in Panama City Beach real estate promises robust financial returns, driven by the area’s popularity as a vacation destination and steadily growing property values.
• Closed Sales Dip as Market Activity Slows – Closed sales in Panama City Beach dropped by 11% year-over-year in Q3 2024, with 228 sales compared to 257 in Q3 2023. Quarter-overquarter, however, sales saw a slight 1% increase from Q2 2024, indicating a steadying of activity following earlier market fluctuations.
• Contracts Signed Show Increasing Buyer Hesitation – Contracts signed in Q3 2024 fell by 15% year-over-year, with 199 contracts signed compared to 234 in Q3 2023. The quarter-over-quarter decline was sharper at 17%, from 241 in Q2 2024, signaling heightened caution among buyers due to economic conditions like rising interest rates.
• Sales Volume Declines with Fewer High-Value Transactions – Sales volume decreased by 19% year-over-year, from $179 million in Q3 2023 to $144 million in Q3 2024. The quarter-overquarter drop of 2% reflects a continuing market slowdown, though the decline has moderated compared to the previous year.
• Days on Market Increase as Buyer Decisions Lengthen – Properties are taking longer to sell, with the average days on market rising by 38% year-over-year, from 63 days in Q3 2023 to 87 days in Q3 2024. Quarter-over-quarter, there was a minimal 1% increase, showing a more competitive environment for sellers as buyers take more time to make decisions.
• Median Sale Price Slips Slightly – The median sale price for Q3 2024 was $511K, reflecting a 3% year-over-year decline from $525K in Q3 2023. There was a 2% decrease quarter-over-quarter, from $520K in Q2 2024, signaling a modest softening in property pricing for the market.
• Average Sale Price Experiences Notable Decline – The average sale price dropped by 10% year-over-year, falling from $695K in Q3 2023 to $626K in Q3 2024. Quarter-over-quarter, the average price also saw a 5% reduction from $659K in Q2 2024, pointing to fewer high-value transactions contributing to overall price declines.
• New Median List Price Shows Stability – The new median list price remained stable with a slight 1% year-over-year increase, reaching $554K in Q3 2024 compared to $551K in Q3 2023. Quarter-over-quarter, the price was unchanged, holding at $552K in Q2 2024, reflecting consistency in seller expectations.
• New Average List Price Climbs Despite Market Shifts – The new average list price increased by 8% year-over-year to $806K in Q3 2024, up from $748K in Q3 2023. However, quarter-over-quarter, there was a 6% decrease from $853K in Q2 2024, indicating that while the market remains robust, sellers are adjusting pricing strategies to reflect current conditions.
TO $3M
UNDER $500K
$500K TO $1M
$1M TO $3M
$3M TO $5M
The days on market (DOM) in Panama City Beach have increased significantly across all price ranges in Q3 2024 compared to Q3 2023. Properties under $500K now spend an average of 91 days on the market, up 47% from 62 days last year. Homes in the $500K to $1M range saw the sharpest increase, with DOM rising by 128% to 146 days from 64 days in Q3 2023. Similarly, properties priced between $1M and $3M experienced a 50% increase, now averaging 102 days on the market compared to 68 days last year. High-end homes in the $3M to $5M range had the most dramatic change, doubling their DOM to 95 days from 47 days, a 102% increase. These figures reflect a cooling market, where buyers are taking longer to commit across all price points, particularly in the luxury sector.
The market share by price range in Panama City Beach has shifted notably over the past few years, primarily due to market conditions driven by inflation, rising interest rates, and increased construction costs. In Q3 2024, homes priced under $500K accounted for just 41% of the market, down significantly from 65% in Q3 2021. This decline reflects the impact of rising borrowing costs and materials, which have pushed home prices higher across the board. The $500K to $1M price range now dominates, making up 52% of the market, a sharp increase from 27% in Q3 2021, due to limited lowerpriced inventory. The $1M to $3M range has also grown, now representing 11% of the market, compared to 7% in 2021. Additionally, homes priced between $3M and $5M now account for 5% of the market, up from just 1% in Q3 2021.
• Active Listings Increase Year-over-Year – Active listings saw a 34% year-over-year increase in Q3 2024, rising to 554 from 413 in Q3 2023. However, the quarter-over-quarter growth was more modest, up just 3% from 540 active listings in Q2 2024, indicating more properties are staying on the market.
• Lower-Priced Listings Shrink – Listings for properties under $500K fell by 19% year-over-year, with 131 new listings in Q3 2024 compared to 162 in Q3 2023. This reflects the shrinking inventory of lower-priced homes, likely due to rising costs and fewer sellers at that price point.
• Mid-Tier Listings Decrease – Properties in the $500K to $1M range saw a 4% decline in new listings year-over-year, from 181 in Q3 2023 to 173 in Q3 2024. This drop mirrors the overall reduction in new listings, as fewer homes are being brought to market.
• Luxury Listings Hold Steady – Listings in the $1M to $3M range saw a slight 2% year-over-year decline, dropping from 46 listings in Q3 2023 to 45 in Q3 2024, suggesting stability in the luxury market despite broader market fluctuations.
$500K TO $1M
$1M TO $3M
$3M TO $5M

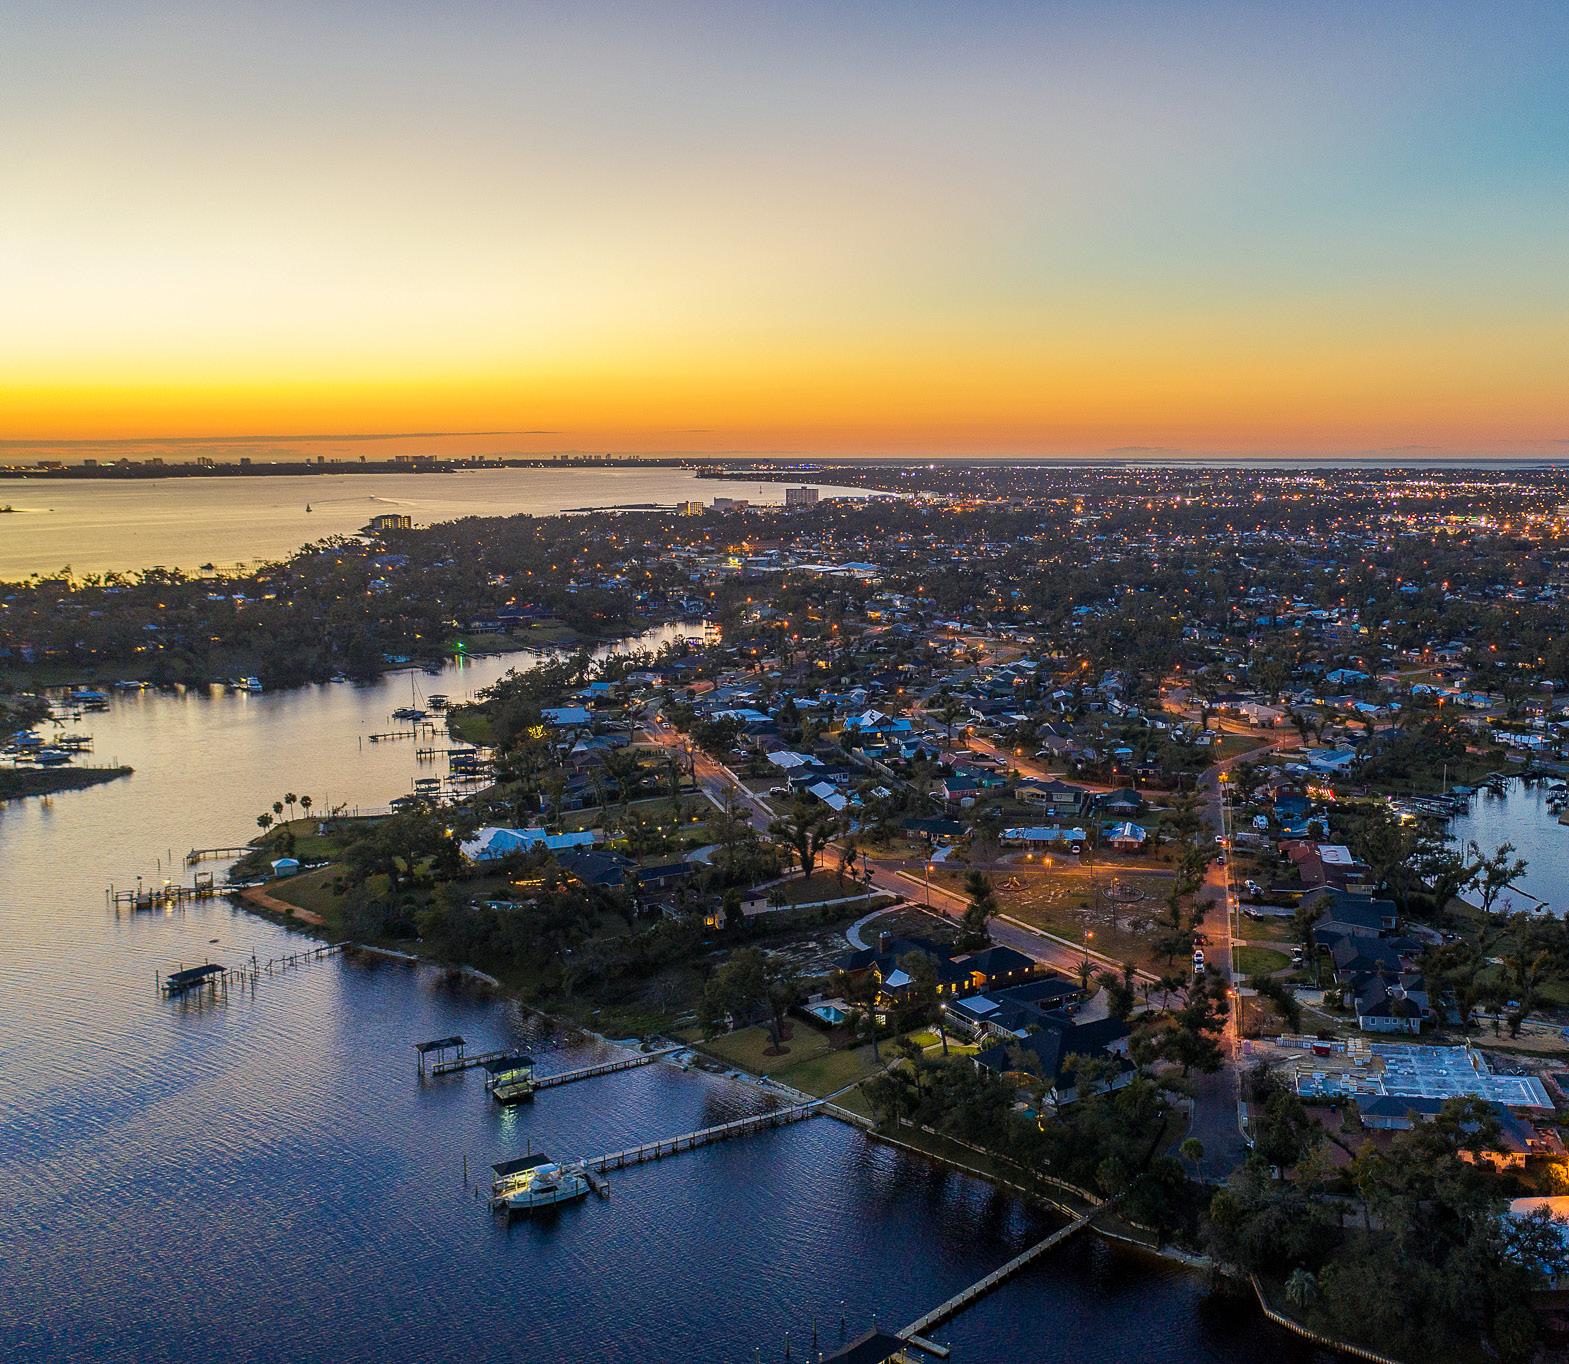
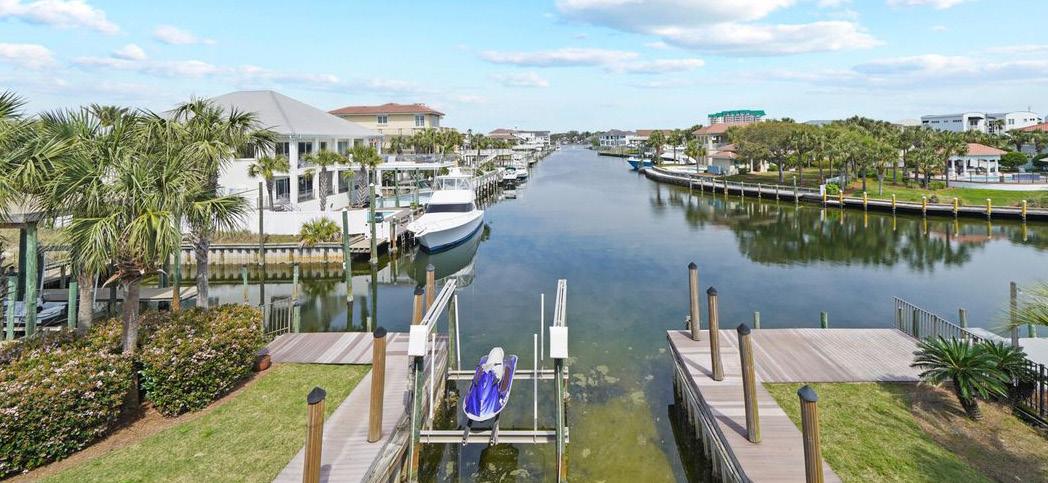
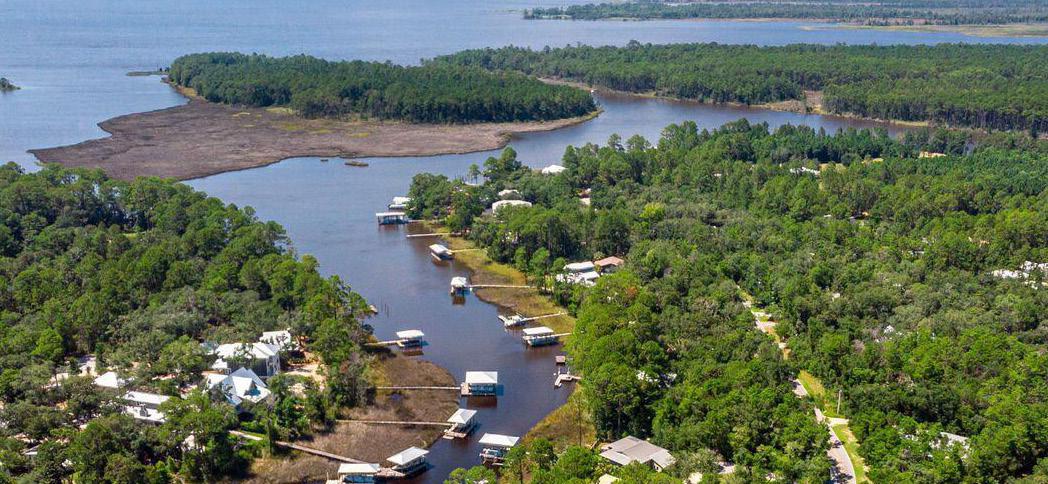
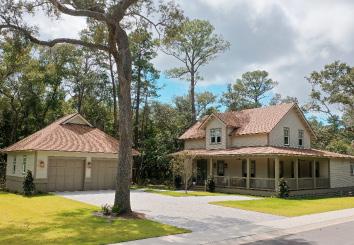
Known for its picturesque waterfront views and thriving marina culture, Panama City offers an inviting atmosphere for both residents and visitors. The city is a gateway to stunning natural landscapes, including the pristine beaches of the Gulf of Mexico and the serene beauty of St. Andrews Bay. Outdoor enthusiasts can indulge in boating, fishing, and various water sports, while enjoying the warm, sunny climate year-round.
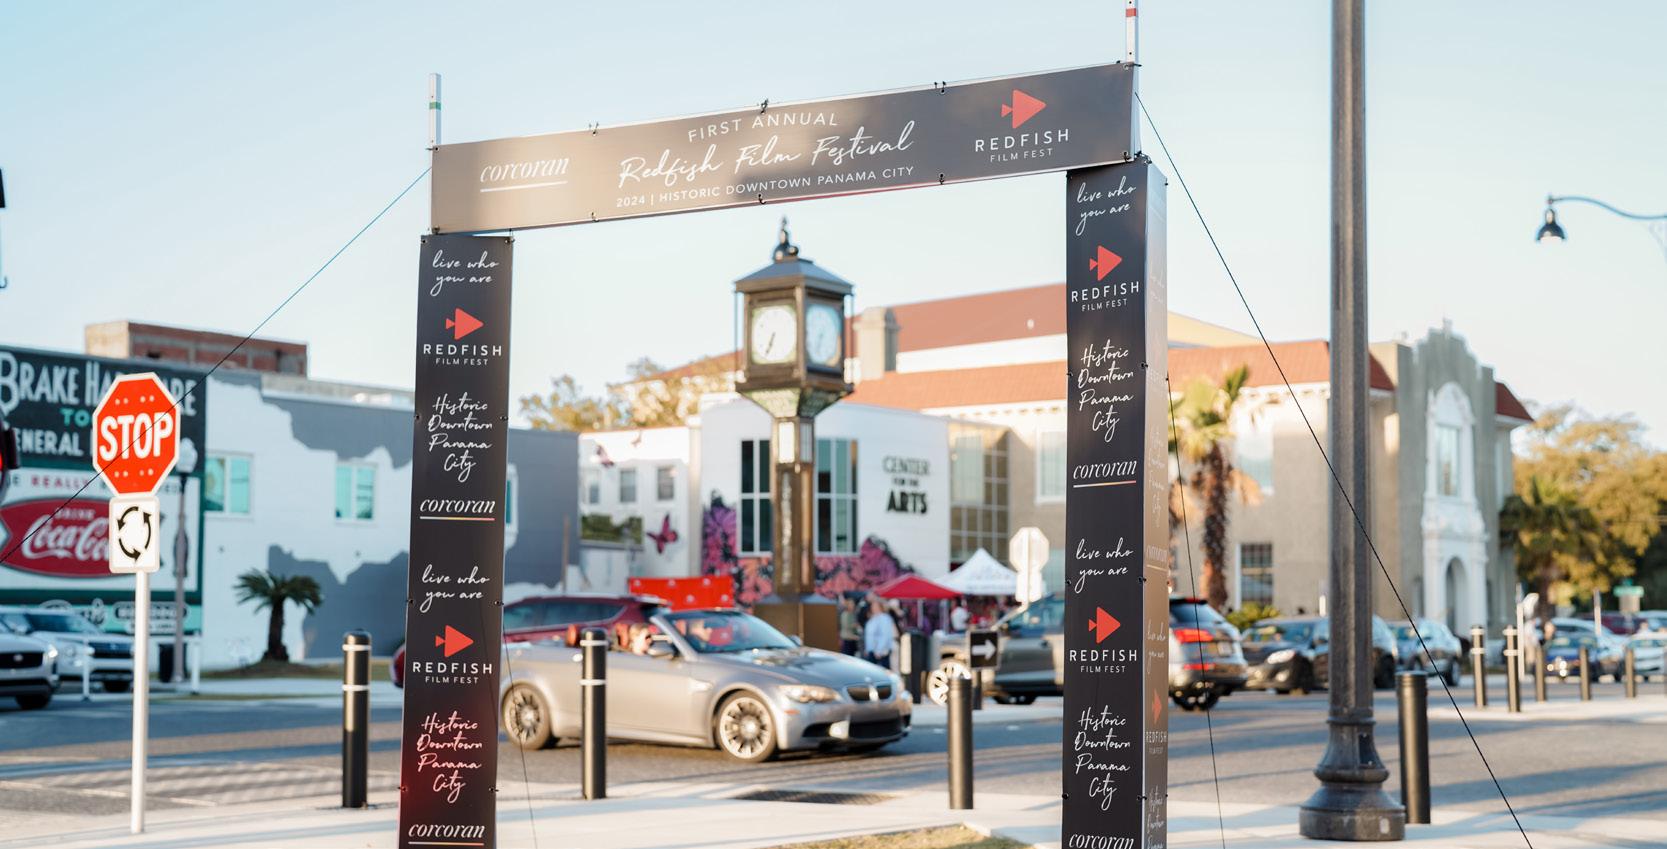
Historic Downtown Panama City is a hub of activity, featuring charming boutiques, art galleries, and a variety of dining options. Key attractions include the Panama City Marina, which hosts numerous boating events and the Marina Civic Center, a venue for concerts and performances. Notable dining experiences include The Grand Marlin, renowned for its fresh seafood and waterfront dining, and Hunt’s Oyster Bar, a local favorite for casual, yet delectable, seafood dishes. With its appealing lifestyle, beautiful surroundings, and steady growth in property values, investing in Panama City real estate promises attractive financial returns and a high quality of life.
• Closed Sales Decrease Slightly – Closed sales dropped by 5% year-over-year in Q3 2024, with 441 sales compared to 463 in Q3 2023. Quarter-over-quarter, sales fell by 6% from 468 in Q2 2024, signaling a moderate slowdown in transaction activity.
• Contracts Signed Edge Lower – Contracts signed declined by 2% year-over-year, with 421 signed in Q3 2024 compared to 430 in Q3 2023. The quarter-over-quarter decrease was more pronounced at 15%, down from 493 in Q2 2024, reflecting some hesitation from buyers as market conditions shift.
• Sales Volume Increases – Sales volume grew 4% year-over-year, from $156 million in Q3 2023 to $162 million in Q3 2024, indicating higher transaction values despite the decrease in the number of closed sales. Quarter-over-quarter, sales volume dropped 2% from $164 million in Q2 2024.
• Days on Market Hold Steady – The average days on market remained unchanged year-overyear at 58 days in both Q3 2024 and Q3 2023. Quarter-over-quarter, days on market decreased slightly by 5%, from 61 days in Q2 2024, showing a stable selling pace for properties.
• Median Sale Price Declines – The median sale price in Q3 2024 dropped by 3% year-overyear to $511K, down from $525K in Q3 2023. There was a 2% quarter-over-quarter decrease from $520K in Q2 2024, reflecting a slight easing in property prices.
• Average Sale Price Falls Notably – The average sale price experienced a 10% year-overyear decline, dropping from $695K in Q3 2023 to $626K in Q3 2024. Quarter-over-quarter, the average price also decreased by 5% from $659K in Q2 2024, indicating fewer high-value sales.
• New Median List Price Increases – The new median list price increased by 8% year-overyear, rising from $309K in Q3 2023 to $333K in Q3 2024. Quarter-over-quarter, there was a slight 1% increase from $330K in Q2 2024, suggesting that sellers are maintaining higher expectations.
• New Average List Price Surges – The new average list price saw a significant 18% increase year-over-year, climbing from $343K in Q3 2023 to $404K in Q3 2024. However, quarter-overquarter, the list price decreased slightly by 1%, from $409K in Q2 2024, showing a minor adjustment as sellers respond to market conditions.
UNDER $250K
$250K TO $500K
$500K TO $750K
$750K-1M
$1M+
UNDER $250K
$250K TO $500K
$500K TO $750K
$750K-1M
$1M+
The Days on Market (DOM) data for Panama City in Q3 2024 reveals that properties are generally spending more time on the market compared to the previous year. Homes priced under $250K are now taking an average of 64 days to sell, a significant 64% increase from 39 days in Q3 2023. Properties in the $250K to $500K range saw a slight decrease in DOM, averaging 57 days in Q3 2024, down 5% from 60 days the previous year. Homes in the $500K to $750K range also saw a decrease in DOM, dropping by 18% to 51 days, compared to 62 days in Q3 2023. The most notable improvement occurred in the $750K to $1M range, where DOM fell by 38%, from 69 days in Q3 2023 to just 43 days in Q3 2024. Meanwhile, properties priced at $1M+ remained steady, with an unchanged average of 87 days on the market year-over-year. This data suggests that while lower-priced homes are taking longer to sell, there is increasing movement in the mid to upper-tier segments.
The market share of sales by price range in Panama City has seen a notable shift toward higher-priced homes over the past few years. In Q3 2024, properties priced between $250K and $500K dominated the market, making up 69% of sales, up from 52% in Q3 2021. Homes in the $500K to $750K range have remained relatively stable, accounting for 15% in Q3 2024, down slightly from 17% in Q3 2023 but up from just 7% in Q3 2022. The $750K to $1M segment has grown modestly, now representing 11% of the market, compared to 6% in Q3 2023. Meanwhile, homes priced under $250K have nearly disappeared, representing only 3% of sales in Q3 2024, down from 42% in Q3 2021, highlighting the effects of rising prices and shrinking inventory at lower price points. This trend reflects ongoing market conditions where fewer affordable homes are available, pushing buyers into higher price brackets.
• New Listings Slight Increase – New listings rose by 2% year-over-year in Q3 2024, with 582 new listings compared to 571 in Q3 2023. However, quarter-over-quarter, new listings dropped by 36% from 694 in Q2 2024, reflecting seasonal or market-related slowdowns.
• Active Listings Drop Significantly – Active listings saw a sharp 43% year-over-year decline, falling from 405 in Q3 2023 to 231 in Q3 2024, signaling a tightening inventory. However, quarter-overquarter, active listings increased by 37%, suggesting some recovery from earlier market lows.
• Listings Under $250K Decline – New listings for properties under $250K fell by 14% year-over-year, from 108 in Q3 2023 to 93 in Q3 2024, indicating fewer homes in the lower price range entering the market.
• Mid-Tier Listings Experience Mixed Changes – New listings in the $250K to $500K range dropped by 10%, from 425 in Q3 2023 to 381 in Q3 2024. In contrast, listings for homes priced between $500K and $750K surged by 170%, rising from 33 in Q3 2023 to 89 in Q3 2024, highlighting growth in mid-tier inventory.
• Significant Increase in High-End Listings – Homes in the $750K to $1M range saw a 280% year-overyear increase, with 19 listings in Q3 2024 compared to just 5 in Q3 2023, showing a notable rise in high-end market activity. Listings in the $1M+ range, however, fell by 33%, with only 6 new listings in Q3 2024, down from 9 in Q3 2023.
$250K TO $500K
$500K TO $750K
$250K TO $500K
$500K TO $750K
$750K-1M $1M+ 3Q23


Summer 2024
The percentage of nights booked for guests (Nights Sold), out of the number of Total Nights available to book for guests (Nights Available). By comparison, Occupancy Rate, the traditional hospitality KPI, calculates the percentage of Nights Sold out of the Total Nights in the period, without considering the Unavailable Nights. Because owner reservations and hold nights take up some of the nights typically, Available Occupancy is helpful to how well you’ve filled up the properties from the nights that were available for you to fill with guests. = Nights Sold / Nights Available
Revenue Per Available “Room” with hotels. A critical KPI for measuring revenue performance, RevPAR takes into account both the average rate at which you booked the property (ADR) and the number of nights it was booked (Occupancy). This provides a better indicator of overall performance when compared to looking at the ADR or the Occupany alone. = Occupancy x ADR (or) Total Unit Revenue / Nights Available in a given period

57 N CASTLE HARBOUR DRIVE
LISTING REPRESENTED BY: COLGAN, SIMON, WRIGHT
11 SUNDEW PLACE
BUYER REPRESENTED BY: THE SIMPSON GROUP
LISTING REPRESENTED BY: HILARY & JACOB, SYDNEY VOLKERT
$5.75M
502 RADCLIFF AVENUE
BUYER & LISTING REPRESENTED BY: SOSTHEIM GROUP
$2.17M $6.25M
BUYER REPRESENTED BY:
Recognizing the Outstanding Efforts of Women Driving the Economy Forward

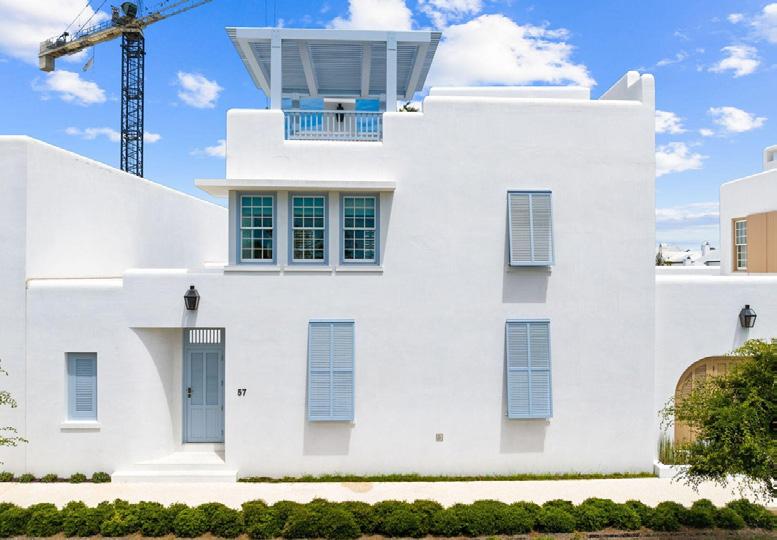
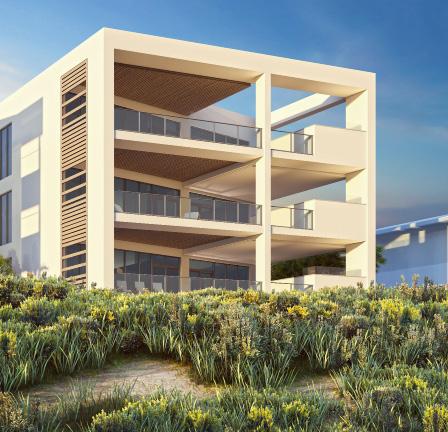
Introducing Costera: The Ultimate Luxury Coastal Living on Florida’s Scenic Hwy 30A
Corcoran Reverie Takes Honors as Best Residential Real Estate Company
Introducing Costera: The Ultimate Luxury Coastal Living on Florida’s Scenic Hwy 30A

CLIENTS SERVED
STATE SIDES RANK AVERAGE TRANSACTION PRICE 2023 SALES VOLUME STATE VOLUME NATIONAL VOLUME