The Reverie Review
Q1 2025 | Market Report


Q1 2025 | Market Report
PRESENTED BY
DISCLAIMER: SOURCE: TRENDGRAPHIX BASED ON DATA SUPPLIED BY THE EMERALD COAST ASSOCIATION OF REALTORS MULTIPLE LISTING SERVICE AND CENTRAL PANHANDLE ASSOCIATION OF REALTORS MULTIPLE LISTING SERVICE. THE INFORMATION, DATA, AND FIGURES CONTAINED HEREIN ARE PROVIDED FOR GENERAL INFORMATIONAL PURPOSES ONLY. WHILE EVERY EFFORT HAS BEEN MADE TO ENSURE THE ACCURACY, COMPLETENESS, AND RELIABILITY OF THE INFORMATION, CORCORAN REVERIE MAKES NO REPRESENTATIONS OR WARRANTIES, EXPRESS OR IMPLIED, REGARDING THE ACCURACY, ADEQUACY, VALIDITY, RELIABILITY, AVAILABILITY, OR COMPLETENESS OF ANY INFORMATION PROVIDED.

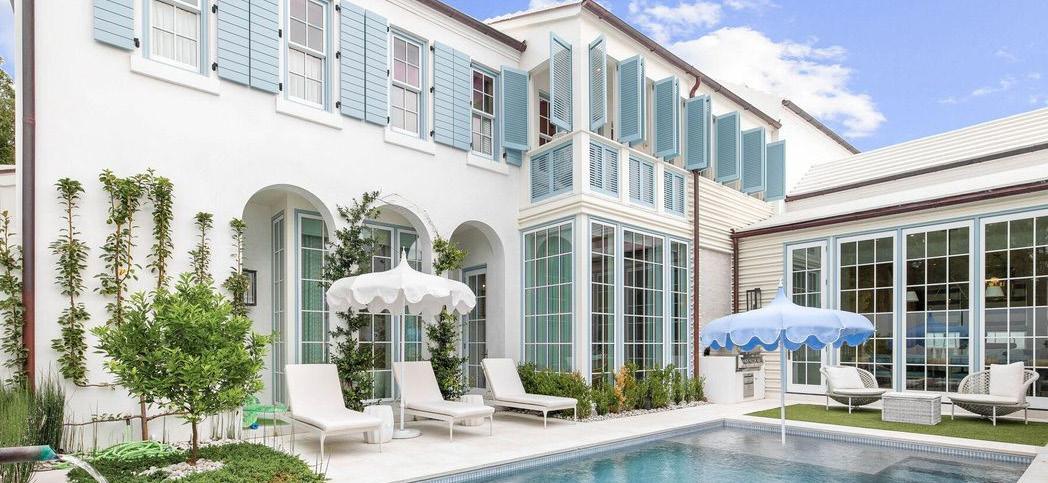
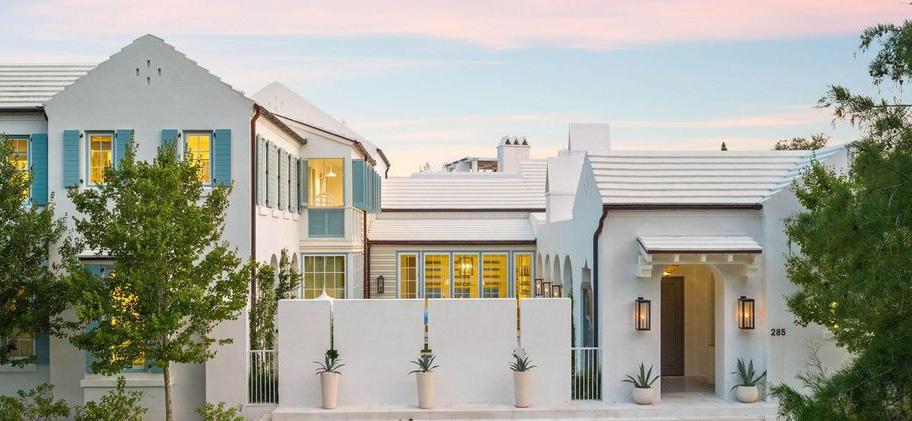
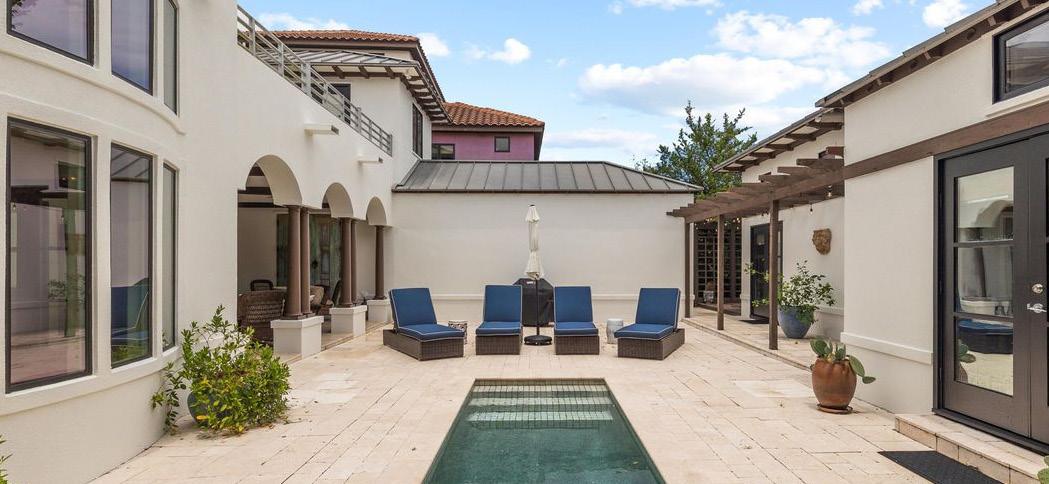
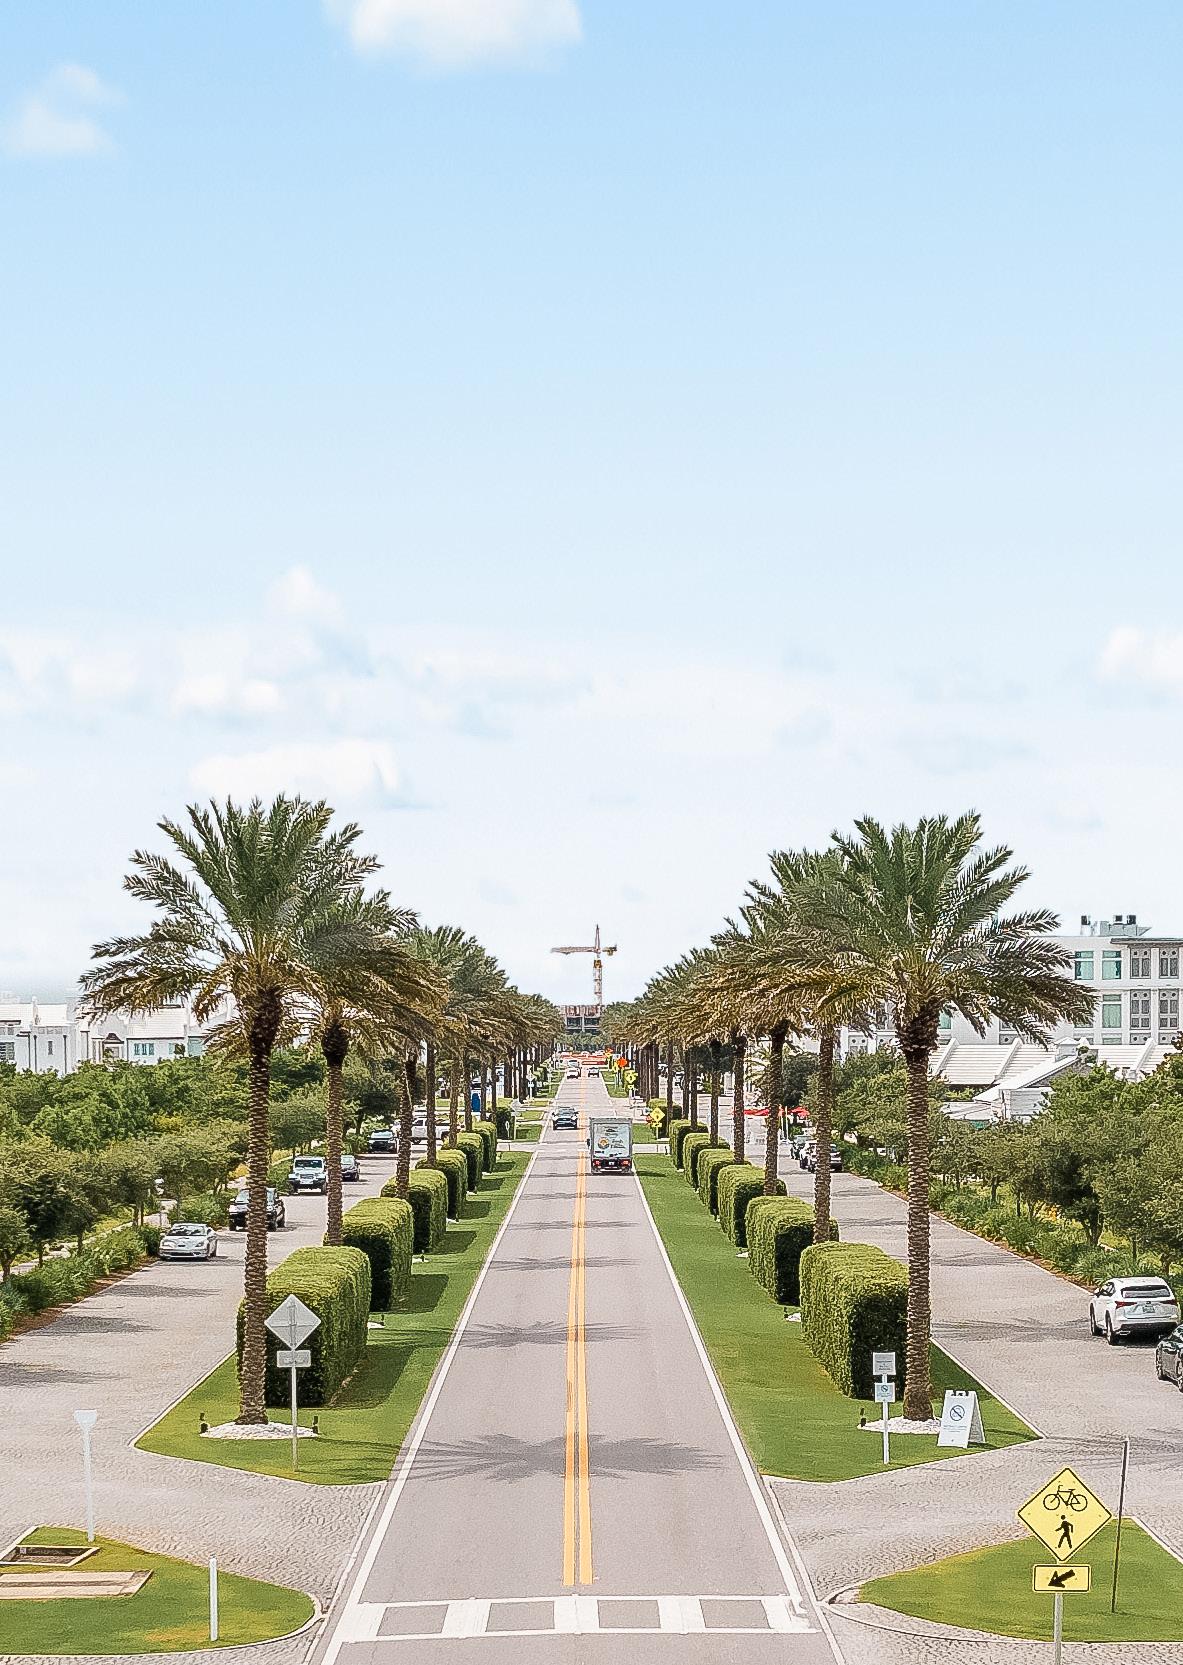
A place unlike anywhere else.
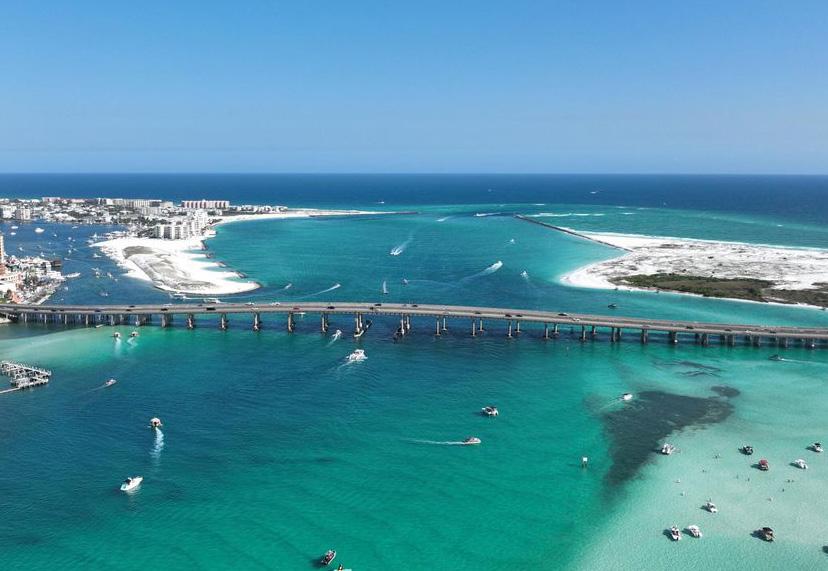
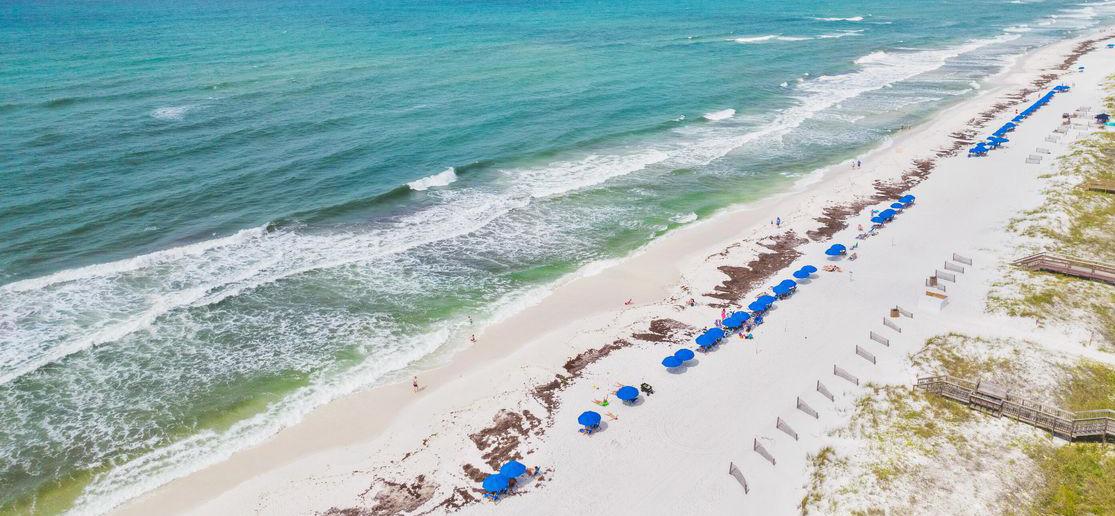
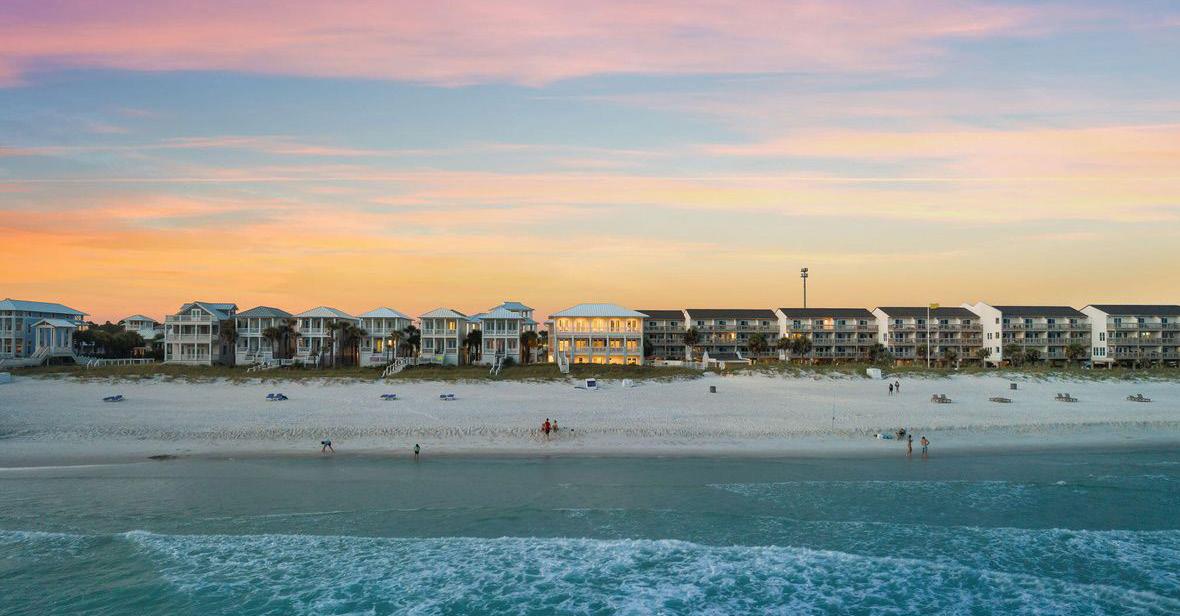
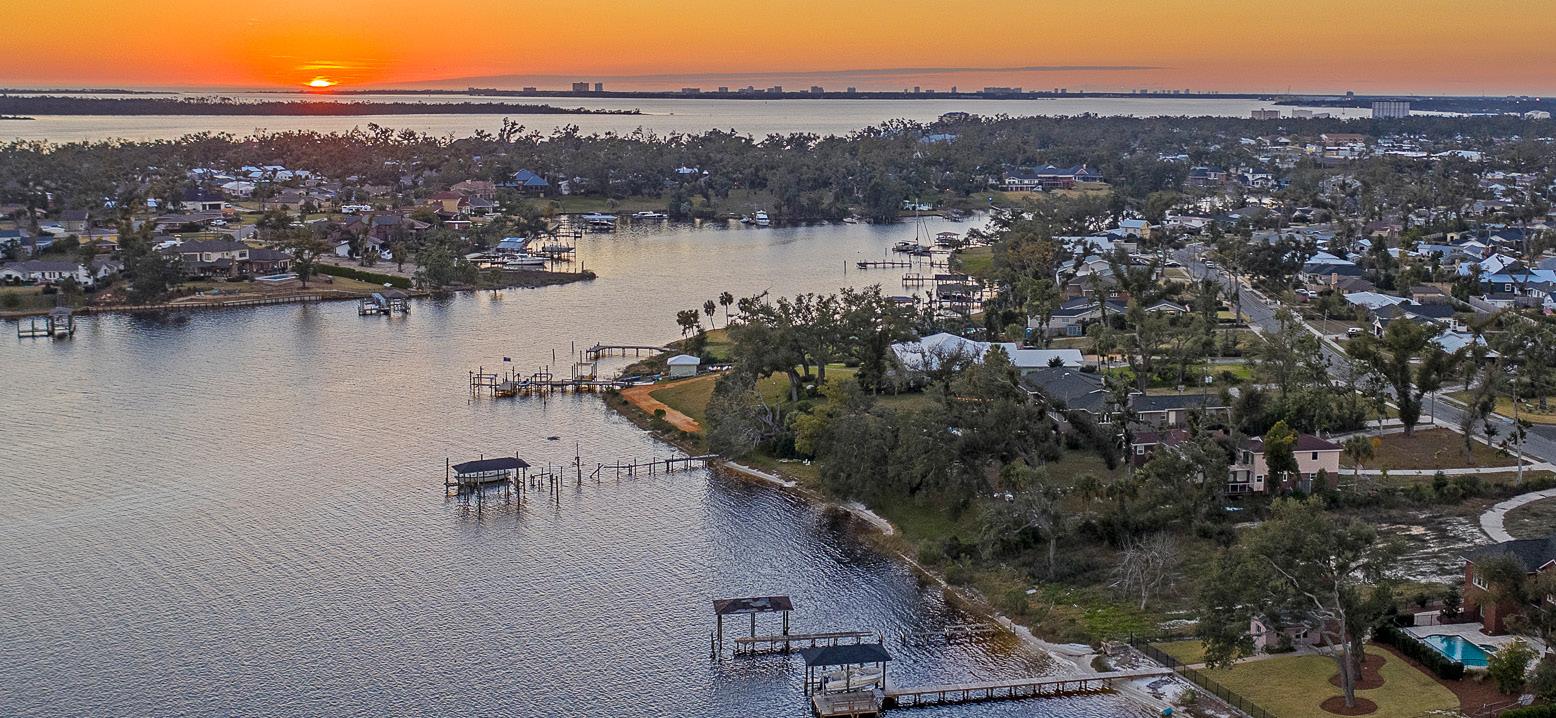
Scenic Highway 30A continues to captivate investors with its unparalleled beauty and exclusive charm. This 28.5-mile stretch along Florida’s Emerald Coast is renowned for its pristine white-sand beaches, crystal-clear turquoise waters, and rare coastal dune lakes. Envision waking up to the serene sounds of the Gulf, spending your days paddleboarding, kayaking, or biking through picturesque trails, and enjoying the quaint, upscale ambiance of communities like Rosemary Beach, Seaside, and Alys Beach. The area offers a unique blend of luxury living and small-town charm, making it a highly desirable destination for those seeking the finest in coastal living. The robust rental market, characterized by high occupancy rates and premium rental prices, continues to provide attractive income opportunities for investors.
Northwest Florida’s economic stability, bolstered by a thriving tourism sector and a favorable tax environment with no state income tax, enhances 30A’s appeal. The area’s continuous development, including new luxury projects and infrastructure improvements, promises to further elevate property values and investment potential. Scenic Highway 30A offers an exceptional blend of natural beauty, vibrant community life, and strong financial returns, solidifying its status as a premier location for both luxury living and investment.
• Closed Sales Growth Despite Longer Days on Market - Scenic Highway 30A recorded a 4% year-over-year increase in closed sales, reaching 217 transactions in the first quarter of 2025. While this reflects a 6% decrease from the fourth quarter of 2024, it aligns with typical seasonal trends. Average days on market rose to 96—up 17% year-over-year—signaling a more deliberate buyer approach as consumers navigate ongoing economic uncertainty.
• Contracts Signed Reflect Steady Demand and Seasonal Shifts - A total of 238 contracts were signed in in the first quarter, a 4% decline compared to the same period last year, yet a 7% increase over the previous quarter. This modest quarter-over-quarter rise indicates early spring momentum and underscores steady demand, despite broader market caution.
• Sales Volume Indicates Continued Strength in the Luxury Segment - Sales volume surged to $484M in the first quarter of 2025—up 13% year-over-year—despite fewer transactions than in the fourth quarter of 2024. This growth highlights sustained interest in high-value properties, reinforcing 30A’s position as a top-tier destination for luxury buyers.
• Market Resilience Anchored by Long-Term Value - Seller confidence remains strong, supported by price stability and ongoing buyer interest. The combination of higher sales volume and a more measured pace of transactions points to a balanced, resilient market driven by long-term lifestyle and investment appeal.
• Average Sale Prices Edge Higher Despite Quarterly Dip - The average sale price on Scenic Highway 30A rose 7% year-over-year to $2.24M, even as it declined 11% from fourth quarter 2024’s $2.50M. This trend reflects continued demand for luxury properties, though buyers appear more price-sensitive following last year’s peak pricing.
• Median Sale Prices Ease with Market Recalibration - Median sale prices declined 6% year-over-year to $1.34M, and fell 10% from the previous quarter, indicating a softening in mid-tier activity. The shift may point to buyers seeking greater value in an evolving high-end market.
• Pending Prices Showcase Strong Buyer Engagement at the Top - Pending list prices rose sharply, with the average pending price up 15% year-over-year to $2.60M and 4% from the fourth quarter of 2024, pointing to ongoing interest in premium properties. Median pending prices also saw a 2% gain from both first & fourth quarters 2024, reinforcing steady momentum at higher price points.
• Active Listing Prices Continue Upward Trend - The average active list price rose to $2.90M, marking a 6% annual increase and a 9% gain quarter-over-quarter. Median active prices followed a similar path, up 7% year-over-year and 2% from fourth quarter 2024, reflecting steady upward pressure on pricing across available inventory.
• 30A Pricing Trends Underscore Market Resilience - While select pricing metrics reflect moderation, Scenic Highway 30A continues to demonstrate price strength and long-term value. Buyers remain drawn to the area’s lifestyle appeal, while sellers strategically position properties to capture motivated demand.
| List Price
$500K TO $1M $1M TO $3M $3M TO $5M
TO $5M
Days on market across 30A saw some softening in early 2025, particularly in the mid-tier price ranges. Homes priced $500K to $1M and $1M to $3M averaged 97 and 95 days on m arket, up 31% and 22% year-over-year, respectively. These increases suggest buyers are taking a more measured approach as they navigate a changing market. Higher-end segments saw more balanced movement. Properties in the $3M to $5M range averaged 84 days, improving 9% year-over-year, while homes $5M+ held steady at 113 days, with only a slight increase from last year. Newly tracked $10M+ sold listings averaged 122 days, whereas no sales above $10M occurred in the first quarter of 2024. Across the board, timelines are adjusting—reflecting a market that’s active but discerning.
Properties priced between $1M and $3M continued to lead the 30A market in the first quarter of 2025, accounting for 47% of all sales. While this is a slight dip from 53% in the first quarter of 2024, the segment still reflects steady buyer demand for mid-range luxury homes. The $3M to $5M range s aw growth, making up 14% of the market, up from 10% the year prior. At the top end, $5M+ properties represented 10% of total sales, marking a modest gain that underscores continued interest in the ultra-luxury category. On the lower end of the spectrum, under $500K and $500K to $1M homes each made up 1% of the market, held back by limited availability. As the overall distribution shifts further into higher price brackets, the data continues to reflect 30A’s position as a predominantly luxury-driven market.
• Active Listings Tick Up Year-Over-Year - Inventory on 30A rose 8% year-over-year, with 822 active listings recorded in the first quarter of 2025. This reflects a slight 4% decline from the fourth quarter of 2024, consistent with typical seasonal patterns.
• New Listings Surge into Spring Market - 673 new listings hit the market in the first quarter of 2025, up 7% year-over-year and a sharp 63% increase from the fourth quarter of 2024, as sellers re-engaged ahead of the busy season.
• Luxury Segments Continue to Drive Inventory Growth - Listings in the $1M to $3M and $3M to $5M ranges made up the majority of available inventory, with 430 and 154 listings, respectively. These segments grew 1% and 34% year-over-year, highlighting strong listing activity in the high-end market.
• Ultra-Luxury Supply Contracts Slightly - The $5M+ category saw a 20% decrease in active inventory year-over-year, and the $10M+ tier declined from 20 to 14 listings, reflecting tighter supply at the top of the market.
• Lower Price Ranges Remain Limited - Listings under $500K and $500K to $1M remain a small portion of total inventory, despite modest year-over-year gains. Combined, these brackets account for just 17% of active listings—an ongoing result of rising home values pushing more inventory into higher price tiers.
GULF FRONT SINGLE FAMILY RESIDENCE SALES
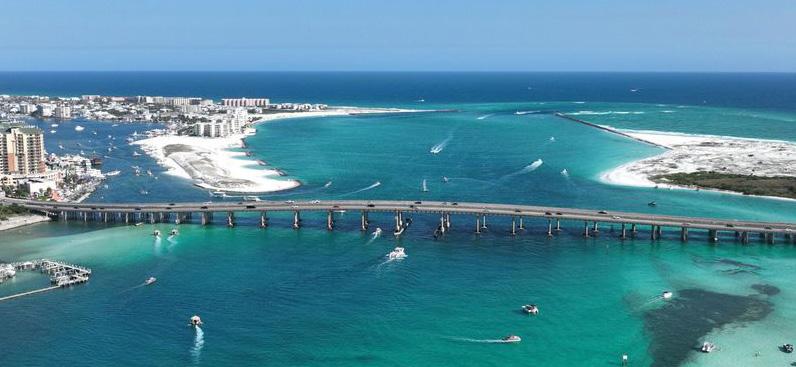
The worlds luckiest fishing villag.e.
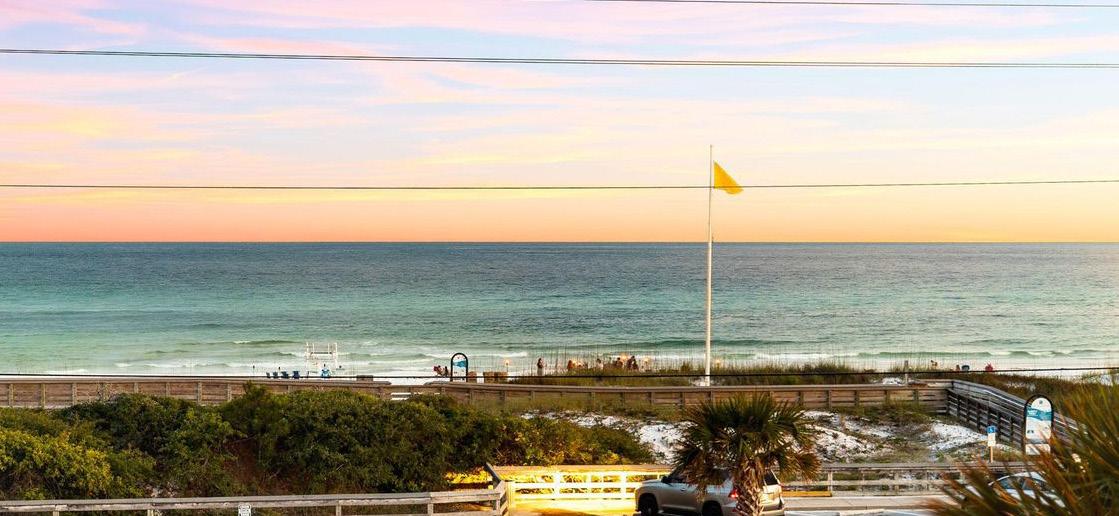
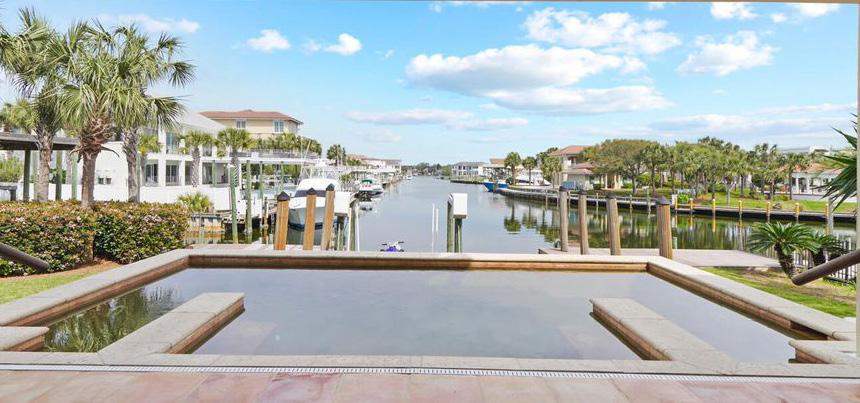
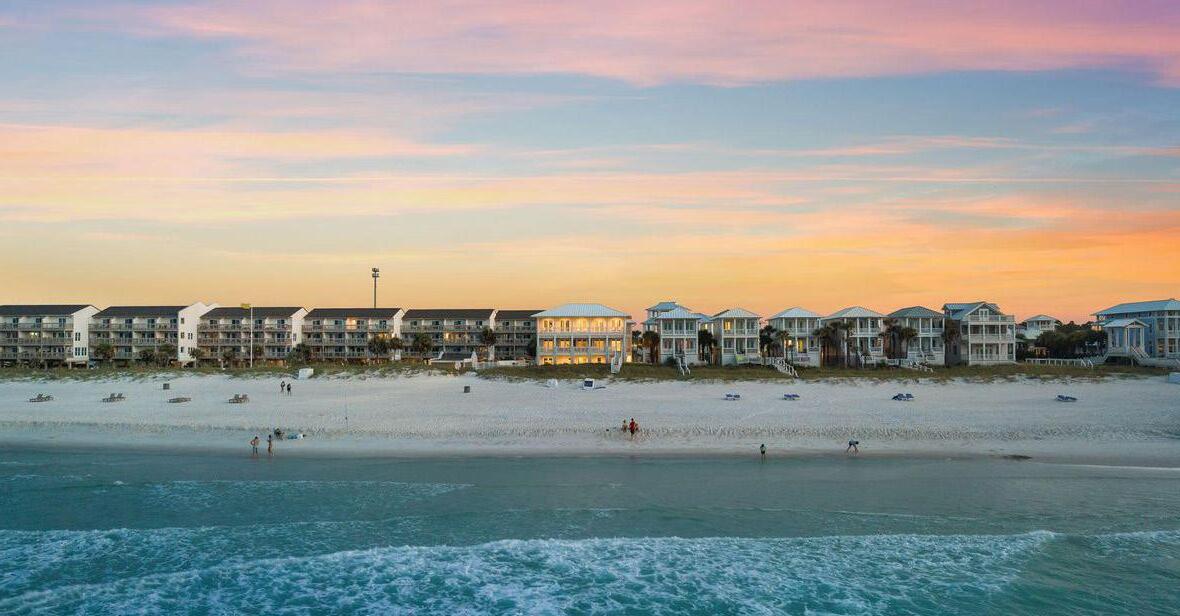
Nestled along the stunning Emerald Coast, Destin, Florida, offers a unique blend of natural beauty, upscale living, and robust financial returns, making it a premier destination for luxury real estate investment. Renowned for its pristine white-sand beaches and crystal-clear emerald waters, Destin provides a picturesque backdrop that attracts visitors and investors alike. The area’s scenic beauty, coupled with year-round sunshine, makes it an idyllic location for both vacationers and permanent residents seeking an upscale coastal lifestyle.
Destin is a vibrant and close-knit community, offering an array of exclusive amenities and activities. From world-class golf courses and deep-sea fishing to luxury shopping at Destin Commons and fine dining at award-winning restaurants, the lifestyle in Destin is nothing short of extraordinary. Destin boasts a lively harbor district with bustling nightlife, marinas, and a variety of entertainment options. This dynamic atmosphere, along with a rich calendar of events, ensures there’s always something to look forward to, enhancing the appeal and value of investing in this energetic coastal haven.
• Closed Sales Rise Modestly with Strong Quarter-End Push - 76 closings were recorded in the first quarter of 2025, a 4% increase year-over-year and a 15% gain over the fourth quarter of 2024, pointing to a seasonal rebound and steady buyer interest in the Destin market.
• Contracts Signed Reflect Steady Demand and Positive Momentum - 81 contracts were signed in the first quarter of 2025, up 7% year-over-year and 29% quarter-over-quarter, suggesting buyer confidence has returned with the help of continued demand for second-home and investment properties.
• Sales Volume Slips Due to Fewer High-Dollar Transactions - Total sales volume reached $97.70M, a 1% decrease year-over-year, though up 38% from the fourth quarter of 2024. The modest annual decline reflects a shift toward more mid-range activity, rather than a drop in demand.
• Rising Days on Market Reflect Buyer Selectivity - Average days on market rose to 96 in the first quarter of 2025, a 5% year-over-year increase. The shift points to a more measured pace among buyers, especially in segments with growing inventory or pricing resistance.
• Median Sale Prices Slide Despite Quarterly Stability - The median sale price fell 12% year-over-year to $865K, though remained flat compared to the fourth quarter of 2024. This reflects a rebalancing of the market, with more mid-range transactions taking place after a heavier mix of high-end closings in early 2024.
• Average Sale Price Down Year-Over-Year, Up from Last Quarter - The average sale price declined 7% annually to $1.26M, yet posted an 18% increase quarter-over-quarter. The year-over-year drop suggests a pullback in higher-end activity, while the quarterly gain hints at renewed buyer appetite at the upper end of the market.
• Active List Prices Remain Relatively Stable - The average active list price held steady at $1.53M, up 1% year-over-year but down 11% from last quarter. The median active list price rose 4% to $1.27M, suggesting sellers are holding firm on pricing expectations— particularly in the mid-market.
• Pending Prices Reflect Buyer Conservatism - Both pending list prices declined yearover-year. The average pending price dipped 8% to $1.30M, while the median pending price fell 13% to $899K. These drops point to more price-sensitive offers and a shift in focus toward perceived value in current inventory.
1Q25 1Q24 %CHG (YR) 4Q24 %CHG (QTR)
PRICE $865K $979K -12% $856K 1%
$1.27M $1.23M 4% $1.12M 13%
Buyer activity across Destin shifted notably in the first quarter of 2025, with days on market trending upward in several price brackets. The $5M+ ultra-luxury segment saw the most dramatic change, rising from 27 days to 100 days—a 270% year-over-year increase, signaling a slower pace at the top end of the market. The $3M to $5M category followed suit, with average market time more than doubling to 200 days, up 115% from the year prior. In contrast, mid-range properties between $1M and $3M saw a marked improvement, with days on market falling 36% year-over-year to an average of 70 days, indicating stronger demand and faster absorption. Homes priced $500K to $1M rose to 110 days, a 20% increase. Meanwhile, properties under $500K saw time on market increase by over 96% from 47 days on market to 92. Altogether, these shifts reflect a more segmented market where timing is increasingly tied to price point—showing high demand in the mid-tier while the luxury segment cools slightly heading into spring.
The Destin market continued to show a strong preference for mid-tier and lower-mid price points in the first quarter of 2025. Homes priced between $500K and $1M made up the largest share of sales at 38%, up from 27% last year, underscoring ongoing buyer demand in this approachable price range. The $1M to $3M segment followed, comprising 32% of market share—a notable decline from 47% in the first quarter of 2024 but still a significant portion of overall activity. Properties under $500K held steady at 21%, reflecting stable entry-level participation, while the $3M to $5M segment remained unchanged at 7%. The $5M+ ultra-luxury bracket held a consistent but limited share at 3%, in line with the past two quarters.
• Active Listings Rise Moderately Year-Over-Year - 223 active listings were recorded in the first quarter of 2025, marking a 16% increase from last year and a slight 1% uptick from the previous quarter. The steady quarterly gain suggests inventory is holding stable while growing year-overyear in response to elevated pricing and buyer caution.
• New Listings Surge Heading into Spring - 169 new listings hit the market, up 10% year-over-year and a sharp 58% increase from the fourth quarter of 2024. This spike aligns with seasonal listing patterns and renewed seller confidence.
• High-End Inventory Expands Most Dramatically - The $3M–$5M segment grew 44% yearover-year, while the $5M+ category rose 57%, reflecting increased seller activity and elevated confidence in the luxury tier.
• Mid-Range Segments Continue to Lead - Inventory in the $1M–$3M range climbed 31%, maintaining its status as the largest share of active listings. This growth points to steady turnover and sustained buyer interest in the upper-mid market.
BAY FRONT SINGLE FAMILY RESIDENCE SALES
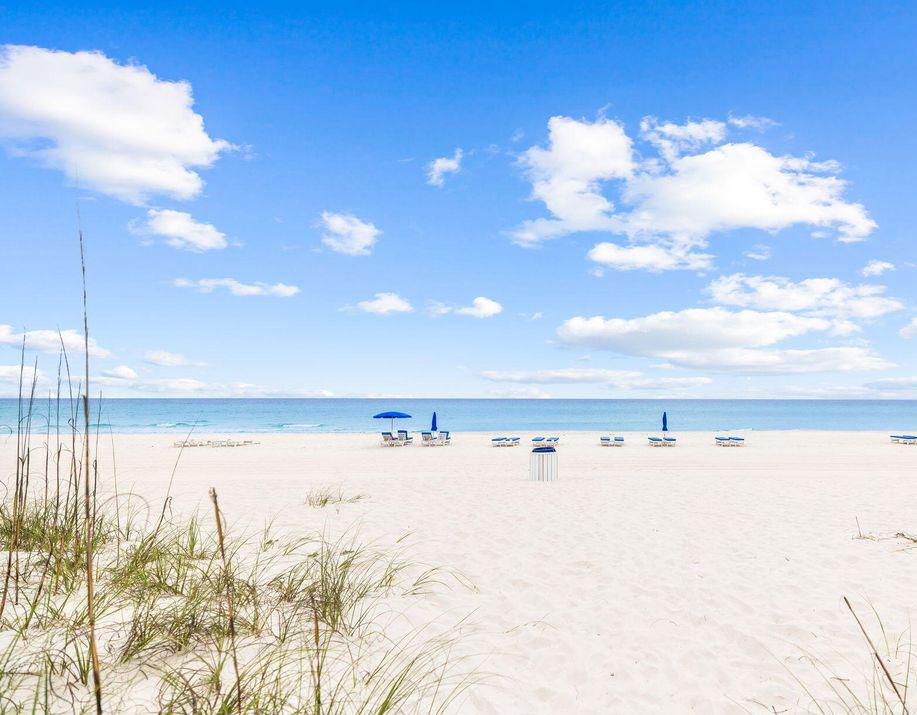
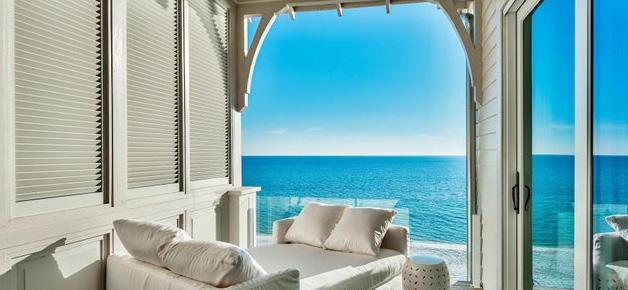
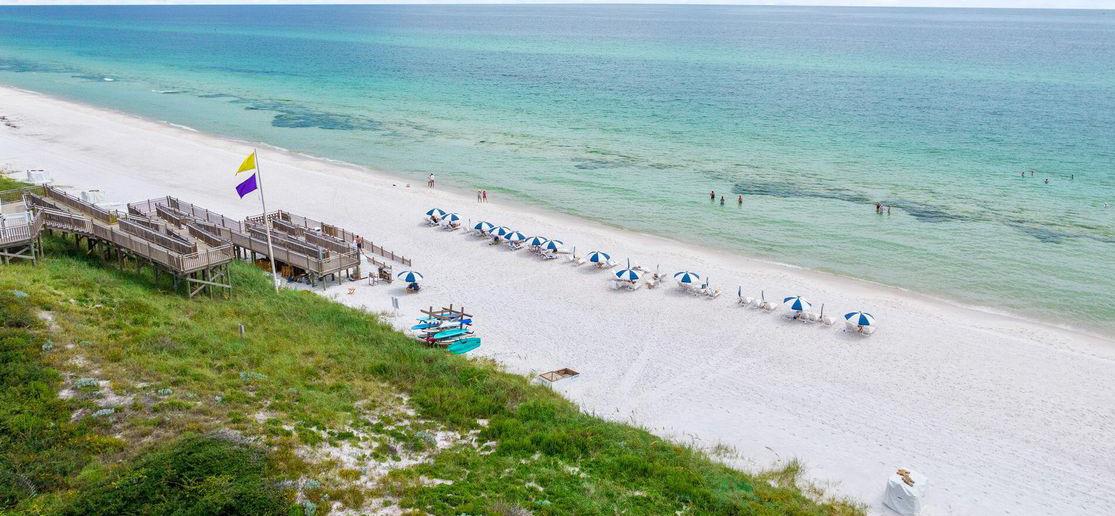
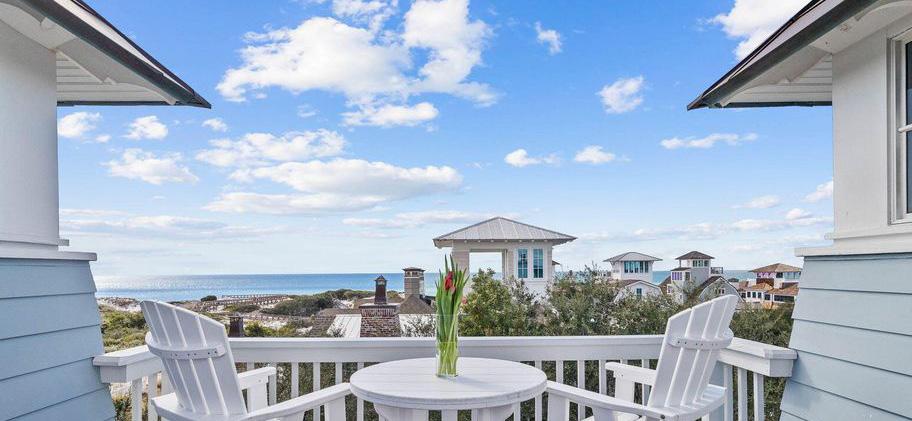
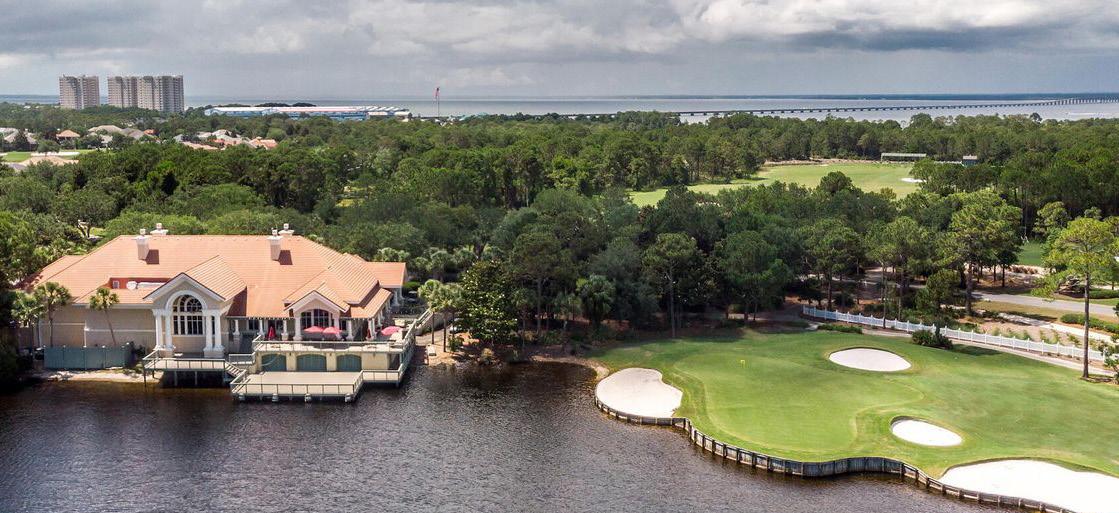
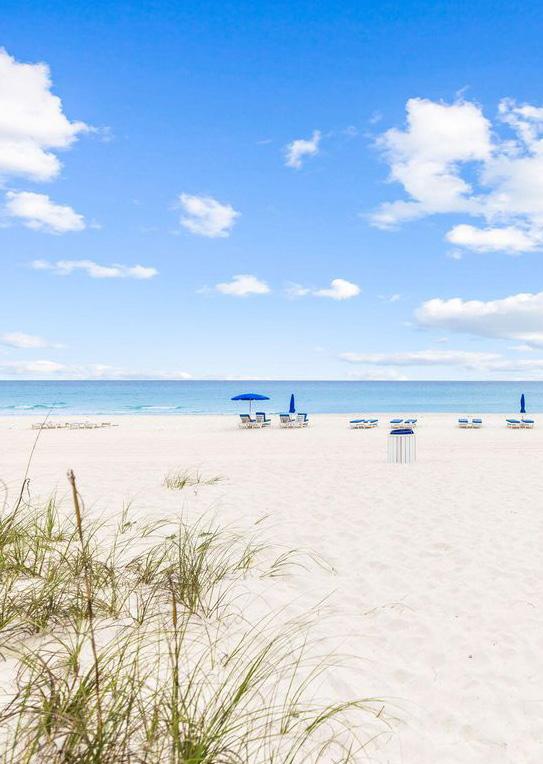
Where the sand meets the surf, you’ll find it all.
This coastal paradise is renowned for its 27 miles of pristine white-sand beaches, crystal-clear emerald waters, and stunning sunsets. Outdoor enthusiasts will appreciate the opportunities for water sports, fishing, and eco-tours through nearby state parks and conservation areas. The community is warm and welcoming, with a rich tapestry of events and activities year-round, including music festivals, art shows, farmers’ markets, and cultural celebrations.
Panama City Beach offers an array of attractions and renowned dining experiences. Pier Park is a premier shopping, dining, and entertainment complex, featuring over 120 stores, a variety of restaurants, an IMAX theater, and an amusement park. Nature lovers can explore St. Andrews State Park, known for its excellent snorkeling and scuba diving spots, and Shell Island, a secluded retreat accessible only by boat. Dining highlights include Firefly, an award-winning fine dining restaurant, Pineapple Willy’s, famous for its beachfront dining and seafood, and Runaway Island, popular for its fresh seafood with a Caribbean twist. Additionally, new attractions such as Top Golf & Dolly Parton’s Pirate Venue are set to further increase visitor traffic upon their completions in 2025. Investing in Panama City Beach real estate promises robust financial returns, driven by the area’s popularity as a vacation destination and steadily growing property values.
• Closed Sales Decline Sharply from Last Year - PCB recorded 162 closed sales in the first quarter of 2025, down 24% year-over-year and 19% lower than the fourth quarter of 2024. The slowdown suggests buyer activity has cooled following a stronger performance earlier in the cycle.
• Contracts Signed Show Signs of Rebound - 205 contracts were signed, down 18% year-overyear, but up 35% from the previous quarter, pointing to renewed momentum heading into spring despite continued buyer hesitancy.
• Sales Volume Falls as High-Dollar Transactions Pull Back - Total sales volume came in at $96.45M, a 30% drop year-over-year and a 23% decline from last quarter. This signals a shift in demand toward lower price points and fewer high-end closings.
• Days on Market Continue to Rise - Properties spent an average of 109 days on market, up 27% year-over-year and 16% from the prior quarter. The increase reflects longer decision cycles as buyers assess value and respond to changing economic conditions.
• Median Sale Price Rises Modestly Year-Over-Year - The median sale price increased 3% year-over-year to $525K, with a 5% quarter-over-quarter gain, suggesting price stability and continued demand in the mid-range.
• Average Sale Price Declines from Prior Year - The average sale price dropped 7% annually to $598K, but was only down 6% from the fourth quarter of 2024, indicating fewer high-value sales while pricing at more moderate levels remains firm.
• Active List Prices Trend Higher - The average active list price rose 5% year-over-year to $880K and surged 29% quarter-over-quarter, possibly due to an increase in luxury listings or aspirational pricing. The median active list price increased 4% year-over-year to $592K, continuing a steady upward trend.
• Pending List Prices Reflect Buyer Caution - The average pending price declined 4% year-over-year to $626K and fell 6% from the fourth quarter of 2024. Meanwhile, the median pending list price held mostly flat at $525K, up just 0.4% annually, showing that buyers remain price-sensitive and focused on value.
$750K TO $1.5M
$1.5M TO $3M
$3M+
Buyer activity in Panama City Beach slowed noticeably across most price points in the first quarter of 2025, with average days on market rising in nearly every segment. Properties priced between $1.5M and $3M saw the largest increase, with time on market rising 75% year-over-year to 199 days, while listings in the $750K to $1.5M range followed closely, up 71% to 130 days. The $300K to $750K bracket rose 24% to 104 days, signaling extended decision-making among mid-tier buyers. Even the luxury segment experienced a shift, with $3M+ properties averaging 432 days on market, a 42% increase from last year. The only price range to see faster movement was the under $300K category, where average days on market fell 50% to just 37 days, likely due to limited inventory and continued demand at lower price points. Overall, the data reflects a more deliberate buyer pool and slower absorption across much of the market.
In the first quarter of 2025, the Panama City Beach market remained heavily concentrated in the $300K–$750K price range, which accounted for 77% of all sales, up from 72% in the first quarter of 2022. This growth highlights the segment’s ongoing dominance as buyers prioritize affordability amid rising rates and construction costs. The $750K–$1.5M range has remained consistent, holding 17% market share, while the $1.5M–$3M segment made up 3%, and $3M+ properties held a steady 1%, indicating stable but limited luxury activity. Meanwhile, homes priced under $300K now make up just 3% of all sales, down from 9% in 2022—underscoring how price appreciation and inventory constraints have reshaped entry-level opportunities.
• Active Listings Edge Up Modestly Year-Over-Year - 520 active listings were recorded in the first quarter of 2025, up 2% year-over-year, but down 4% from last quarter. The modest annual growth reflects a stable market, while the quarterly decline aligns with typical seasonal shifts.
• New Listings Rebound After Year-End Slowdown - 423 new listings hit the market in the first quarter of 2025, down 6% year-over-year but up 65% from the fourth quarter of 2024, signaling a strong return of seller activity ahead of spring.
• Mid-Range Inventory Expands in Key Segments - The $750K–$1.5M range saw the sharpest growth, up 23% year-over-year, followed by the $1.5M–$3M and $3M+ brackets, which rose 34% and 24%, respectively. This signals increased seller confidence in the higher-end of the market.
• Lower Price Points Remain Limited - Listings under $300K held steady with no year-over-year change, while the $300K–$750K segment was essentially flat at 337 listings, down just 1%. Inventory in these entry-level brackets continues to be constrained by rising home values and limited turnover.
SINGLE FAMILY RESIDENCE SALES
GULF FRONT SINGLE FAMILY RESIDENCE SALES SINGLE FAMILY RESIDENCE SALES
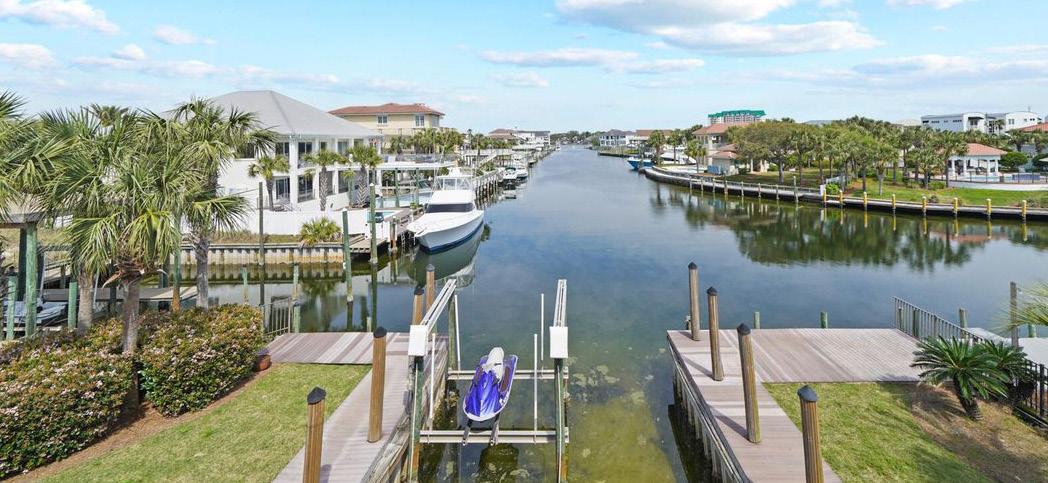
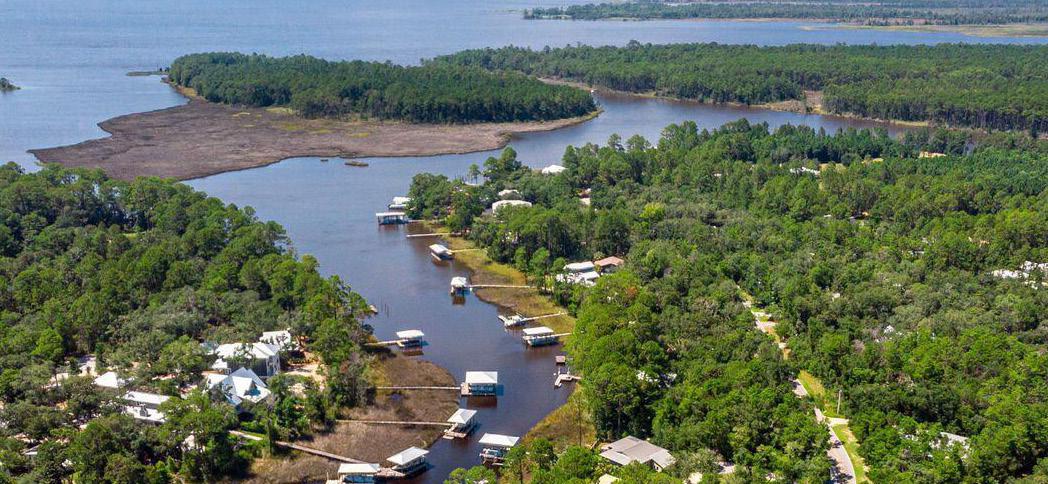
Coastal charm, endless opportunity.
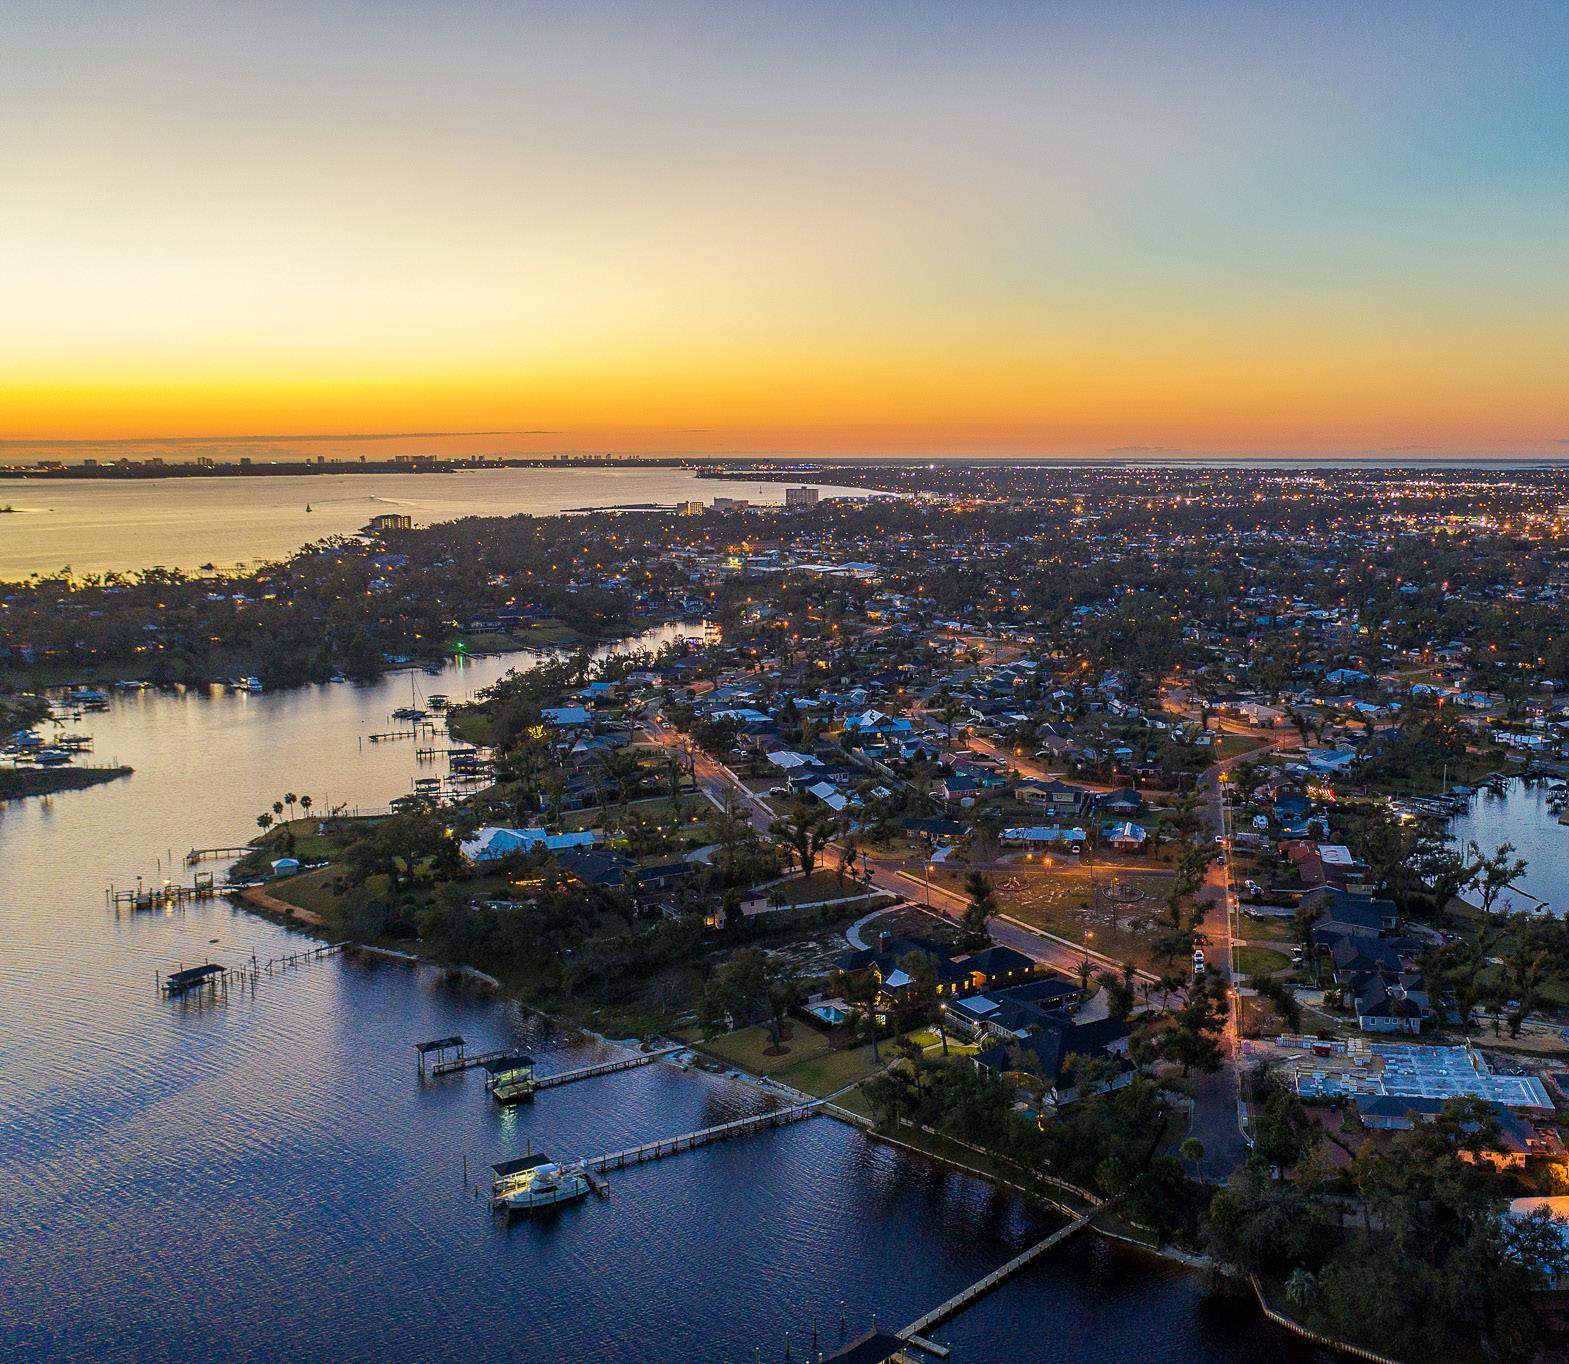
Known for its picturesque waterfront views and thriving marina culture, Panama City offers an inviting atmosphere for both residents and visitors. The city is a gateway to stunning natural landscapes, including the pristine beaches of the Gulf of Mexico and the serene beauty of St. Andrews Bay. Outdoor enthusiasts can indulge in boating, fishing, and various water sports, while enjoying the warm, sunny climate year-round.
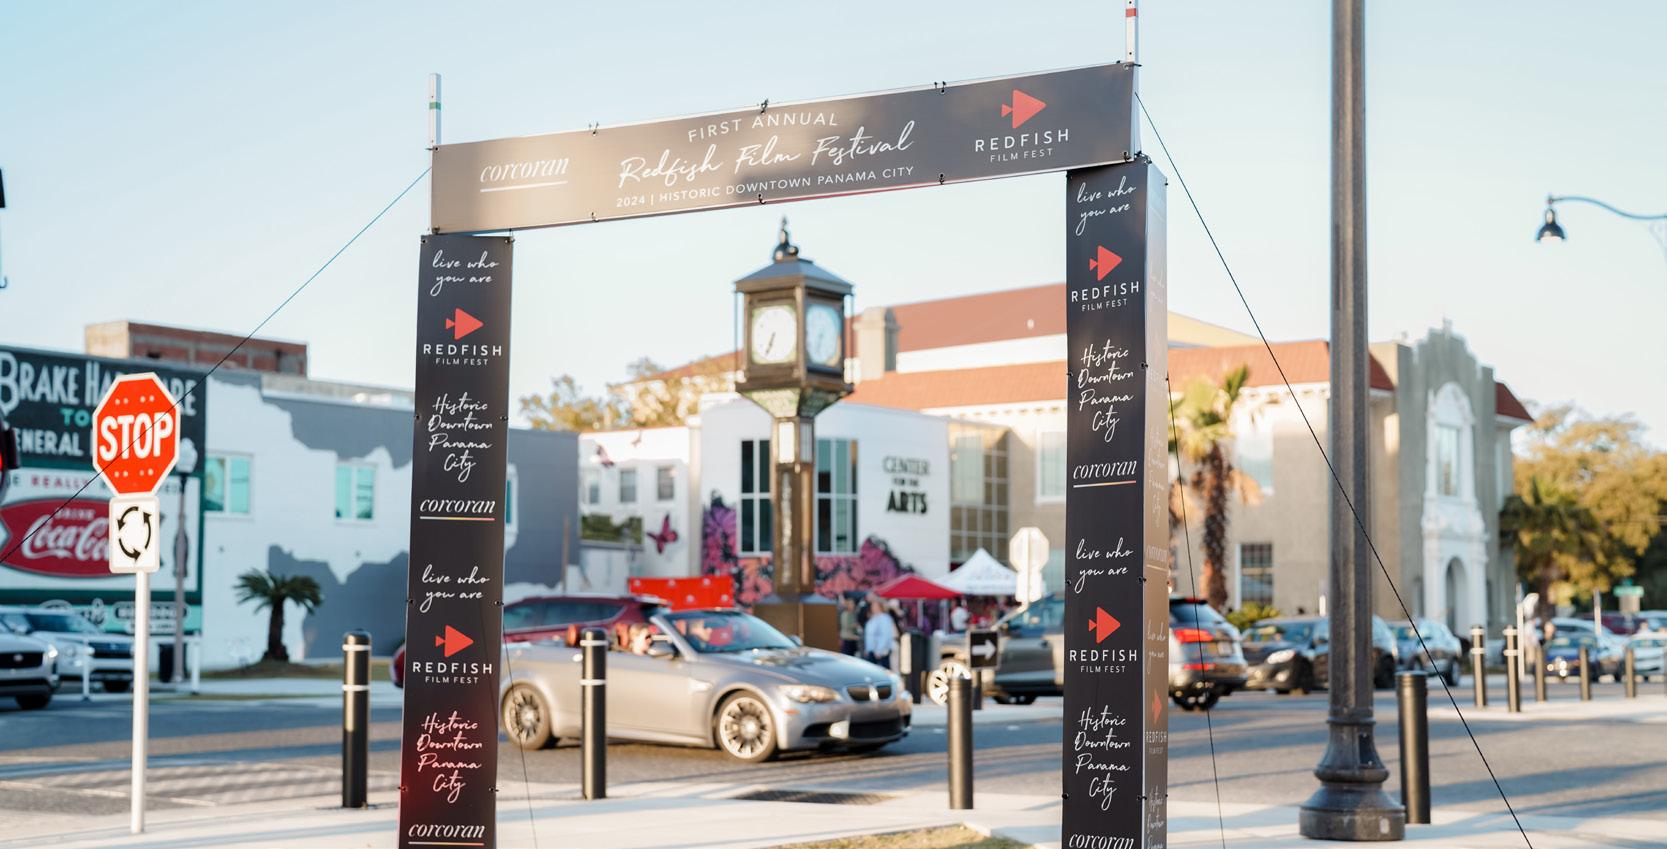
Historic Downtown Panama City is a hub of activity, featuring charming boutiques, art galleries, and a variety of dining options. Key attractions include the Panama City Marina, which hosts numerous boating events and the Marina Civic Center, a venue for concerts and performances. Notable dining experiences include The Grand Marlin, renowned for its fresh seafood and waterfront dining, and Hunt’s Oyster Bar, a local favorite for casual, yet delectable, seafood dishes. With its appealing lifestyle, beautiful surroundings, and steady growth in property values, investing in Panama City real estate promises attractive financial returns and a high quality of life.
• Closed Sales Down from Last Quarter, Up Slightly Year-Over-Year - 347 closings were recorded in the first quarter of 2025, up -6% year-over-year but down 8% from the last quarter of 2024, reflecting a return to seasonal norms following a stronger-than-usual end to 2024.
• Contracts Signed Edge Up Over Last Year - 436 contracts were signed in the first quarter of 2025, a 5% year-over-year increase, though down 13% from the fourth quarter of 2024. The quarterly dip reflects typical seasonality, while the annual growth suggests sustained interest despite broader market headwinds.
• Sales Volume Holds Steady Annually - Total sales volume reached $123M, nearly flat from the first quarter of 2024, but down 7% from the fourth quarter of. The quarter-over-quarter decline is consistent with a lower number of high-value transactions, as buyers shift toward mid-market opportunities.
• Days on Market Rise Slightly - The average time on market increased by 5% year-over-year to 69 days, up from 66 in the first quarter of 2024 and 10% higher than the fourth quarter of 2024. The shift suggests a more cautious buyer pool and slightly longer sales timelines.
• Median Sale Price Sees Modest Growth - The median sale price rose 6% year-over-year to $311K, though it dipped 3% from the fourth quarter of 2024, reflecting mild seasonal softening following a stronger close to 2024.
• Average Sale Price Ticks Higher - The average sale price increased 7% annually to $357K, with a 2% quarterly gain, suggesting stable demand and more consistent price performance across property types.
• Active List Prices Continue Climbing - The average active list price jumped 20% year-overyear to $432K, with a 9% increase over the previous quarter. The median active list price rose 10% annually to $350K, further signaling seller confidence and higher asking prices heading into spring.
• Pending List Prices Show Measured Growth - The average pending list price rose 5% from last year to $364K, while the median pending list price increased 5% to $324K, reinforcing steady buyer engagement in mid-range properties.
1Q25 1Q24 %CHG (YR) 4Q24 %CHG (QTR)
PRICE $311K $293K 6% $320K -3%
LIST $350K $318K 10% $330K 6%
$500K-750K $750K-1M
$250K TO $500K
$500K TO $750K
$750K-1M
$1M+
Panama City’s first quarter of 2025 market revealed mixed shifts in buyer pacing across price brackets. Properties priced $750K to $1M experienced the greatest improvement, with average days on market falling 57% year-over-year to just 53 days, signaling strong demand and quick absorption in this upper-mid tier. The $250K to $500K range also saw a modest improvement, with DOM decreasing 8% to 67 days, pointing to stable activity. In contrast, the under $250K segment saw DOM rise 30% to 74 days, reflecting a slower pace in the more affordable end of the market. The $500K to $750K range increased 23% to 75 days, suggesting buyers are taking more time to evaluate options in the mid-tier. Meanwhile, homes priced above $1M held relatively steady at 125 days, up just 5% from last year, highlighting sustained luxury interest and market resilience.
Market data from Panama City’s first quarter of 2025 reflects a continued shift toward higher price points, driven by rising home values and limited inventory in lower brackets. Homes priced $250K to $500K remained the dominant segment, holding 69% of total sales, underscoring sustained buyer activity in the mid-tier. The under $250K category continued its long-term decline, accounting for just 19% of market share—down from 29% in 2022—as affordability challenges and supply constraints reshape the entry-level landscape. The $500K to $750K range gained modest traction, rising to 9%, while the $750K to $1M tier held steady at 3%, reflecting stable interest in higher-end properties. Overall, the data points to a gradual upward movement in price distribution, with mid- and upper-tier homes drawing increased buyer attention.
• Active Listings Increase Significantly Year-Over-Year - Inventory grew to 610 active listings, up 36% from the first quarter of 2024 and 2% from the fourth quarter of 2024, indicating steady accumulation as more properties remain on the market heading into spring.
• Mid-Tier Segments Drive Inventory Growth - The $500K–$750K range saw the sharpest growth, up 163% year-over-year, followed by the $250K–$500K segment, which climbed 19%. These gains reflect rising prices and increased listing activity in mid-market brackets.
• Lower-Priced Homes Show Modest Growth - Listings under $250K increased 31% to 92 homes, suggesting modest but stable seller participation in the most affordable tier, despite overall constraints on lower-priced inventory.
• Luxury Inventory Surges at the Top End - Listings in the $1M+ category grew 160% year-overyear to 26 properties, while the $750K–$1M range rose 27%. These increases suggest growing seller confidence and expanded inventory at the upper end of the market.
• New Listings Rebound Strongly from Last Quarter - 628 new listings entered the market in the first quarter of 2025, a 23% increase year-over-year and 26% gain over the previous quarter, pointing to renewed seller momentum heading into the spring season.


SINGLE FAMILY RESIDENCE SALES
SINGLE FAMILY RESIDENCE SALES
What visitors are looking for
They
What visitors are looking for Results from Visitor Satisfaction Surveys:
Visiting Walton County allows access to all of these desires, making it a
and rental income generation.
Results from Visitor Satisfaction Surveys: 2024 VISITORS
3.39M
They want good food, and unique dining experiences. They want beautiful beaches and clear water. They want nightlife that includes ice cream with their young ones. They want water activities and adrenaline rush adventures. They want an energetic atmosphere with lots of unique shopping, festivals, and evening entertainment in a romantic setting.
Visiting Panama City Beach allows access to all of these top desires, making it a hot spot for tourism, and rental income generation.
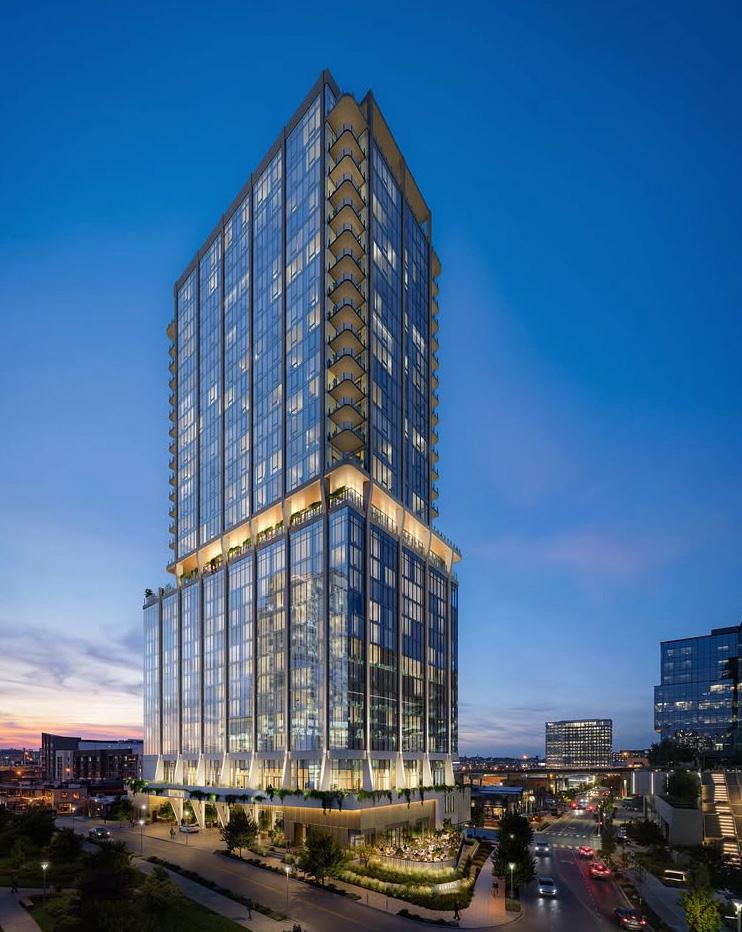

NEWLY RELEASED
Introducing EDITION Residences Nashville - Offering Nashville’s Most Elevated Lifestyle - Sales Launching Spring 2025.
The Residences at The Nashville EDITION comprise a curated collection of unique homes and restorative amenities, providing world-class resort living in The Gulch, a vibrant destination neighborhood within easy reach of the best of Nashville. Corcoran Sunshine is proud to be the exclusive marketing partner, with Corcoran Reverie of The Corcoran Group leading sales.

800+ #85 $1.063M $799M #40 TOP 425
CLIENTS SERVED STATE SIDES RANK AVERAGE TRANSACTION PRICE 2023 SALES VOLUME STATE VOLUME
Corcoran Reverie Enhances Nashville’s Luxury Landscape With Celebratory Events Honoring Women Leaders in Real Estate
In early March 2025, industry leaders gathered for two landmark events: the Foundations of Influence PanelWomen Driving Real Estate Forward and Inman on Tour Nashville,focused on empowerment and innovation in luxury real estate while showcasing the importance of women in leadership roles. NEWS WIRE