The Reverie Review
Q4 2024 | Market Report


Q4 2024 | Market Report
DISCLAIMER: SOURCE: TRENDGRAPHIX BASED ON DATA SUPPLIED BY THE EMERALD COAST ASSOCIATION OF REALTORS MULTIPLE LISTING SERVICE AND CENTRAL PANHANDLE ASSOCIATION OF REALTORS MULTIPLE LISTING SERVICE. THE INFORMATION, DATA, AND FIGURES CONTAINED HEREIN ARE PROVIDED FOR GENERAL INFORMATIONAL PURPOSES ONLY. WHILE EVERY EFFORT HAS BEEN MADE TO ENSURE THE ACCURACY, COMPLETENESS, AND RELIABILITY OF THE INFORMATION, CORCORAN REVERIE MAKES NO REPRESENTATIONS OR WARRANTIES, EXPRESS OR IMPLIED, REGARDING THE ACCURACY, ADEQUACY, VALIDITY, RELIABILITY, AVAILABILITY, OR COMPLETENESS OF ANY INFORMATION PROVIDED.

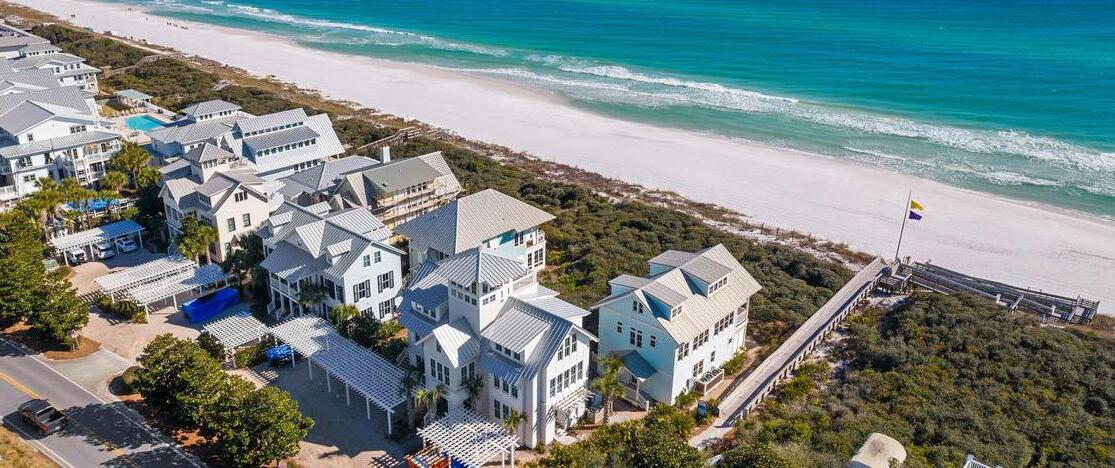
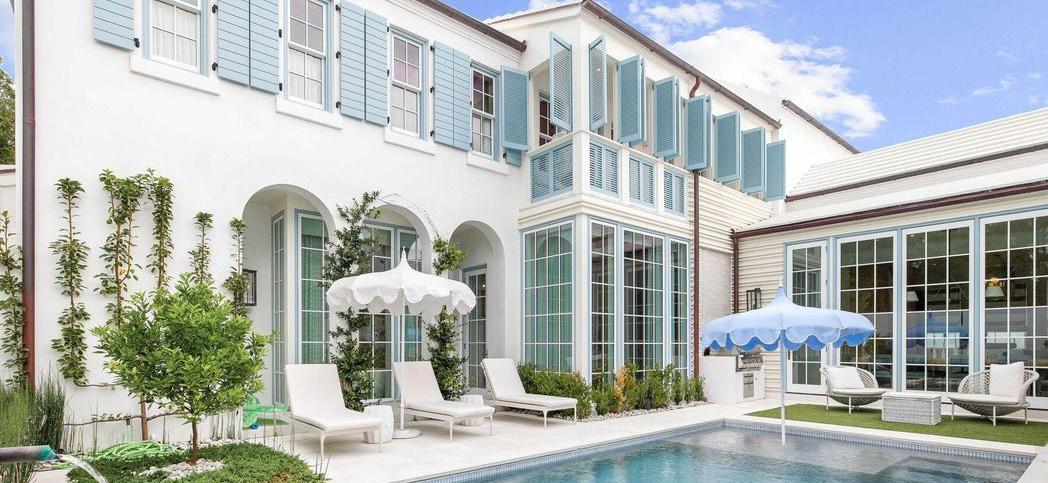
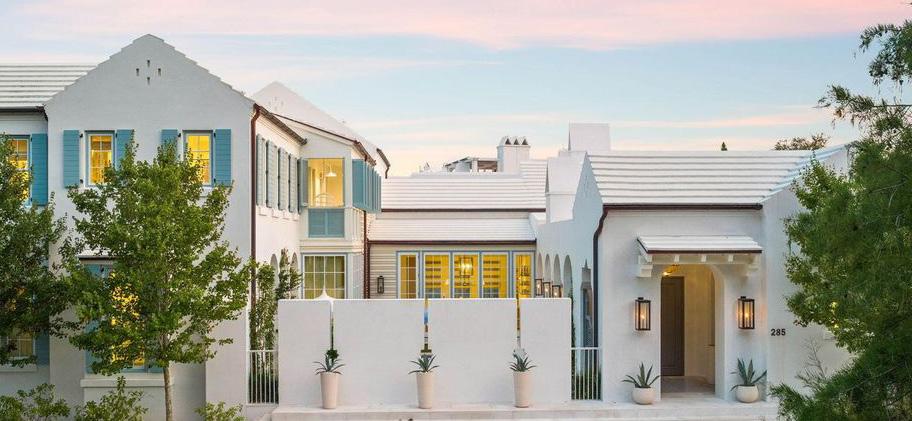
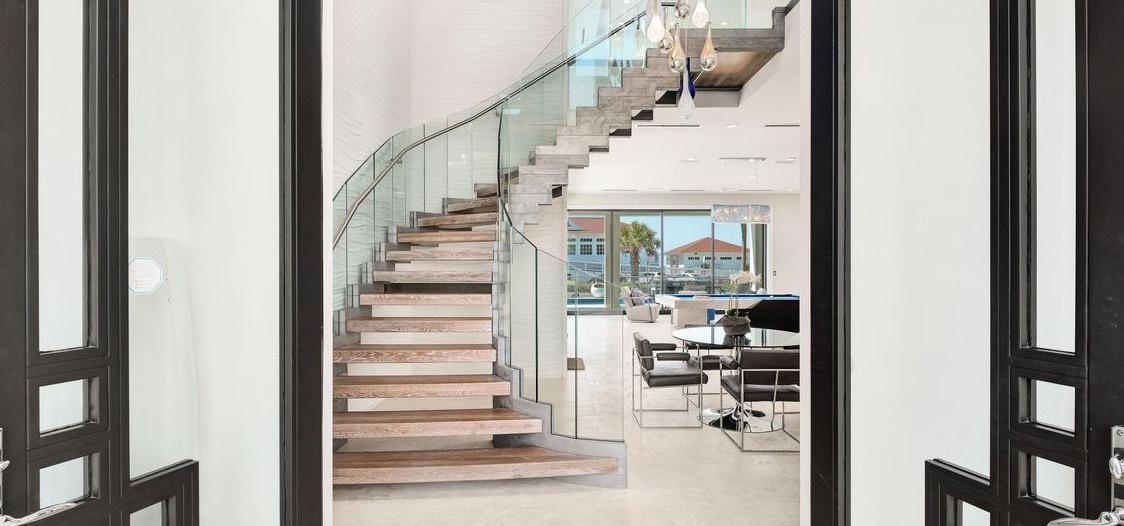
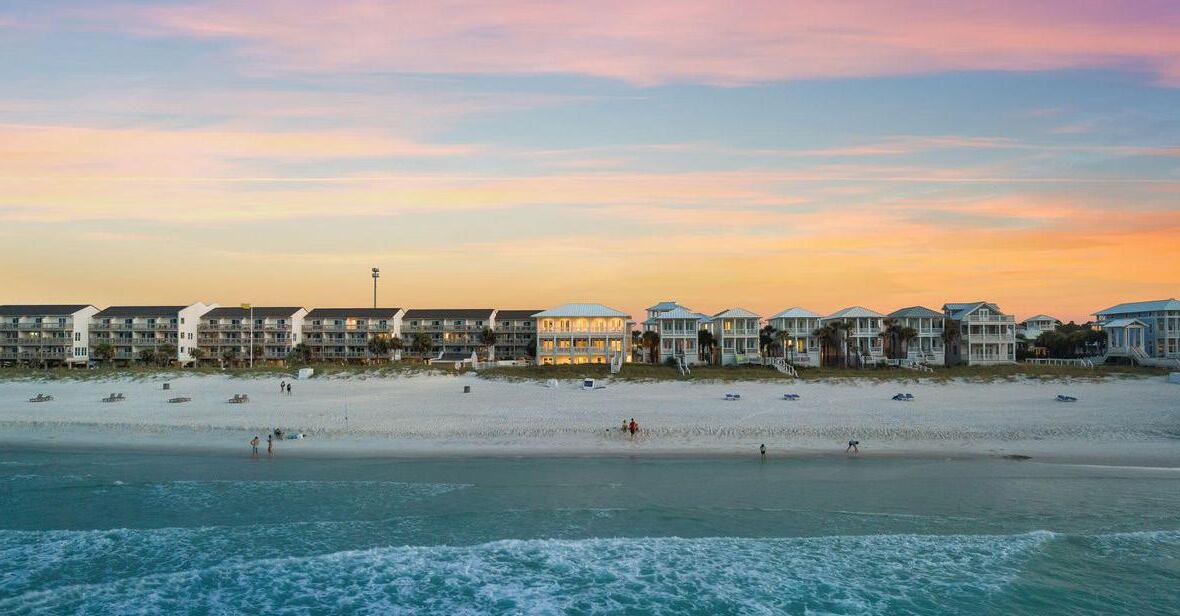
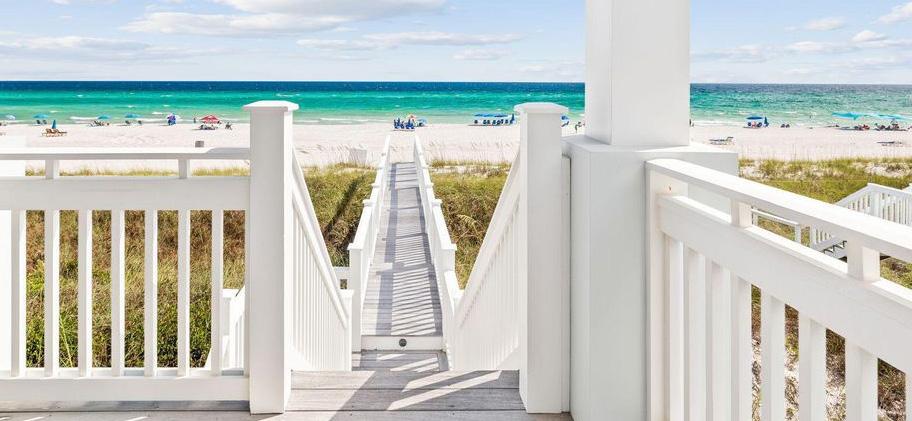
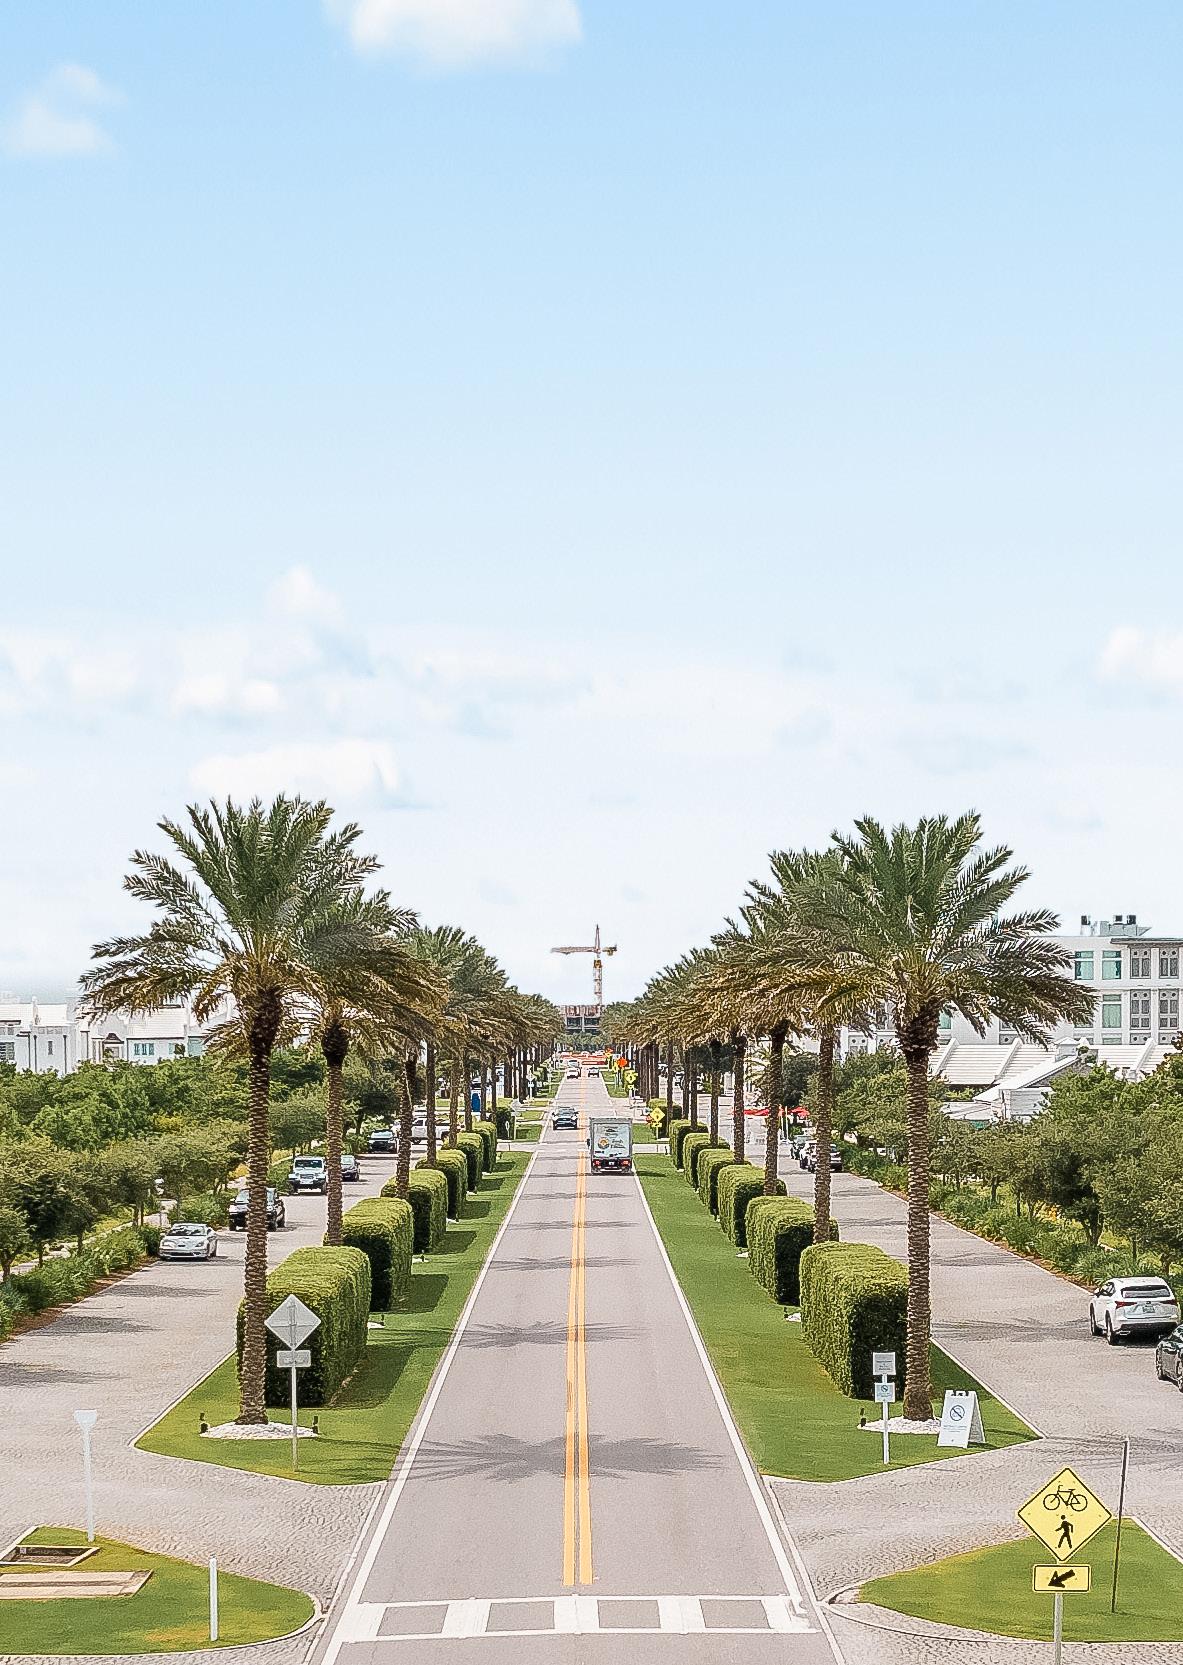
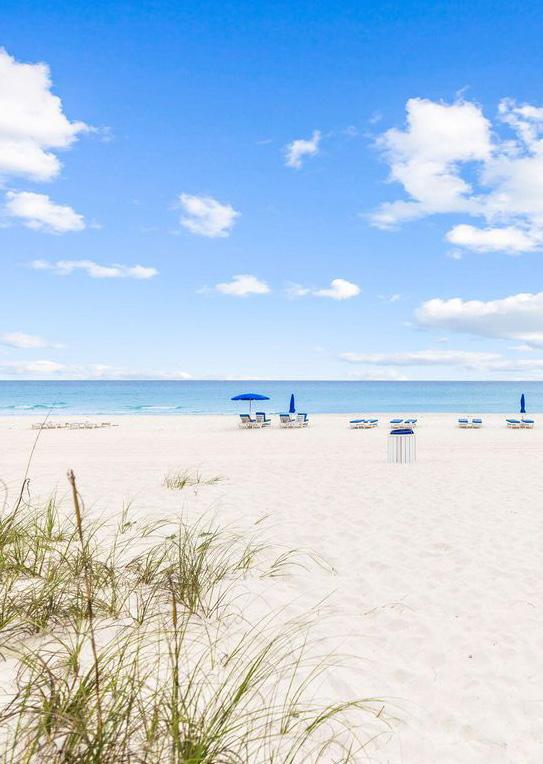
A place unlike anywhere else.
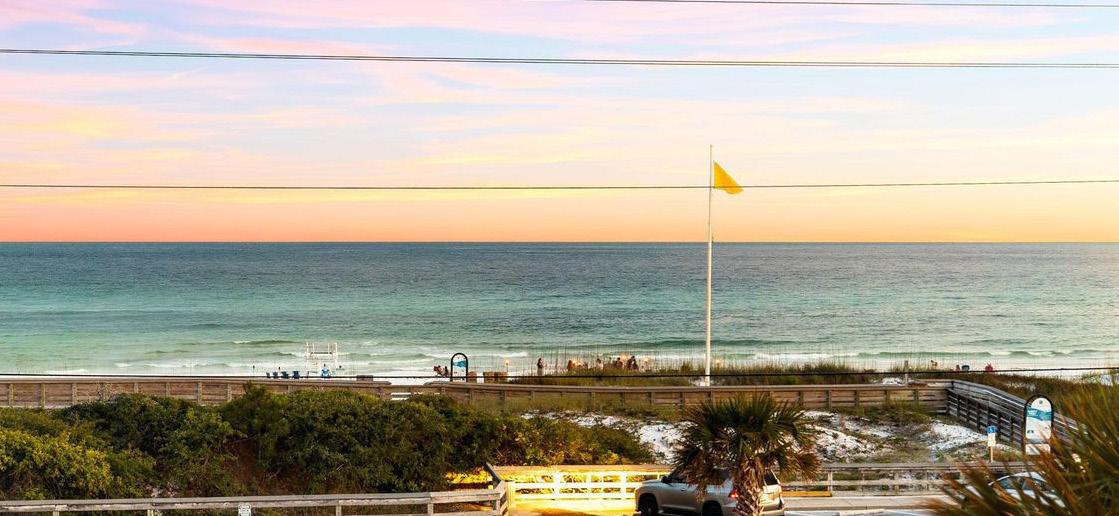
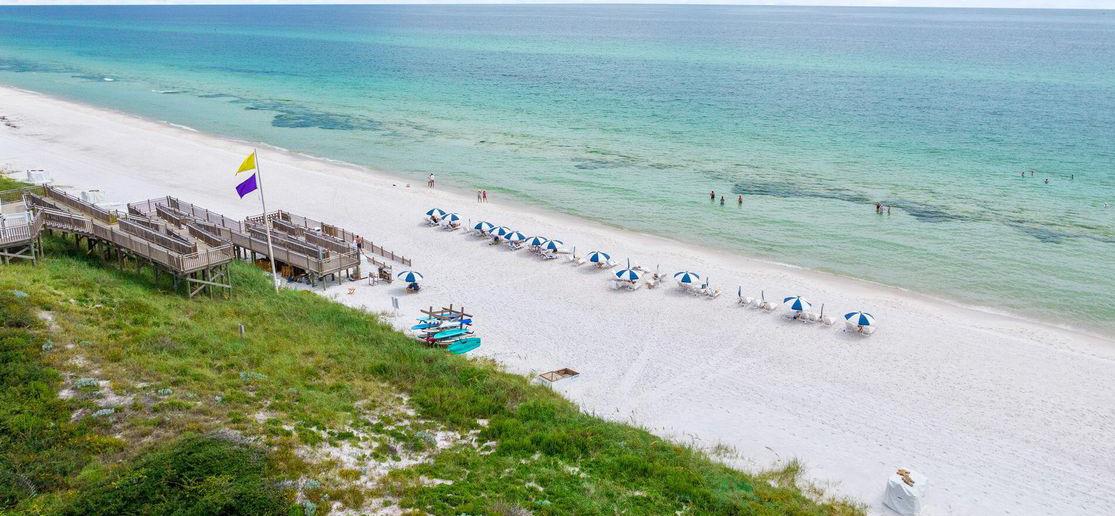
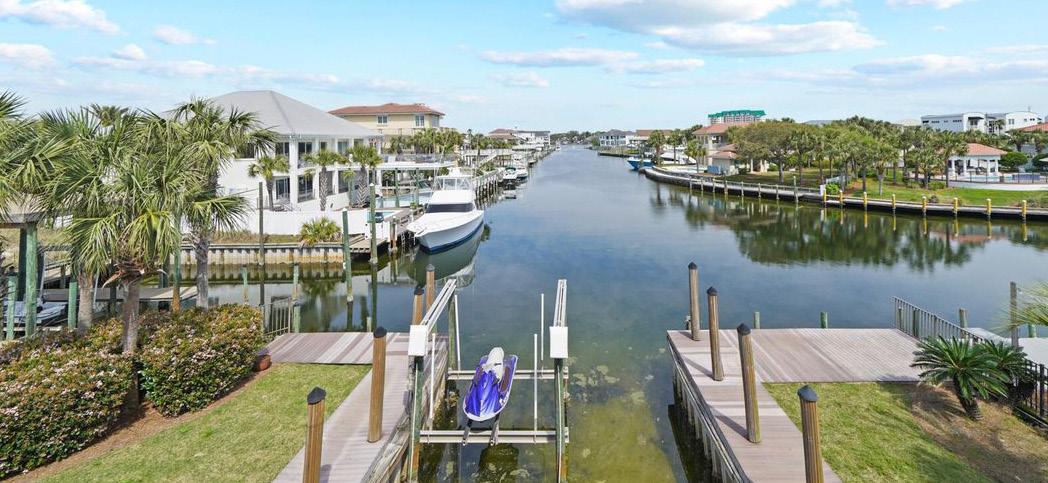
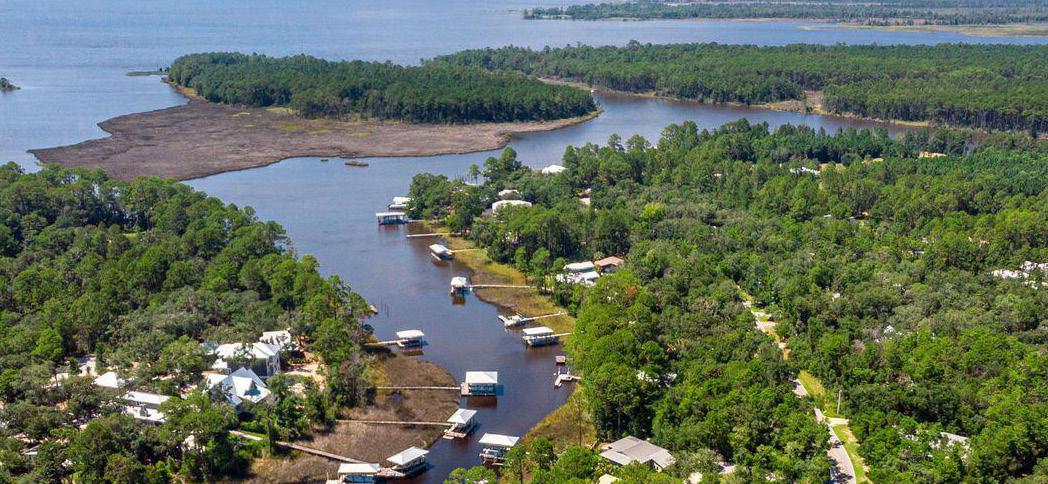
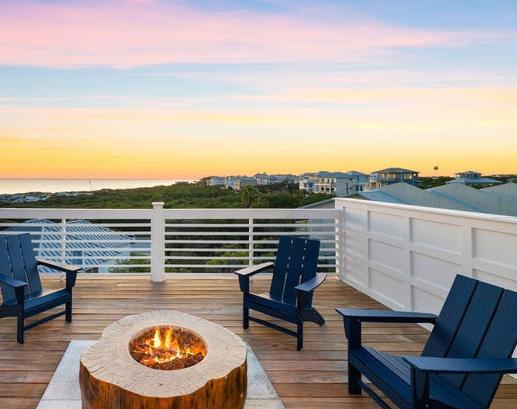
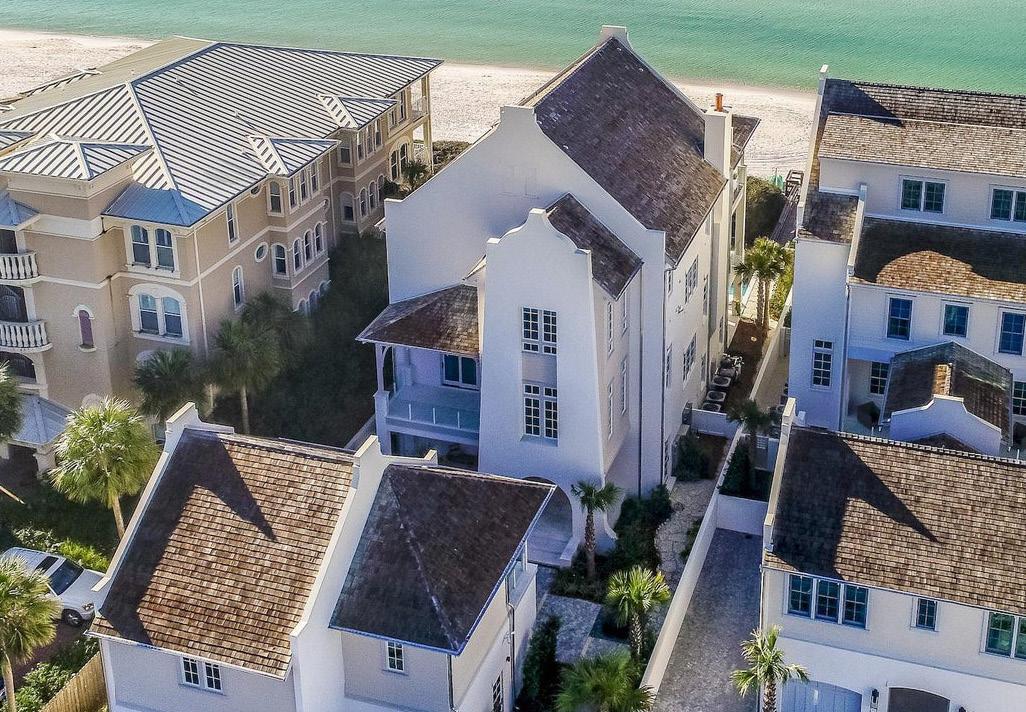
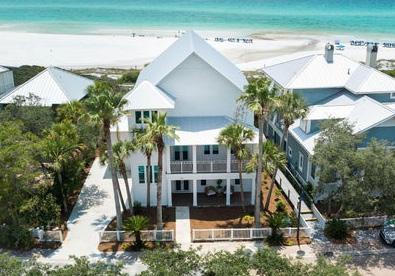
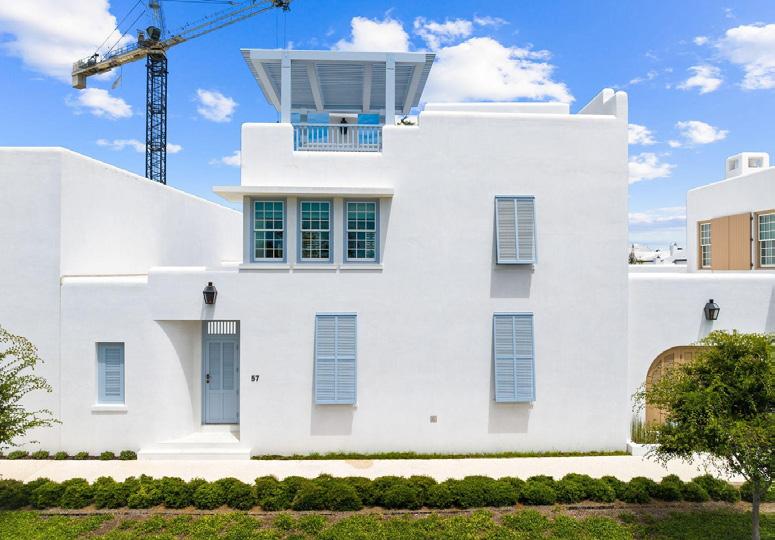
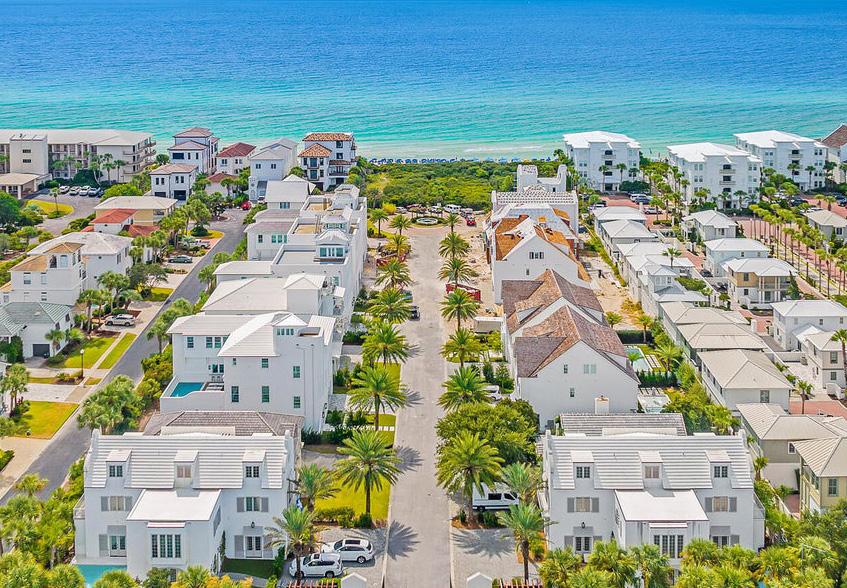
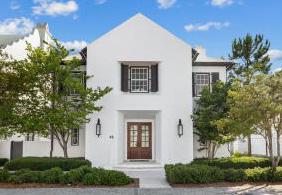
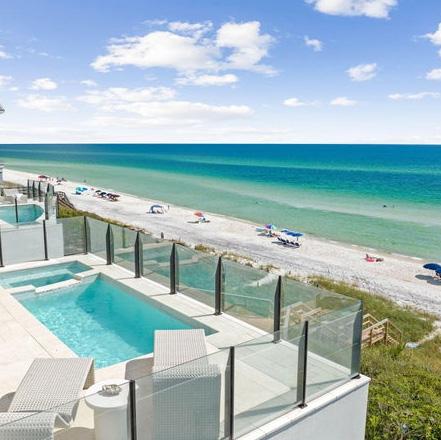
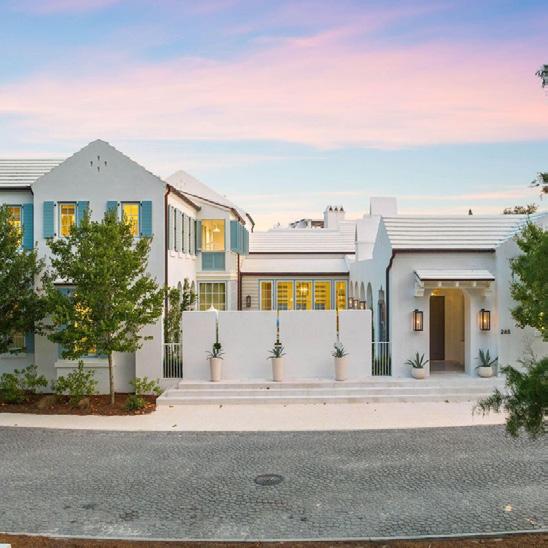
Scenic Highway 30A continues to captivate investors with its unparalleled beauty and exclusive charm. This 28.5-mile stretch along Florida’s Emerald Coast is renowned for its pristine white-sand beaches, crystal-clear turquoise waters, and rare coastal dune lakes. Envision waking up to the serene sounds of the Gulf, spending your days paddleboarding, kayaking, or biking through picturesque trails, and enjoying the quaint, upscale ambiance of communities like Rosemary Beach, Seaside, and Alys Beach. The area offers a unique blend of luxury living and small-town charm, making it a highly desirable destination for those seeking the finest in coastal living. The robust rental market, characterized by high occupancy rates and premium rental prices, continues to provide attractive income opportunities for investors.
Northwest Florida’s economic stability, bolstered by a thriving tourism sector and a favorable tax environment with no state income tax, enhances 30A’s appeal. The area’s continuous development, including new luxury projects and infrastructure improvements, promises to further elevate property values and investment potential. Scenic Highway 30A offers an exceptional blend of natural beauty, vibrant community life, and strong financial returns, solidifying its status as a premier location for both luxury living and investment.
• Closed Sales Growth Despite Longer Days on Market - Scenic Highway 30A recorded a 5% year-over-year increase in closed sales, with 229 transactions in the fourth quarter of 2024, and a 7% rise compared to third quarter 2024. However, the average days on market surged by 58% year-over-year to 128 days, highlighting a more deliberate buying process as buyers navigate economic uncertainty and inflationary pressures.
• Contracts Signed Show Consistent Demand with Seasonal Adjustments - Contracts signed jumped 24% year-over-year to 219, reflecting robust buyer interest compared to the fourth quarter 2023. The 5% dip from Q3 2024 underscores seasonal cooling and cautious optimism among buyers balancing luxury investments with broader economic factors like borrowing costs and post-election market clarity.
• Sales Volume Surges Amid High-Value Transactions - Sales volume climbed 23% year-over-year to $561M and increased 11% quarter-over-quarter, driven by an influx of high-value transactions. This substantial growth indicates sustained demand for luxury properties.
• Resilience in the Scenic Highway 30A Luxury Market - Sellers remain confident, as reflected in stable pricing despite the 35% quarter-over-quarter rise in days on market. This resilience reinforces Scenic Highway 30A’s position as a highly desirable market, buoyed by affluent buyers leveraging long-term value opportunities amid shifting economic conditions.
• Rising Average Sale Prices Reflect Continued Demand - The average sale price on Scenic Highway 30A increased by 20% year-over-year to $2.49M and 6% quarter-over-quarter. This growth reflects steady demand for luxury properties, even as high 10-year Treasury yields continue to keep mortgage rates elevated despite Federal Reserve rate cuts. Affluent buyers appear to be less reliant on financing, prioritizing premium locations and lifestyle investments.
• Median Sale Prices Show Yearly Decline but Quarterly Stability - The median sale price decreased by 9% year-over-year to $1.48M but remained relatively stable quarter-overquarter, dipping just 1%. This trend may indicate a broader market recalibration as buyers prioritize value while seeking high-end properties in this competitive market.
• Active Listings Highlight Seller Confidence in Pricing - The average active list price saw a slight 1% year-over-year decrease to $2.7M but declined 10% quarter-over-quarter. Meanwhile, the median active list price grew by 6% year-over-year, underscoring sellers’ continued belief in the premium nature of the Scenic Highway 30A market despite shifting economic dynamics.
• Pending List Prices Showcase Strength in Demand - The average pending list price increased by 15% year-over-year to $2.5M, indicating robust buyer interest and a willingness to engage at higher price points. The slight 4% decline from Q3 reflects seasonality and a more selective buyer pool as the market adjusts to evolving financial conditions.
• Scenic Highway 30A Market Holds Value Amid Macroeconomic Shifts - Despite broader economic uncertainty and recalibration in some areas, Scenic Highway 30A’s pricing data reinforces its reputation as a highly desirable luxury market. Sellers who price strategically and emphasize their properties’ unique lifestyle appeal continue to attract motivated buyers.
UNDER $500K
$500K TO $1M
$1M TO $3M
$3M TO $5M
$5M+
UNDER $500K
$500K TO $1M
$1M TO $3M
$3M TO $5M
$5M+
$10M+
Properties in the mid-range ($1M to $3M) experienced a dramatic increase in average days on market, climbing by 97% year-over-year to 144 days, signaling a slowdown in buyer activity for this segment. Similarly, lower mid-range properties ($500K to $1M) saw a notable rise, with days on market increasing by 42% year-over-year to 115 days. In contrast, ultra-luxury properties ($10M+) saw a 12% year-over-year decrease in days on market, now averaging just 30 days, highlighting robust demand at the highest price points. The $3M to $5M range displayed stability, with only a slight 4% increase in days on market, pointing to consistent buyer interest in this luxury bracket. Meanwhile, properties under $500K experienced the most significant surge, with days on market increasing by 128% year-over-year to 137 days.
The market share for properties priced between $1M and $3M continues to dominate Scenic Highway 30A, now comprising 53% of all sales in Q4 2024, down slightly from 54% in Q4 2023. This segment underscores consistent buyer preference for mid-range luxury homes in this highly sought-after area. Meanwhile, the share of properties under $500K increased modestly to 2% from just 1% in the prior year, suggesting some renewed activity in the entrylevel segment, albeit limited by overall inventory constraints. Properties in the $5M+ range saw notable growth, now representing 11% of the market share, up from 7% in Q4 2023, highlighting sustained interest in ultra-luxury homes. This continued shift toward higher price brackets emphasizes the upscale nature of Scenic Highway 30A.
• Active Listings Increase, Driven by High-End Segments - Active listings on Scenic Highway 30A rose by 16% year-over-year to 833 in Q4 2024, though they declined by 9% quarter-over-quarter. This growth is largely concentrated in the $1M to $3M and $3M to $5M segments, which saw year-overyear increases of 15% and 25%, respectively. The ultra-luxury $10M+ category also experienced notable growth, with a 40% year-over-year rise in listings, reflecting increased seller confidence in these premium price ranges.
• New Listings Remain Stable Across the Market - New listings edged up by 2% year-over-year to 407, signaling consistency in seller activity despite shifting market dynamics. This stability is particularly evident in the luxury segments, with the $1M to $3M range maintaining its dominant market share and accounting for over half of all active listings.
• Decline in Inventory for Lower Price Ranges - The number of active listings under $500K and in the $500K to $1M range remains limited, with only 4 and 129 listings, respectively. While these segments showed modest growth year-over-year (+33% and +29%), they still represent a smaller portion of the overall inventory as rising property values push more transactions into higher price brackets.
$500K TO $1M
$1M TO $3M
$3M TO $5M
$5M+
$10M+
$500K
$500K TO $1M
$1M TO $3M
$3M TO $5M
$5M+ $10M+


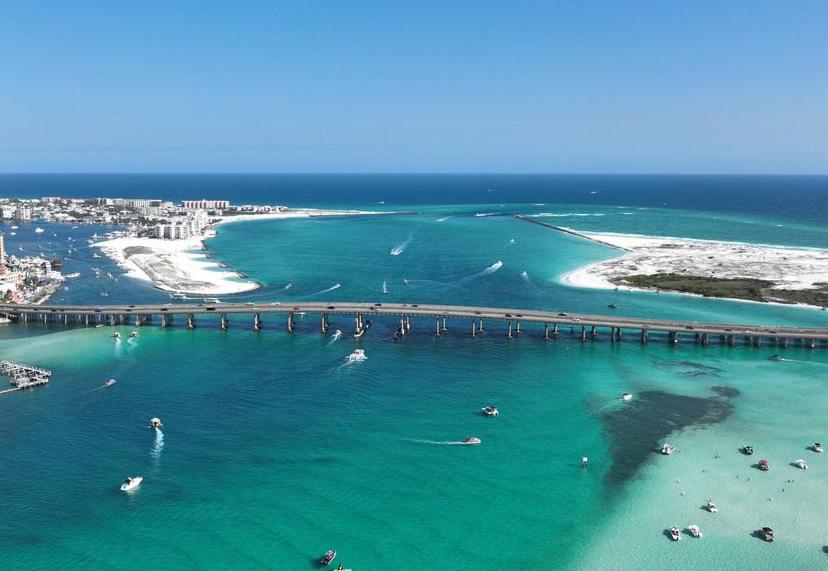
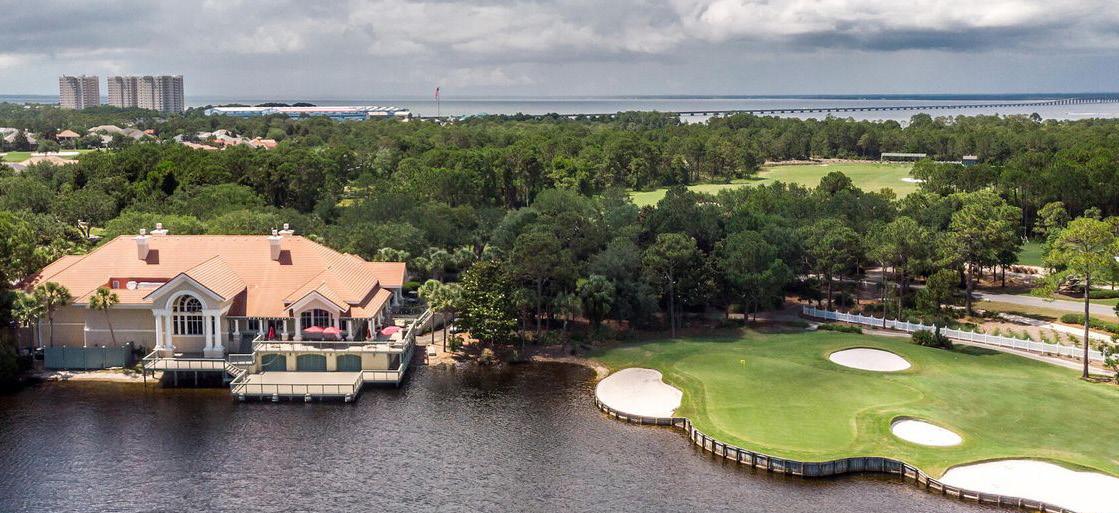
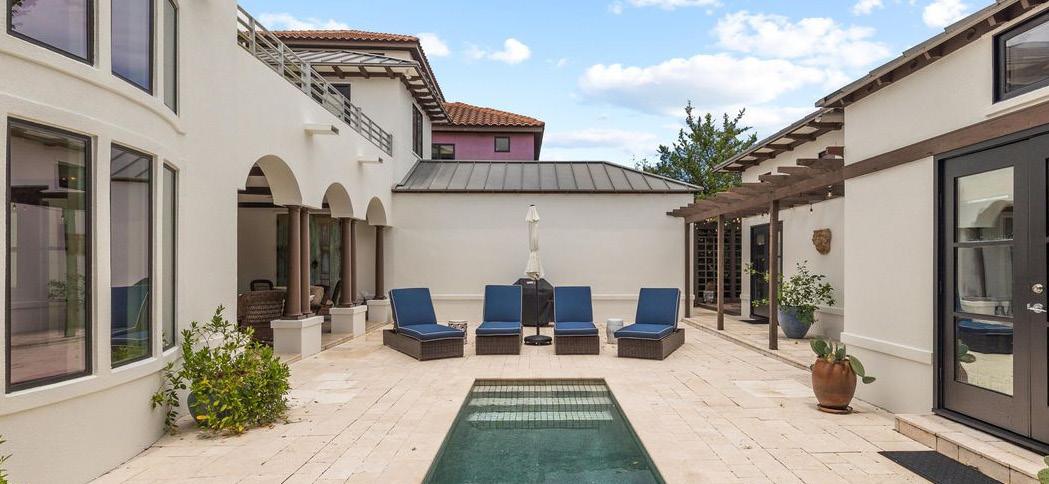
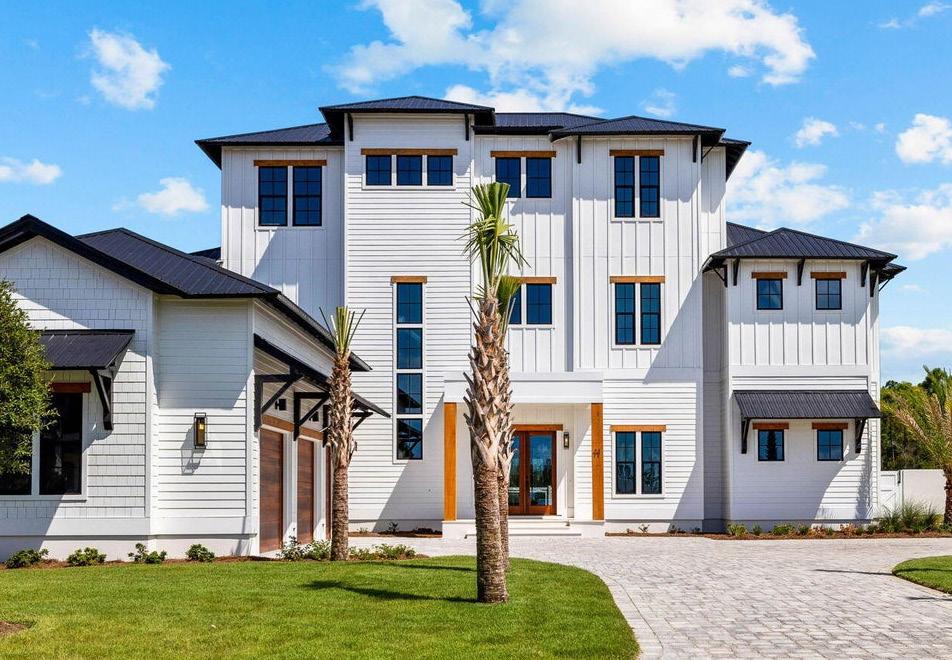
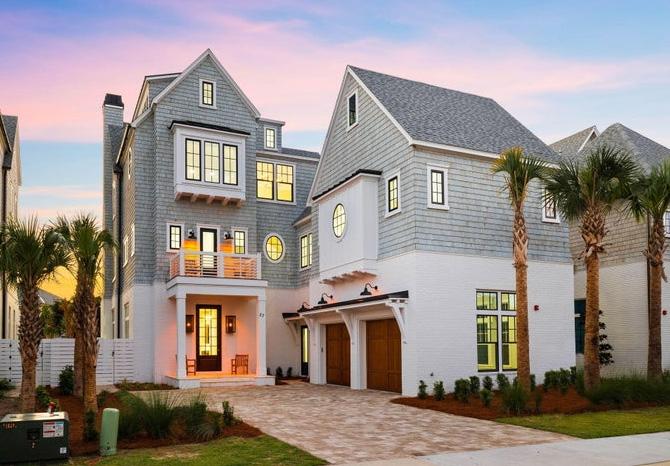
Nestled along the stunning Emerald Coast, Destin, Florida, offers a unique blend of natural beauty, upscale living, and robust financial returns, making it a premier destination for luxury real estate investment. Renowned for its pristine white-sand beaches and crystal-clear emerald waters, Destin provides a picturesque backdrop that attracts visitors and investors alike. The area’s scenic beauty, coupled with year-round sunshine, makes it an idyllic location for both vacationers and permanent residents seeking an upscale coastal lifestyle.
Destin is a vibrant and close-knit community, offering an array of exclusive amenities and activities. From world-class golf courses and deep-sea fishing to luxury shopping at Destin Commons and fine dining at award-winning restaurants, the lifestyle in Destin is nothing short of extraordinary. Destin boasts a lively harbor district with bustling nightlife, marinas, and a variety of entertainment options. This dynamic atmosphere, along with a rich calendar of events, ensures there’s always something to look forward to, enhancing the appeal and value of investing in this energetic coastal haven.
• Closed Sales Show Modest Growth Amid Quarter-End Momentum - Closed sales in Destin increased by 3% year-over-year in Q4 2024, reaching 66 transactions, coupled with a stronger 16% rise quarter-over-quarter. This indicates some recovery in buyer activity late in the year, bolstered by seasonal demand and the continued appeal of the Destin market.
• Contracts Signed Reflect Strengthening Buyer Confidence - The number of contracts signed rose by 10% year-over-year to 67 in the fourth quarter of 2024, with a more significant 22% quarter-over-quarter increase. This growth suggests renewed buyer interest, possibly fueled by the stabilization of broader economic factors and Destin’s enduring draw as a vacation and investment destination.
• Sales Volume Drops Due to Fewer High-Value Transactions - Sales volume fell sharply by 41% year-over-year to $52.57M in Q4 2024, alongside a 22% decline quarter-over-quarter. The reduced volume points to fewer high-value transactions, even as overall activity in the market remains steady, signaling a shift in buyer preferences toward lower price points.
• Days on Market Decrease Suggests Accelerated Decision-Making - Average days on market increased slightly by 4% year-over-year to 78 days but improved by 9% compared to Q3 2024. This suggests that while the market remains competitive, buyers are becoming more decisive, likely driven by the more restricted inventory within certain segments.
• Median Sale Price Remains Steady Amid Market Adjustments - The median sale price in Q4 2024 increased slightly by 1% year-over-year to $856K, while showing a significant 31% quarter-over-quarter rise. This reflects a return of higher-value transactions after a subdued Q3, highlighting resilience in the mid-range market.
• Average Sale Price Declines Year-Over-Year - The average sale price dropped by 24% year-over-year to $1.06M in Q4 2024, with a 10% decline quarter-over-quarter. This drop points to a shift in buyer preferences toward more affordable properties, alongside fewer high-end sales during the period.
• Active List Prices Show Diverging Trends - The average active list price held steady yearover-year at $1.75M, with a 10% increase from Q3 2024, reflecting strong seller confidence. Meanwhile, the median active list price declined by 13% year-over-year to $1.16M, indicating more competitive pricing in the mid-range segment.
• Pending List Prices Indicate Cautious Buyer Activity - Both average and median pending list prices declined sharply year-over-year, with the average falling 20% to $1.15M and the median dropping 22% to $810K. This suggests buyers are negotiating more conservatively, focusing on value-driven opportunities in the Destin market.
UNDER $500K
$500K TO $1M
$1M TO $3M
$3M TO $5M
$5M+
In Q4 2024, days on market varied significantly across price ranges, reflecting shifts in buyer behavior. The ultra-luxury $5M+ segment saw the most dramatic increase, with days on market skyrocketing by 660% yearover-year to 175 days, highlighting slower movement in this high-end category. In contrast, the $3M to $5M range experienced a sharp 83% decrease, now averaging just 4 days, suggesting strong demand and quick transactions for this price bracket. The mid-range $1M to $3M segment saw a notable improvement, with days on market decreasing by 17% to 96 days, while lower-priced properties under $500K averaged 45 days, a 10% decrease, reflecting steady demand for more affordable options.
In Q4 2024, properties priced between $1M and $3M continued to dominate the market, comprising 33% of all sales, down slightly from 39% in Q4 2023. The $500K–$1M range saw growth, accounting for 45% of sales, up from 39% last year, reflecting strong demand for moderately priced luxury homes. Properties under $500K represented just 17% of sales, marking a continued decline as inventory in this segment remains limited. The $3M–$5M and $5M+ ranges maintained smaller shares at 3% each, with consistent interest from high-end buyers shaping the market.
• Active Listings Increase as Inventory Stabilizes - Active listings rose by 12% year-over-year to 215 in Q4 2024, holding steady with a slight 0.5% increase quarter-over-quarter. This stability indicates that properties are staying on the market longer, despite a modest decrease in the number of new listings.
• Shifts in Active Listings by Price Range - The $3M–$5M segment saw the largest growth in active listings, up 93% year-over-year, while the $500K–$1M range grew slightly by 3%. Listings under $500K increased by 34%, reflecting renewed activity in this segment, though overall availability remains limited. The $1M–$3M range held steady, with no year-over-year change, while ultra-luxury ($5M+) listings grew by 45%, signaling increased seller activity in high-end properties.
• New Listings Show Minimal Growth - New listings edged up by just 2% year-over-year to 105, but declined 11% from the previous quarter. This suggests a seasonal slowdown, with fewer properties entering the market toward year-end, particularly in the $1M–$3M and $500K–$1M ranges, which experienced notable drops in new listings.

$500K TO $1M
$1M TO $3M
$3M TO $5M
$5M+
TO $1M
TO $3M
TO $5M


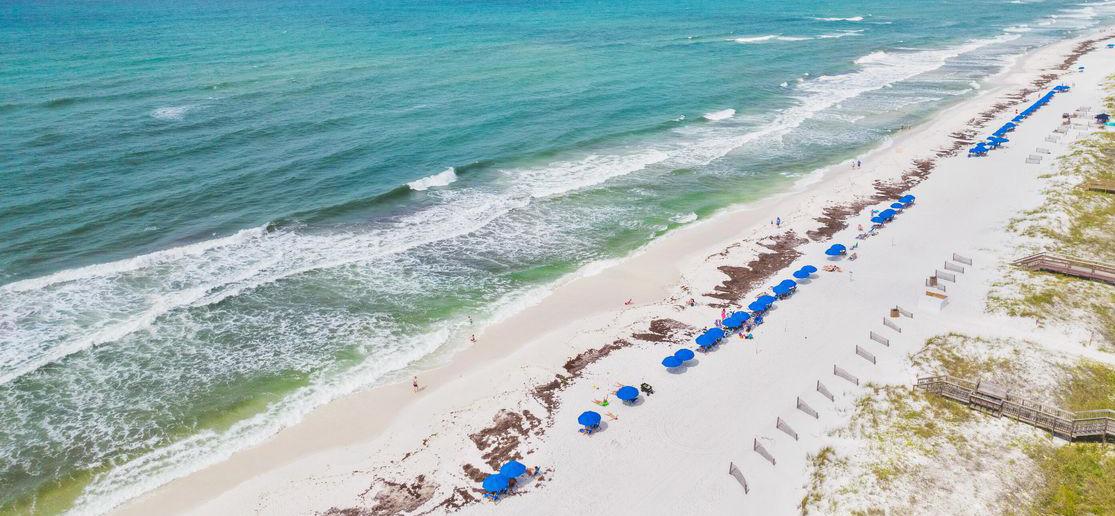
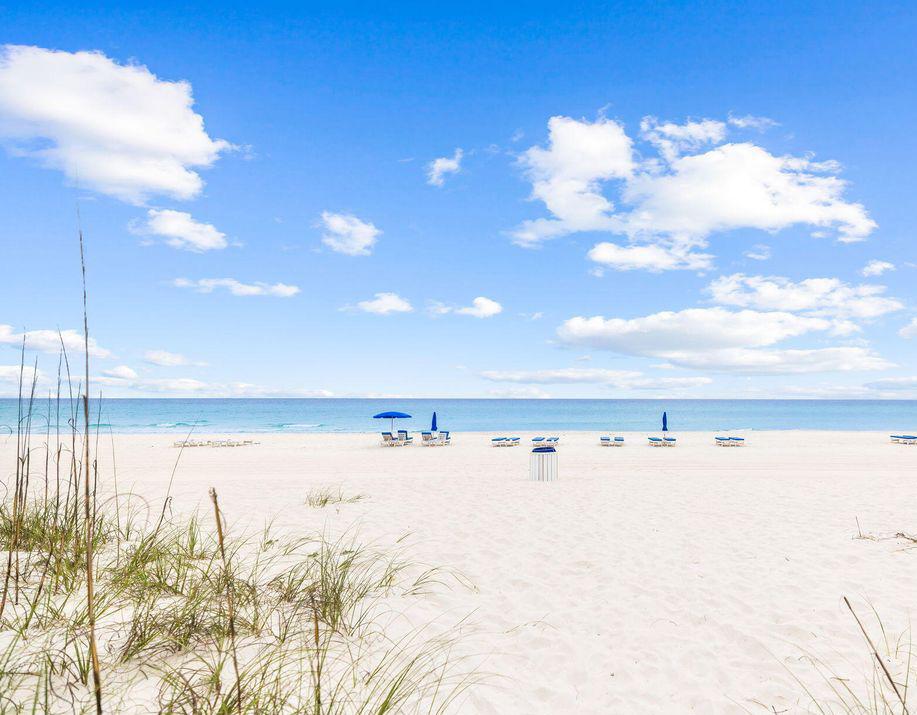
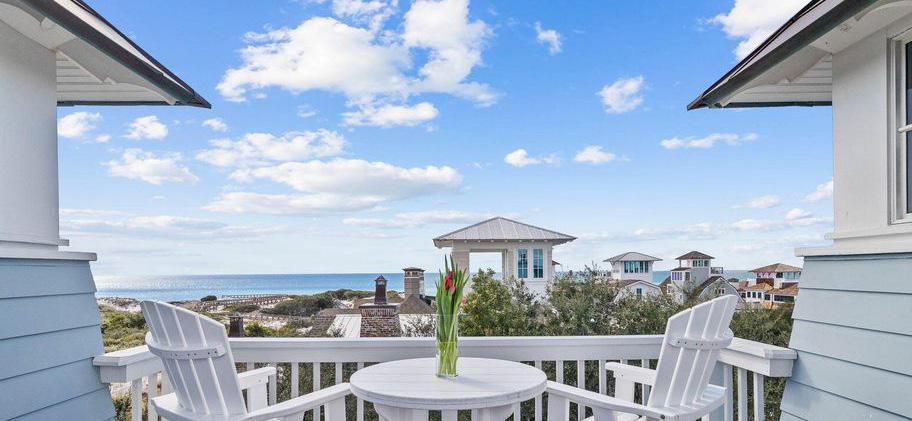
Where the sand meets the surf, you’ll find it all.
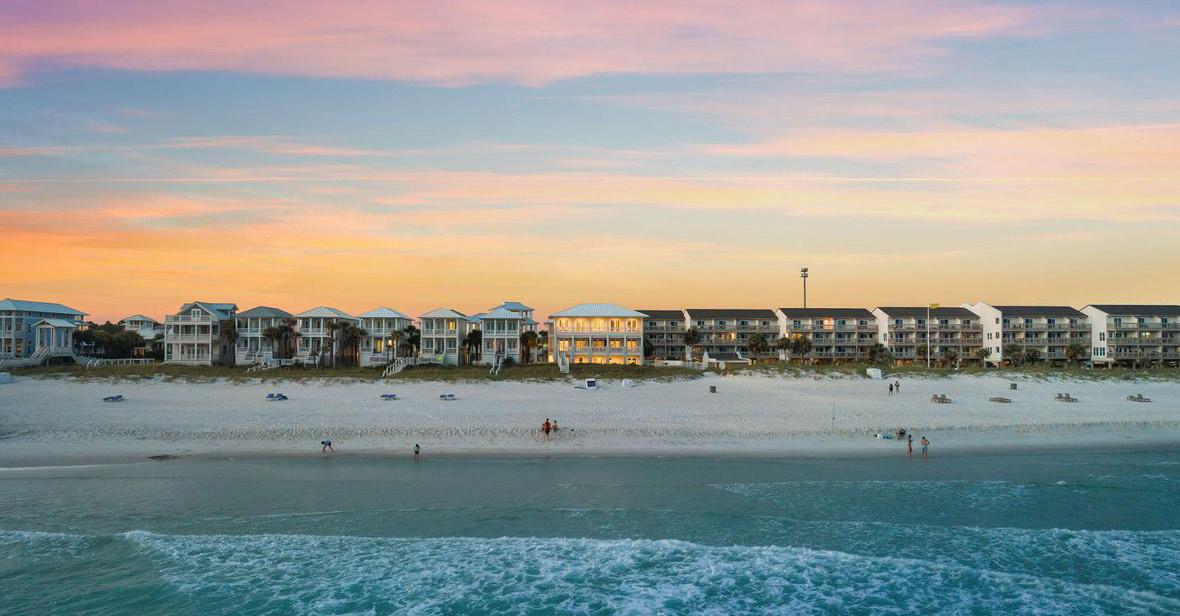
This coastal paradise is renowned for its 27 miles of pristine white-sand beaches, crystal-clear emerald waters, and stunning sunsets. Outdoor enthusiasts will appreciate the opportunities for water sports, fishing, and eco-tours through nearby state parks and conservation areas. The community is warm and welcoming, with a rich tapestry of events and activities year-round, including music festivals, art shows, farmers’ markets, and cultural celebrations.
Panama City Beach offers an array of attractions and renowned dining experiences. Pier Park is a premier shopping, dining, and entertainment complex, featuring over 120 stores, a variety of restaurants, an IMAX theater, and an amusement park. Nature lovers can explore St. Andrews State Park, known for its excellent snorkeling and scuba diving spots, and Shell Island, a secluded retreat accessible only by boat. Dining highlights include Firefly, an award-winning fine dining restaurant, Pineapple Willy’s, famous for its beachfront dining and seafood, and Runaway Island, popular for its fresh seafood with a Caribbean twist. Additionally, new attractions such as Top Golf & Dolly Parton’s Pirate Venue are set to further increase visitor traffic upon their completions in 2025. Investing in Panama City Beach real estate promises robust financial returns, driven by the area’s popularity as a vacation destination and steadily growing property values.
• Closed Sales Decline Amid Market Adjustment - Closed sales in PCB fell by 7% year-overyear to 197 in Q4 2024, alongside a sharper 14% decline quarter-over-quarter. This reflects a slowdown in buyer activity as market conditions stabilize following a period of higher transaction volume earlier in the year.
• Number of Contracts Signed Decrease - Contracts signed decreased by 14% year-over-year to 155, with a more significant 22% drop compared to Q3 2024. The decline suggests ongoing hesitancy among buyers, likely influenced by rising borrowing costs and broader economic factors.
• Sales Volume Reflects Fewer High-Value Transactions - Total sales volume declined by 24% yearover-year to $124M, down from $164M in Q4 2023, and fell 14% from Q3 2024. The decrease indicates fewer high-value transactions and a shift in buyer preferences toward the lower priced segments.
• Days on Market Increases - The average days on market rose by 61% year-over-year to 95 days, up from 59 in Q4 2023, and increased 9% from Q3 2024. This reflects a more competitive landscape for sellers, as buyers weigh their options carefully in response to current market dynamics.
• Median Sale Price Declines Slightly - The median sale price in Q4 2024 decreased by 9% year-over-year to $499K, with a modest 2% quarter-over-quarter decline from $511K in Q3 2024. This indicates a continued adjustment in pricing as buyers seek affordability in a changing market.
• Average Sale Price Drops Significantly - The average sale price fell by 17% year-over-year to $636K, down from $768K in Q4 2023. However, it showed a slight 2% increase quarterover-quarter, suggesting stabilization after a period of fewer high-value transactions.
• Active List Prices Reflect Mixed Trends - The average active list price declined by 8% year-over-year to $699K and dropped 13% quarter-over-quarter, signaling increased competitiveness among sellers. Meanwhile, the median active list price remained relatively stable at $575K, with only a 1% year-over-year decrease.
• Pending List Prices Indicate Buyer Restraint - Average pending list prices dropped 10% year-over-year to $664K, with a slight 2% quarter-over-quarter decline. The median pending list price, however, increased by 1% year-over-year to $528K, reflecting consistent demand for properties in mid-price ranges.
4Q24
UNDER $500K
$500K TO $1M
UNDER $500K
$500K TO $1M
$1M TO $3M
$3M TO $5M
The days on market (DOM) in Panama City Beach increased significantly across all price ranges in Q4 2024 compared to the previous year. Properties under $500K now spend an average of 100 days on the market, a sharp 92% year-over-year increase, reflecting slower movement in the more affordable segment. The $500K–$1M range saw a 37% rise in DOM to 85 days, while properties priced between $1M and $3M experienced the most notable increase, rising 81% to an average of 78 days on market. High-end homes in the $3M–$5M range followed with a 41% rise to 181 days, signaling slower activity in the luxury market. These figures reflect a cooling market, where buyers are taking longer to commit across all price points, particularly in the luxury sector.
The market share by price range in Panama City Beach has shifted significantly over the past few years, reflecting the effects of rising construction costs, borrowing rates, and inflation. In Q4 2024, homes priced under $500K made up 45% of the market, down from 63% in Q4 2021, as limited inventory and rising home prices have reshaped the affordable segment. The $500K–$1M range now leads the market, accounting for 46% of transactions, up sharply from 30% in Q4 2021, as this price range becomes more accessible for buyers adjusting to higher overall costs. The $1M–$3M range also saw steady growth, representing 8% of the market, while the $3M–$5M range held 1%, reflecting consistent but niche interest in high-end properties.
• Active Listings Increase as Market Stabilizes - Active listings in Q4 2024 rose 7% year-over-year to 524, up from 488 in Q4 2023. However, a 5% decline quarter-over-quarter suggests a seasonal slowdown as fewer new listings entered the market toward year-end.
• New Listings Drop Significantly - New listings declined sharply by 31% year-over-year, falling to 248 in Q4 2024 compared to 361 in Q4 2023. This steep drop reflects a more cautious seller landscape, particularly in light of broader economic uncertainties.
• Shift in Active Listings by Price Range - Listings in the $500K–$1M range saw the largest year-overyear growth, increasing by 13% to 253 active listings, reinforcing this segment’s dominance in the market. The $1M–$3M range also grew modestly, up 5% year-over-year, while the $3M–$5M segment expanded by 15%, reflecting consistent interest in higher-end properties. Listings under $500K remained relatively stable, decreasing slightly by 1% to 163.
• Luxury Segment Maintains Stability - Active listings in the $1M–$5M range held steady, with modest growth reflecting seller confidence in the luxury sector. Despite broader market adjustments, higherpriced properties continue to attract interest from buyers.
$500K TO $1M
$1M TO $3M
$3M TO $5M
TO $1M
TO $3M
TO $5M
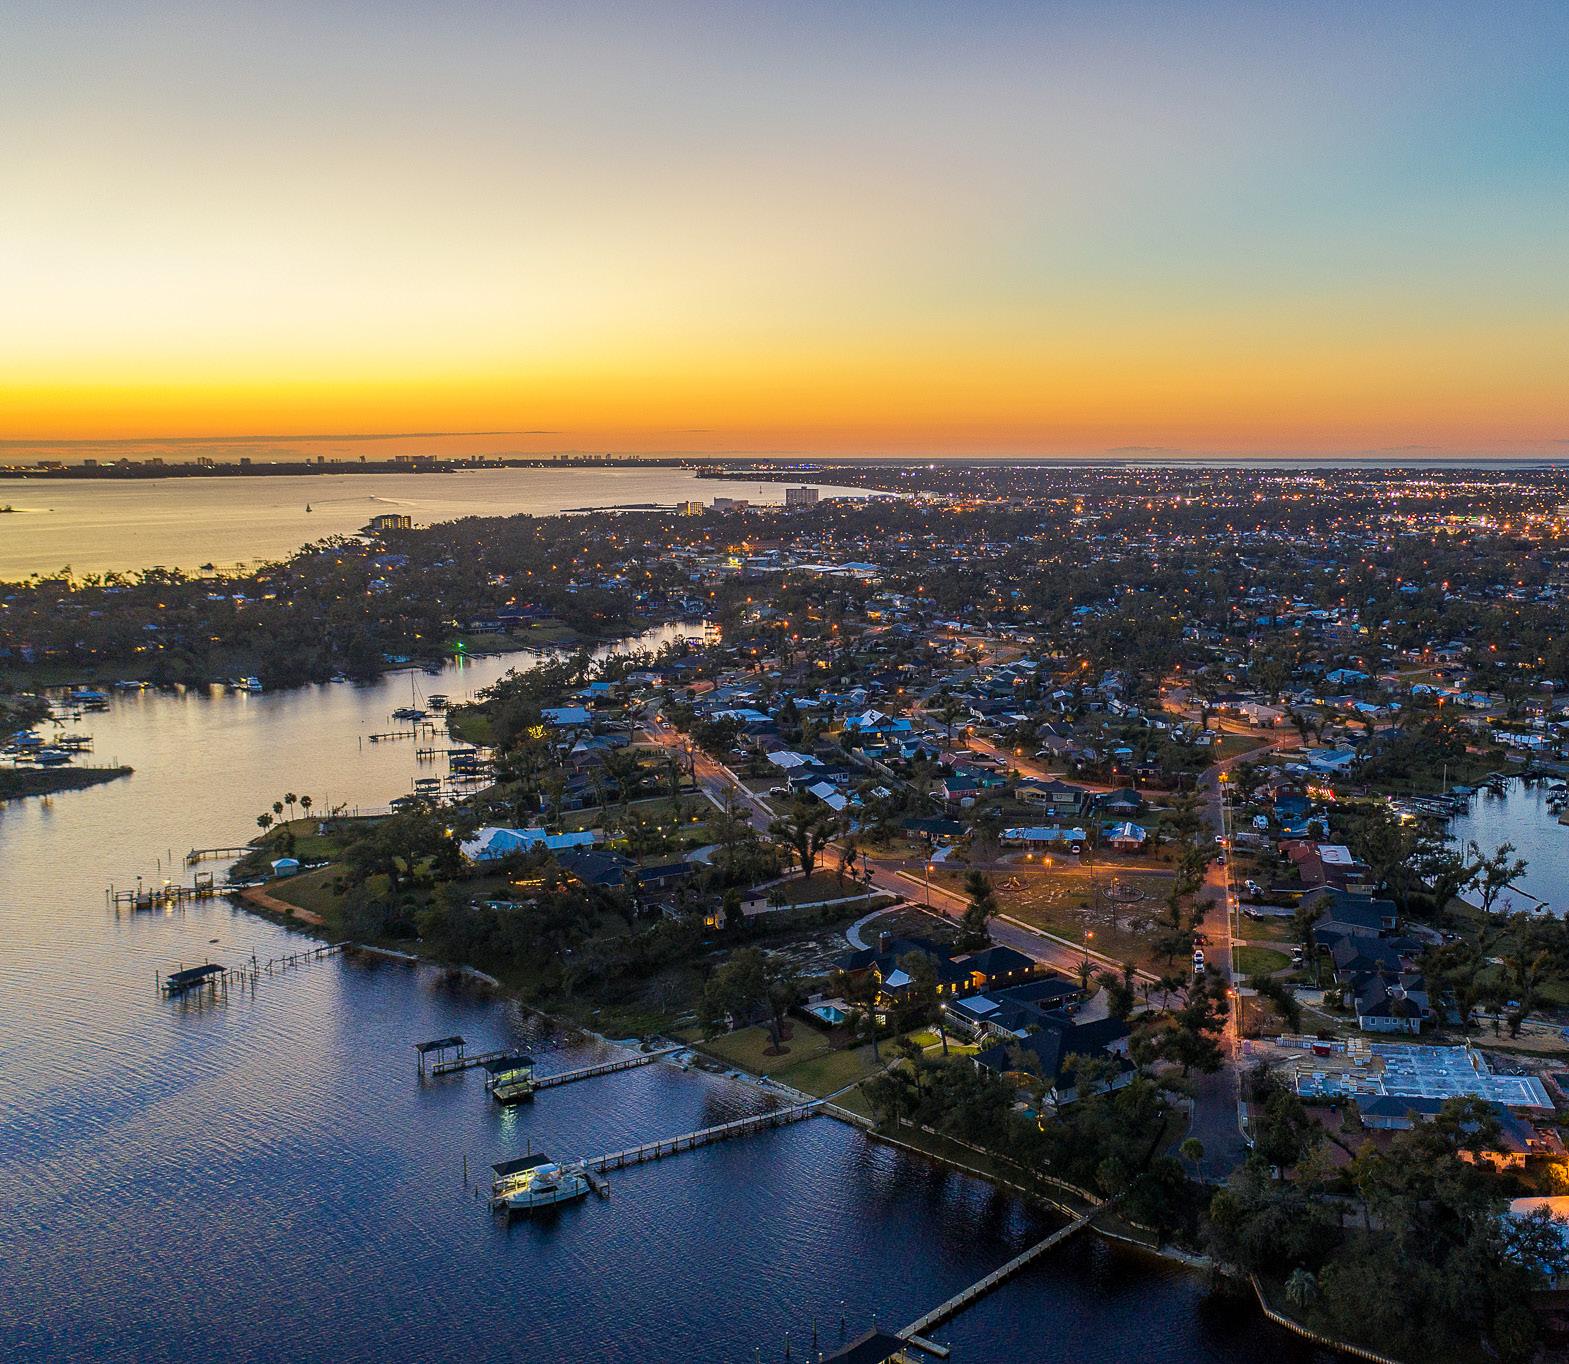
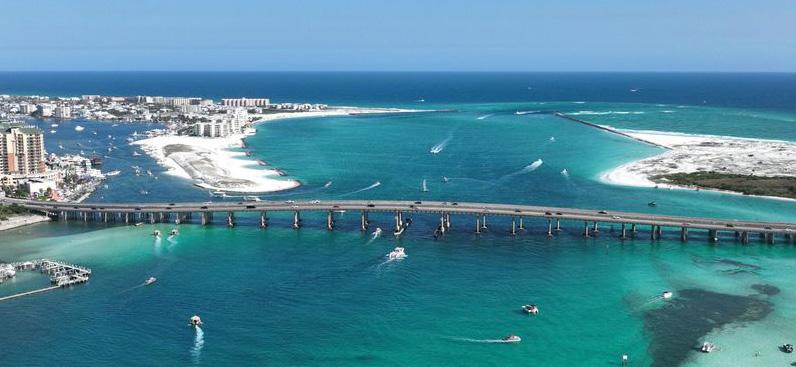
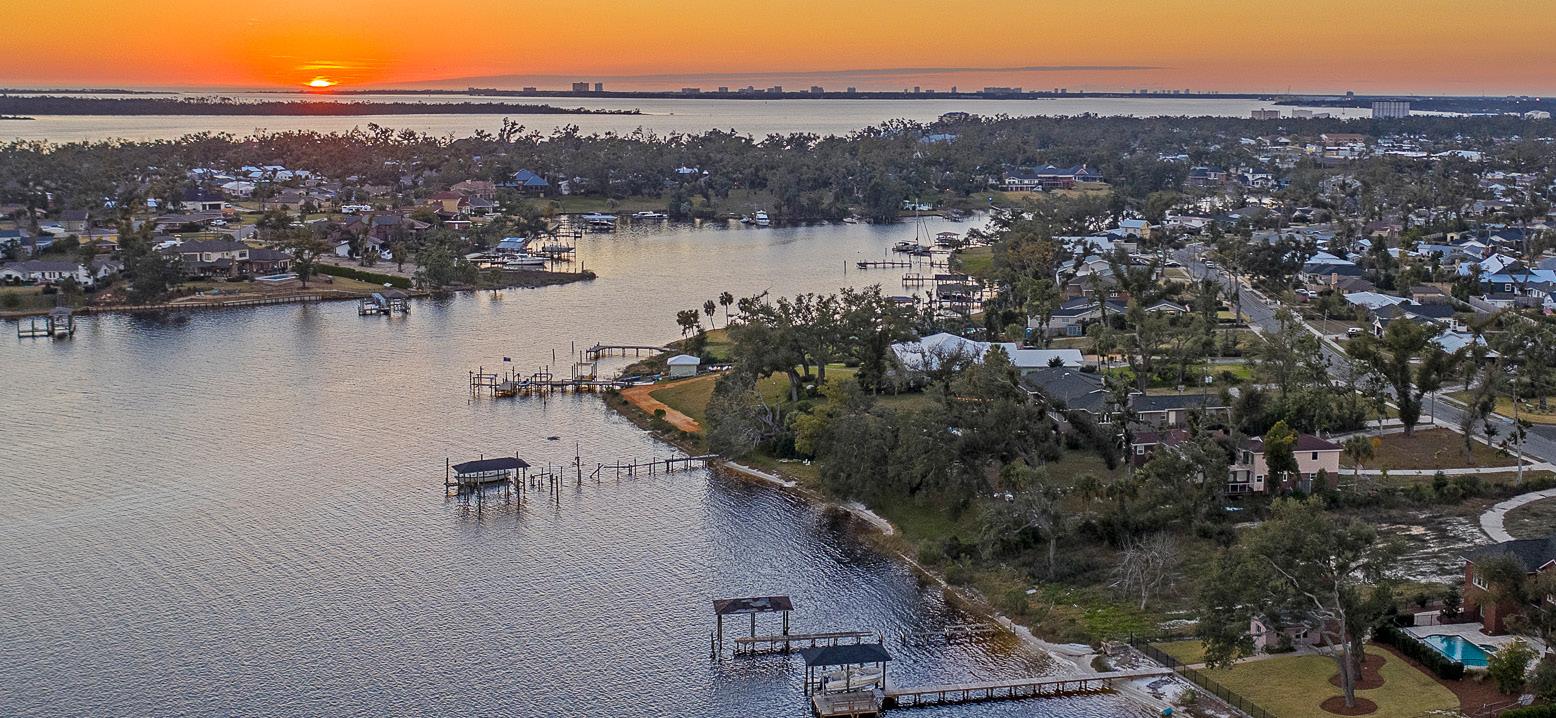
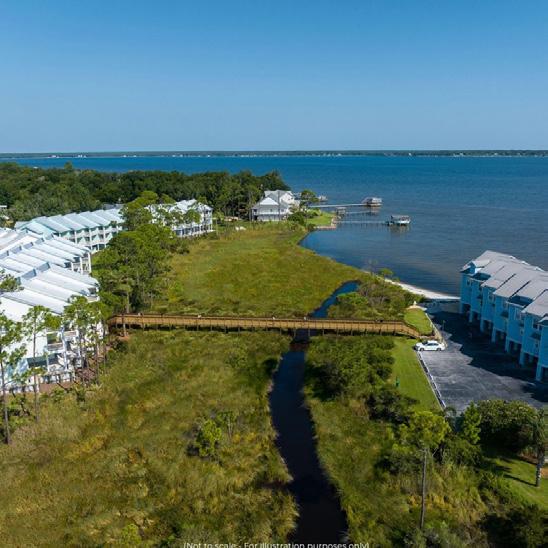
Known for its picturesque waterfront views and thriving marina culture, Panama City offers an inviting atmosphere for both residents and visitors. The city is a gateway to stunning natural landscapes, including the pristine beaches of the Gulf of Mexico and the serene beauty of St. Andrews Bay. Outdoor enthusiasts can indulge in boating, fishing, and various water sports, while enjoying the warm, sunny climate year-round.
Historic Downtown Panama City is a hub of activity, featuring charming boutiques, art galleries, and a variety of dining options. Key attractions include the Panama City Marina, which hosts numerous boating events and the Marina Civic Center, a venue for concerts and performances. Notable dining experiences include The Grand Marlin, renowned for its fresh seafood and waterfront dining, and Hunt’s Oyster Bar, a local favorite for casual, yet delectable, seafood dishes. With its appealing lifestyle, beautiful surroundings, and steady growth in property values, investing in Panama City real estate promises attractive financial returns and a high quality of life.
• Closed Sales Decline Slightly - Closed sales in Panama City fell by 14% quarter-over-quarter to 378 in Q4 2024, down from 441 in Q2 2024. However, sales rose 6% year-over-year compared to 358 in Q4 2023, showing a modest improvement in annual performance despite seasonal slowing.
• Contracts Signed Show Growth Year-Over-Year - Contracts signed increased by 5% year-overyear to 366 in Q4 2024, up from 347 in Q4 2023. Quarter-over-quarter, contracts declined by 13%, reflecting seasonal trends and some buyer hesitation amid shifting market conditions.
• Sales Volume Grows Annually but Declines Quarterly - Sales volume reached $132M in Q4 2024, a 12% year-over-year increase compared to $118M in Q4 2023. However, it fell by 19% quarterover-quarter from $162M in Q2 2024, suggesting a drop in high-value transactions as the year progressed.
• Days on Market Rise Slightly - The average days on market in Q4 2024 increased by 5% yearover-year to 64, up from 61 in Q4 2023. Quarter-over-quarter, the DOM increased 10%, signaling that properties are taking longer to sell as buyers adopt a more cautious approach.
• Median Sale Price Sees Modest Growth - The median sale price in Q4 2024 increased by 3% year-over-year, reaching $319K compared to $309K in Q4 2023. Quarter-over-quarter, the median sale price rose slightly by 1%, up from $317K in Q3 2024, reflecting stability in mid-market transactions.
• Average Sale Price Climbs Steadily - The average sale price grew 6% year-over-year to $348K in Q4 2024, compared to $328K in Q4 2023. However, a 5% decrease quarter-overquarter from $367K in Q3 2024 indicates some cooling in higher-value sales toward the end of the year.
• New Median List Price Reflects Seller Confidence - The median list price increased by 12% year-over-year to $331K in Q4 2024, up from $294K in Q4 2023. The steady 1% quarter-overquarter decrease from $334K in Q3 2024 suggests that sellers remain optimistic but are cautiously adjusting to current market conditions.
• Average List Price Holds Firm - The average list price saw a year-over-year increase of 16% to $408K in Q4 2024, compared to $351K in Q4 2023. Quarter-over-quarter, the list price rose 1%, reflecting sellers’ continued confidence in property values amid stable demand.
$250K
$250K TO $500K
$500K TO $750K $750K-1M
$250K TO $500K
$500K TO $750K
In Q4 2024, the Days on Market (DOM) in Panama City showed notable shifts across price ranges. Homes priced under $250K saw a substantial 61% increase in DOM, now averaging 71 days, reflecting a slowdown in the lower-priced segment. The $750K to $1M range saw the most significant improvement, with DOM dropping by 69% year-over-year to just 49 days, indicating strong buyer interest in this bracket. Properties in the $500K to $750K range also saw a modest decrease, with DOM falling by 18% to 67 days. Meanwhile, the $250K to $500K range remained stable at 62 days, showing consistent market activity. The $1M+ segment experienced a slight decrease in DOM, down 12% to 104 days, highlighting resilience and continued demand in the luxury market.
In the final quarter of 2024, the market share in Panama City demonstrated a continued shift toward higher price points. Homes priced under $250K now account for just 18% of the market, a decline from 20% in Q4 2023 and a significant drop from 38% in Q4 2021. This trend reflects rising home values and limited availability in the most affordable segment. The $250K to $500K range remains dominant, holding steady at 72% of the market for the second consecutive year, underscoring strong buyer demand in this mid-tier segment. Meanwhile, higher-priced homes in the $500K to $750K range grew slightly, increasing their share to 8% from 6% in Q4 2023, indicating gradual growth in the upper-tier market. Homes in the $750K to $1M range continue to represent a small but growing share of the market, now at 2%, reflecting emerging demand for higher-end properties. This data illustrates a steady upward shift in market dynamics, with mid-tier and higherpriced homes capturing increasing attention.
• Active Listings Increase Significantly – Active listings grew by 27% year-over-year in Q4 2024, reaching 590 compared to 463 in Q4 2023. Quarter-over-quarter, active listings saw a modest 4% increase, indicating a steady accumulation of inventory on the market.
• Surge in Listings Across Mid-Tier Price Ranges – Homes priced between $500K and $750K saw the largest growth in active listings, surging by 197% year-over-year, from 32 listings in Q4 2023 to 93 in Q4 2024. Similarly, the $750K–$1M segment experienced an 80% increase, reflecting robust activity in the higher price brackets.
• Inventory Levels for Lower-Priced Homes Remain Stable – Listings under $250K increased slightly by 48% year-over-year, rising from 72 in Q4 2023 to 106 in Q4 2024. However, this growth is relatively modest compared to higher price points, suggesting a tightening of entry-level options.
• High-End Market Gains Momentum – Listings in the $1M+ segment grew by 83% year-over-year, rising from 14 to 26 listings in Q4 2024. This increase highlights stronger activity in the luxury segment, despite broader market fluctuations.
• New Listings Show Modest Growth – New listings increased by 7% year-over-year, reaching 496 in Q4 2024 compared to 462 in Q4 2023. However, the quarter-over-quarter decline of 15% from Q3 2024 suggests some seasonal or market-related slowdowns in seller activity.
$250K TO $500K
$500K TO $750K
$250K TO $500K $500K TO $750K $750K-1M


What visitors are looking for
Results from Visitor Satisfaction Surveys:
They want security, and a safe environment for their kids to run free. They want beautiful beaches and clear water. They want nightlife that includes ice cream with their young ones. They want a friendly environment with similar types of people. They want an energetic atmosphere with lots of activities in nature, on & off the beach.
Visiting Walton County allows access to all of these desires, making it a hot spot for tourism, and rental income generation.
2024 VISITORS
3.39M -9% YTD
SPRING & SUMMER STATISTICS
The percentage of nights booked for guests (nights sold), out of the number of total nights available to book for guests (nights available). By comparison, occupancy rate, the traditional hospitality KPI, calculates the percentage of nights sold out of the total nights in the period, without considering the unavailable nights. Because owner reservations and hold nights take up some of the nights typically, available occupancy is helpful to understand how well you’ve filled up the properties from the nights that were available for you to fill with guests.
= Nights Sold / Nights Available
Revenue Per Available Room. A critical KPI for measuring revenue performance, RevPAR takes into account both the average rate at which you booked the property (ADR) and the number of nights it was booked (occupancy). This provides a better indicator of overall performance when compared to looking at the ADR or the occupancy alone.
= Occupancy x ADR (or) Total Unit Revenue / Nights Available in a given period

Spring & Summer 2024
The percentage of nights booked for guests (nights sold), out of the number of total nights available to book for guests (nights available). By comparison, occupancy rate, the traditional hospitality KPI, calculates the percentage of nights sold out of the total nights in the period, without considering the unavailable nights. Because owner reservations and hold nights take up some of the nights typically, available occupancy is helpful to understand how well you’ve filled up the properties from the nights that were available for you to fill with guests.
= Nights Sold / Nights Available
Revenue Per Available Room. A critical KPI for measuring revenue performance, RevPAR takes into account both the average rate at which you booked the property (ADR) and the number of nights it was booked (occupancy). This provides a better indicator of overall performance when compared to looking at the ADR or the occupancy alone.
= Occupancy x ADR (or) Total Unit Revenue / Nights Available in a given period
What visitors are looking for Results from Visitor Satisfaction Surveys:
They want good food, and unique dining experiences. They want beautiful beaches and clear water. They want nightlife that includes ice cream with their young ones. They want water activities and adrenaline rush adventures. They want an energetic atmosphere with lots of unique shopping, festivals, and evening entertainment in a romantic setting.
Visiting Panama City Beach allows access to all of these top desires, making it a hot spot for tourism, and rental income generation.
2024 VISITORS
1.83M -26% YTD
SPRING & SUMMER STATISTICS
The percentage of nights booked for guests (nights sold), out of the number of total nights available to book for guests (nights available). By comparison, occupancy rate, the traditional hospitality KPI, calculates the percentage of nights sold out of the total nights in the period, without considering the unavailable nights. Because owner reservations and hold nights take up some of the nights typically, available occupancy is helpful to understand how well you’ve filled up the properties from the nights that were available for you to fill with guests.
= Nights Sold / Nights Available
Revenue Per Available Room. A critical KPI for measuring revenue performance, RevPAR takes into account both the average rate at which you booked the property (ADR) and the number of nights it was booked (occupancy). This provides a better indicator of overall performance when compared to looking at the ADR or the occupancy alone.
= Occupancy x ADR (or) Total Unit Revenue / Nights Available in a given period


The Retreat at Innerarity Sells Out: Luxury Waterfront Homes in Innerarity Point a Huge Success
NEWS WIRE
Recognizing the Outstanding Efforts of Women Driving the Economy Forward
HOUSING WIRE

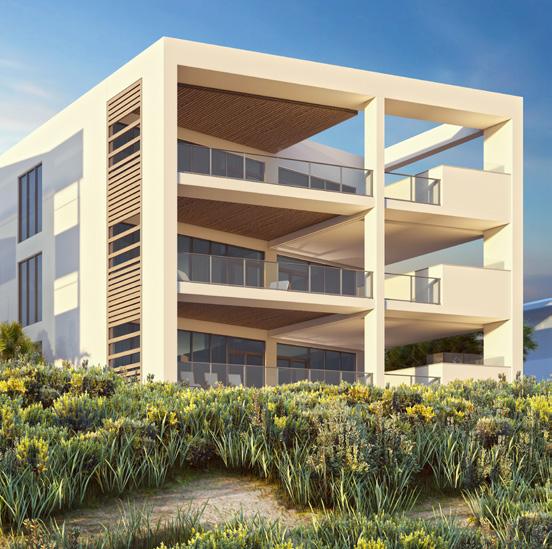
Introducing Costera: Ultimate Luxury Coastal Living on Florida’s Scenic Hwy 30A
NEWS WIRE
A Gulf-Front Masterpiece Finds Its Match
NEWS WIRE
Corcoran Reverie Takes Honors as Best Residential Real Estate Company
NEWS WIRE

Corcoran Reverie Shatters Records with Landmark Sale at 25 N Somerset St.
NEWS WIRE

CLIENTS SERVED
STATE SIDES RANK AVERAGE TRANSACTION PRICE 2023 SALES VOLUME STATE VOLUME NATIONAL VOLUME