SMART Desktop for Data Management
SMART Desktop
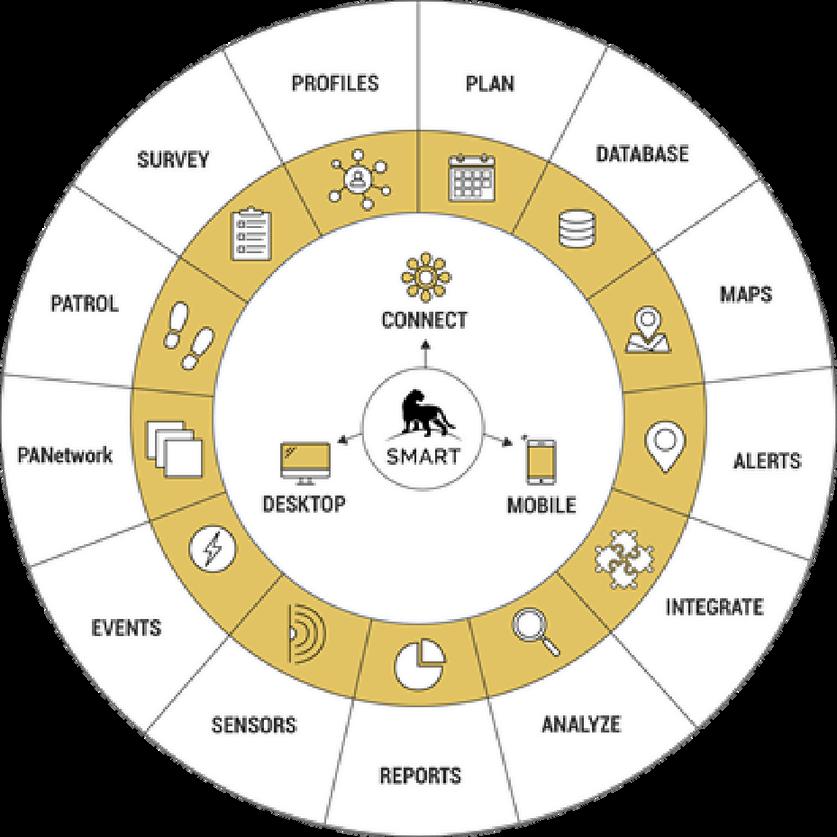
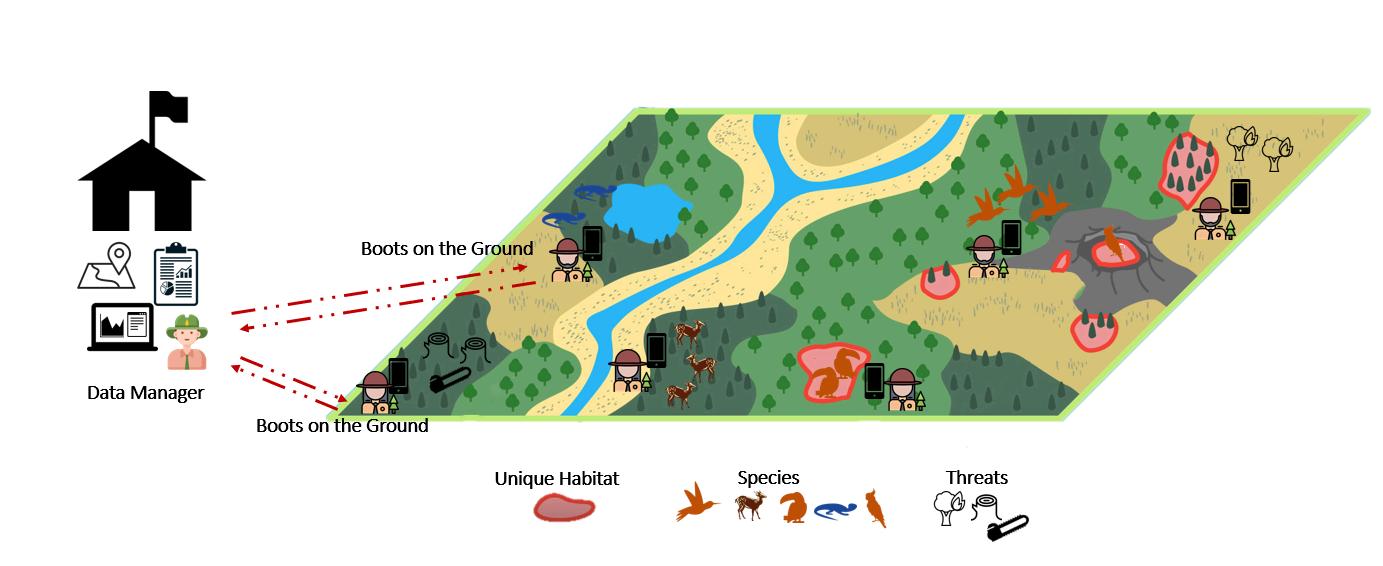
SMART is a suite of best practices aimed at helping protected area and wildlife managers better monitor, evaluate, and adaptively manage patrolling activities SMART enables users to collect, store, communicate, and evaluate ranger-based data on patrol efforts, patrol results, and threat levels SMART Desktop platform enables capabilities for reporting and analysis, data visualization, and customization of data collection requirements.
Below are the minimum set of system requirements for SMART Desktop to operate.
System Requirements
Laptop/Desktop Computer
Minimum specifications:
500 GB HDD hard drive
16GB RAM 2
Intel Core i5
64-bit processor
Windows 10 OS or higher
Features of SMART Desktop
A database featuring robust summary and query functionality
Simple data entry, multilingual support, and easy-to-use
Integrated capability for mapping and spatial analysis
Integrating information from mobile devices with GPS
Automated report generation and analysis
Simple sharing of information
Setting up SMART Desktop
Below are the steps for installing the SMART Desktop on computers and laptops.
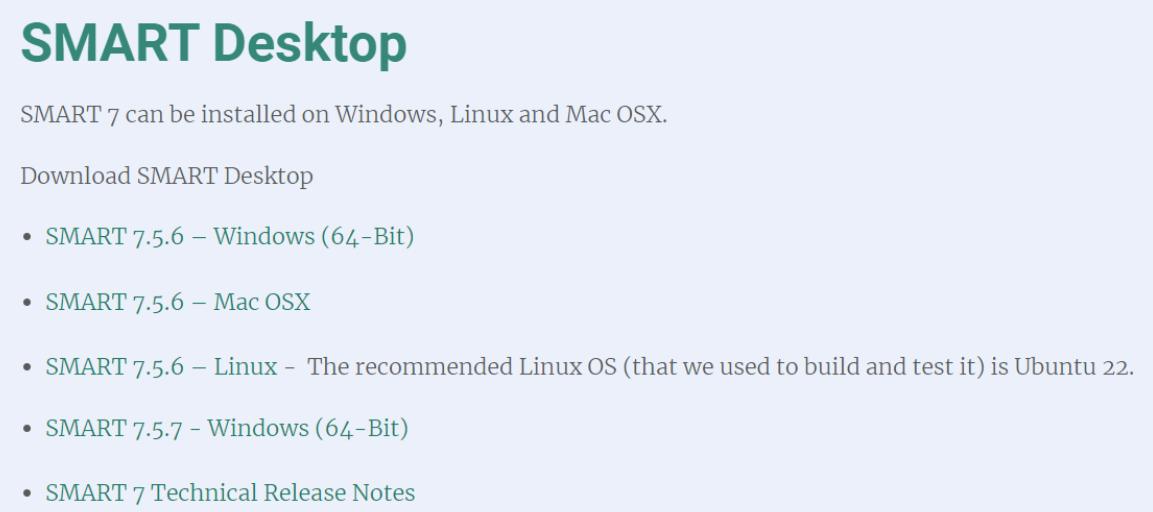
Download SMART Desktop (latest version) from: https://smartconservationtool s.org/enus/Download/DownloadSMART-7
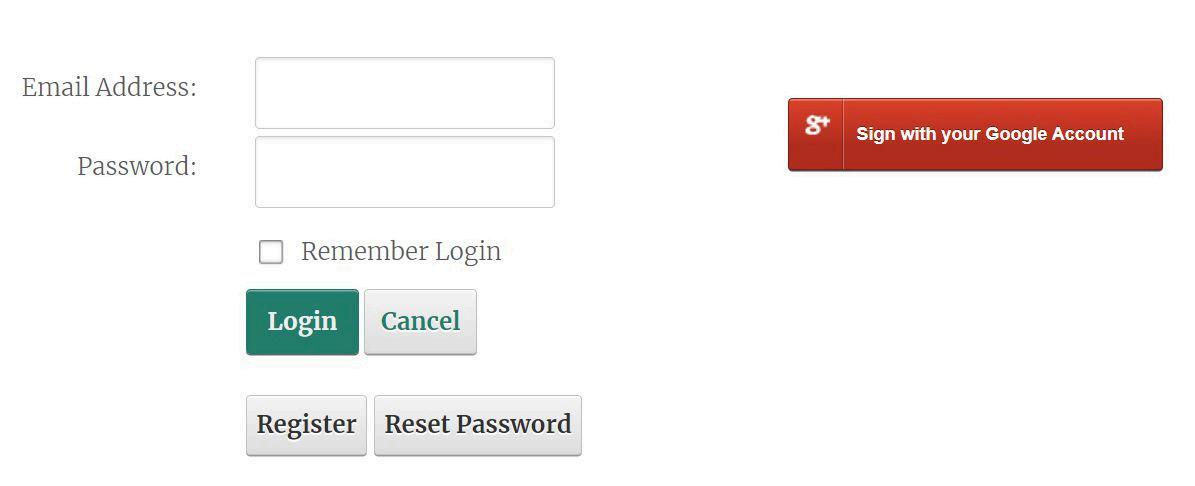
Log in using a Google account to gain access to the downloadable file
Extract the SMART 7 zip file contents into a folder on the computer from where SMART will be running.
Run the executable SMART.exe to launch SMART.
When first installing SMART, use the following credentials to log in to the sample conservation area:
Username= smart
Password = smart
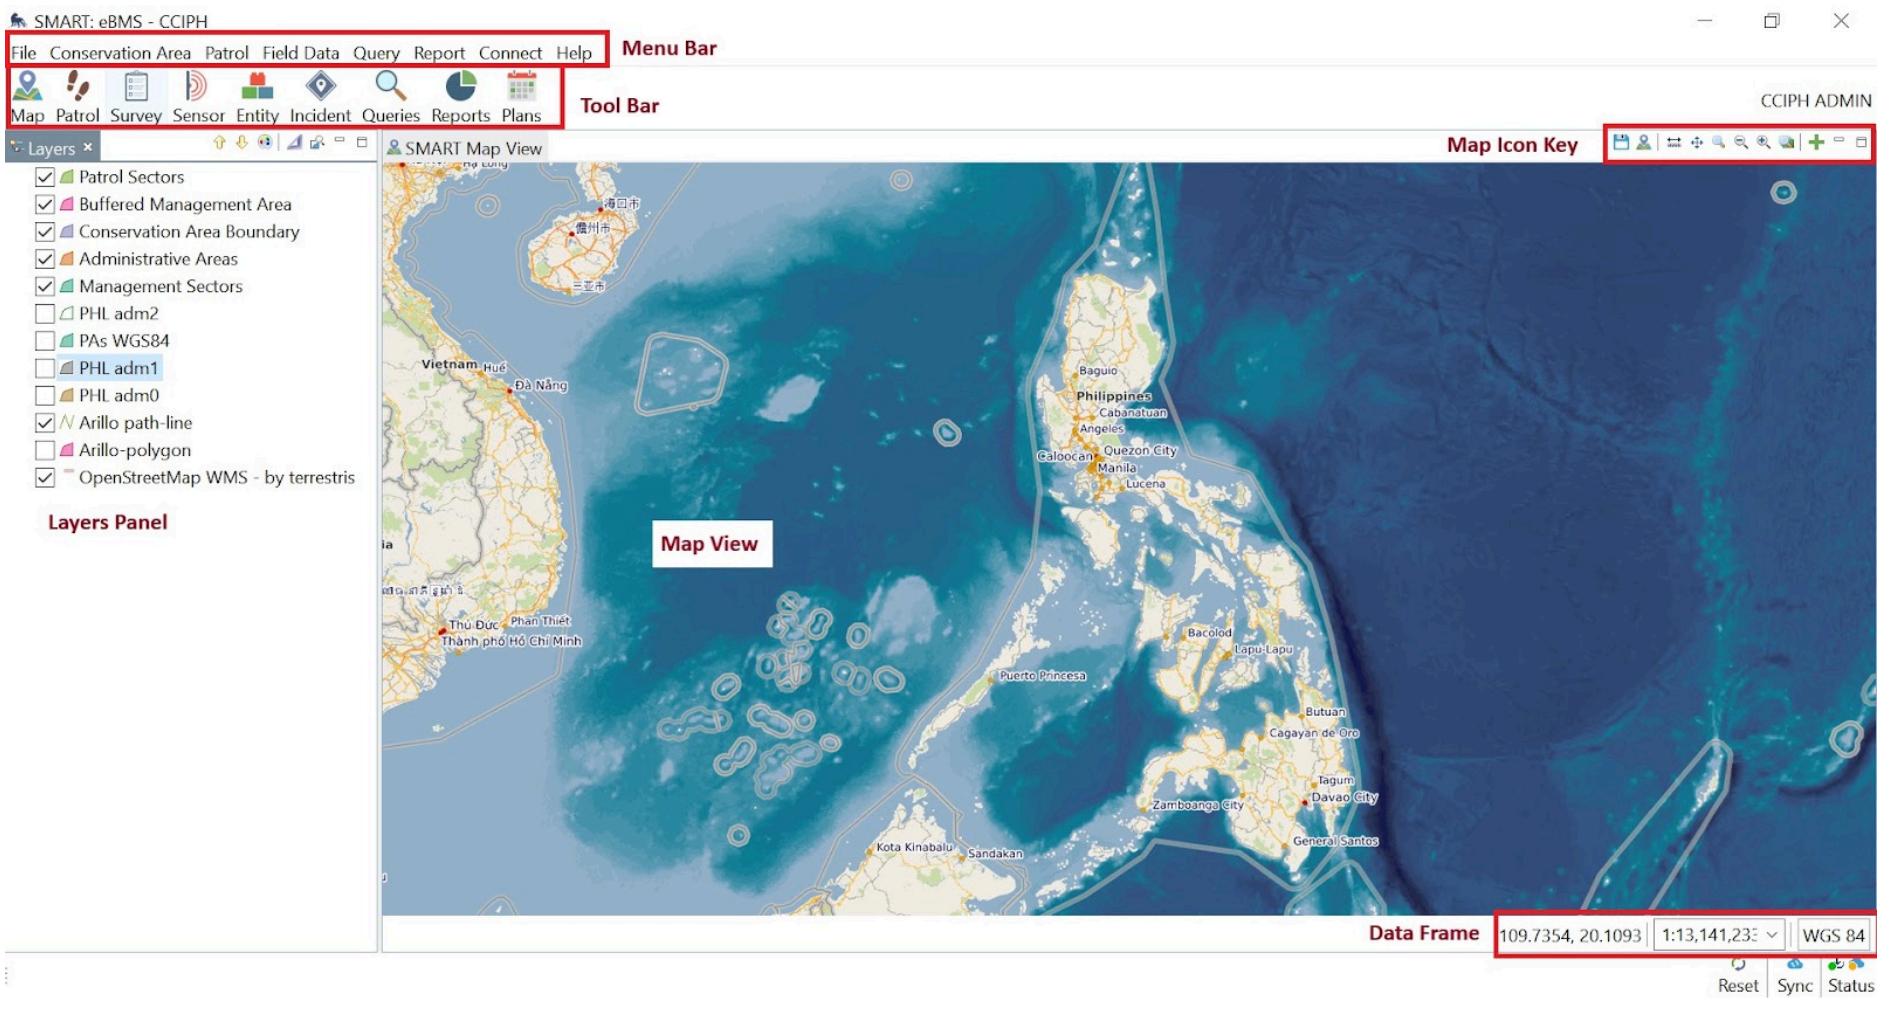
Overview
Note: The interface may differ due to updates made after the development of this manual.
Feature Function
Menu bar
Toolbar
Map Icon Key
Layers Panel
Map View
Access to a variety of tools through drop-down options
Compose of icons with respective functionalities
Compose of icons for navigating the map
Compose of spatial layers displayed in the map window
Large window that shows the base map
Data Frame Contains a coordinates system and scale
SMART Desktop Navigation
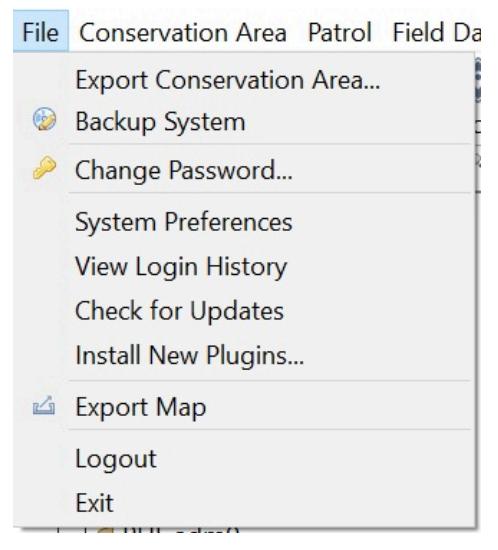
Cluster 1: File
The file tab includes the SMART conservation area system configurations.
Feature Function
Export Conservation Area
Backup System
Change Password
System Preference
View Login History
Check for Updates
Install New Plugins
Exports the conservation area currently opened on SMART Exported output can be shared with another SMART Desktop user
Exports the whole SMART Desktop All the conservation areas imported in SMART 7 will be exported in 1 file Exported output can be shared with another SMART Desktop user
Changes the password of the user currently logged in
Modifies various system settings within the SMART system
Displays the history of all users ' logins to all CA
Directly contacts the software site for version updates Works when connected to the internet
Allows installation of other plugins needed for SMART Desktop
Cluster 2: Conservation Area
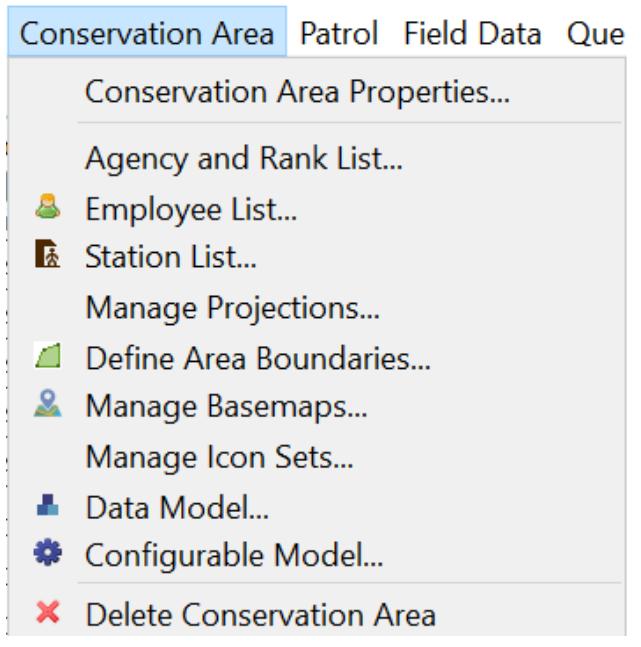
Includes all the configurations needed to start a data model or patrol project
Feature
Conservation Area Properties
Agency and Rank List
Employee List
Station List
Manage Projections
Define Area Boundaries
Manage Basemaps
Manage Icon Sets
Data Model
Configurable Model
Delete Conservation Area
Function
Defines the properties related to the conservation area
Ranks employees based on their agencies/departments
Manages the conservation area employees and employee teams Admin users can add, edit, delete, import, and export employee members and organize them into teams
Creates, deletes, imports, and exports stations related to the conservation area
Sets and define the coordinate display projection
Adds different boundaries for the conservation area This includes Buffered Management Areas, Administrative Areas, Management Sectors, and Patrol Sectors
Defines base maps to be used for the conservation area
Manages the SMART icon sets associated with the conservation area
The structure for collecting data at the site, including all categories, subcategories,attributes, and values
The version of the data model that is used with the handheld data collection device
Deletes the whole conservation area
Cluster 3: Default Map Perspective
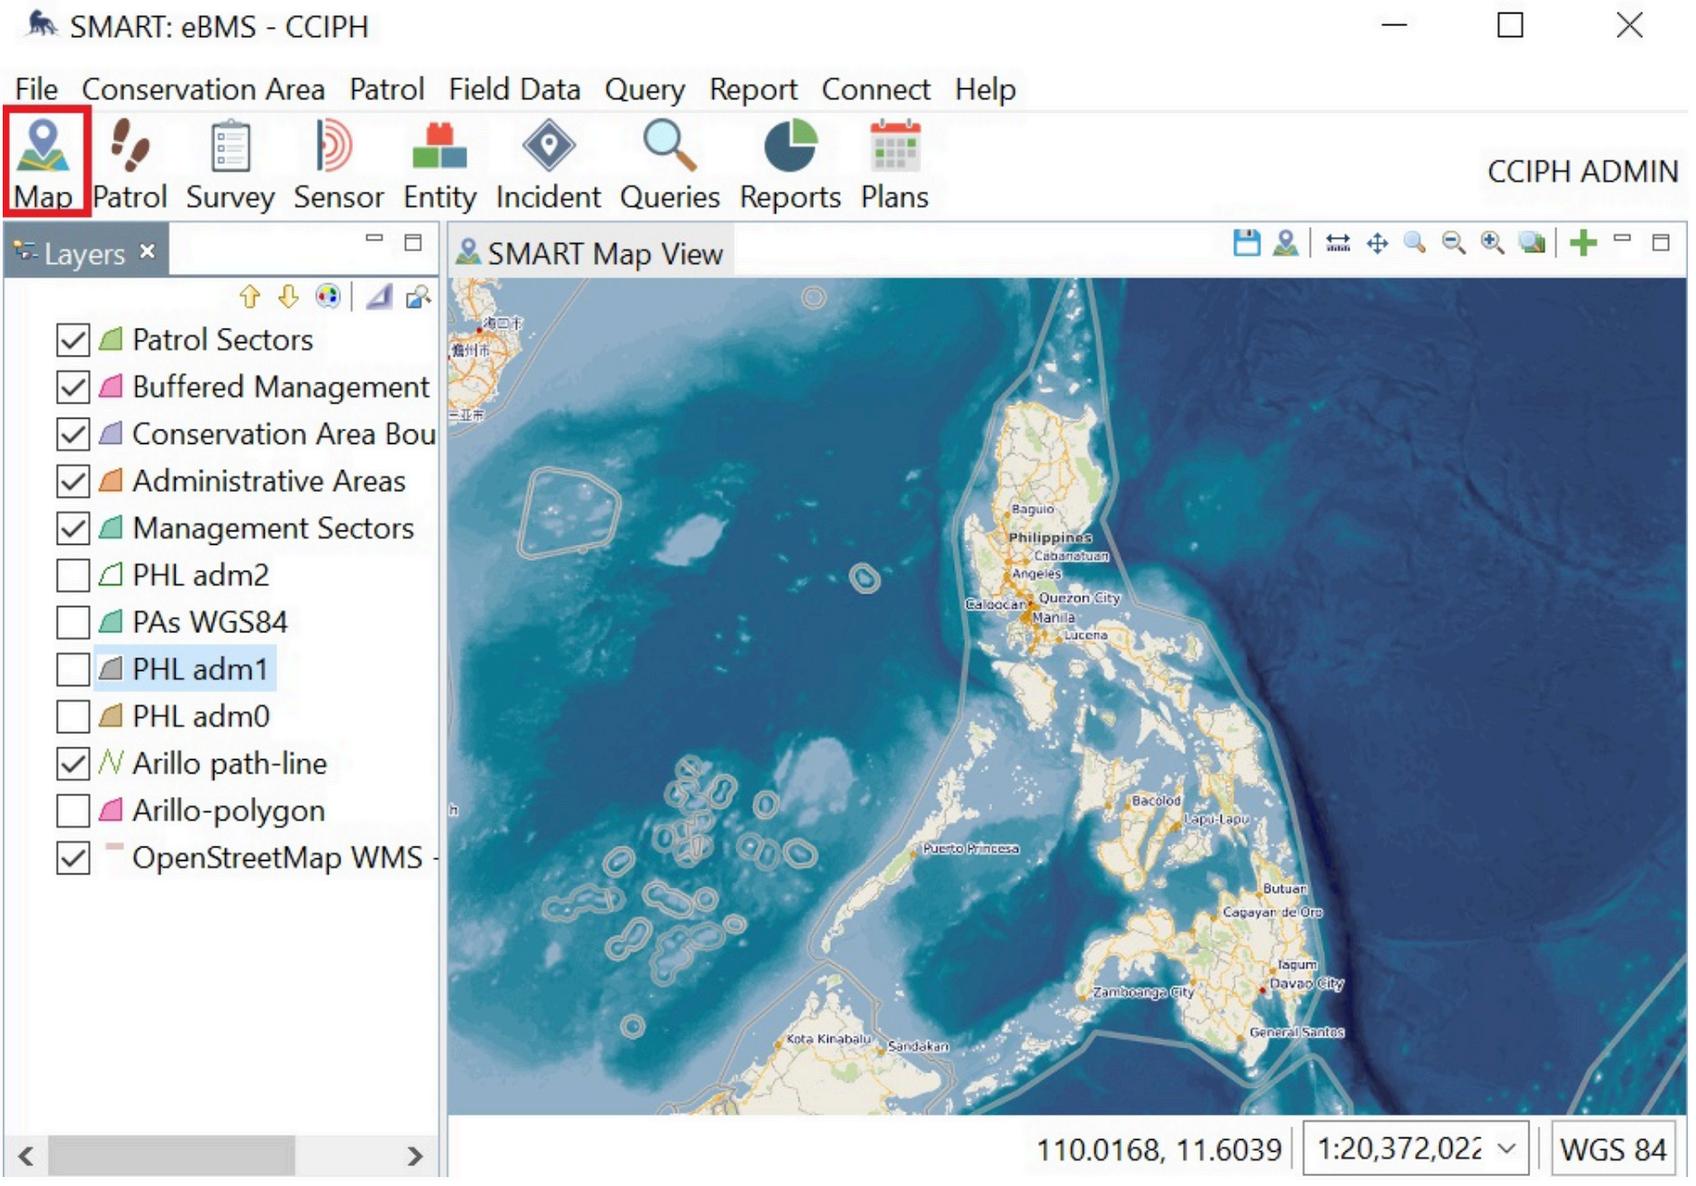
The map information of the conservation area will be seen in the map window
To navigate the map, click the icon keys in the upper right corner The map layers can be enabled and disabled on the layers panel on the left side by checking or unchecking the checkboxes Click the Default Map Perspective to return the map to its default format
Cluster 4: Patrol
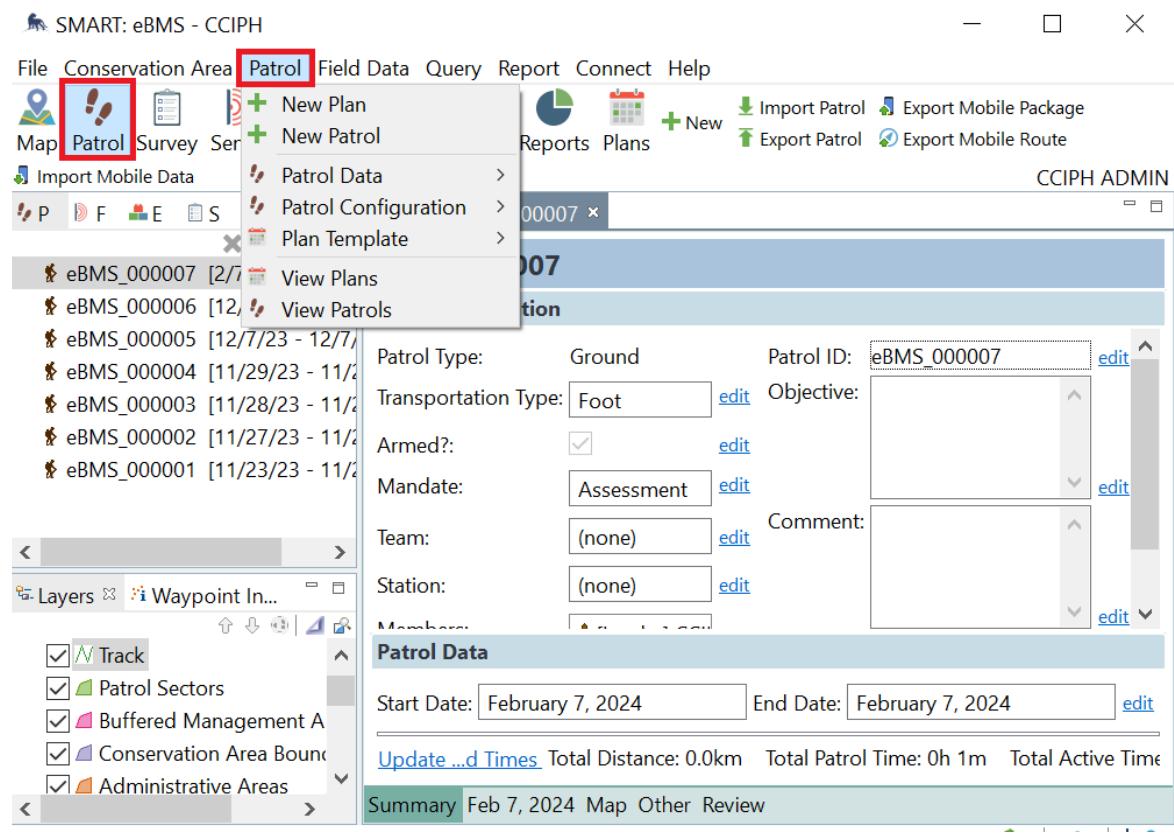
The patrol data can be seen under the Patrol tab in the menu bar Choose View All Patrols For a shortcut, click the Patrol icon from the toolbar Each patrol data can be reviewed by clicking on a specific one.
Cluster 4: Patrol
Import
Export
Patrol Mandates
Patrol Types
Patrol Teams
Custom Patrol Attributes
View Patrol
Cluster 5: Field Data
Patrol Data
Imports patrols from external sources
Exports patrols as zip files
Patrol Configuration
Manages the lists of mandates associated with a patrol (i e Monitoring, Assessment, Patrol)
Manages the transportation types used by the users (i e Walk, Boat, Drone) and the patrol types (i e Ground, Water, Air)
Adds and edits the list of patrol teams
Adds custom attributed to collect for patrols Users can add patrol attributes like a data model
Enables users to view raw patrol data collected from the field
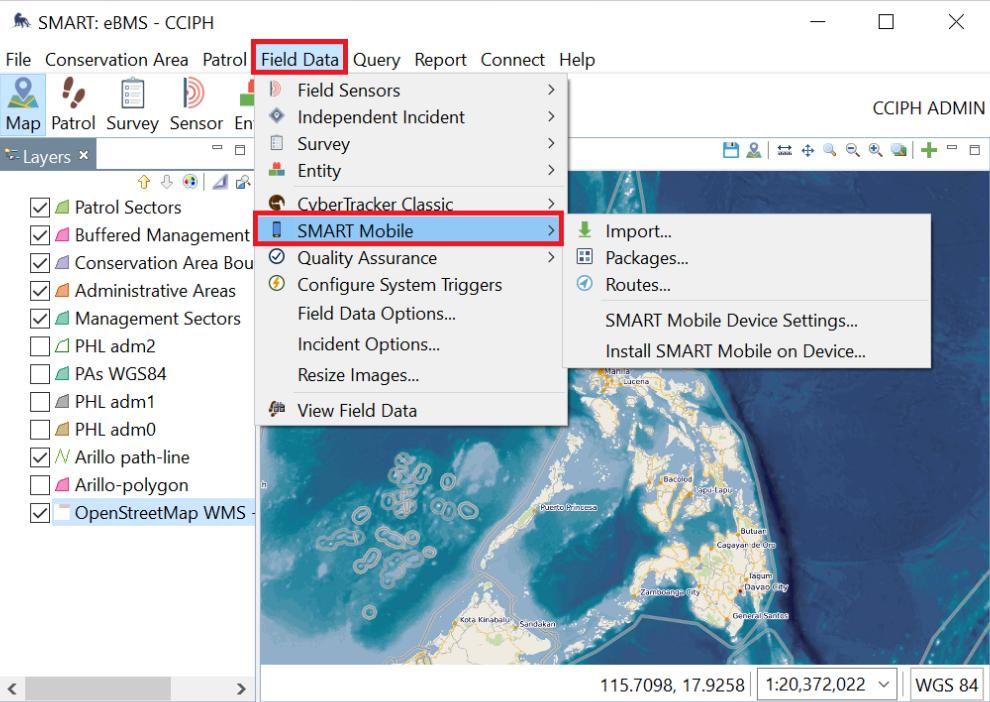
This tab is mostly used to package the data model for SMART Mobile exportation This manual only focuses on the SMART Mobile feature
Cluster 5: Field Data
Feature
Import
Packages
Function
SMART Mobile
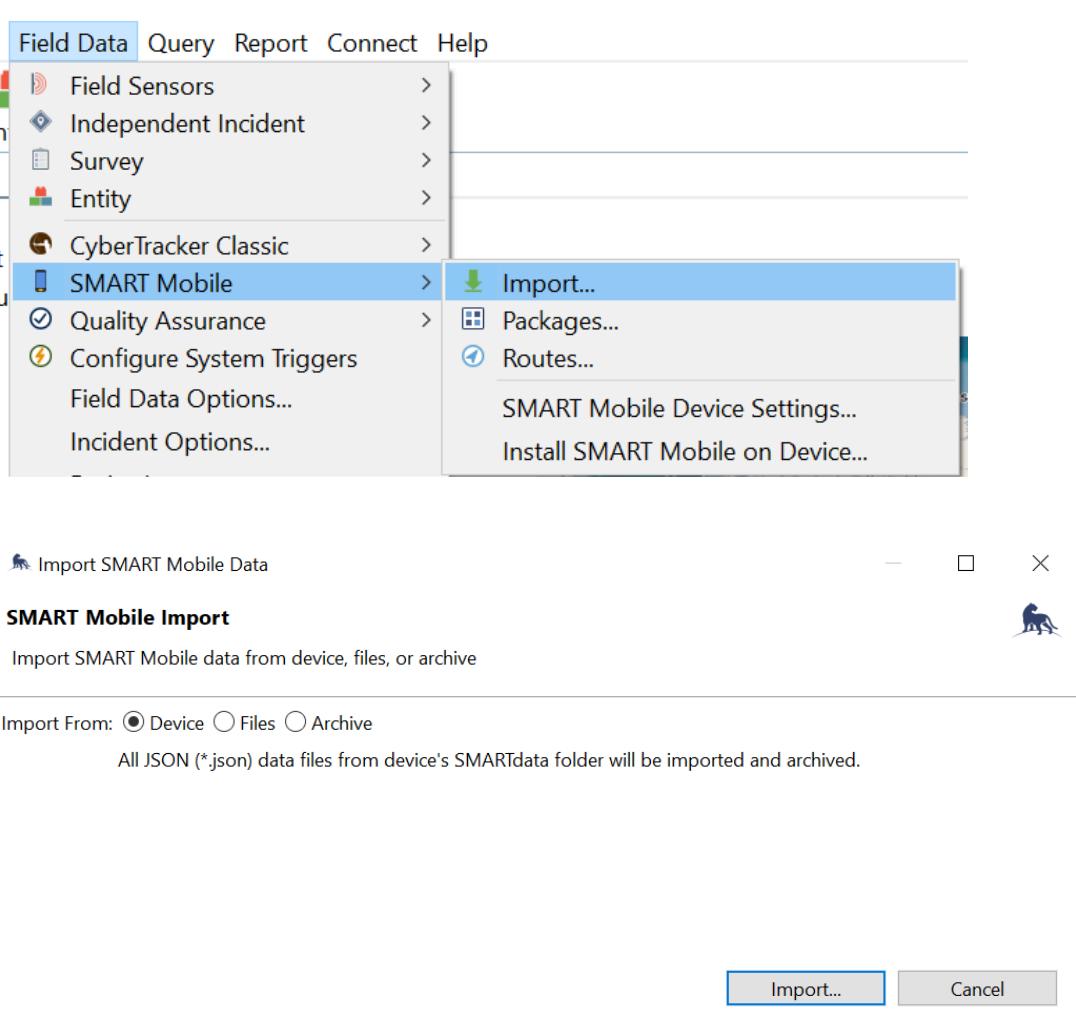
Imports the data collected using SMART Mobile. It can be through the following: Device - through the data cable Files - shared as a JSON file (i e data from e-mail, Messenger, and Bluetooth transfer) Archive - existing records
Exports and manages the SMART Mobile packages. Adjust the settings and preferences on the data model to be used on SMART Mobile
Skip any prompts about SMART Connect
Routes
SMART Mobile Device Settings
Install SMART Mobile on Device
Creates, exports, and manages routes on SMART Mobile These routes can be viewed on the user ’ s SMART Mobile while on the field.
Manages the list of available SMART Mobile device settings
Install the SMART Mobile application on mobile devices using APK This is recommended if the device is unable to download the application from Google Playstore.
Cluster 6: Query
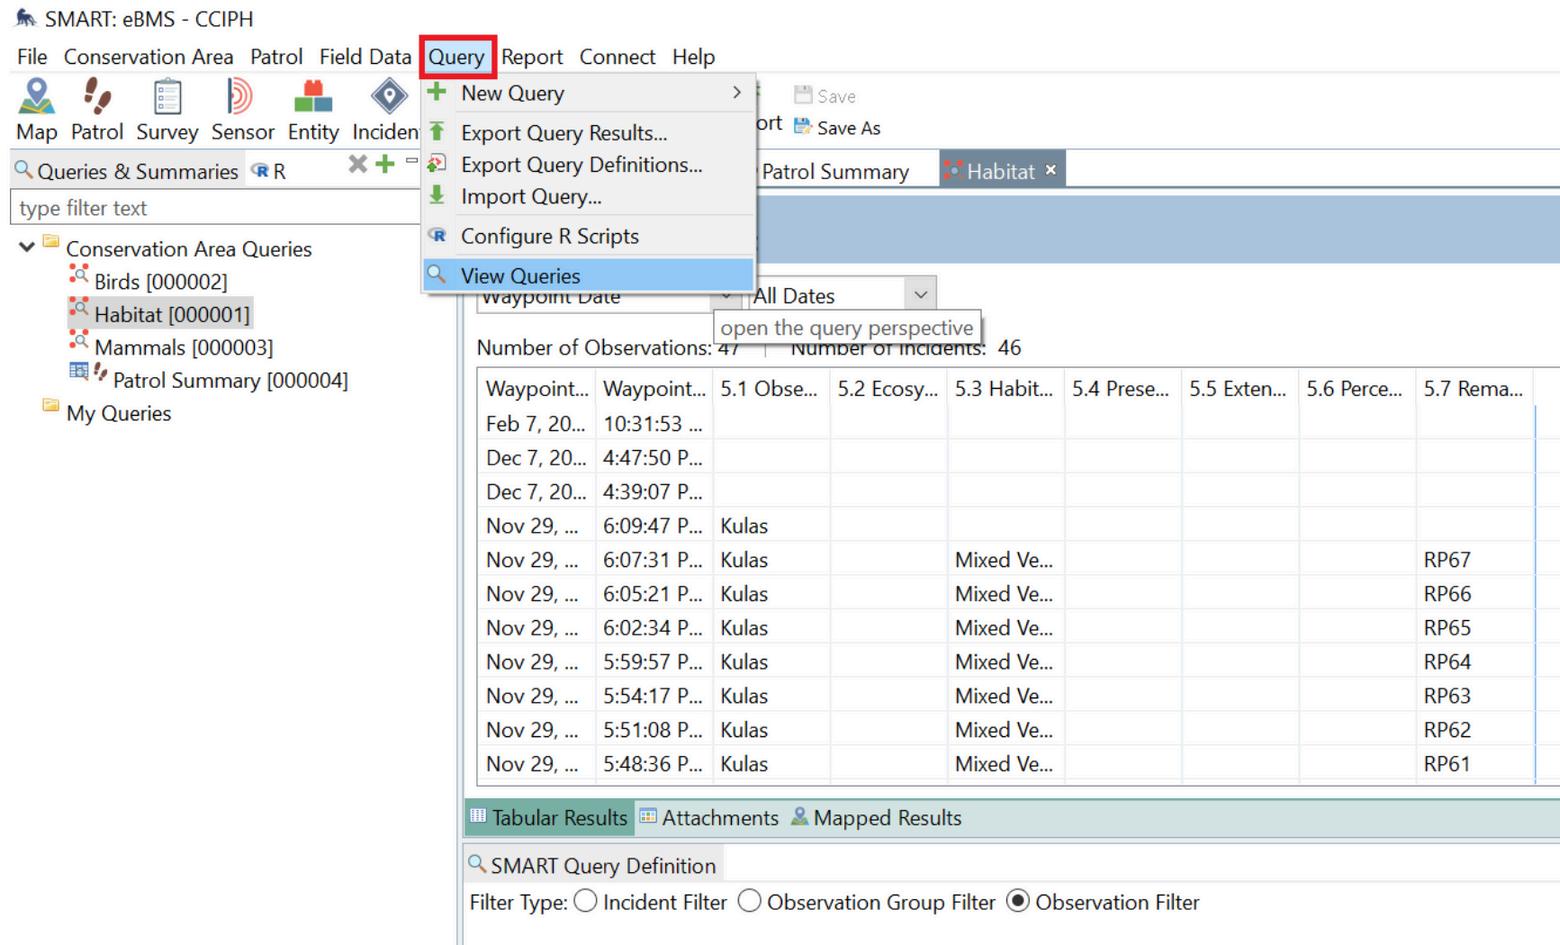
To view the overall and historical data, go to the Query tab in the menu bar In this part, users can create and customize their queries based on their specific data. Users can also easily access the Query option from the toolbar.
Continue: Cluster 6 →
Cluster 6: Query
How to make a query
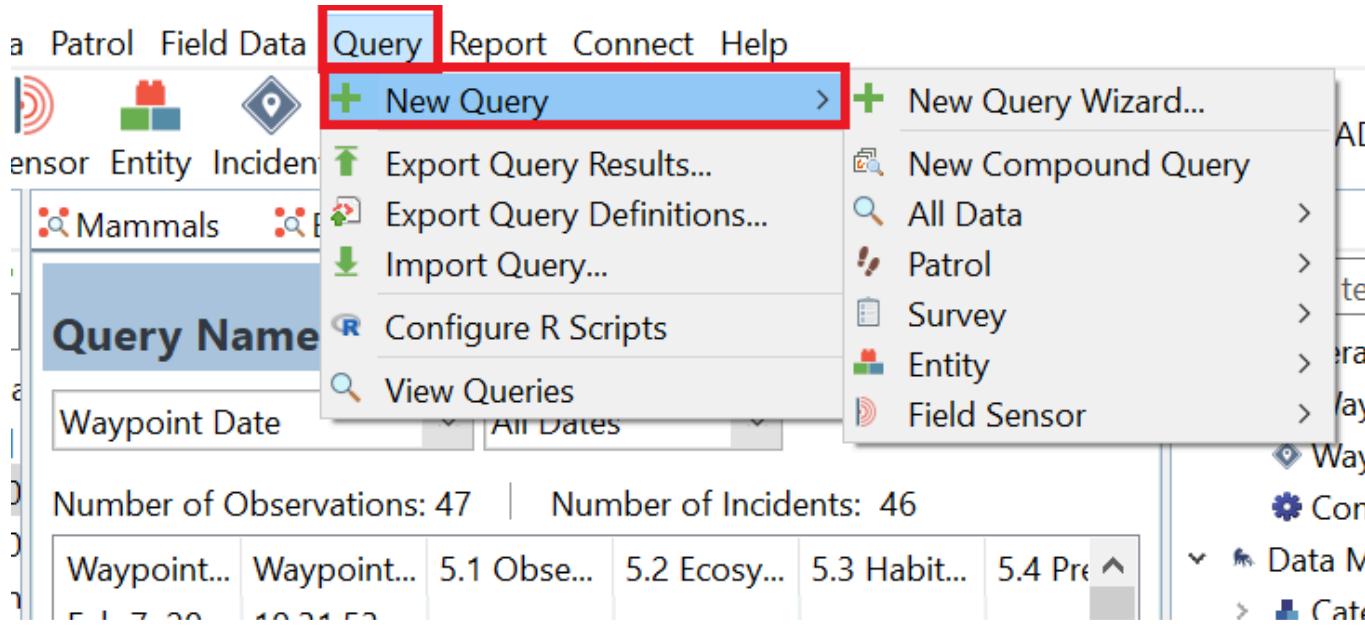
On the Query menu, click New Query to open the new query options Select the type of query Users can see the description of the queries when hovering and clicking on a specific query type
2. After selecting the type of query, it will redirect users to the main query window. Select the date to query and rename it.
How to make a query
3 To display the attributes needed, go to Query Properties, uncheck the Only Show Columns with Data, and check only the attributes to display
4. On the left side panel (Query Filter), users can select a specific category to display by doubleclicking or dragging the category under SMART Query Definitions
5 Click Run Query found at the left corner of the window to create the query
How to make a query
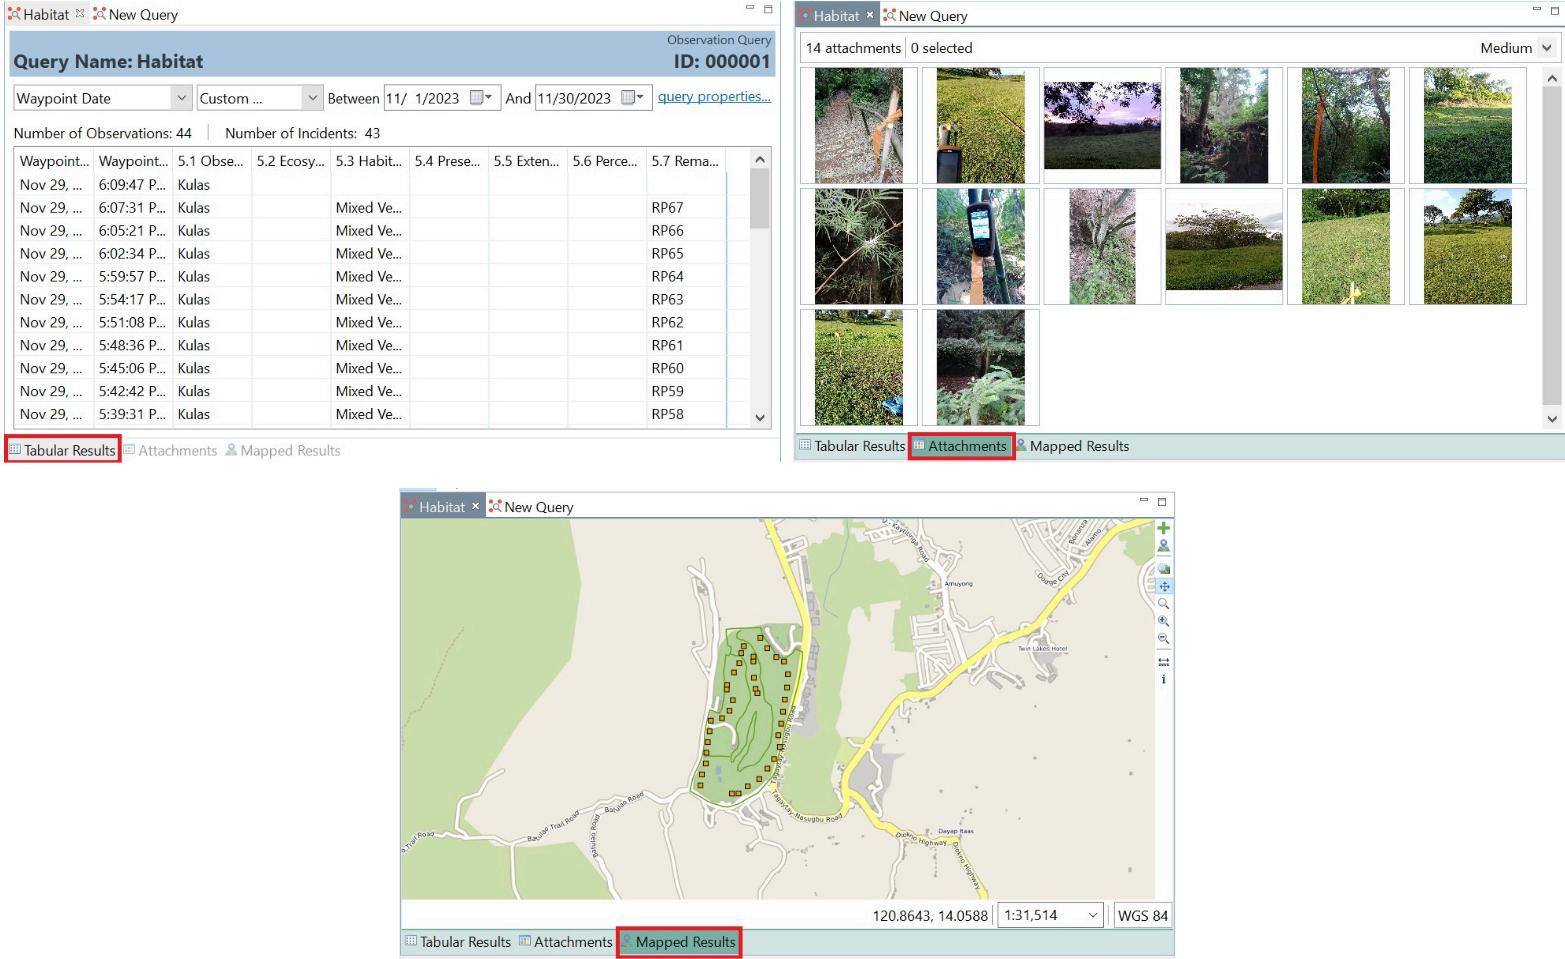
6 Users can see query results as either a table, attachments, or map To switch between the three query results, click on the tab button shown
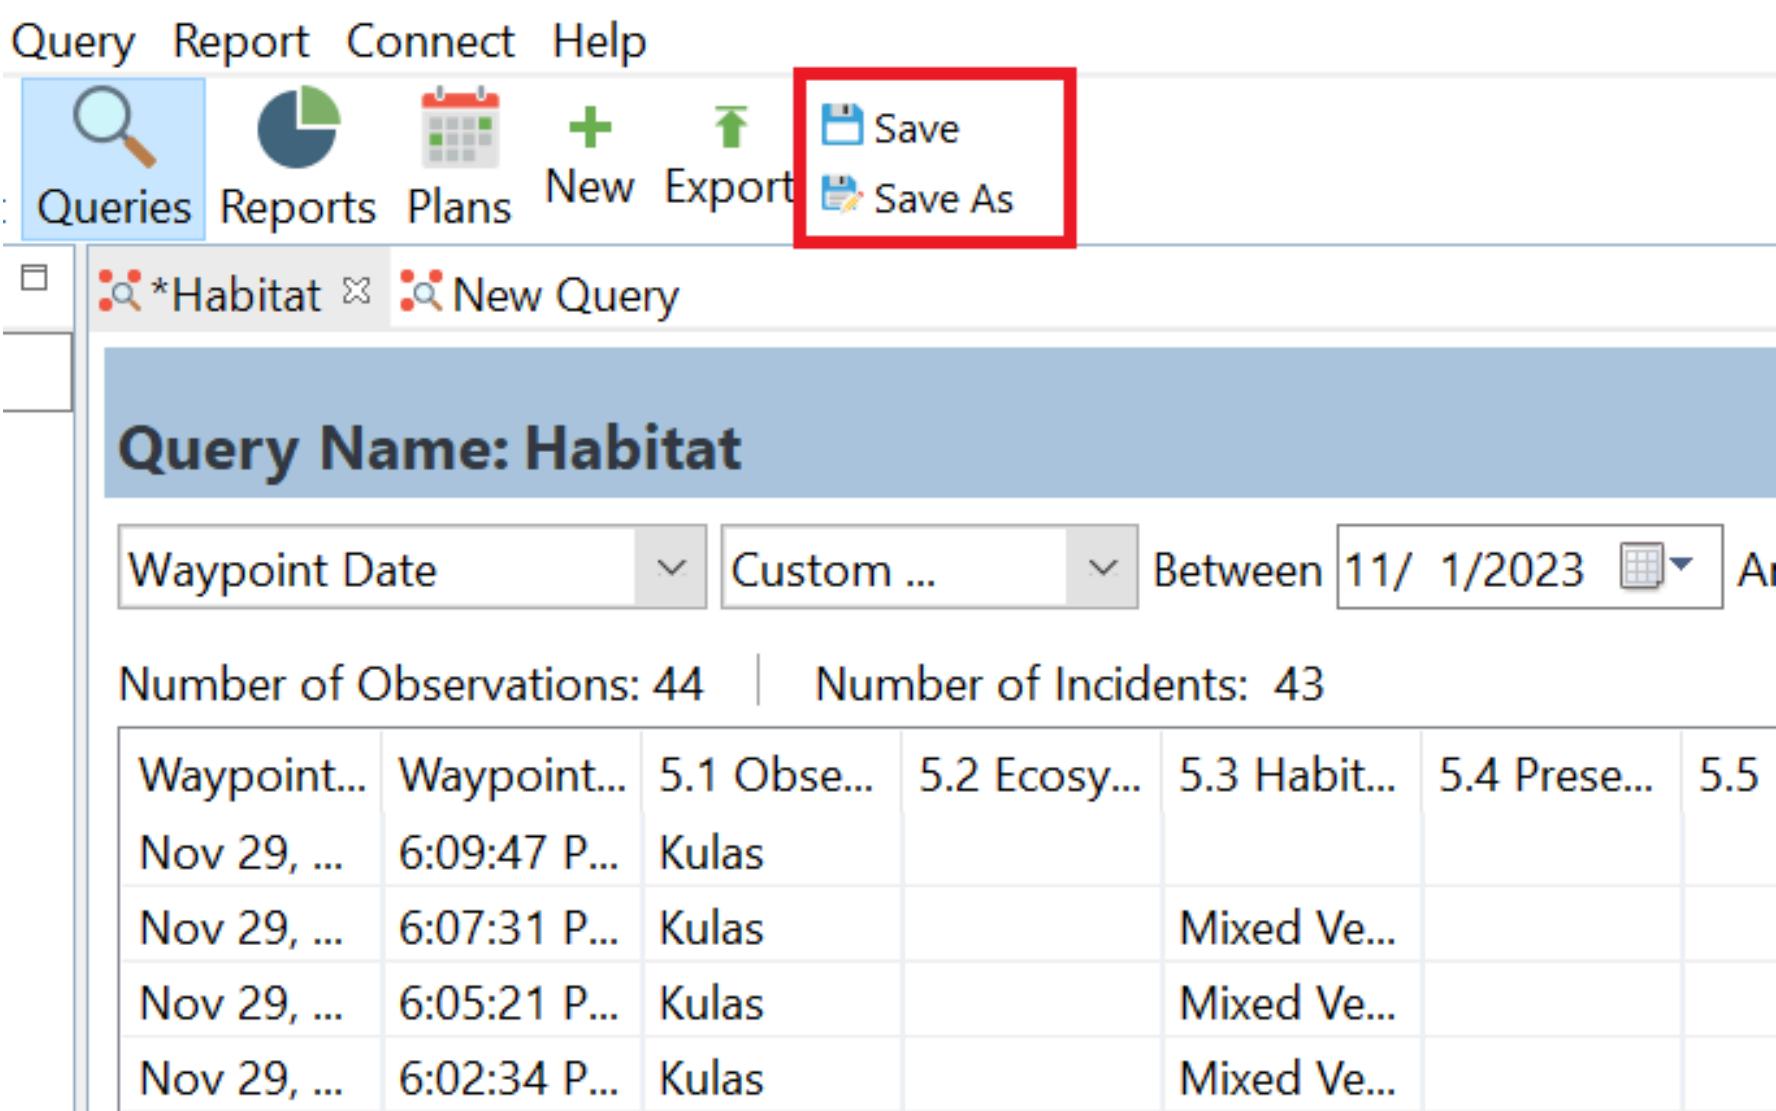
7 Save the query by clicking on the Save icon
Continue: Import a query
Import a query
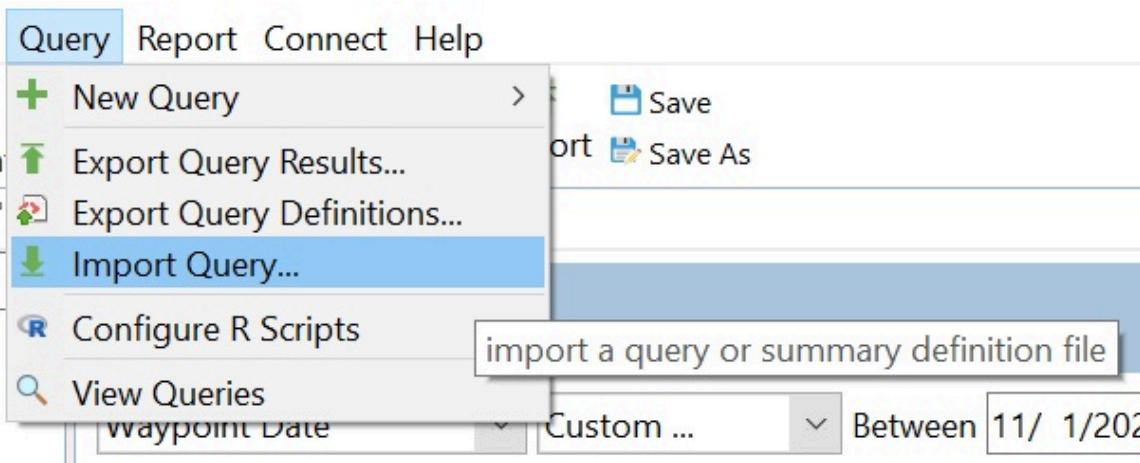
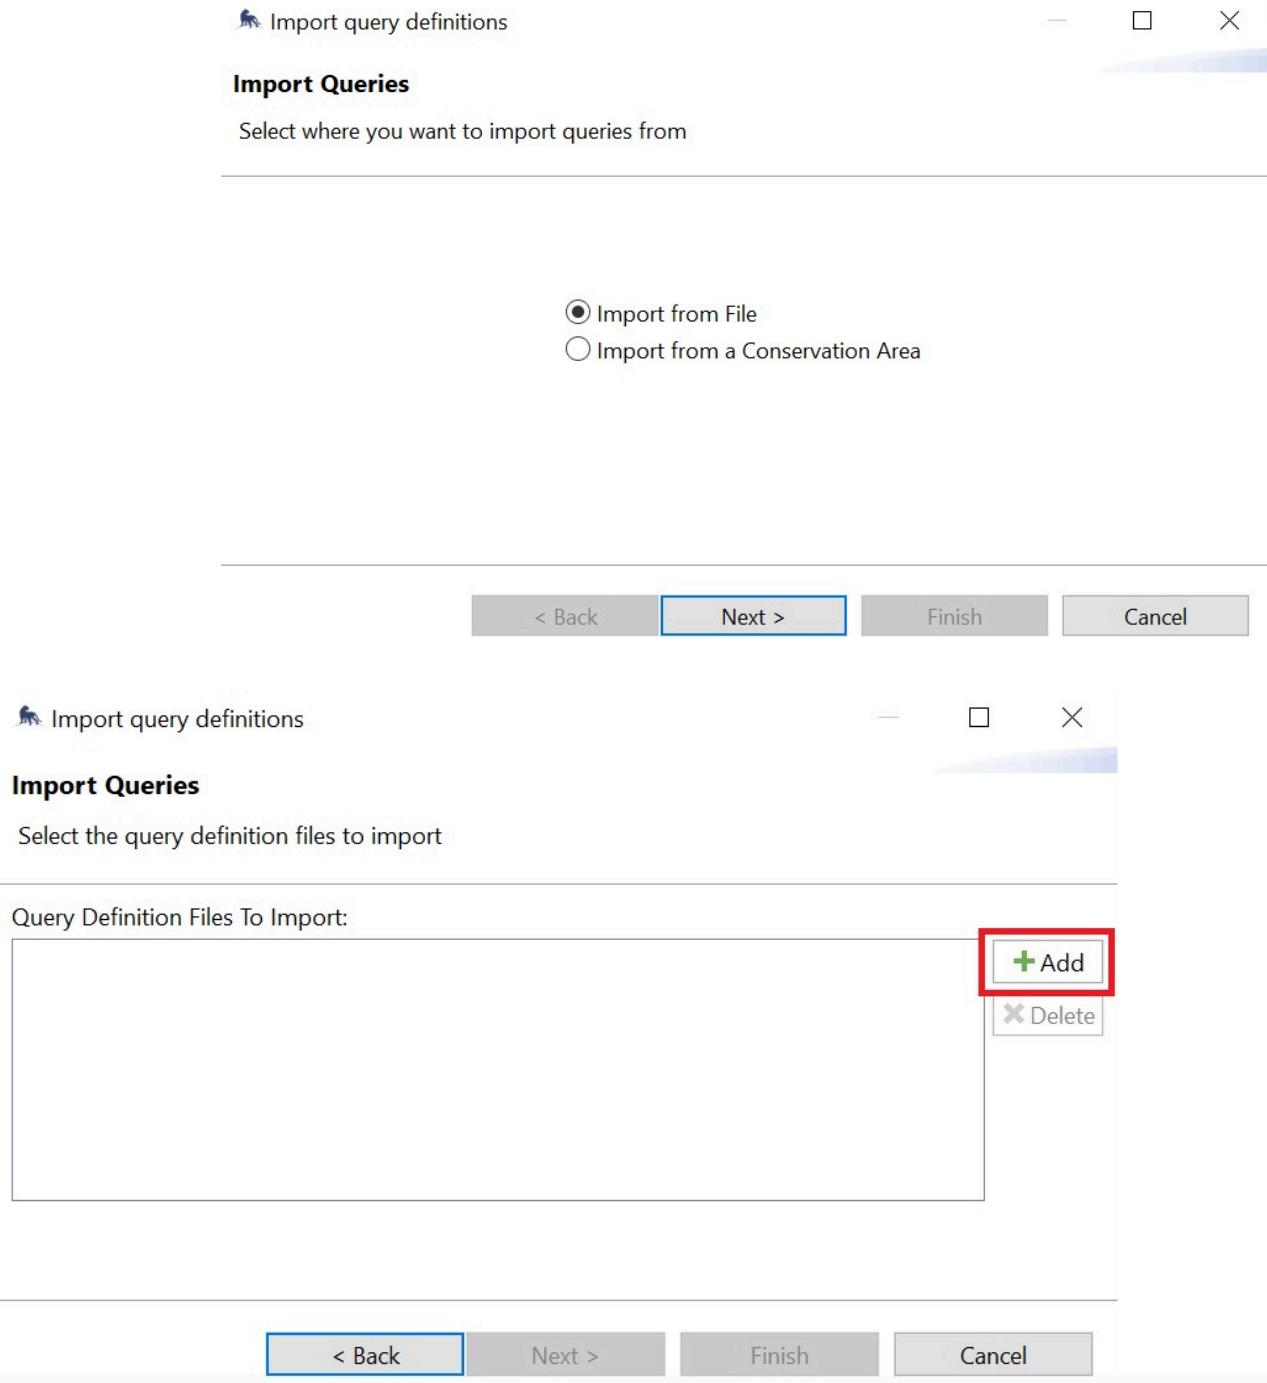
Go to query and click Import Query. Select import from file. Click Add and select the downloaded query. File types accepted are XML and ZIP files.
Export a query
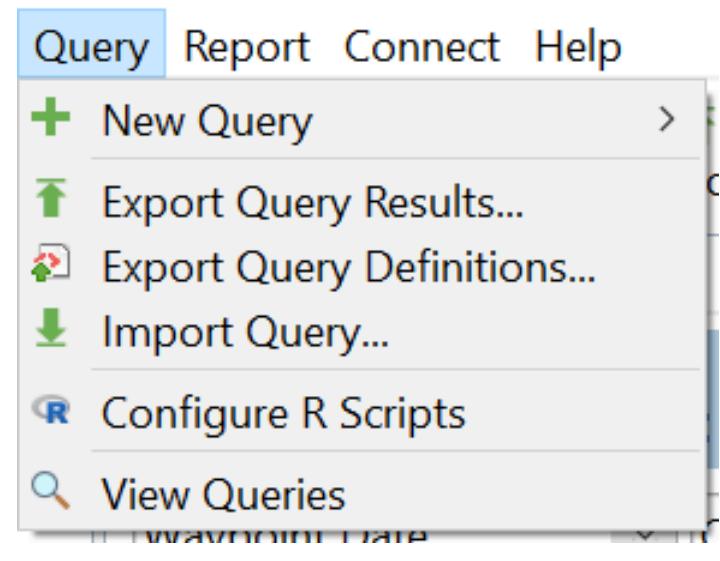
Go to query and click Export Query Definitions to export the query template. To export the query results or data collected, select Export Query Results.
2. On Query Definitions, select the report to export. Users can select as many as they want. Click the + Add button if the reports are not presented. Click Next to choose the destination folder then Finish.
3. On Query Results, select the format to export. Click Next to choose the destination folder then Finish
Cluster 7: Reports
To use the query into reports, go to the Reports tab in the menu bar. In this part, users can customize the report deemed be to exported from SMART Desktop using the data gathered from SMART Mobile Continue: Creating a
Creating a report
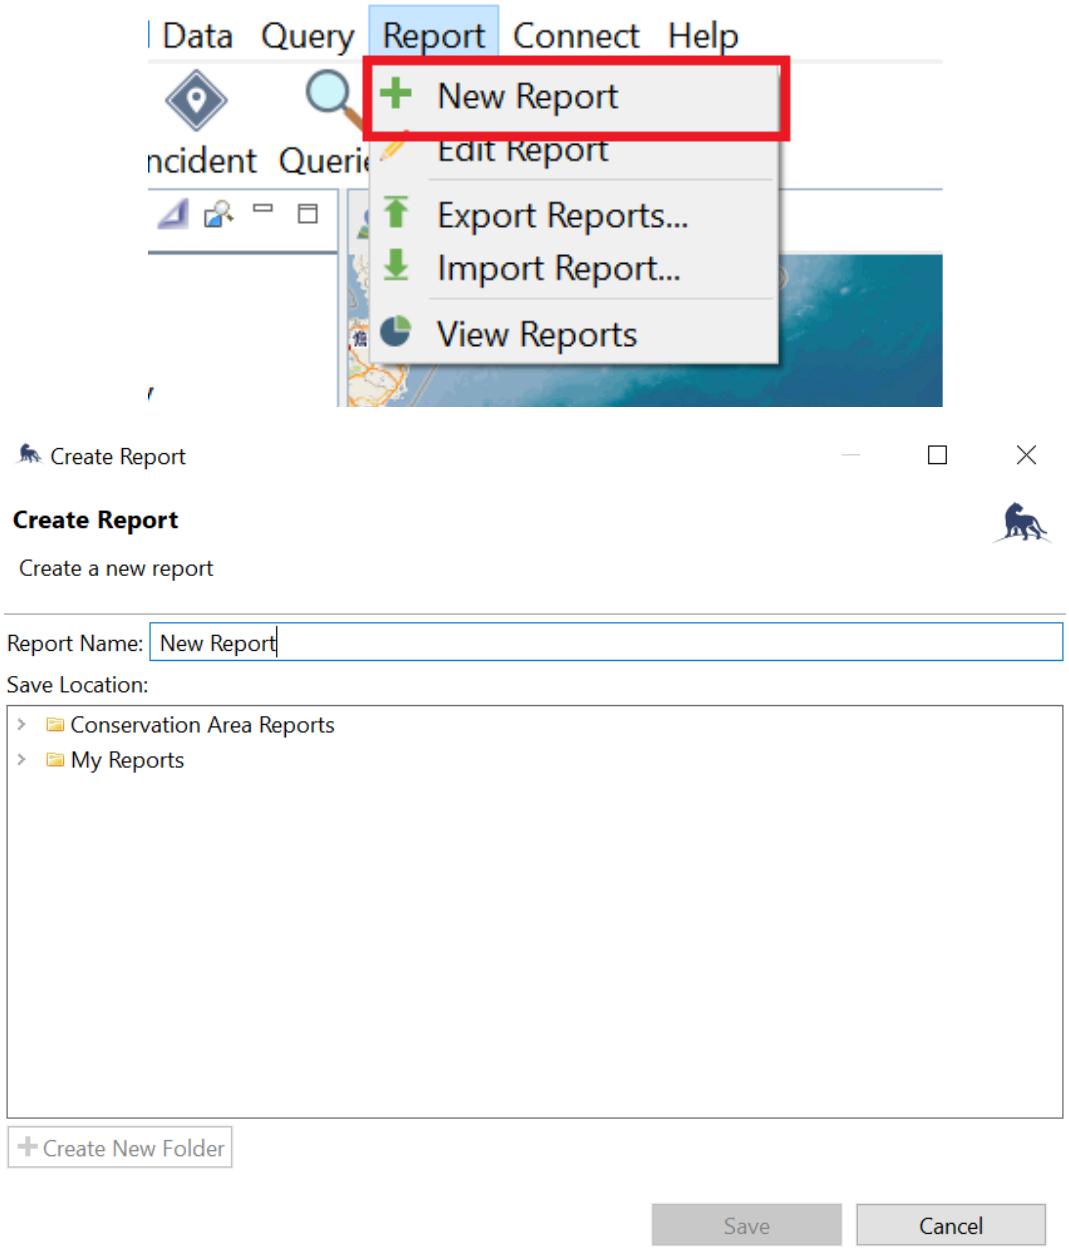
Hover to the Report tab and click New Report. A create window will appear, give the report a title then save it in the Conservation Area Reports folder. Then click Save.
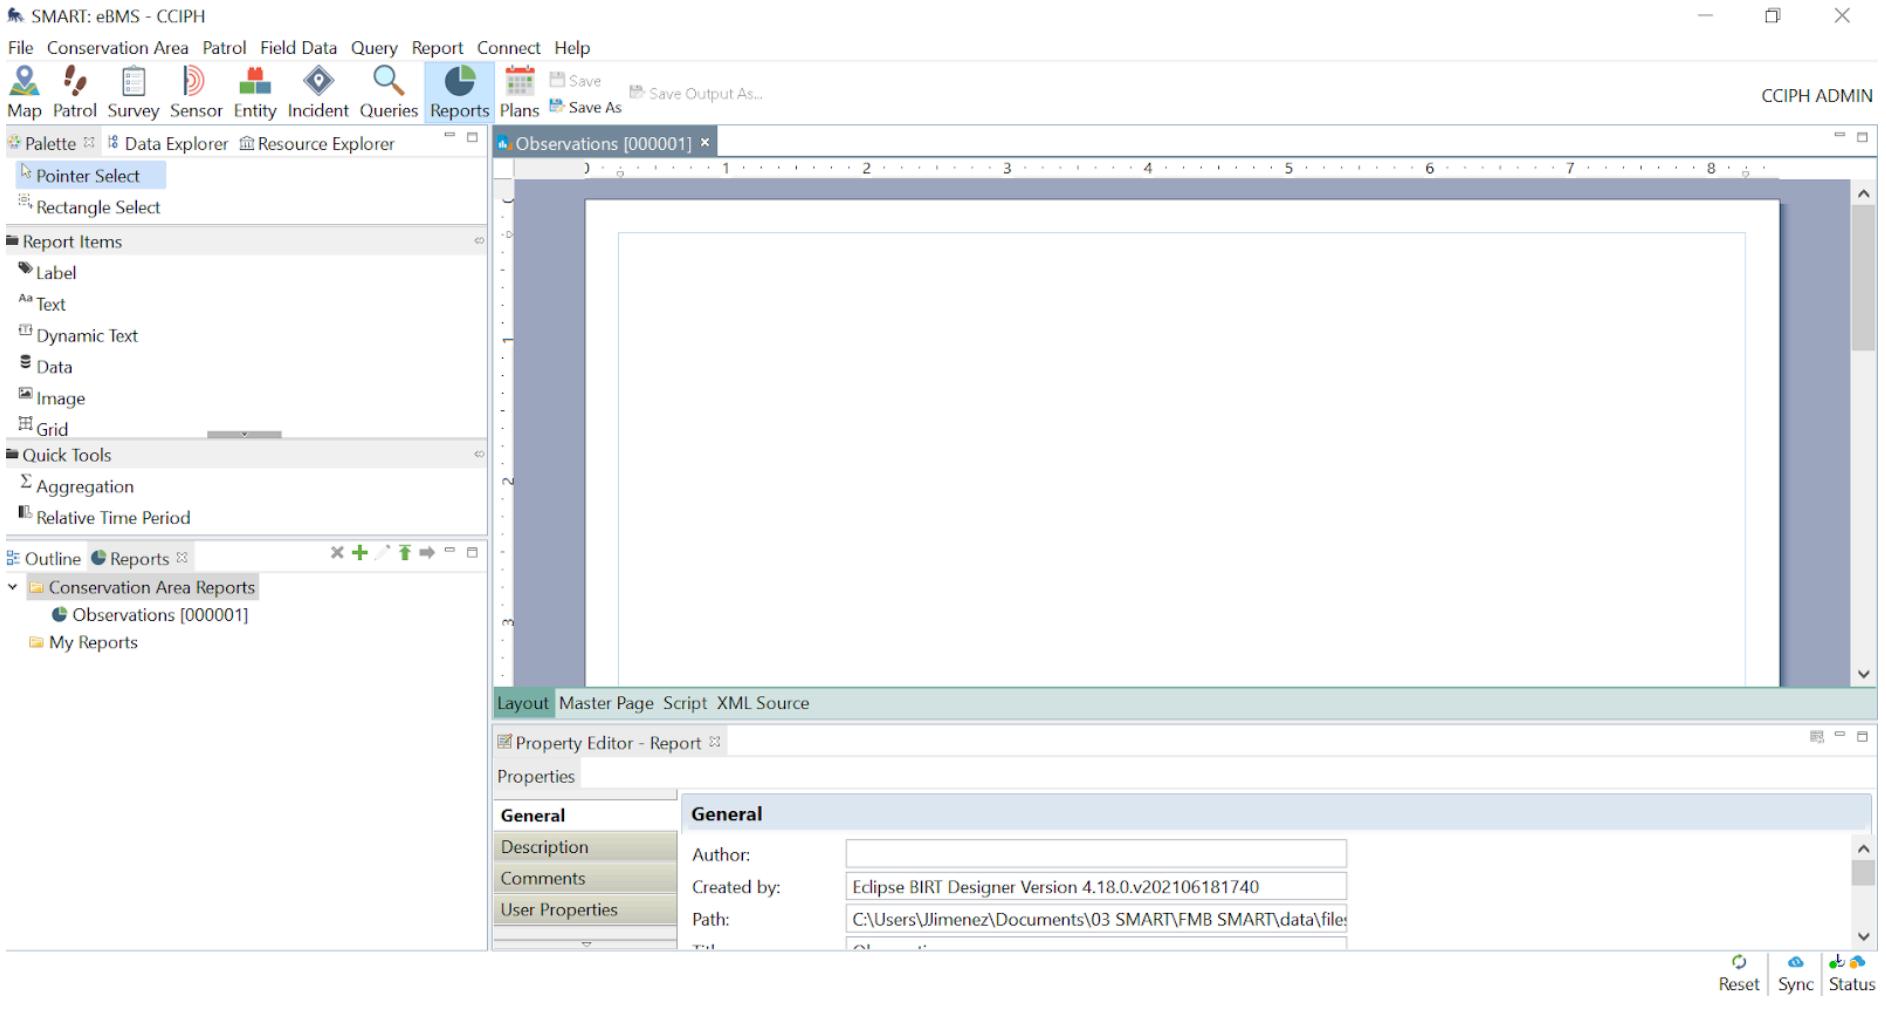
2. It will redirect the users to the report window. Reports can be customizable based on the monitoring guidelines.
Continue
Creating a report
3. The first thing to do is to add the report’s query to the data set. Click the Outline tab in the lower left corner and right-click on Data Set then select New Data Set.
4. On the New Data Set window, select SMART Queries on the Data Set Type then click Next. Select the included queries for this report then click Finish.
Creating a report
5. Click OK on the Output Columns. Repeat this step to add queries as many as needed.
6. To insert different report items, go to the Report Items tab in the left part of the report window, click the necessary items to be inserted, and drag it to the report tab on the right side of the report window. Commonly used items are tabulated below.
Report Item
Label
Text
Dynamic Text
Data
Image
Table
Chart
SMART Map
Function
Inserting text or spaces in a row format Commonly used for titles and spaces
Inserting a plain text
Inserting a text based on the date on the query Uses code to be copied on the expression builder Example: Code for dateparams["Start Date"] value + " to " + params["End Date"] value
Inserting a data set column
Inserting an image This could be URI, Image file in shared resources, Embeded or dynamic image
Inserting column presentations of data sets
Inserting a chart Chart type includes bar, line, area, pie, gantt, etc
Inserting a base map that can include waypoints o tracks
Creating a report
7. To edit the inserted reported items, go to the Property Editor - Label then Properties in the lower part of the report window. Fonts, color, size, styles, alignment, borders, and other settings can be modified here
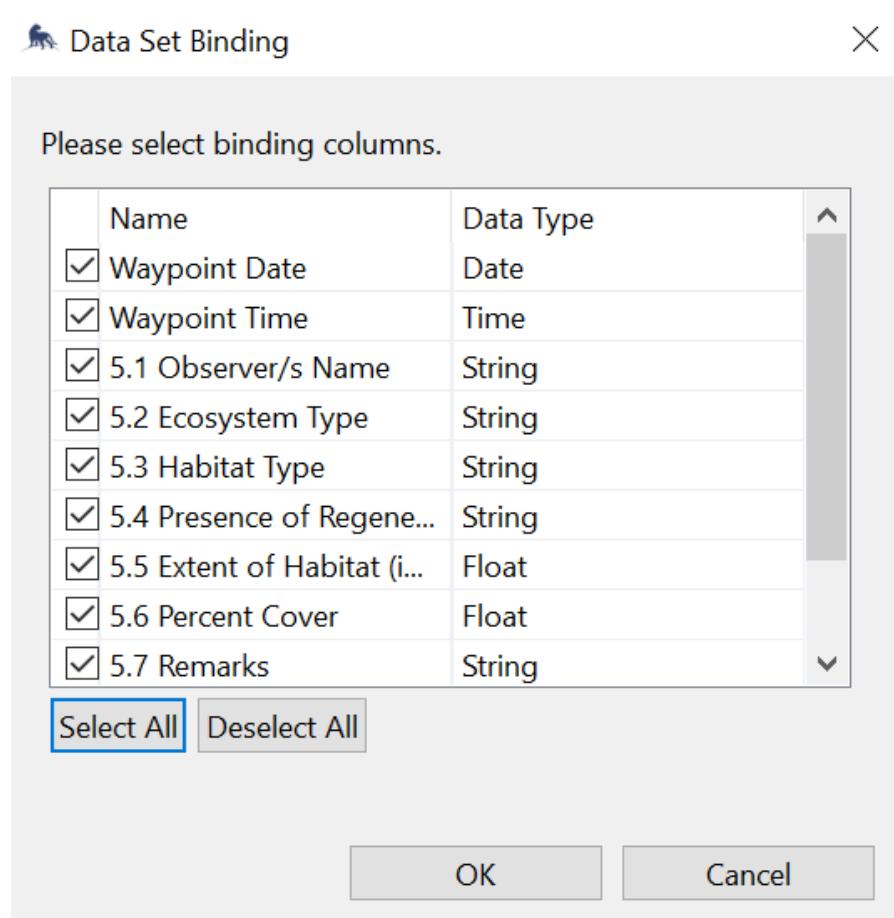
8 To insert the data set into the report, drag the selected query from the lower left corner of the report and Select All Users can edit the column categories by double-clicking the column to be replaced The format of the texts can be edited by following Step 7
9 To insert photos from the collected data, go to Data Sets (Step 3), right click and select New Data Set, and under Data Set Type make sure the SMART Query Attachment is selected Finish by selecting the Attachments-Query and the name of the category to be inserted
Creating a report
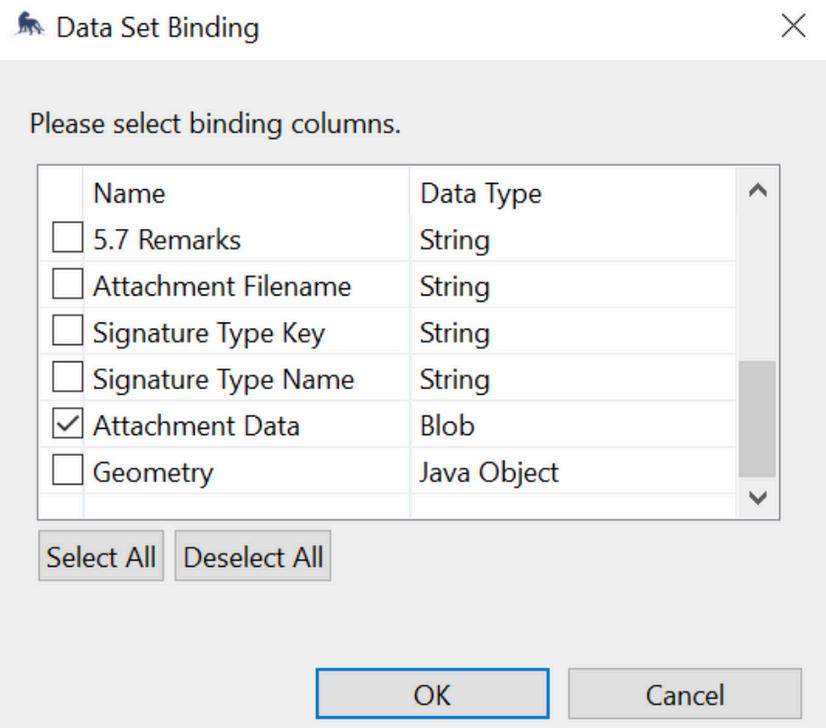
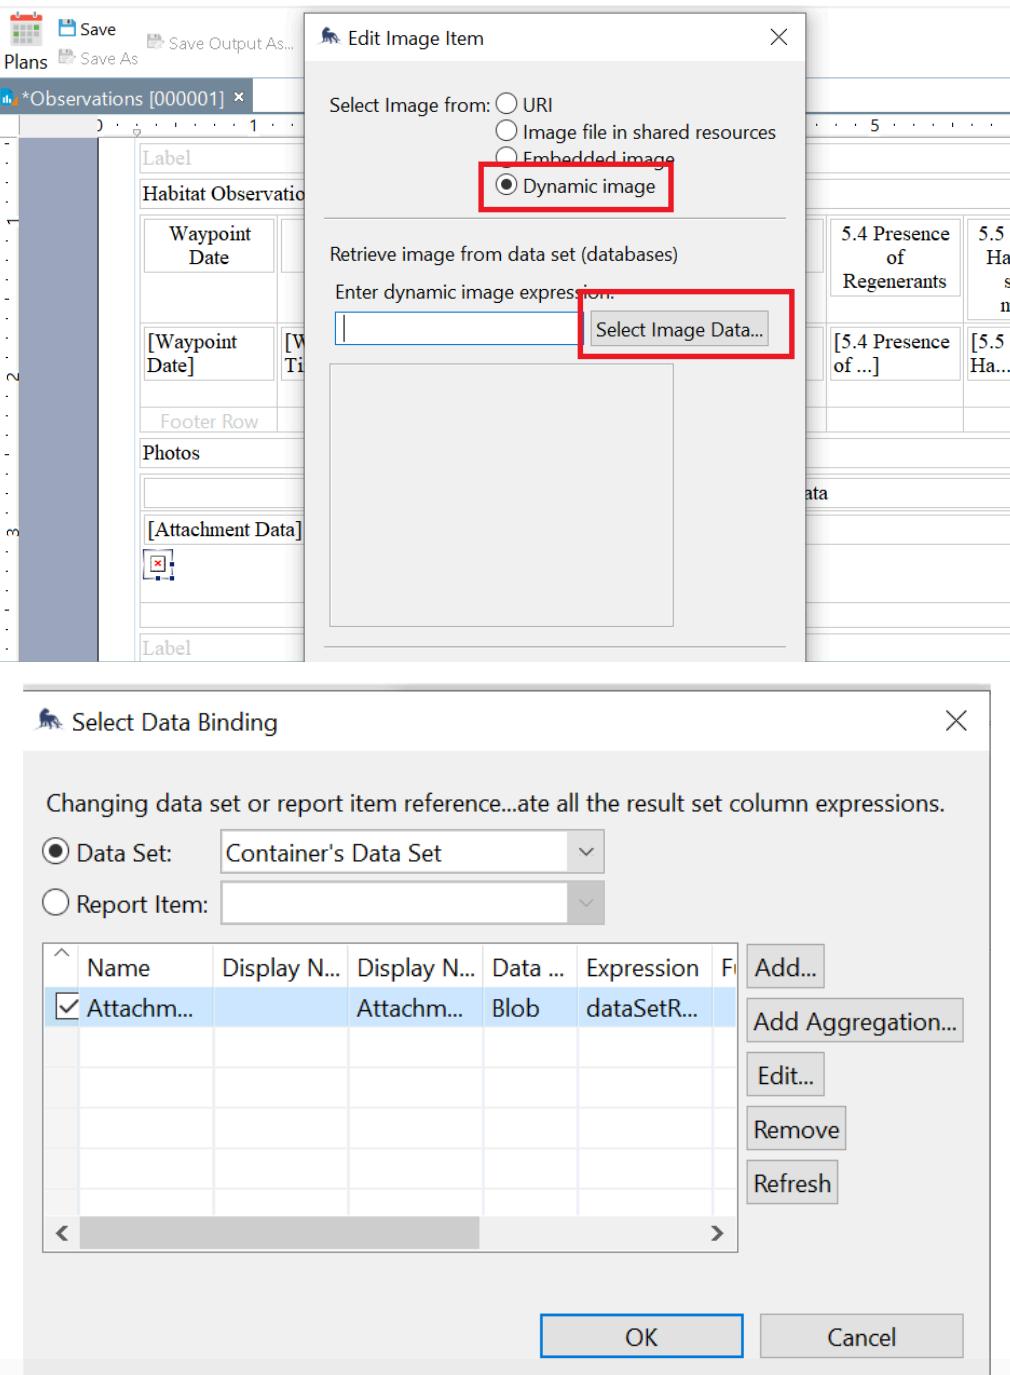
9.1. Drag the Attachments-Query to the report and from the Data Set Binding, select only the Attachment Data. Add a space on the [Attachment Data] cell by adjusting/dragging the lower line of the selected cell On the same cell, drag Image from the Report Items Select Dynamic Image and make sure that the Data Set is set to Container’s Data Set Put a check on the Attachment Data only Click Okay and Insert
10. To add maps, go to Report Items, select and drag the SMART Map to the report window. On the Property Editor-SMART Map, configure the following settings: Basemap - select the base map to be displayed
Map Bounds - select the extent of the base map to be displayed
Map Layers - add the layers to be displayed on the map. This may include the waypoints and tracks on which observations were collected.
Creating a report
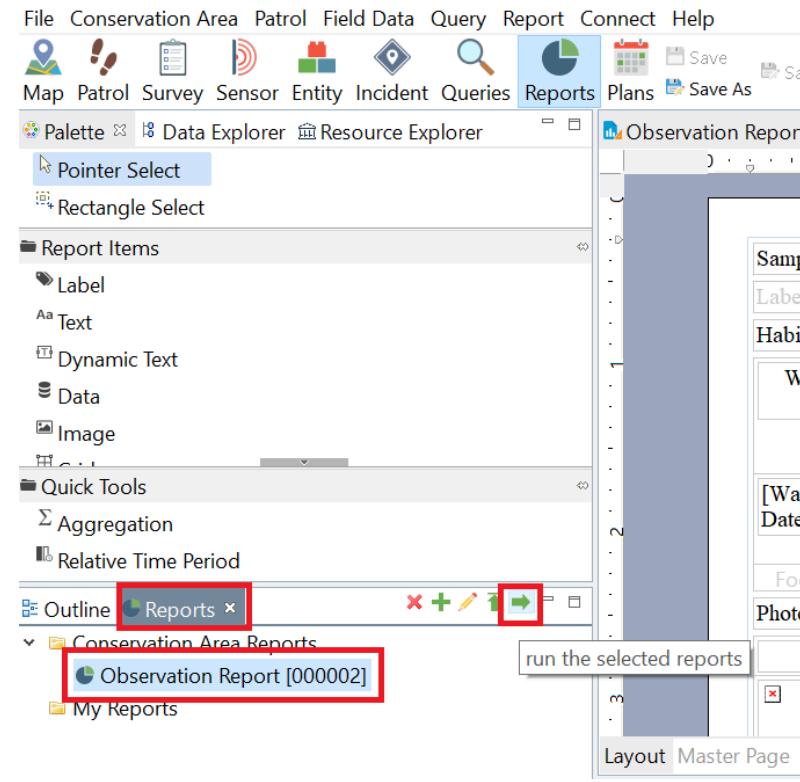
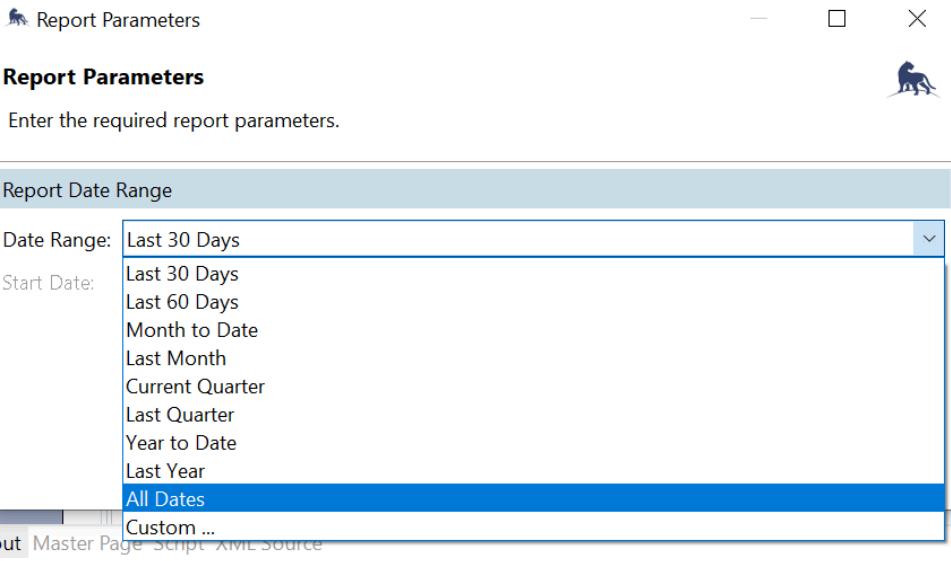
11. To view the report, go to the Reports Tab. Select the current report. Click the Run Report icon and select the dates to view then click Continue.
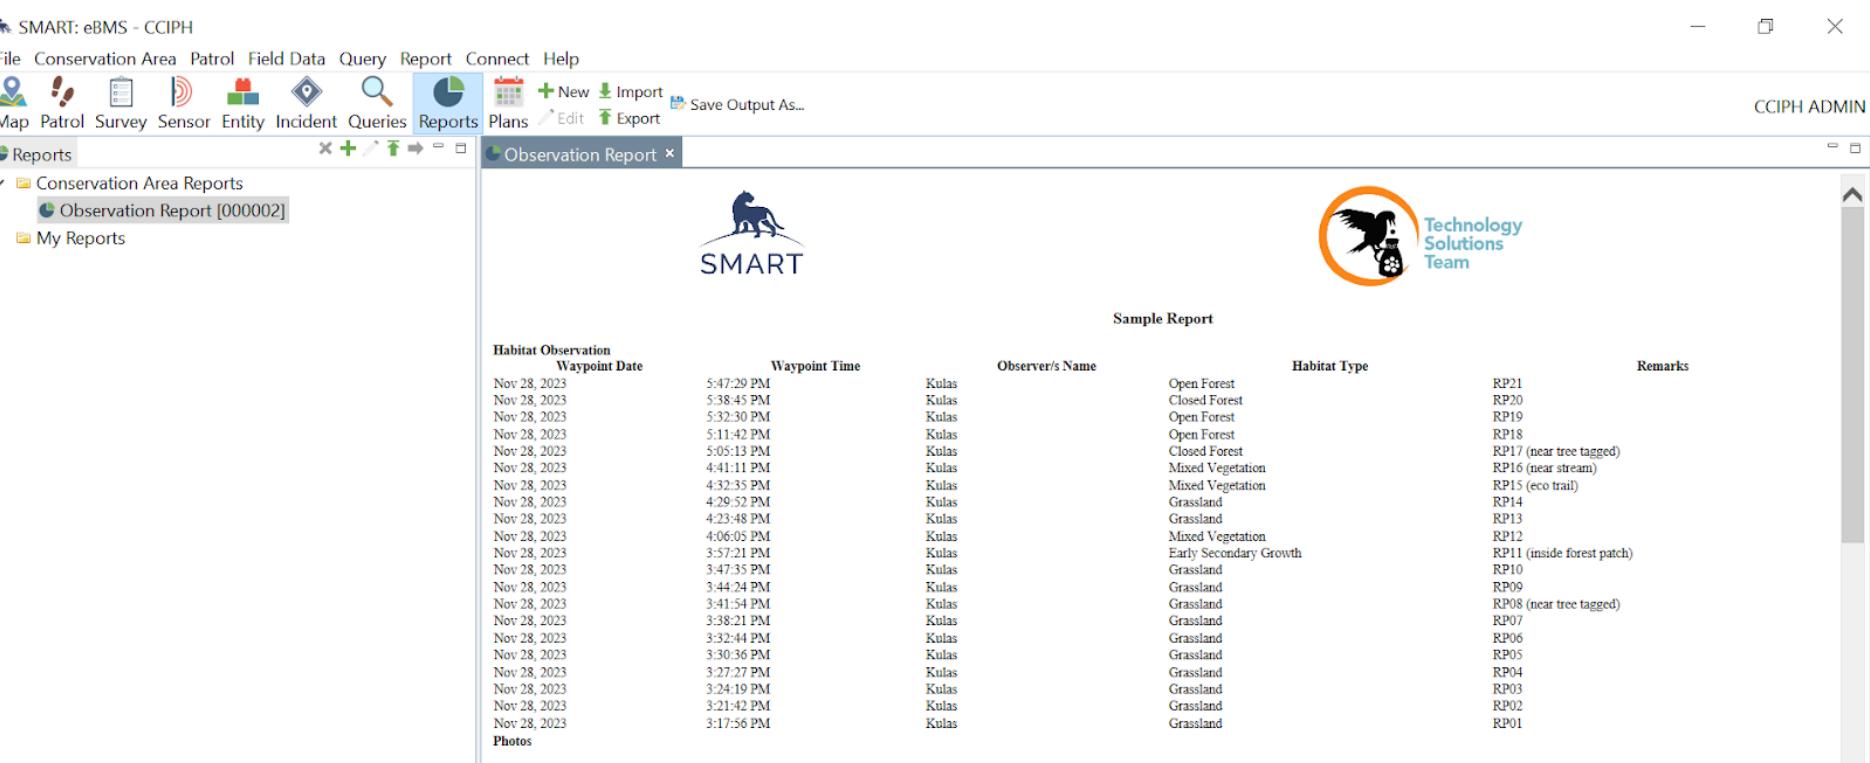
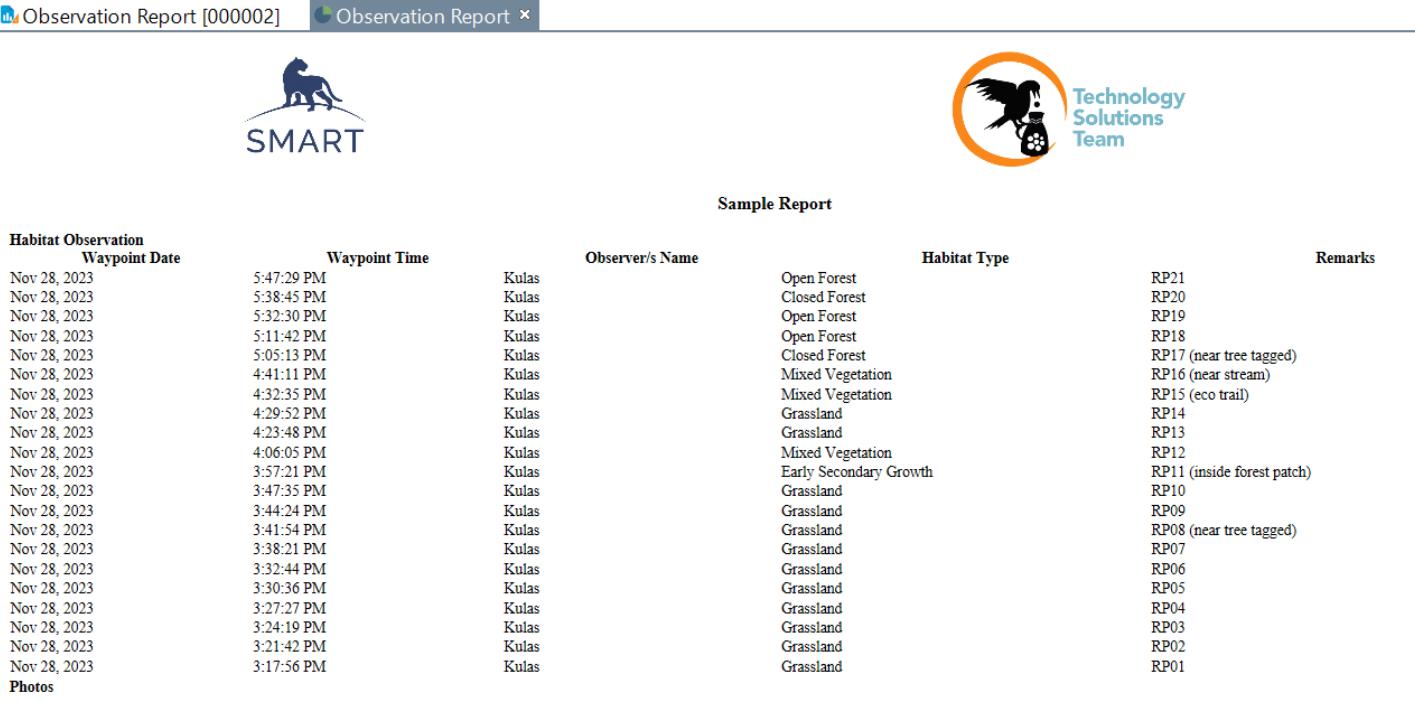
12. After the run, the report will be displayed on the next tab.
13. To edit the report, right-click the selected report.
Creating a report
13. To export the report, click the Run and Export icon. Select the type of format (i.e. .doc, .html, .pdf, .ppt, .zip).
Data Model
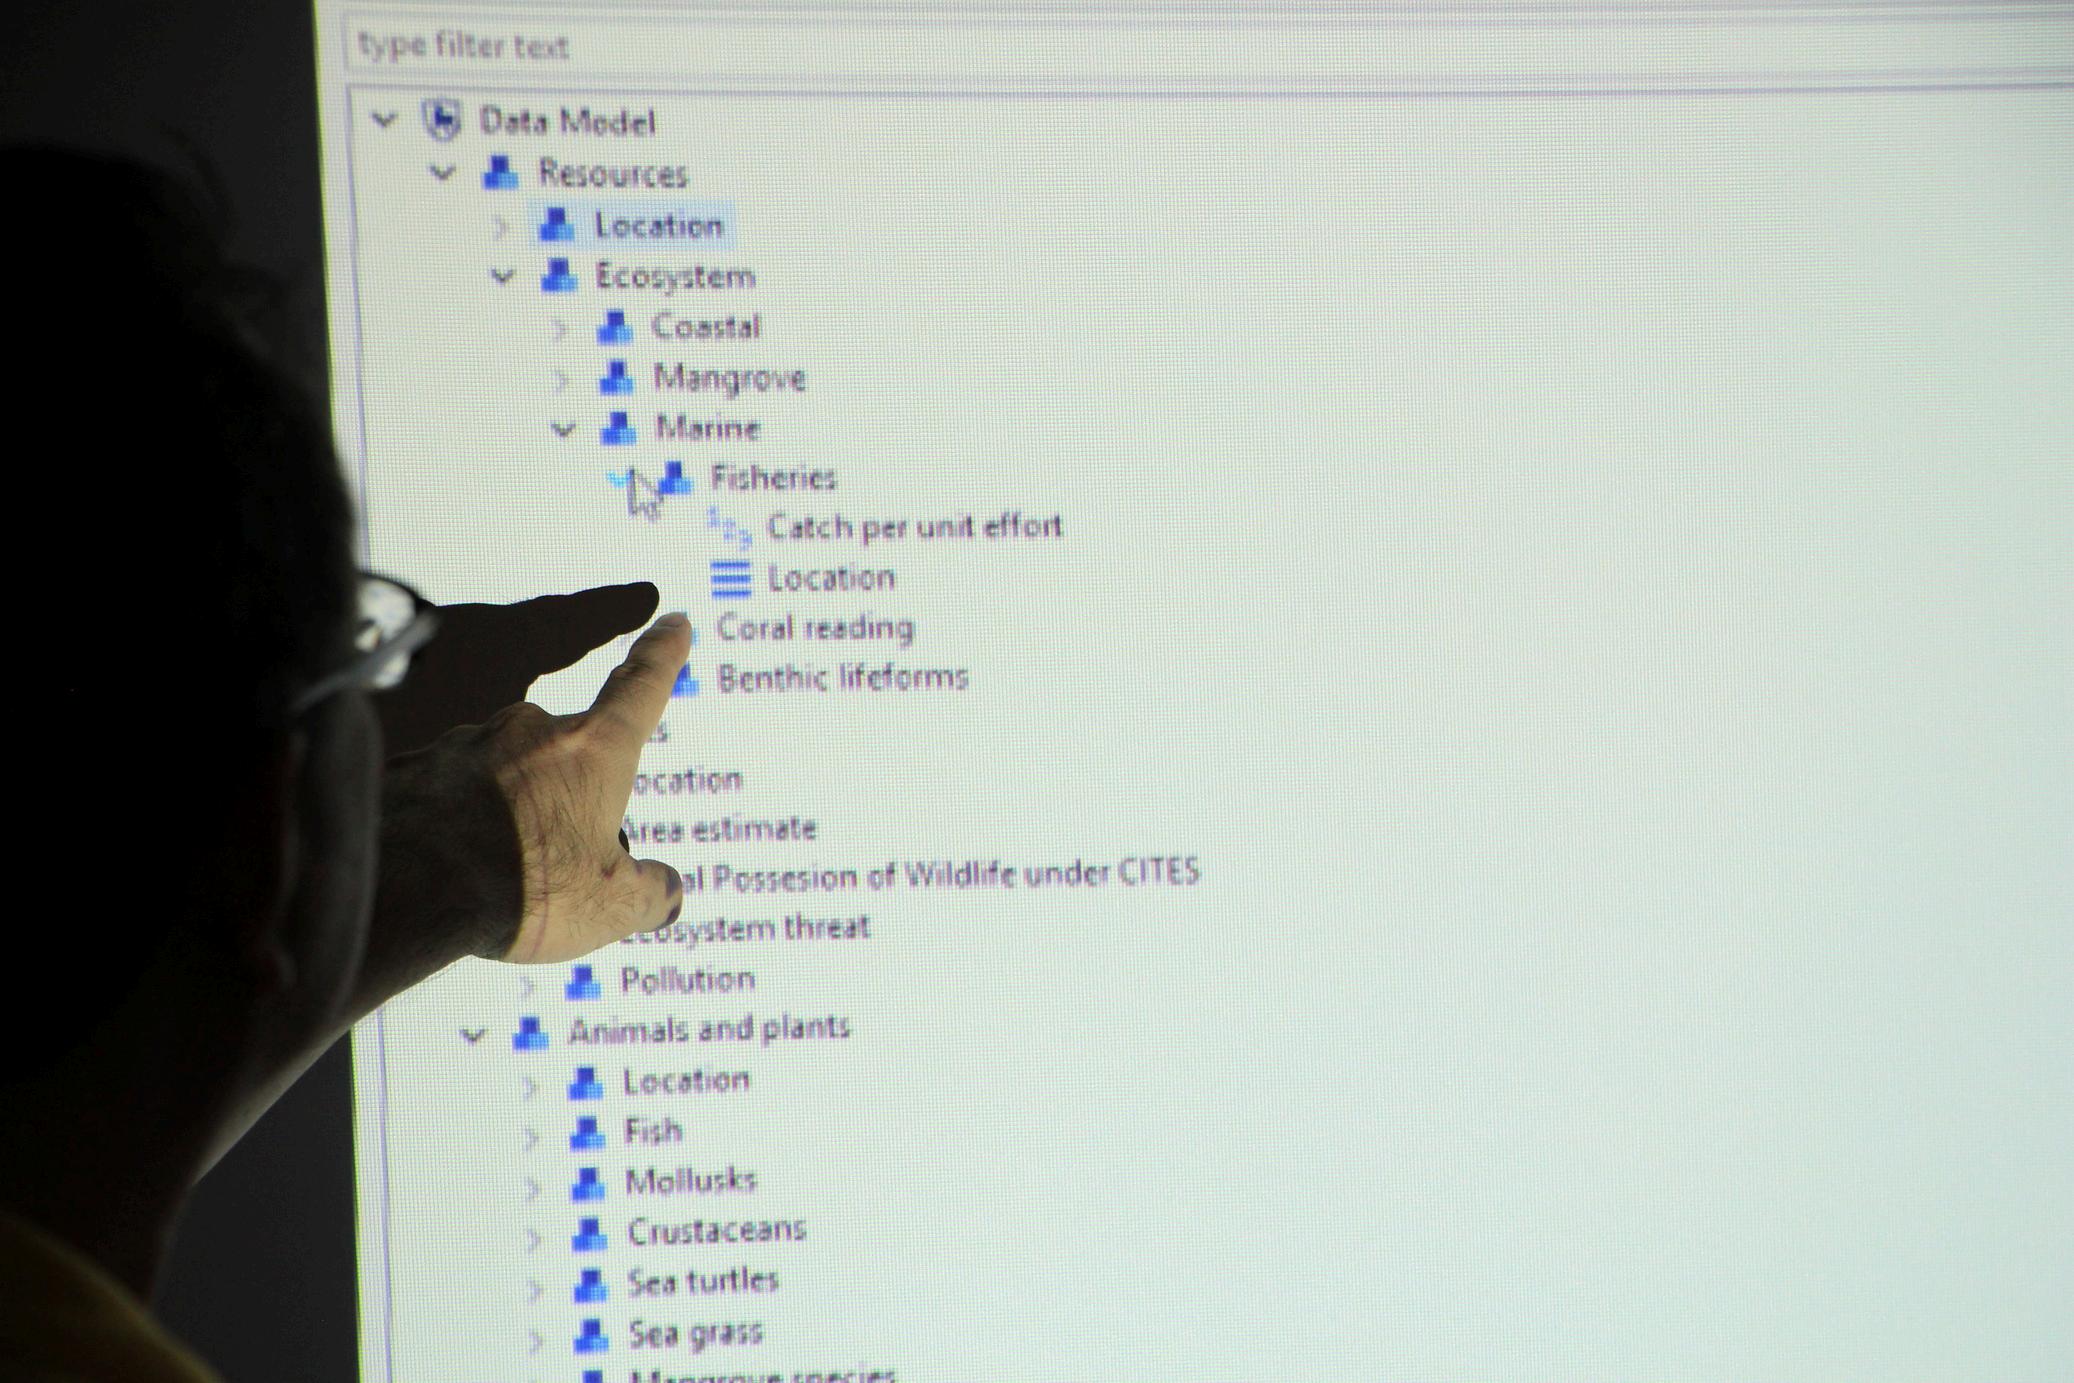
The data model is the structure of a whole information system or parts of it to communicate connections between data points and structures² In this manual, the established data model is designed and integrated into SMART to be used for illustrating the types of data used, the relationships among these data types, the ways the data can be grouped and organized, and its formats and attributes for an effective data collection and visualization later on


The data model is the core of SMART It is structured for collecting data at the site, including all categories, sub-categories, attributes, and values In converting a paper-based datasheet into an electronic data sheet through SMART, everything needed must be encoded in the data model Data models are created to meet the needs of an organization Standards and other requirements are defined beforehand through feedback from stakeholders or through existing data sheets so they can be incorporated into the design of a new system, in this case, SMART The data model links the SMART Desktop and SMART Mobile It enables SMART Mobile to collect the necessary data to be visualized in SMART Desktop. The data model can only be customized in the SMART Desktop.
In SMART’s data model configuration, the data manager can include different types of attribute points These data vary from text, numbers, lists, booleans, and dates The table below shows the different attribute types used in the data model
Data Model
Table 1. Different attribute types in the data model.
Type
Numeric
Text
Definition
This type accepts positive or negative number values up to fifteen significant digits
This type accepts all character inputs (letters, numbers, and symbols within the language selection) It has a maximum limit of 1024 characters
List
This type accepts a single selection from a list of values, which have been set in the data model
Multi list
Tree
Boolean
Date
This type accepts single or multiple selections from a list of values, which have been set in the data model
This type accepts data structure where data objects are generally organized in hierarchical relationships
This type accepts a Boolean value, ‘Yes’ or ‘No’ This can be turned on or off using a checkbox to choose one of the two options
This type accepts a date value in the format YYYY-MM-DD The value can be input manually or selected from a calendar picker by the user
Crafting the Data Matrix
Example
Elevation (m): 5 Transect Length (km): 5
Species Name: Wild Chicken Observer: Arel Ramos
Forest Formation: Mangrove Forest Beach Forest Peat Swamp Forest
Type of Observation: Seen Heard Seen and Heard
Gender: Female Male Unknown
Indicator Species: Birds > Philippine Eagle
Presence of Regenerants: Yes
Date of Collection: 2023-02-20
Before converting the paper-based datasheet to an electronic data model, a data matrix must be created first to smoothen the process and prevent inaccuracies while transferring data to SMART.
Creating the Data Matrix
Detailed Steps
Prepare the paper-based data sheet and open a blank Excel or Google sheet file. 1. In the Excel or Google sheet, list the different categories in the data sheet in a row. 2. Point out the different attributes or individual data points under each category and list them under their specific categories in the Excel or Google sheet. 3.
Examine each data point and look for data points that can be automatically generated by SMART so the data collected wouldn’t be redundant 4. If a data point from one category overlaps with a data point in another category, highlight it as SMART’s data model can use an existing attribute for another category This prevents redundancy in data visualization and reporting 5.
How to add categories and attributes in the data model
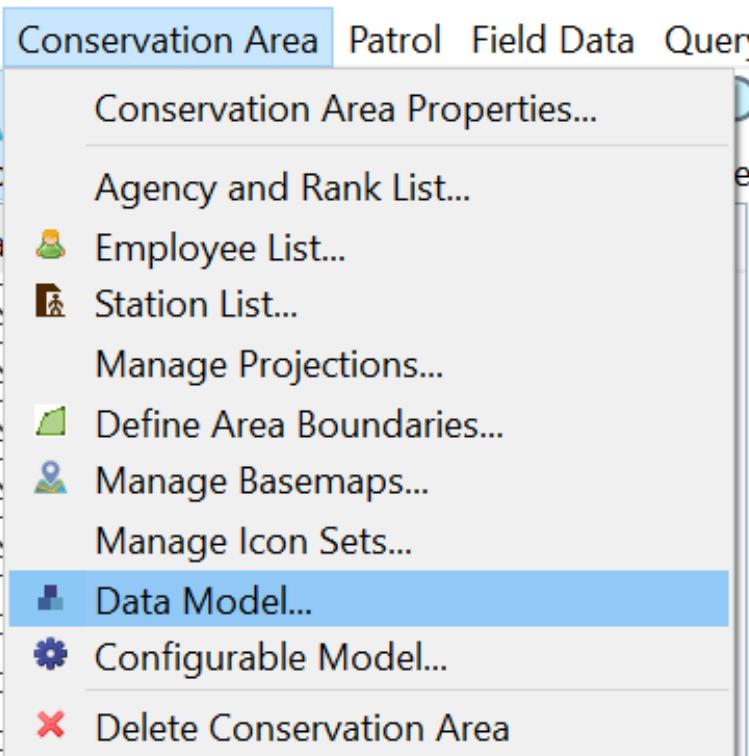
Click Conservation Area in the menu bar then select Data Model. 1.
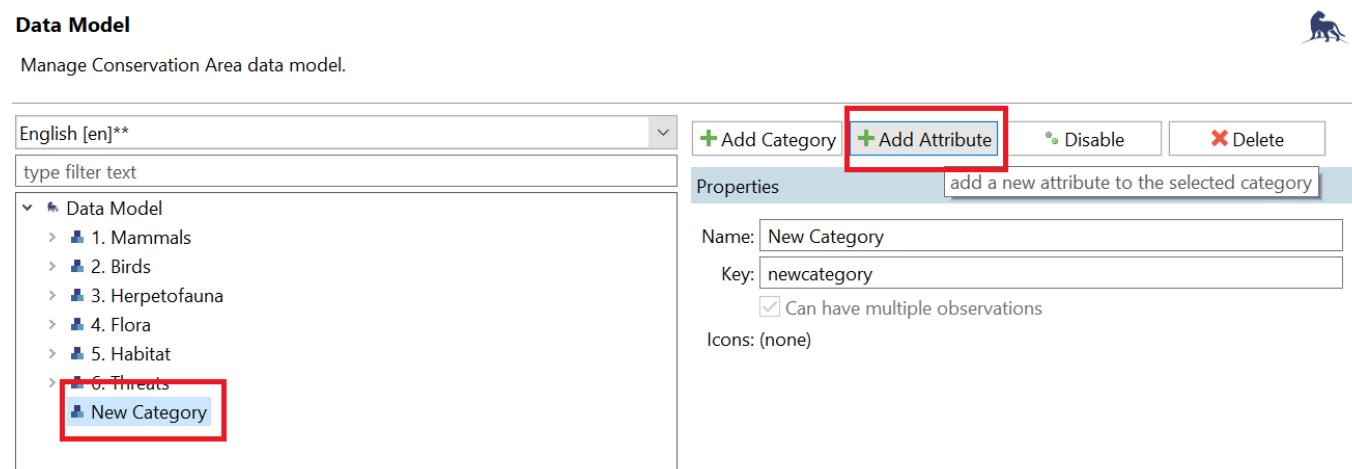
2. In the data model tree, found at the left side of the window, create a category by clicking Add Category. Category corresponds to the information type in the data matrix created, and Attributes correspond to data points
How to add categories and attributes in the data model
3 The new category will now appear under the data model tree Select it and click Add Attribute Select Create a new attribute
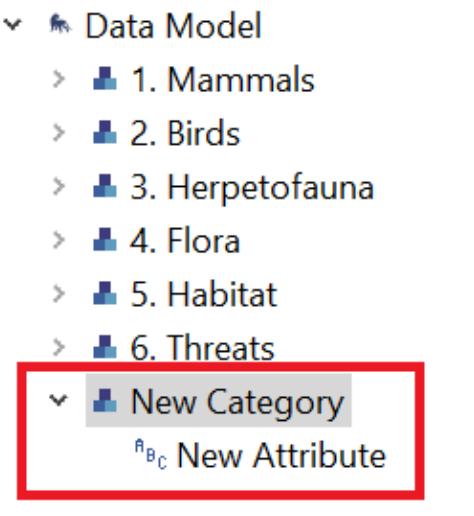
4 The new attribute will now appear under the category in the data model tree
5. Save the date model by clicking on Save in the lower right corner of the window.
User Level Permissions and Restrictions
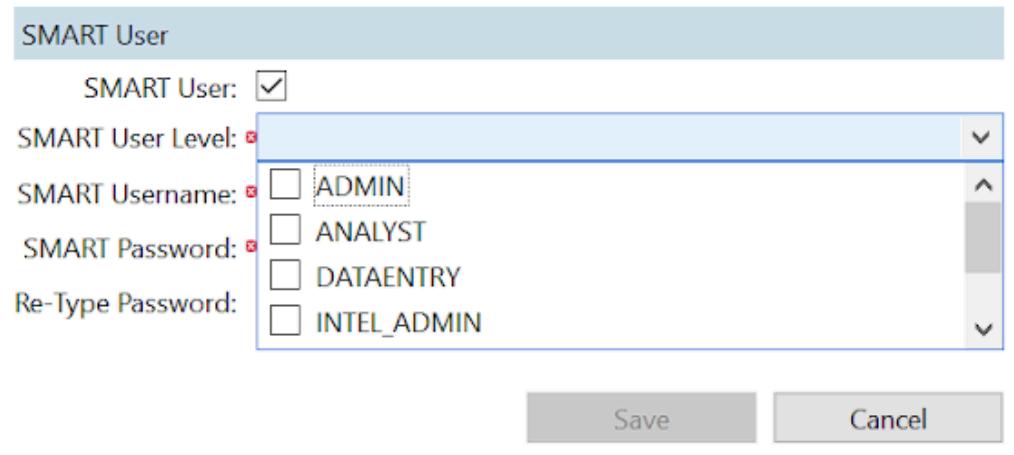
Admin users can assign each SMART user a user level that will restrict their access to each conservation area. This can be done on the Conservation Area menu and by selecting Employees.
User Level Permissions and Restrictions
Importing
he uploaded module will be utomatically loaded under the Project ab Step
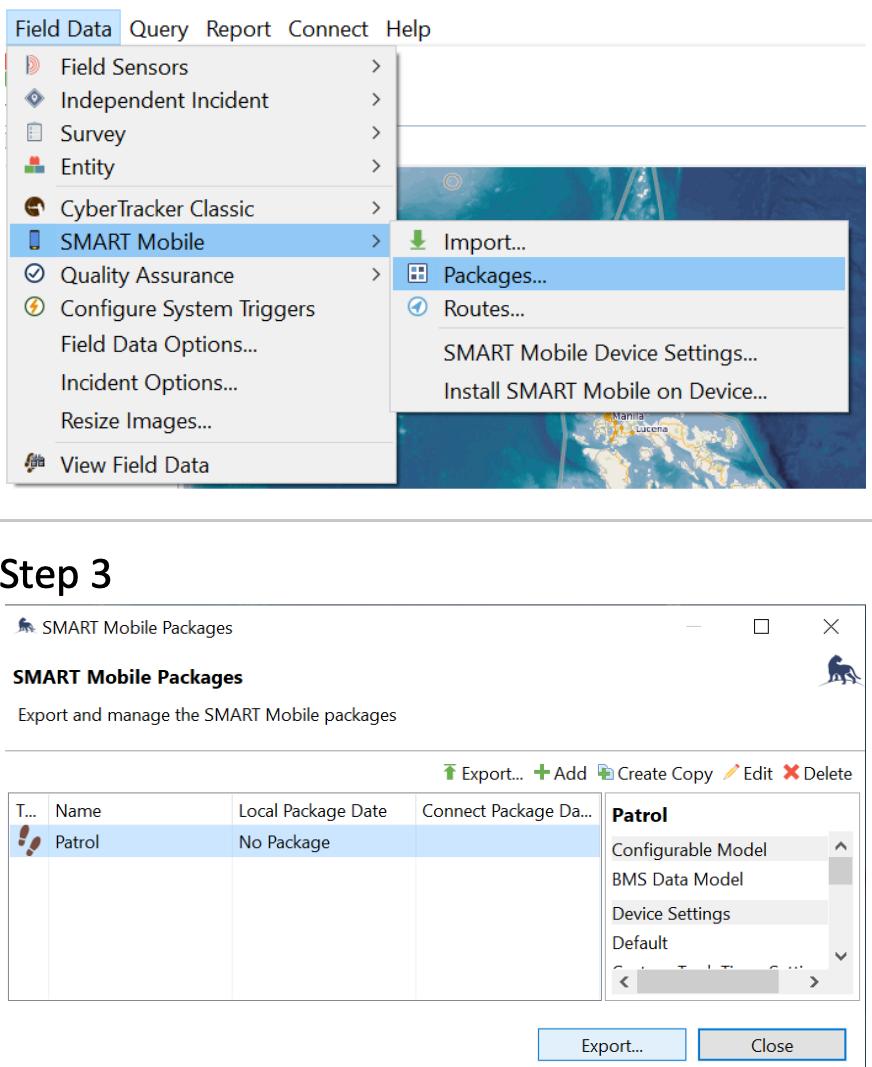
Step 2: Log in to SMART Desktop on the computer On the menu toolbar of SMART Desktop, select Field Data Click SMART Mobile Click Packages
Step 3: Select the package or configurable data model to export.
If the package is not visible in the tab, click the green + Add button and select the type of package. Then click Export.
Step 4: Select the location where to save the package There are three ways to export:
1
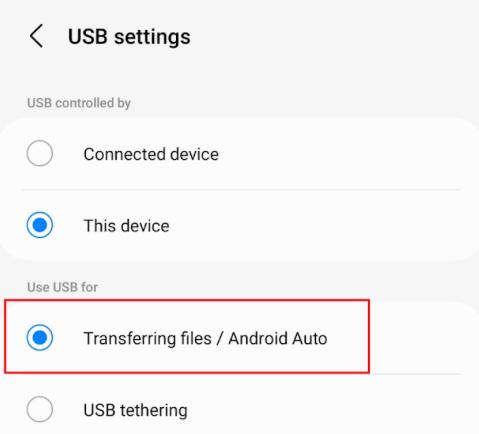
Select Export to Device then Export Export to Device directly exports the package to the device through a data cable
2
Export to File saves the package as a file readily available to be shared through flash drives or attachments.
Export to Connect directly saves the package to a SMART Connect. 3.
Click Export.
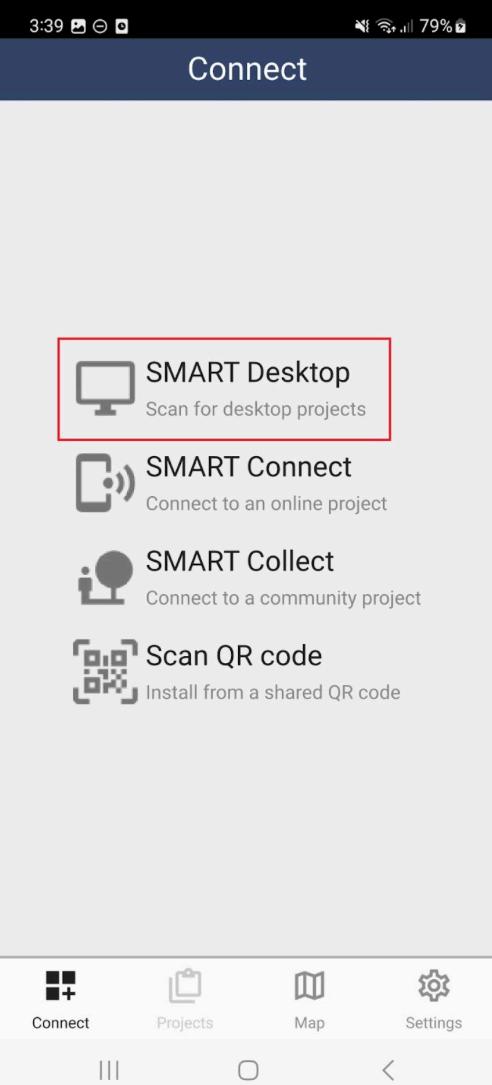
tep 5: Open SMART Mobile on the device Tap the Connect tab found at the bottom of the app then click the SMART Desktop option
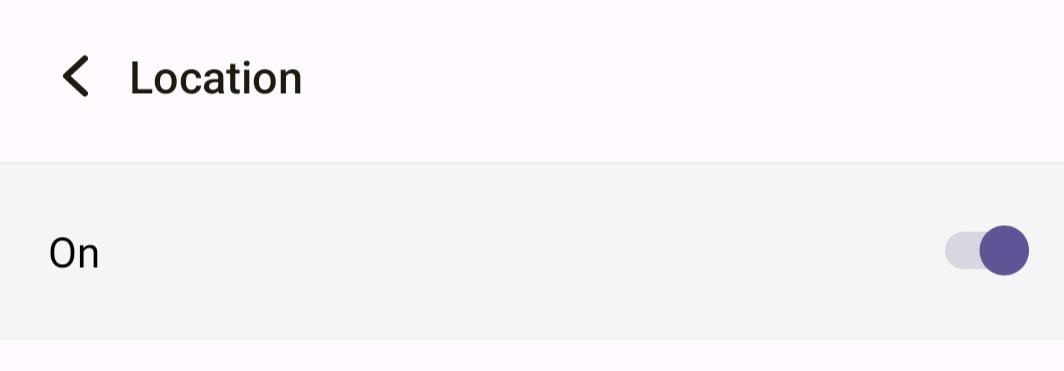
Step 1: The GPS must be turned on before using SMART Mobile To do so, go to the device’s Settings, and enable GPS location The GPS is now activated
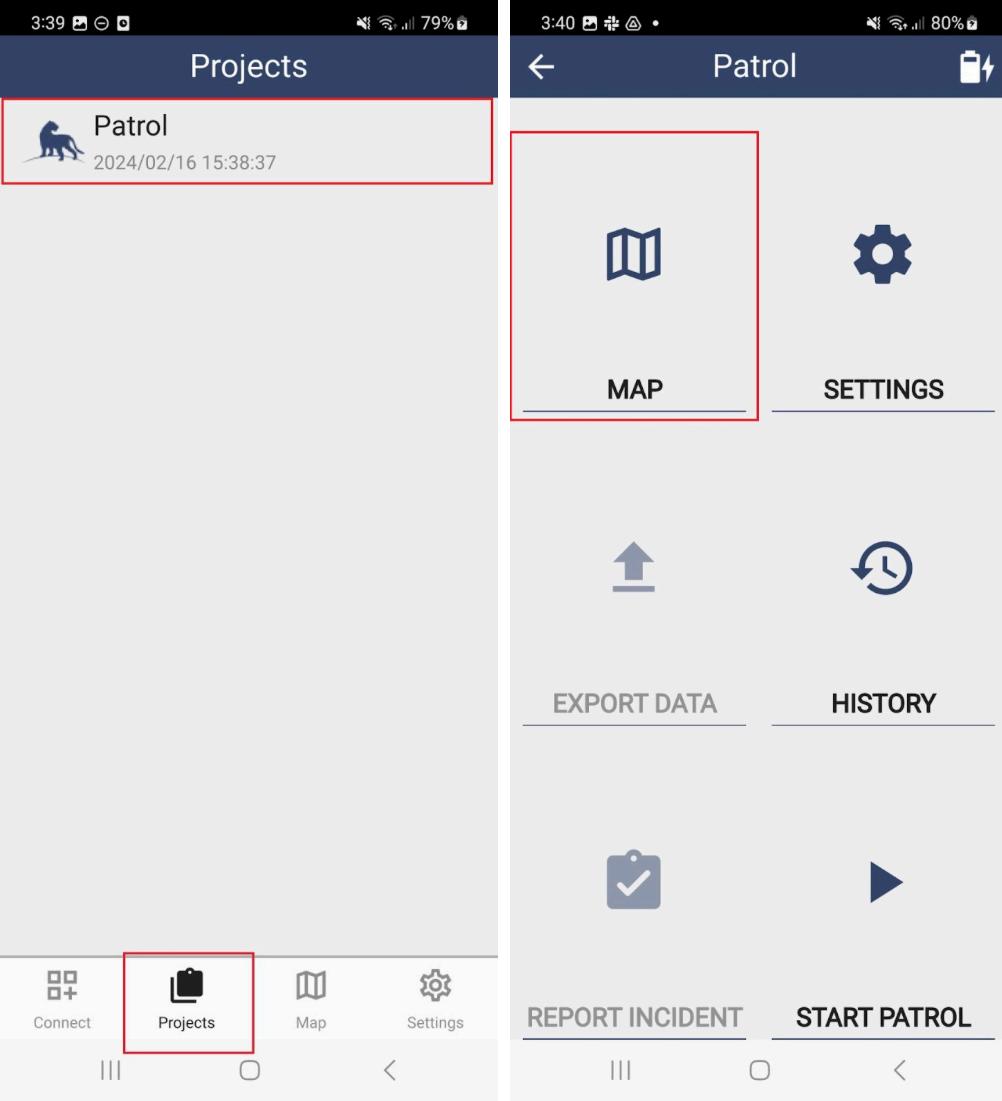
Step 2: Open the SMART Mobile application on the device, go to Projects, and select the Conservation Area data model project
To examine if the GPS is working, select Map This will start the GPS function of the device Wait for the GPS coordinates to appear on the screen
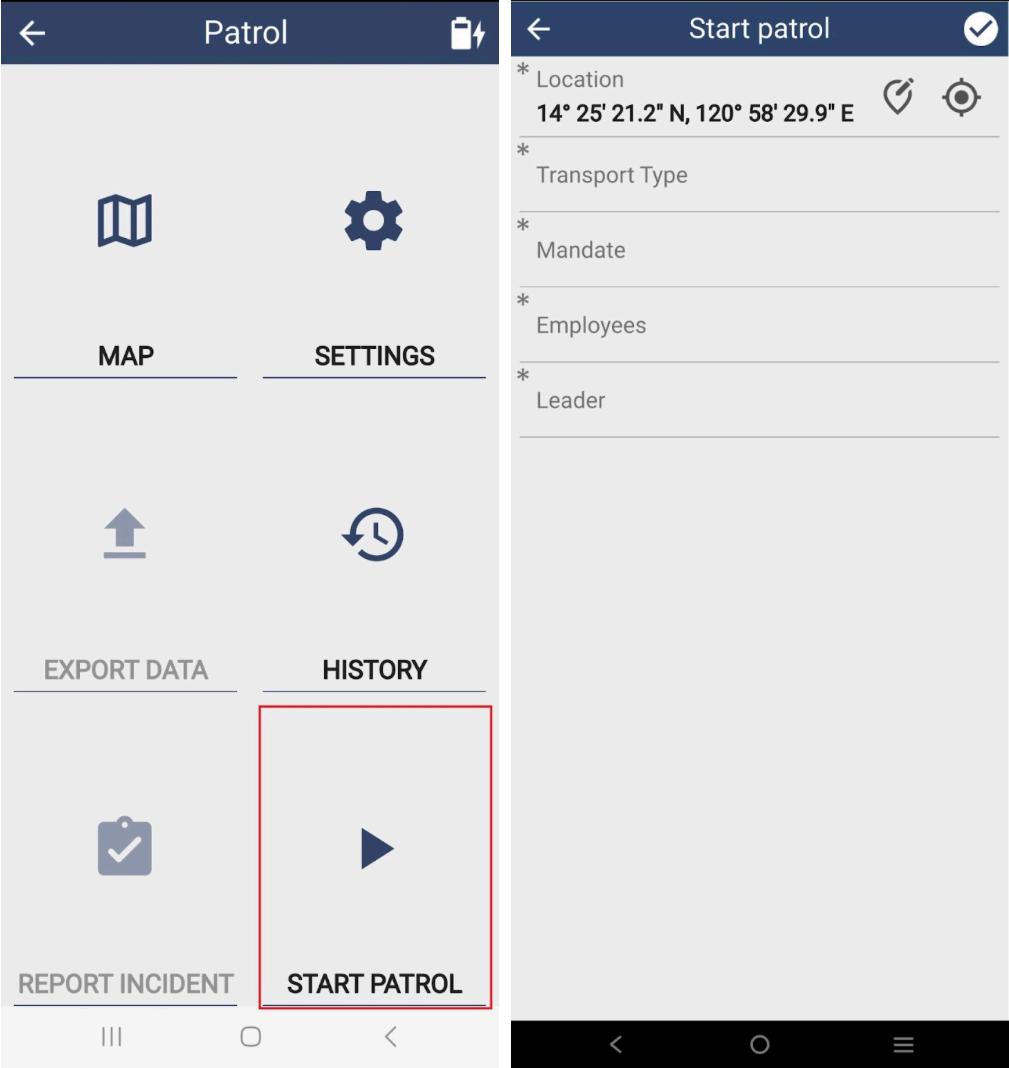
Step 3: To start the collection, tap Start Patrol. Fill out the necessary patrol details.
The location will automatically get its GPS coordinates. Proceed to choose the appropriate patrol transport type and mandate. For Employees, select the names of the team members by marking the box. Then select the name of the patrol leader in the Leader tab.
REMINDER: All data points with asterisks (*) must be filled out before proceeding to data collection
Step 3
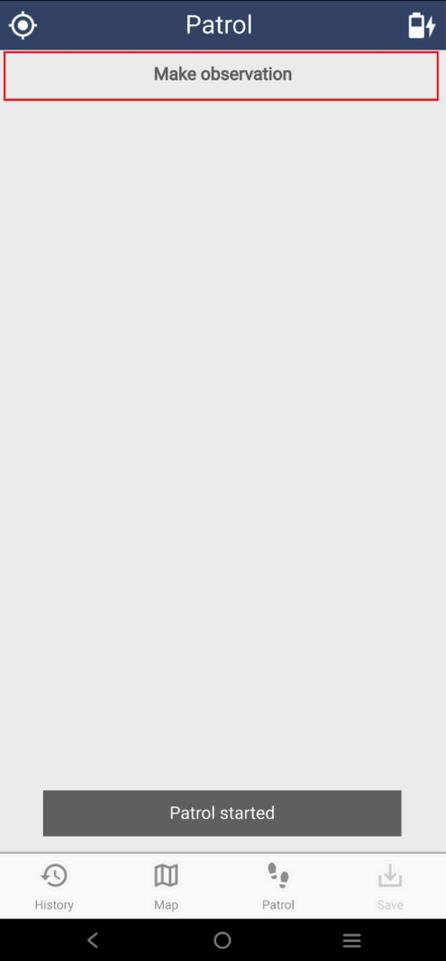
Step 4: The patrol is ready to take observations. Tap Make Observation. Choose from the different categories or observation options to start the data collection.
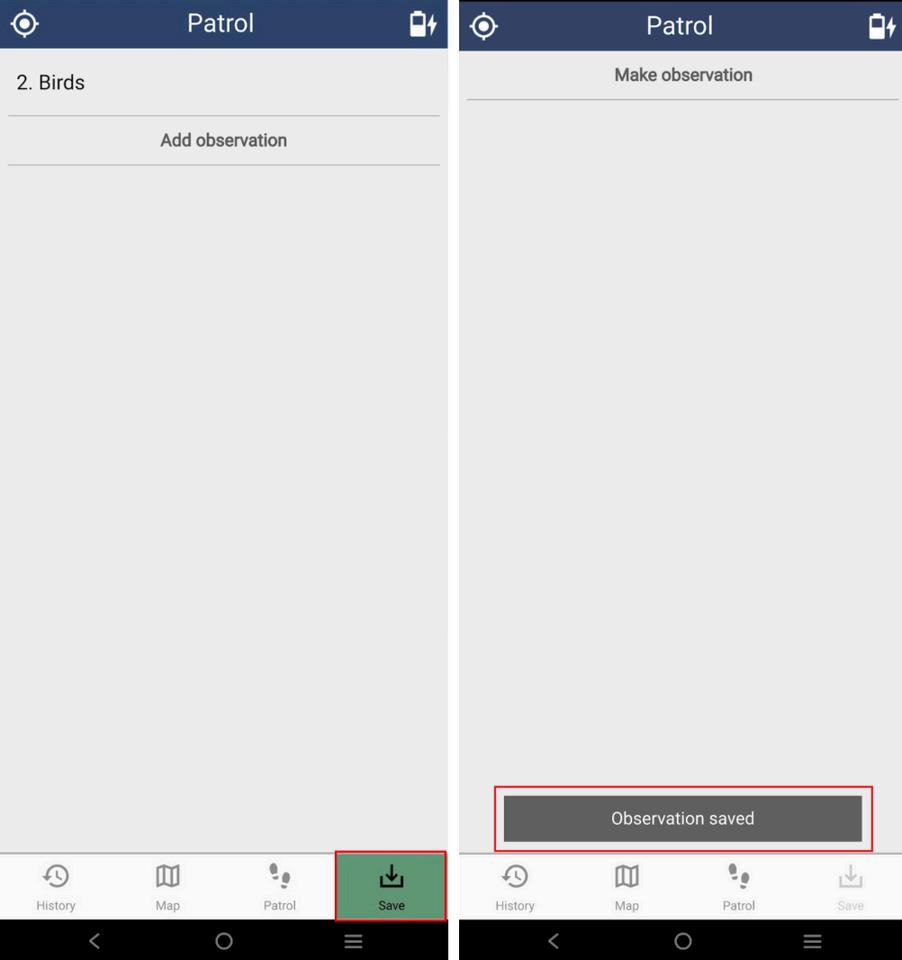
Step 5: To save, tap the save button
Saving the data collection also saves the last GPS location If collecting other data in the same place, no need to save them immediately so they can be recorded under one location
Step 6: To view patrol statistics, select Patrol and Statistics.
This includes the start date and time along with the distance covered
Step 4
Step 5
Step 6
Data Collection
Step 7
Settings Features
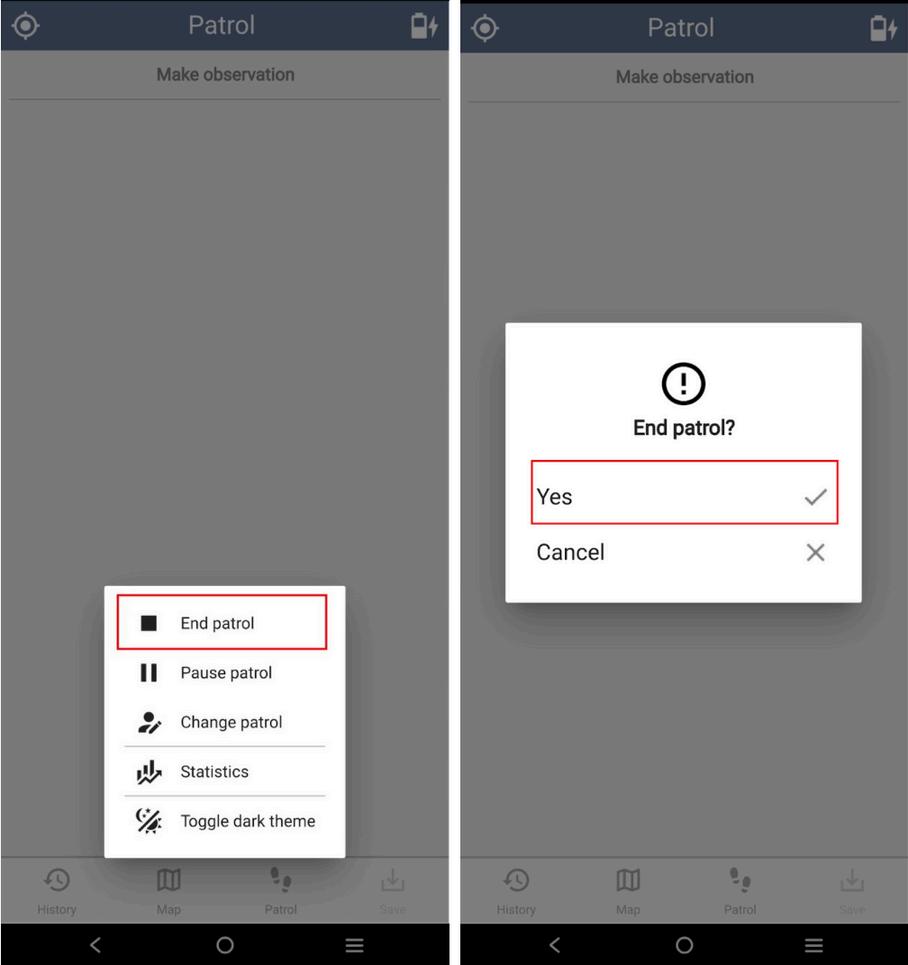
Step 7: To end patrol, tap Patrol then End Patrol. Tap and hold Yes to proceed. SMART Mobile will record the GPS coordinates to record the last patrol activity.
Report Item
Function
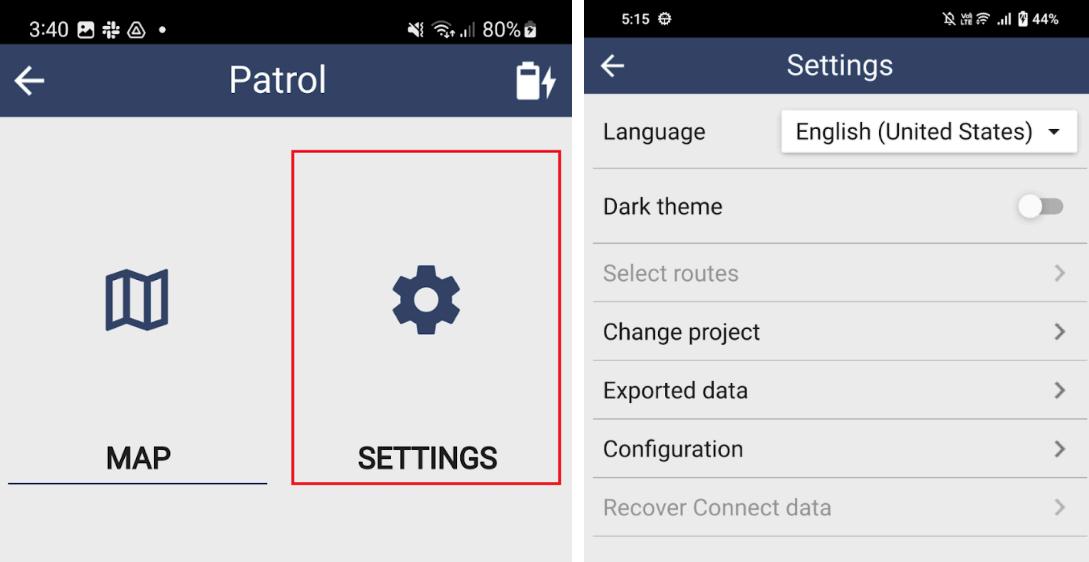
Language Select the language to be used
Dark theme
Select routes
Change project
Exported data
Enables changing the display interface from Dark to Light theme
If routes are available, users can select which route to display on the map view of the device
Enables switching from one project/data model to another
Data exported are stored here awaiting for desktop import Files can also be shared through other means like Bluetooth sharing or sending via e-mail
REMINDER: Once files are imported to SMART Desktop via cable, files stored here will disappear
Settings Features
Report Item Function
Configuration Displays the SMART Mobile’s system configurations
Recover Connect data Recovers the data that cannot be uploaded to SMART Connect
Reminders
The text editor allows writing remarks 1
Save the data Wait until it reaches 100% before saving the data 2 Once saved, users can still edit the data on the History tab 3
Before leaving the headquarters to conduct patrols, ensure the following: Bring all the necessary equipment (tablets, power banks, protective gear for the tablets, binoculars, boots, raincoats, drinking water, food, and a first aid kit).
2.
1. Batteries of devices must be fully charged. For extra caution, take a fully charged power bank.
3.
Check that the GPS (Location) on the tablet is on. To turn on the GPS/Location button, go to Settings, click Location, and click On.
Check that the SMART Mobile app installed in the Android device provided is working by turning it on and examining if the GPS section registers a reading on the screen 4.
Step 1
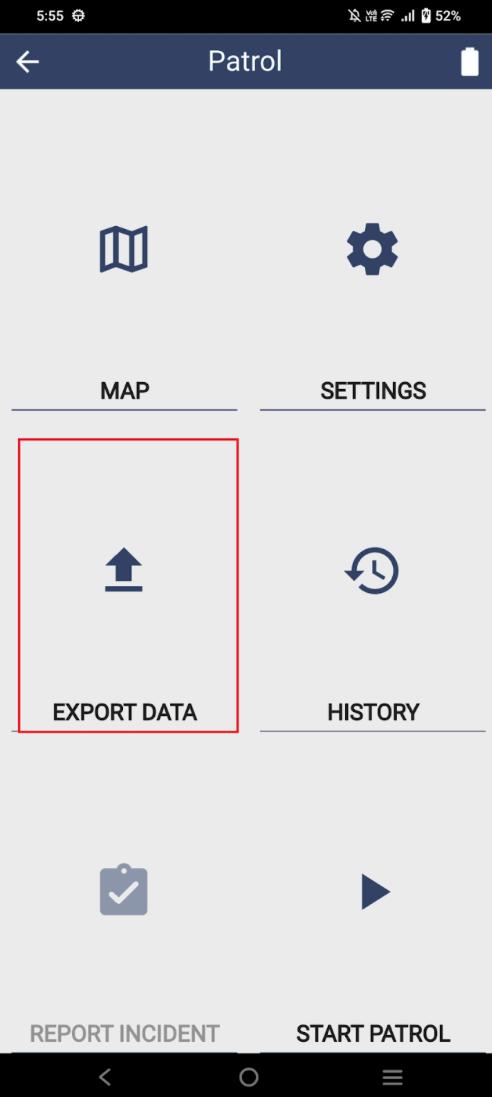
Step 1: On SMART Mobile, select Export Data Connect the device to the desktop through the data cable
Data Transfer from SMART Mobile to SMART Desktop
Step 2: On SMART Desktop, go to Field Data select SMART Mobile, and choose Import There are 3 ways to import the data:
Device - directly from the device using a data cable 1.
Files - directly from the desktop’s file manager 2
Archive - archiving imported files 3.
For this guide, select Import, then Import from the Device Wait for the patrol data to be transferred successfully. Click OK.
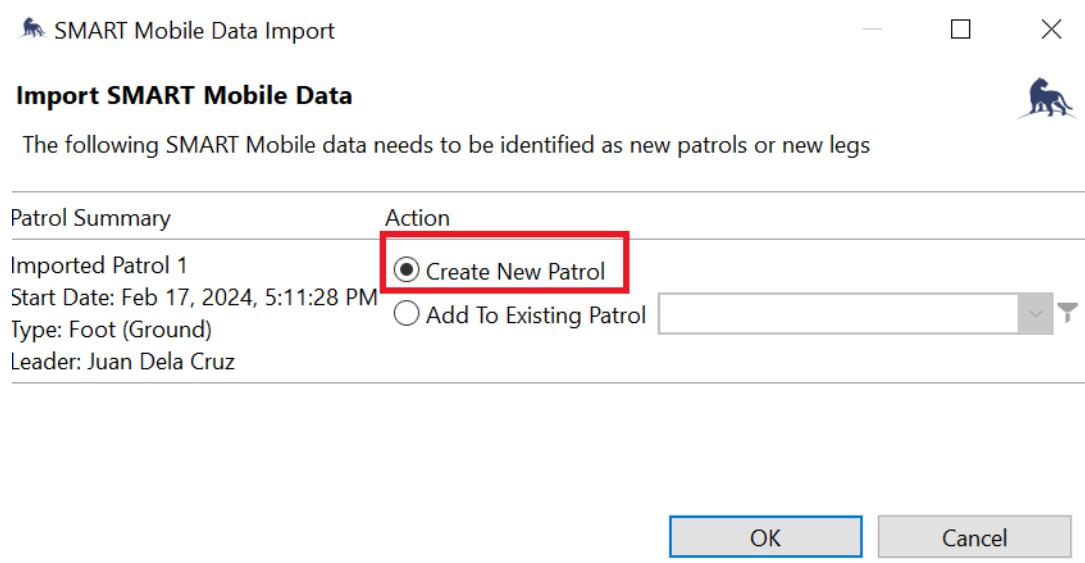
To complete the data transfer, add the patrol data by selecting it and clicking Create New Patrol. Click OK. Users will receive a message that the patrol data has been transferred successfully. Click OK


