1965-2025
PRESERVATION IS ABOUT THE FUTURE:
The Economic Impact of Historic Preservation and Heritage Tourism in Fort Wayne
Completed by PlaceEconomics for the City of Fort Wayne, Indiana


INTRODUCTION
Fort Wayne’s commitment to historic preservation has created measurable economic impacts in job creation, heritage tourism, property value growth, tax generation, and more.
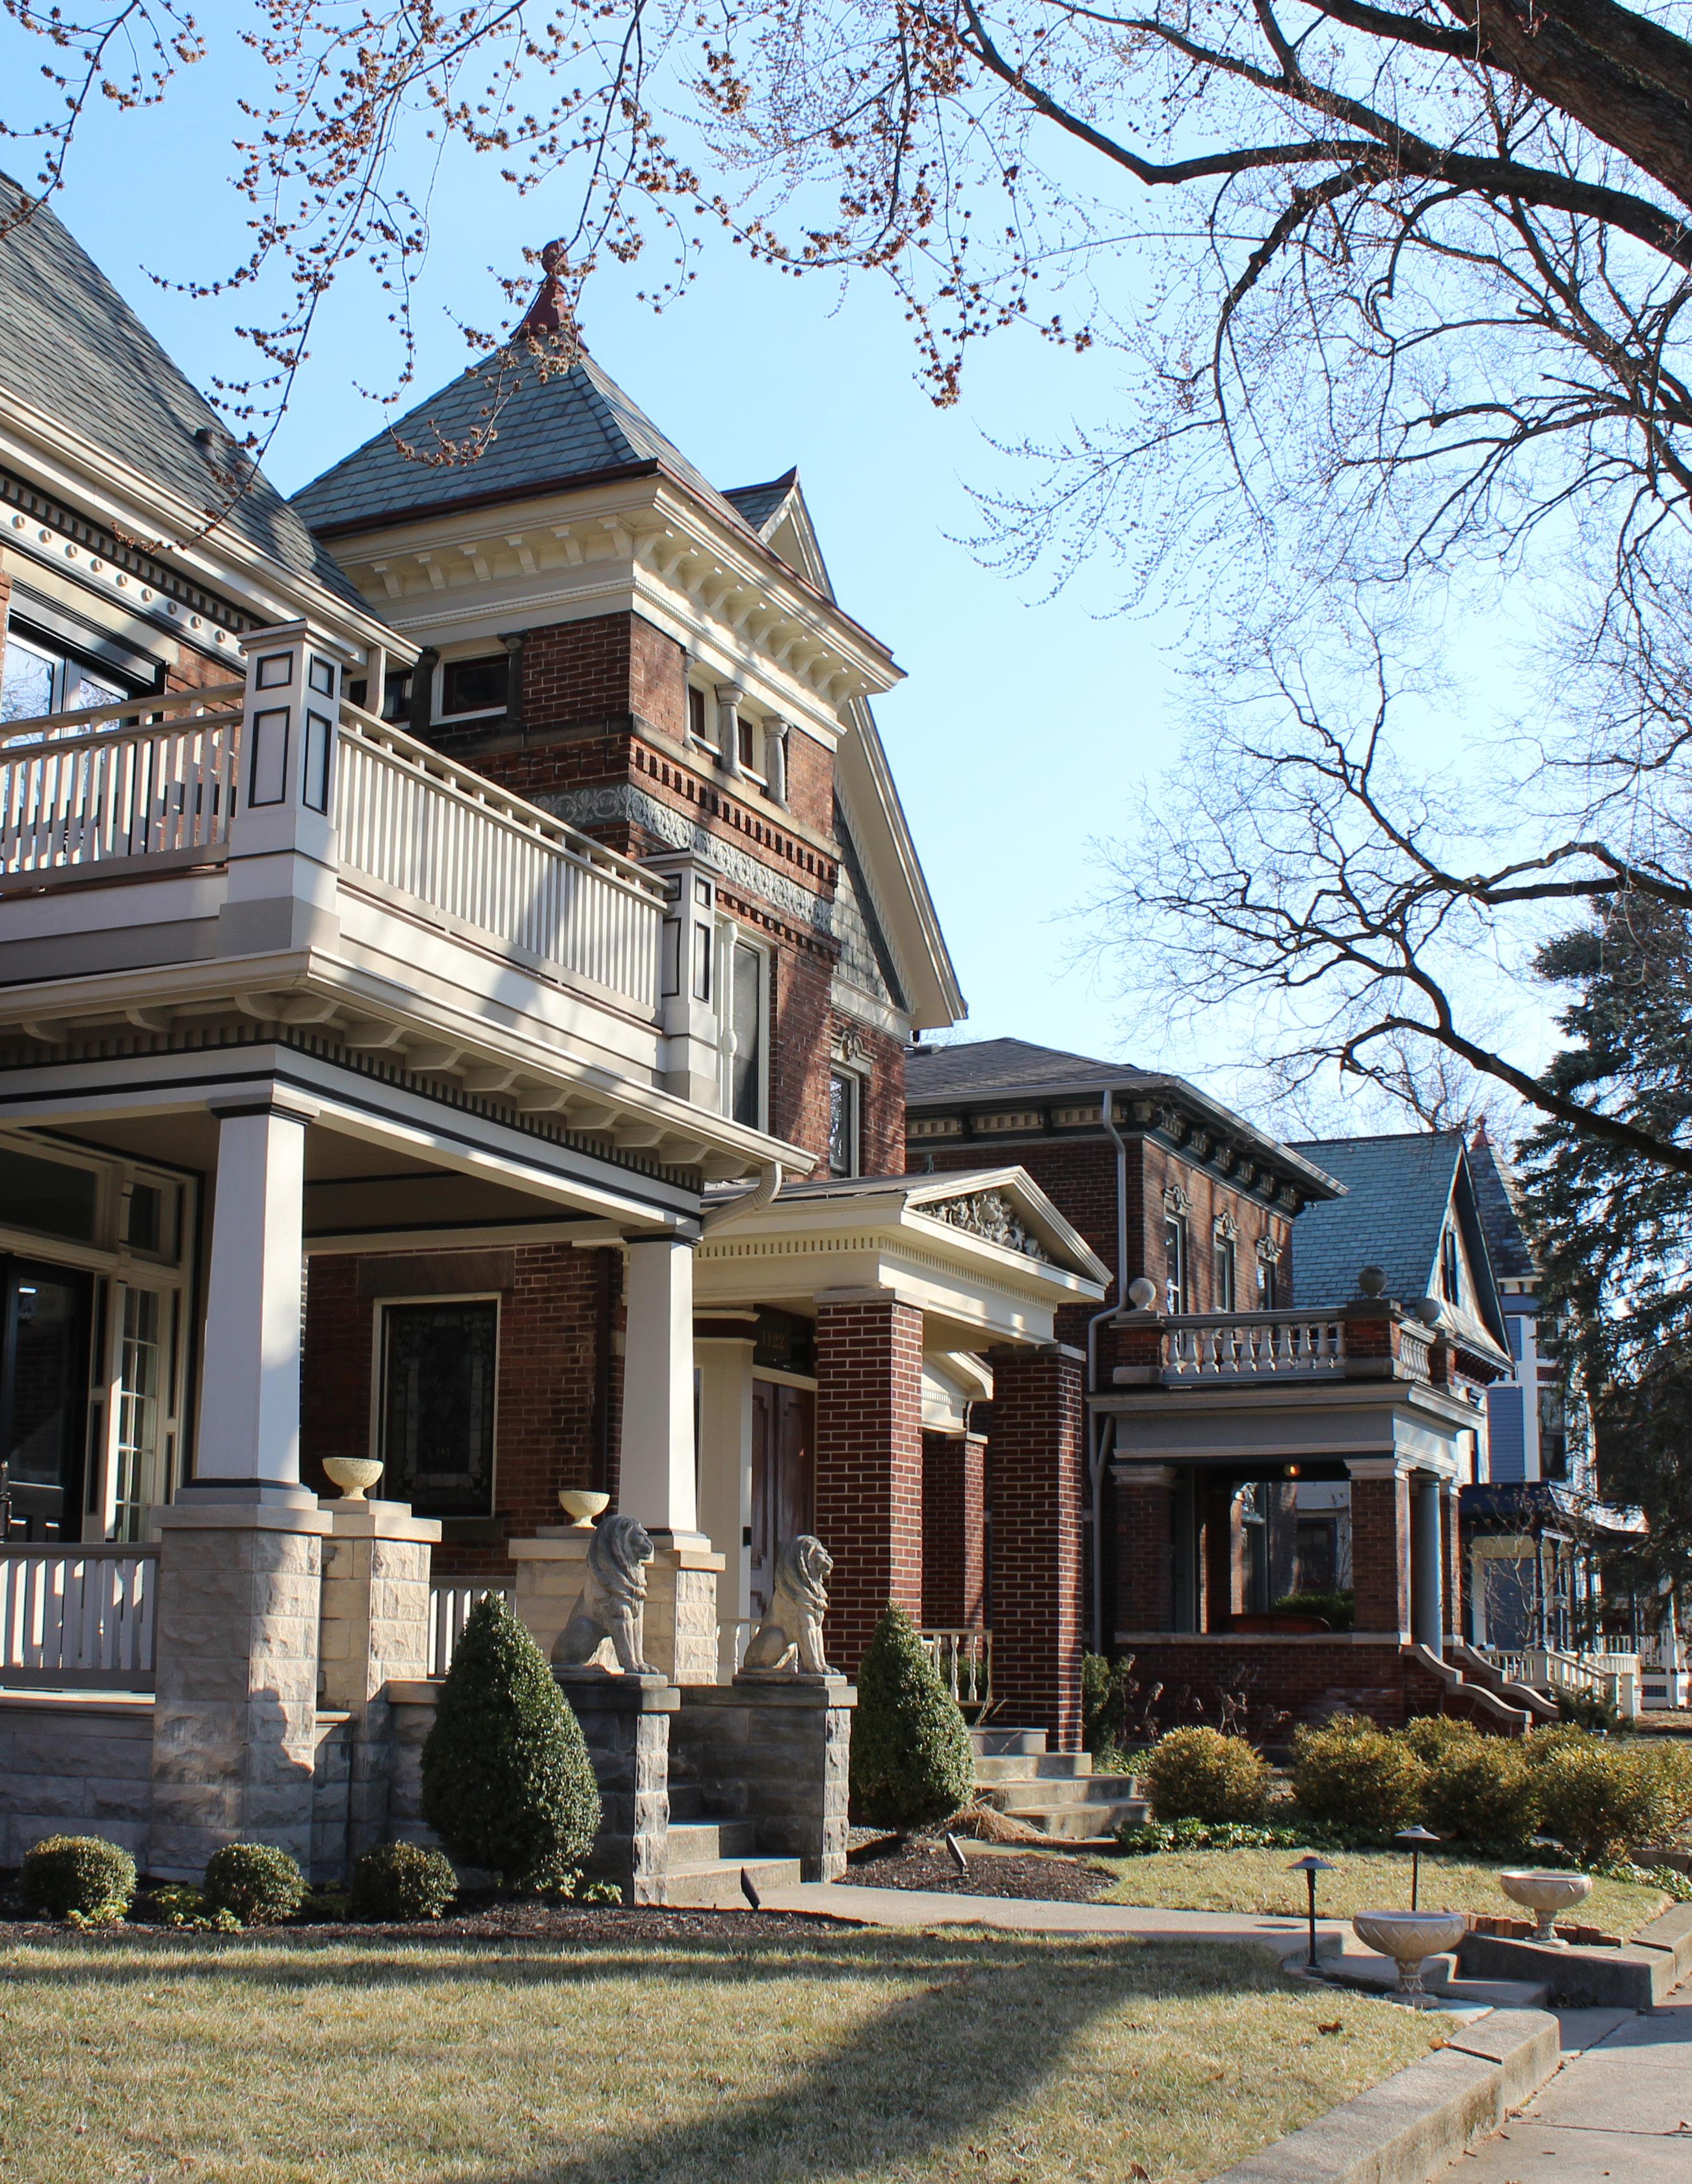
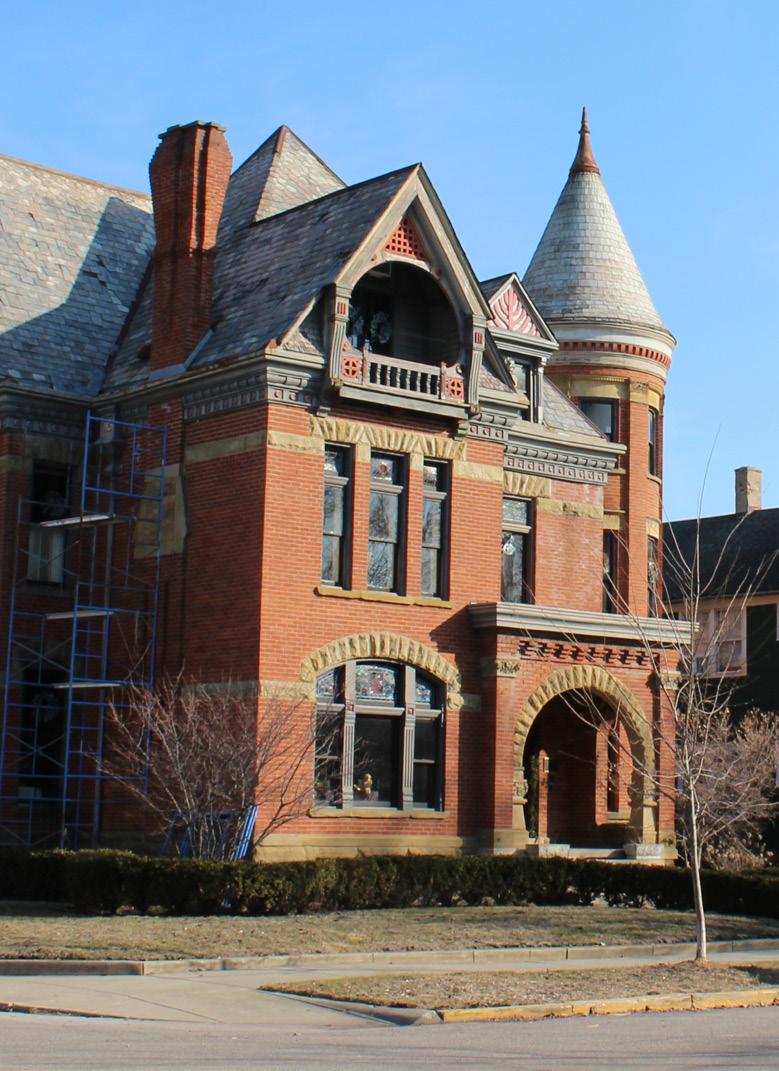
Fort Wayne, Indiana boasts a rich architectural and cultural heritage shaped by its early Native American roots, French and British colonial influences, and 19th and 20th-century industrial growth. The City’s built environment reflects a wide range of styles, from Greek Revival and Italianate homes in the West Central Historic District to Art Deco landmarks like the Lincoln Tower.
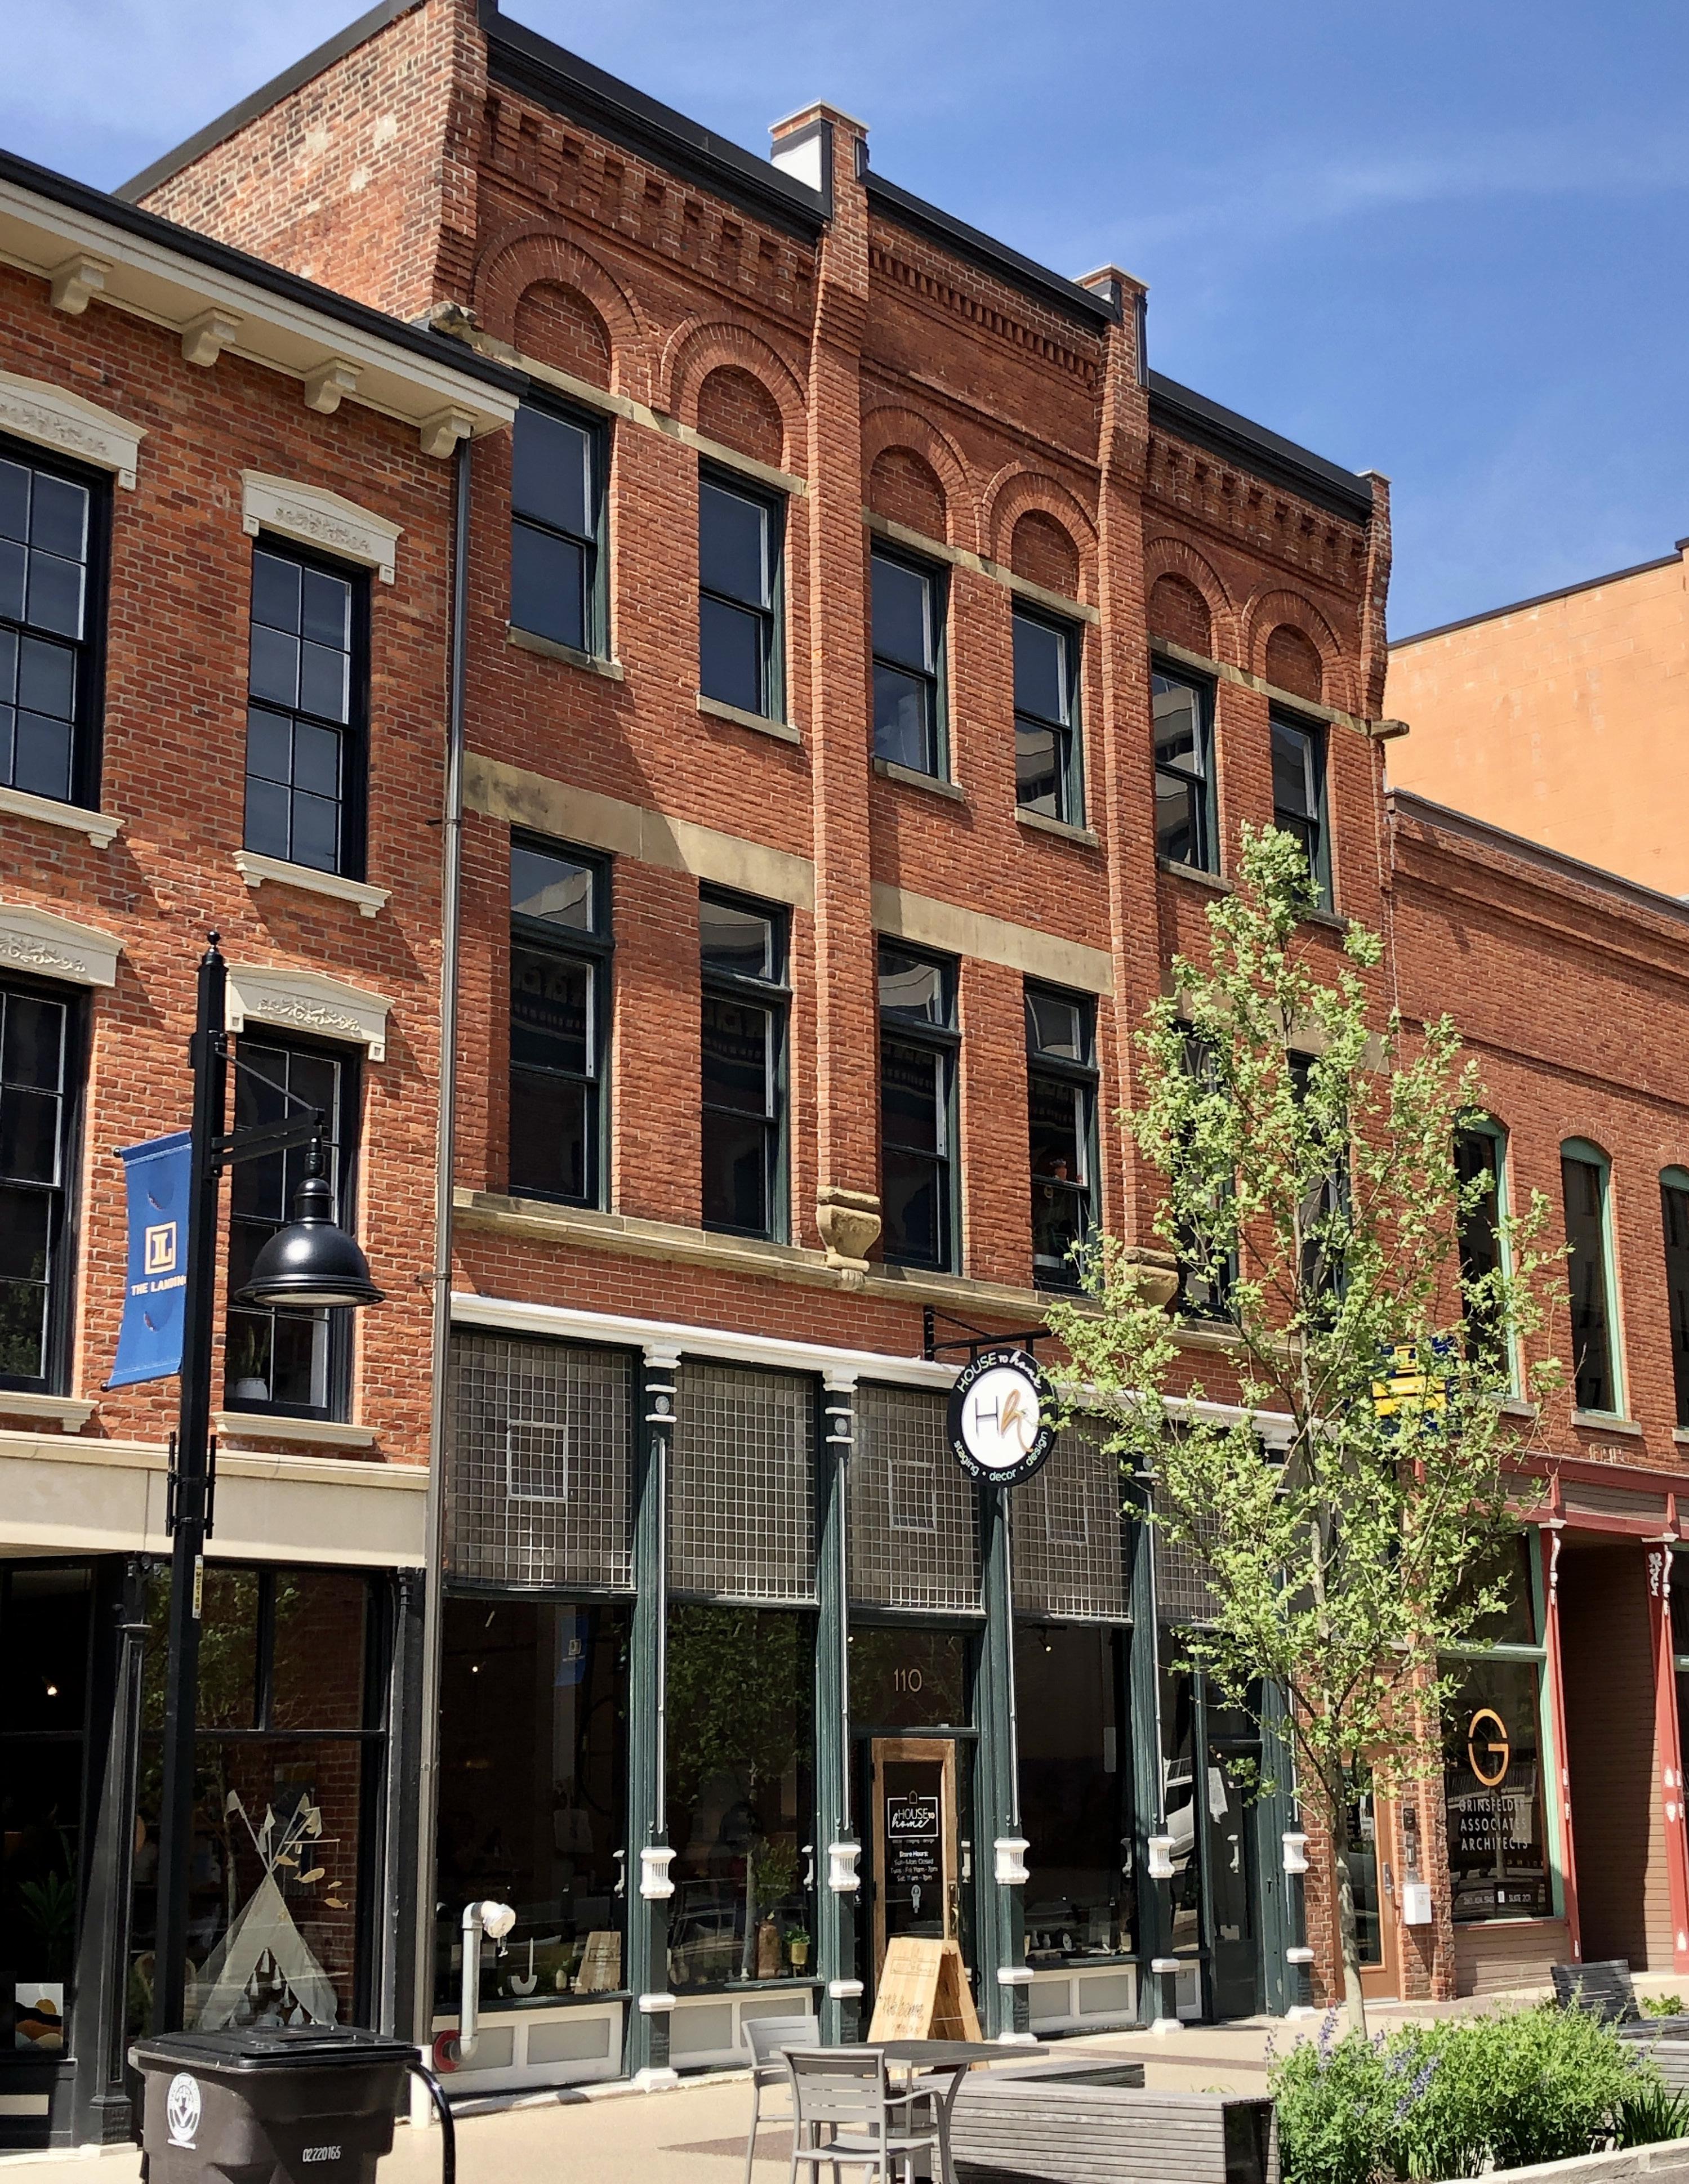
In 1965, Fort Wayne adopted a local historic preservation ordinance–the first such ordinance in Indiana. For 60 years, the City of Fort Wayne has been committed to the preservation of its historically and culturally significant landmarks and neighborhoods. The city’s first two historic districts were designated in 1966: one is the Chief Richardville House, built in 1827 and recognized as the oldest Native American structure in the Midwest. The second is the Landing Historic District, which represents the largest remaining concentration of nineteenth and early twentieth century commercial buildings in downtown Fort Wayne, and today is a vibrant mixed-use commercial district.
Preserving this rich heritage has positive economic impacts for Fort Wayne, measurable in jobs, property value growth, heritage tourism, and tax revenues back to the City. Not only do historic districts promote economic vitality, but they also protect an important supply of diverse affordable housing. Historic districts are dense, boasting a diversity of housing typologies and a range of housing costs.
This report was commissioned to quantify the contribution of Fort Wayne’s historic resources to the local economy. The areas of investigation in this report include the impact of rehabilitation through historic tax credit activity and investment in historic districts, heritage tourism, property values, and housing and affordability.
Key Findings
• Investments in historic tax credit projects have created an average of 258 jobs and $18 million in labor income each year for the last 10 years. That investment has generated, on average, $514,797 in local tax revenue each year.
• Over the last 15 years, investment in properties through building permit activity has increased at a greater rate in historic districts in both number of permits and amount invested than the rest of the city. An average of 306 jobs and $277 million in labor income have been created annually in Fort Wayne as a result of this reinvestment in historic districts.
• Historic districts make significant contributions to the local economy due to their high population density. Local and National Register historic districts have a higher annual household expenditure per acre than the rest of Fort Wayne. Collectively, the buying power of local historic districts residents amounts to $48 million each year.
• Residential property values in local historic districts have outperformed properties in both National Register historic districts and in the rest of Fort Wayne. Today, in fact, the average home value in local districts is higher than either of the other two categories.
• If properties in Fort Wayne’s local historic districts had only increased in value at the rate of the rest of the City, property tax revenues for local government would be $748,000 less this year.
• Local historic districts offer more diverse housing types than the rest of the city. This contributes to a higher density of housing units in both local and National Register historic districts than in the rest of Fort Wayne.
• Local historic districts have a higher share of households making less than the City’s median income compared to the rest of Fort Wayne. Unlike a common caricature of historic districts being the sole domain of the wealthy, in Fort Wayne historic districts accommodate all income brackets.
• Housing costs for both homeowners and renters are lower in local historic districts than the rest of Fort Wayne, making it less likely for households to be cost burdened.
• Heritage visitors to Fort Wayne stay longer, visit more places, and spend more per day than non-heritage visitors. In 2024, the expenditures of heritage tourists supported the creation of over 3,000 jobs and $124 million in labor income.
The Basics
There are 92 locally designated historic districts in Fort Wayne. Fort Wayne’s historic preservation ordinance does not differentiate between individual listings and multiproperty historic districts, so many of these 92 districts are single sites, such as the Embassy Theater, the Fort Wayne Printing Building, and the Baker Street Station. There are 6 local historic district districts that represent an assemblage of historic buildings: The Landing Historic District, Columbia Avenue Historic District, Broadway Commercial Historic District, Williams Woodland Park Historic District, Shawnee Place Historic District, and the West Central Historic District.
Local historic districts are enabled by the Fort Wayne Historic Preservation and Protection Ordinance. Designation of historic properties is based on local criteria and local procedures. Local historic districts provide recognition of Fort Wayne’s significant properties, and coupled with a design review process, provides protection of character-defining exterior features of a property. Applications for exterior changes to buildings in Local Historic Districts, or for new construction/infill, are subject to review by the Fort Wayne Historic Preservation Commission, a 7 member body appointed by the Mayor and approved by City Council.
92
Local Historic Districts
30 National Register historic districts
39 Individual National Register Listings
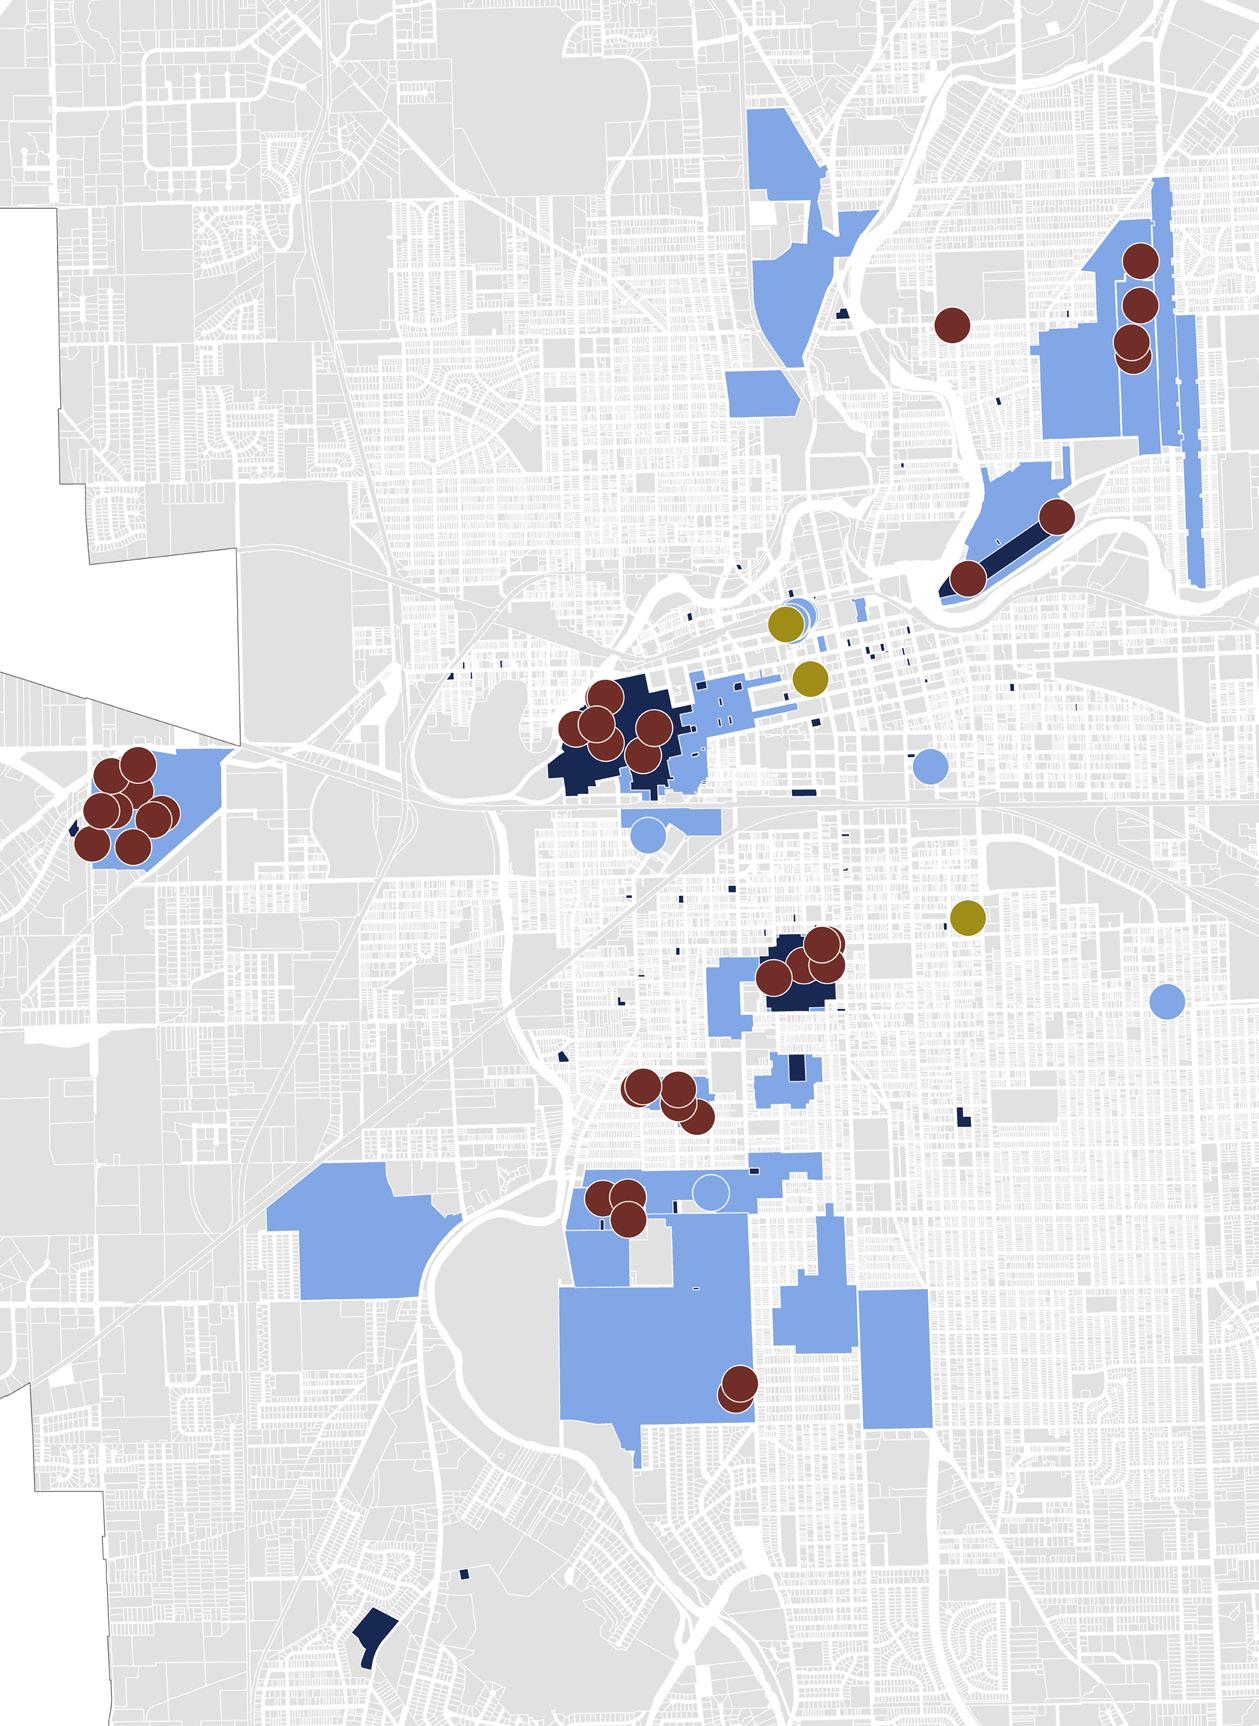
There are 30 National Register historic districts and 39 individually designated National Register buildings and places in Fort Wayne. National Register historic districts are a Federal level designation of historic properties based on uniform national criteria and procedures. Under federal law, owners of private property listed in the National Register are free to maintain, manage, or dispose of their property as they choose, provided that there is no Federal involvement. However, National Register listing requires the effects of federally assisted projects on historic properties be considered prior to the commencement of work. It also makes available federal tax incentives for qualified rehabilitation projects, as well as funding from the Historic Preservation Fund. There are other neighborhoods of the city that have been identified as National Register eligible, but are not currently designated, shown on the map on the next page.1
1 Kirkwood Park, shown in the map in solid green on the next page, was recently designated. It is not included in this study because it was designated after analysis began.
Land Area
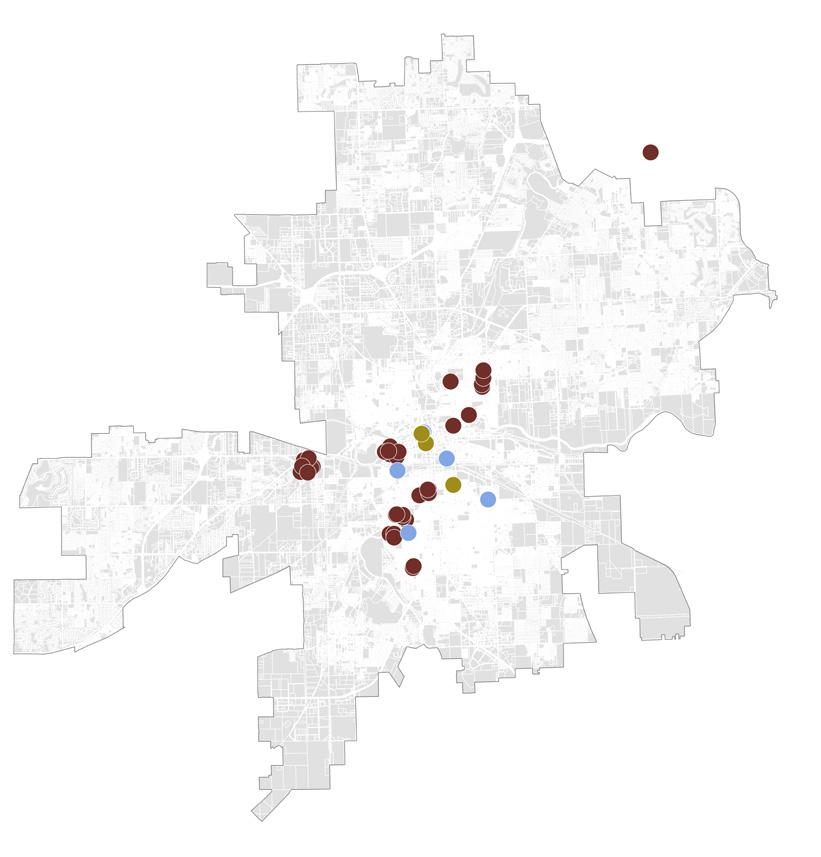
Less than 4% of the land area of Fort Wayne is covered by local historic districts or districts listed in the National Register of Historic Places. Local historic districts are 0.4% of the City’s land area, and are subject to review of changes under the historic preservation ordinance.
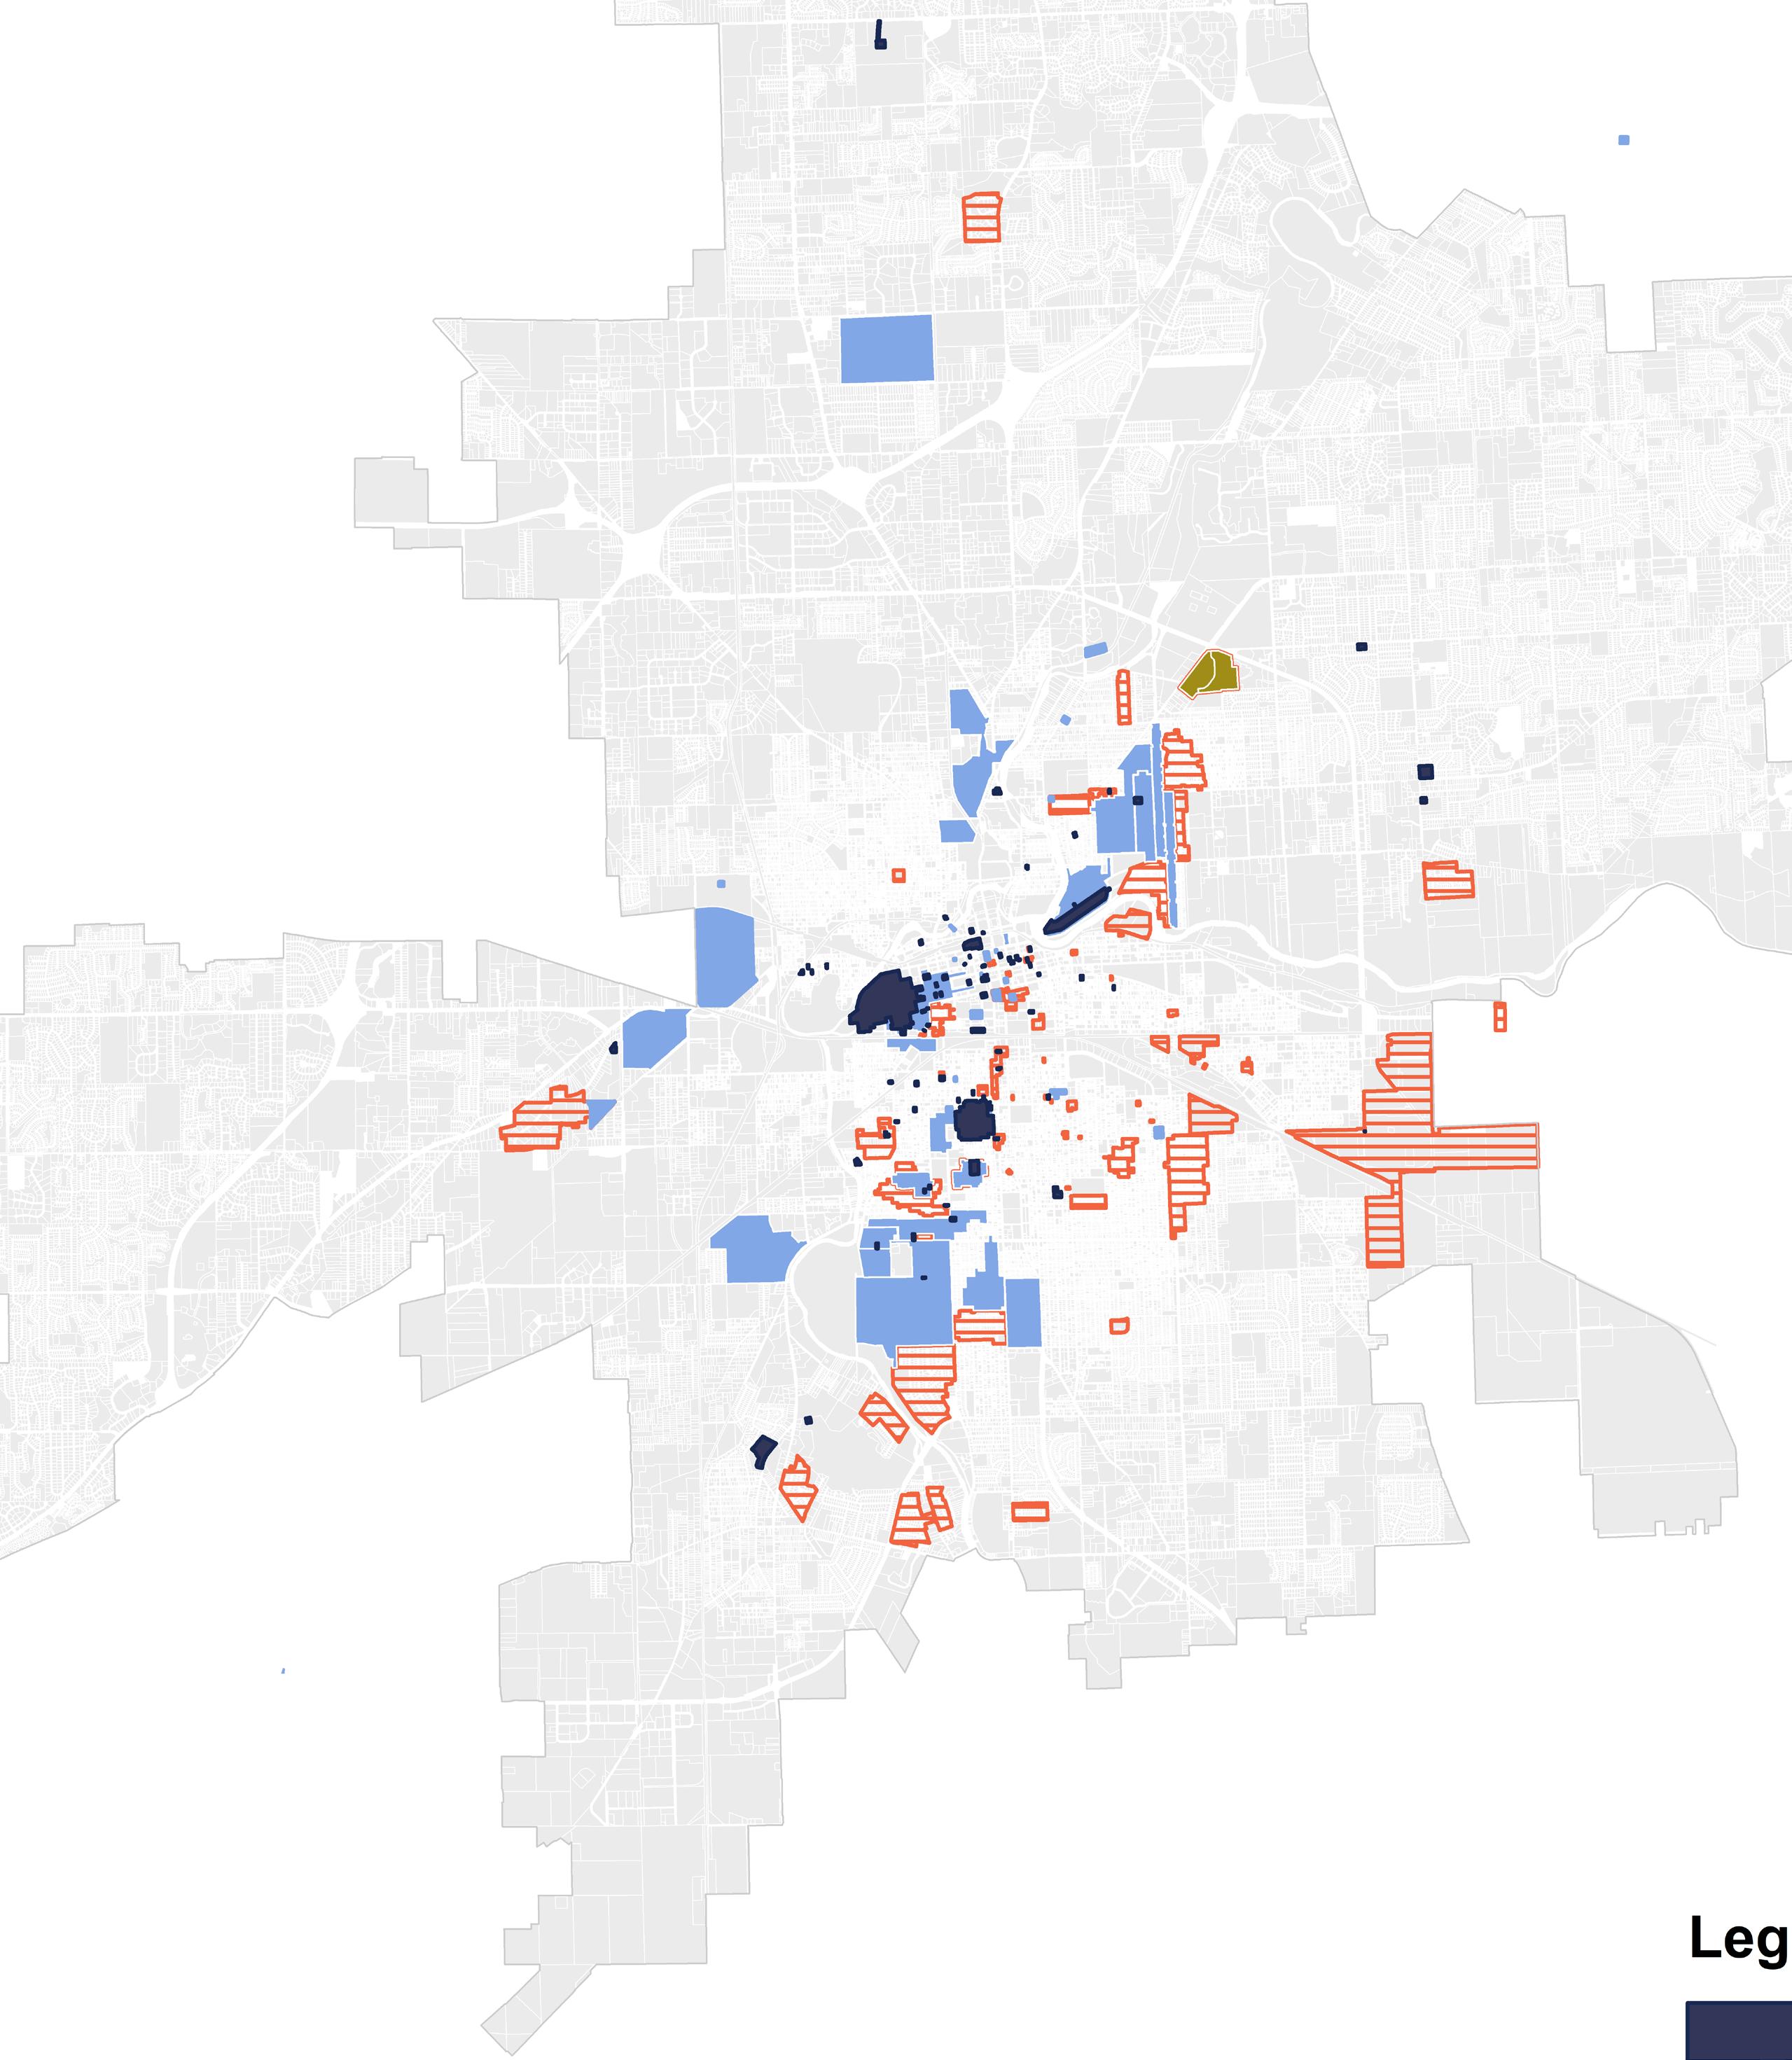

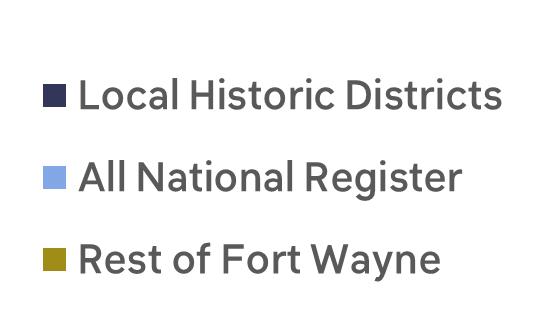
LHDs (Multi-property and Individual Districts)
NR Historic Districts and Individual Listings
National Register Eligible

Kirkwood Park HD (Recently Listed)
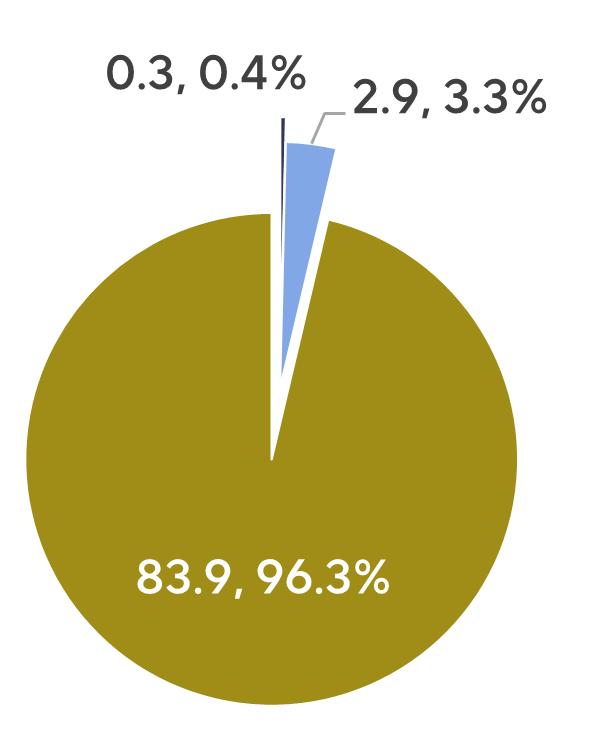
Less than 4% of the land area is covered by historic districts.
LAND AREA IN HISTORIC DISTRICTS (SQMI)
Source: Historic districts shapefiles provided by the Division of Community Development
Historic Tax Credit Activity
Nationwide, historic tax credits are the country’s most effective tool to promote private investment in historic buildings. A tax credit is a dollar-for-dollar offset of income taxes that would otherwise have to be paid, making it a powerful incentive for historic rehabilitation.
Historic tax-credit projects create jobs and stimulate local economies. By incentivizing private investment in historic buildings, historic tax credits bring vacant and underutilized buildings back on the tax roll. These projects sustain important sources of income for Fort Wayne through construction jobs; because historic-rehabilitation projects are typically more labor intensive than new-construction projects, a larger share of the project’s costs go directly to labor income rather than to materials. But materials for rehabilitation projects are also more likely to be local purchases. In Allen County, a new commercial building costing $1 million will spend $3,798 in local retail purchases at building materials and supply stores. A rehabilitation project of the same size will spend $45,475 in local retail purchases of building materials. Three historic tax credit programs are available in Indiana, outlined on the next page.
FEDERAL HISTORIC TAX CREDIT
Enacted in 1976, the Federal Historic Preservation Tax Credit (HTC) is administered by the National Park Service (NPS) in partnership with State Historic Preservation Offices (SHPOs). The Federal HTC, which provides a 20% federal income tax credit on Qualified Rehabilitation Expenditures (QREs), is the nation’s most effective program for encouraging investment in historic buildings and promoting community revitalization. The Federal HTC is often paired with other tax credit programs, including the Low-Income Housing Tax Credit (LIHTC), State historic tax credit, or New Market Tax Credit. Since 1976, over 50,000 buildings across the country have been rehabilitated using this credit.
Enacted in 1994, Indiana’s previous state historic tax credit program provided an income tax credit equal to 25% of an income-producing project’s QREs. The program was capped at $450,000, making it the smallest in the country. This program was eliminated in 2016 and replaced with a $700,000 annual grant program. In May 2023, the Indiana legislature passed legislation that allowed for the establishment of a new state historic tax credit program. This program would reinstate the previous provisions, with an additional 5% credit available for non-profit buildings or those that are not income producing. Additionally, the new program’s cap was raised to $10 million annually and runs until 2030. However, as of this writing, the program has yet to be implemented.
This program allows an owner-occupant to apply for a credit against their state income tax liability equal to the lesser of $10,000 or 20% of qualified rehabilitation expenses (QREs). The amount spent must exceed $10,000 and can’t include such items as the cost of enlarging an existing structure, work on outbuildings, paving or landscaping. The historic property must be principally used and occupied by the taxpayer as the taxpayer’s primary residence. The program has an annual statewide allocation cap of $250,000 per year. Applications must be submitted in the same taxable year that the work was completed.
Historic Tax Credit Base Stats
Overall since 2001, 74 projects in Fort Wayne have used some form of historic tax credit: 56 used the State Residential Historic Tax Credit, 15 used the Federal Historic Tax Credit (FHTC) on its own, while another three paired the FHTC with the now defunct State Historic Tax Credit program. Program usage by year can be found in the table on the next page.
56 State Residential HTCs 15 Federal Only HTCs
39 State + Federal HTCs

LHDs (Multi-property and Individual Districts)

Historic tax credits have generated millions of dollars of investment in Fort Wayne.
NR Historic Districts and Individual Listings Historic Tax Credit and Historic Districts
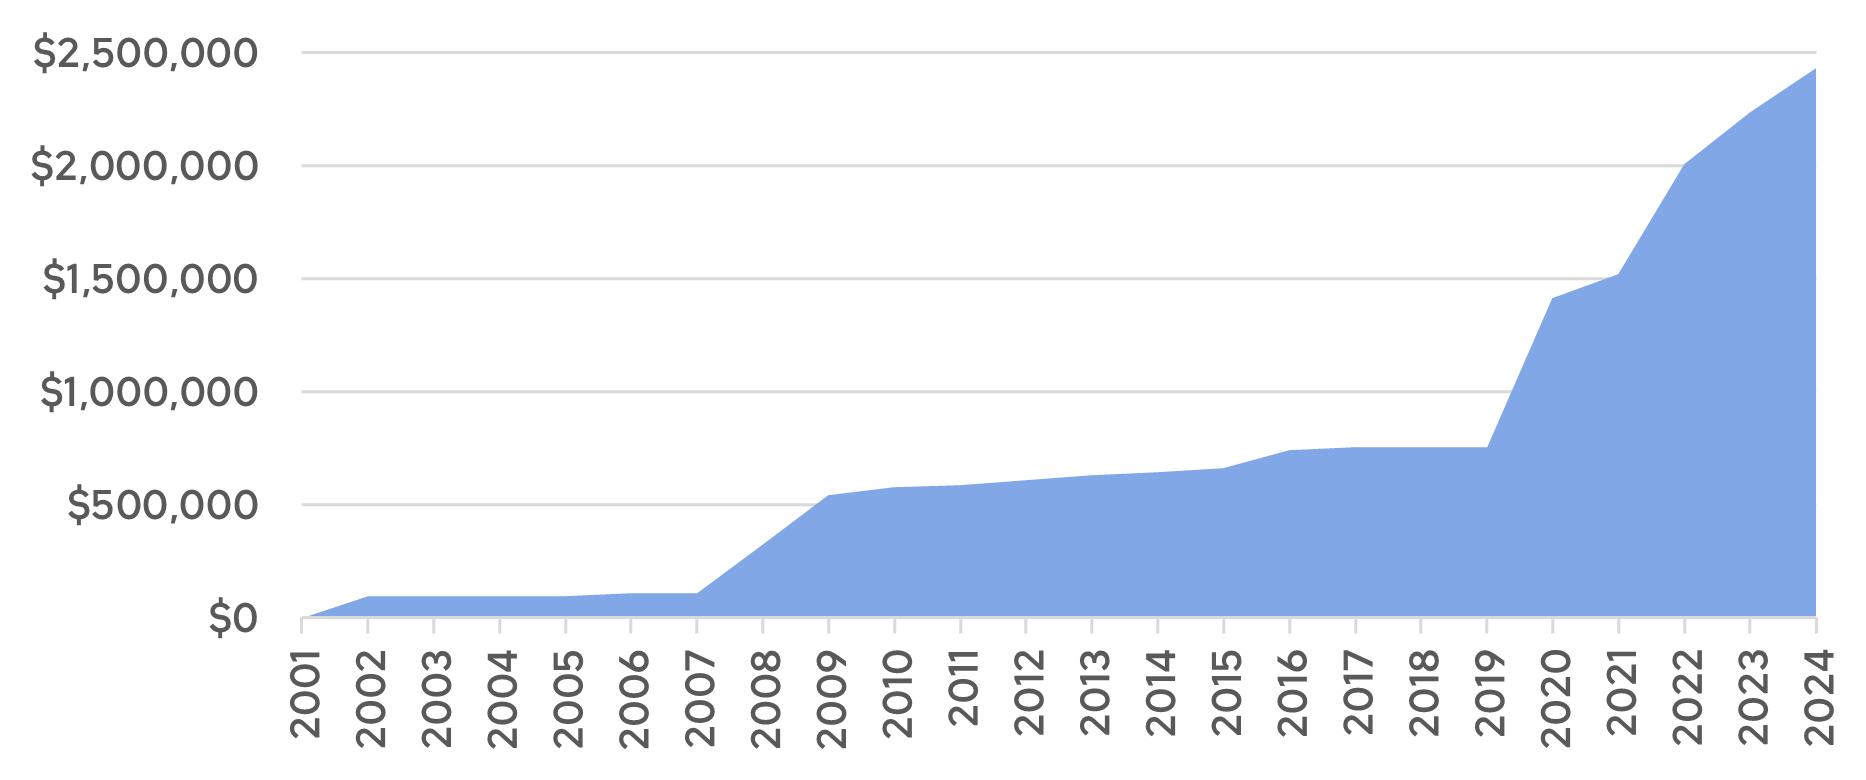
Since 2001, property owners of historic residential buildings have invested $2,432,064 in Qualified Rehabilitation Expenditures (QREs) for projects that utilized the State Residential Historic Rehabilitation Tax Credit program.2 Not only did 2020 see the most projects under this program, but also the highest amount of QREs ($662,349).
CUMULATIVE STATE RESIDENTIAL HISTORIC REHABILITATION TAX CREDIT QUALIFIED REHABILITATION EXPENDITURES
Source: Indiana Department of Natural Resources, Division of Historic Preservation and Archaeology (SHPO)
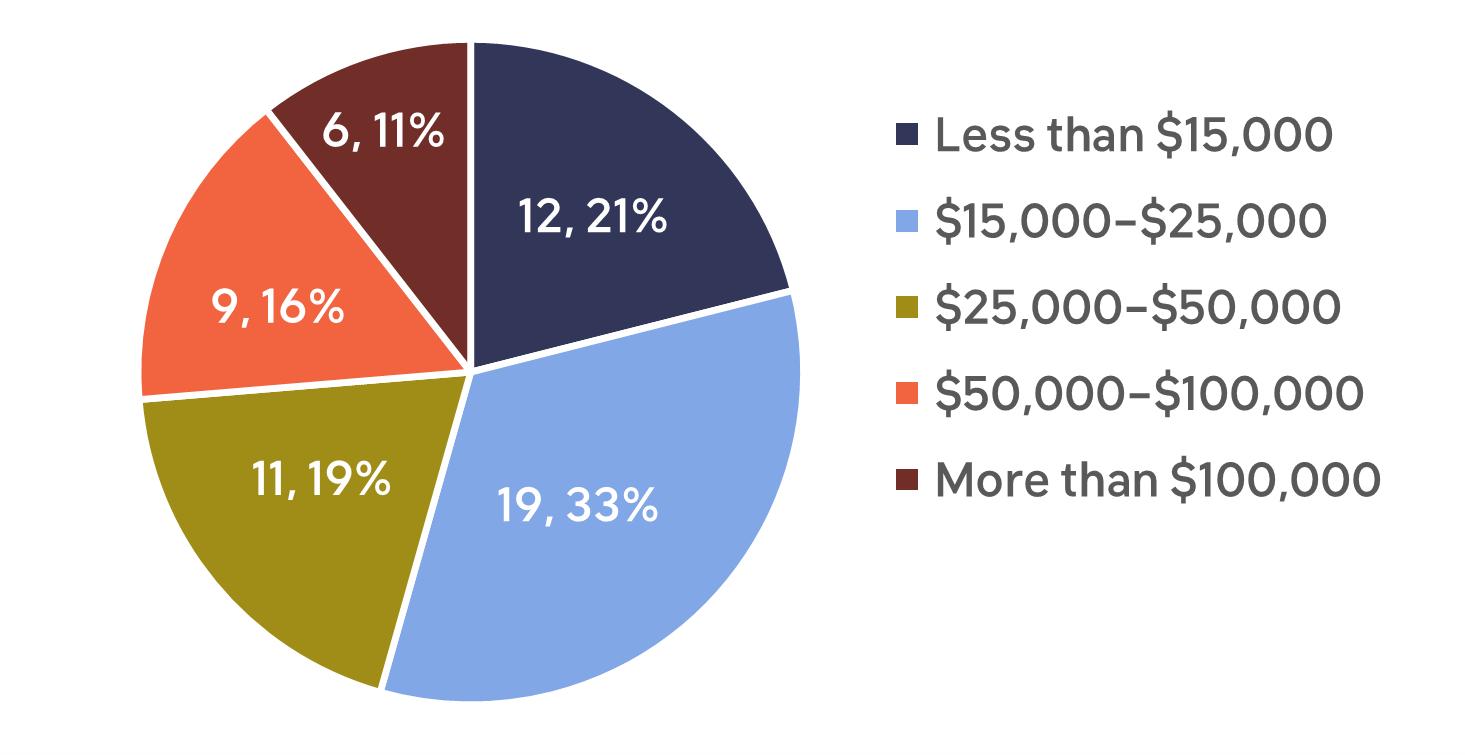
In order to be eligible for the State Residential credit, property owners must make a minimum investment of $10,000. Given that this credit is designed for primary residences, it’s not surprising that the scale of projects under this program is on the smaller size. Seventy-four percent of the projects that have utilized this credit have had QREs less than $50,000.
STATE RESIDENTIAL HISTORIC TAX CREDITS BY QUALIFIED REHABILITATION EXPENSES
Source: Indiana Department of Natural Resources, Division of Historic Preservation and Archaeology (SHPO)
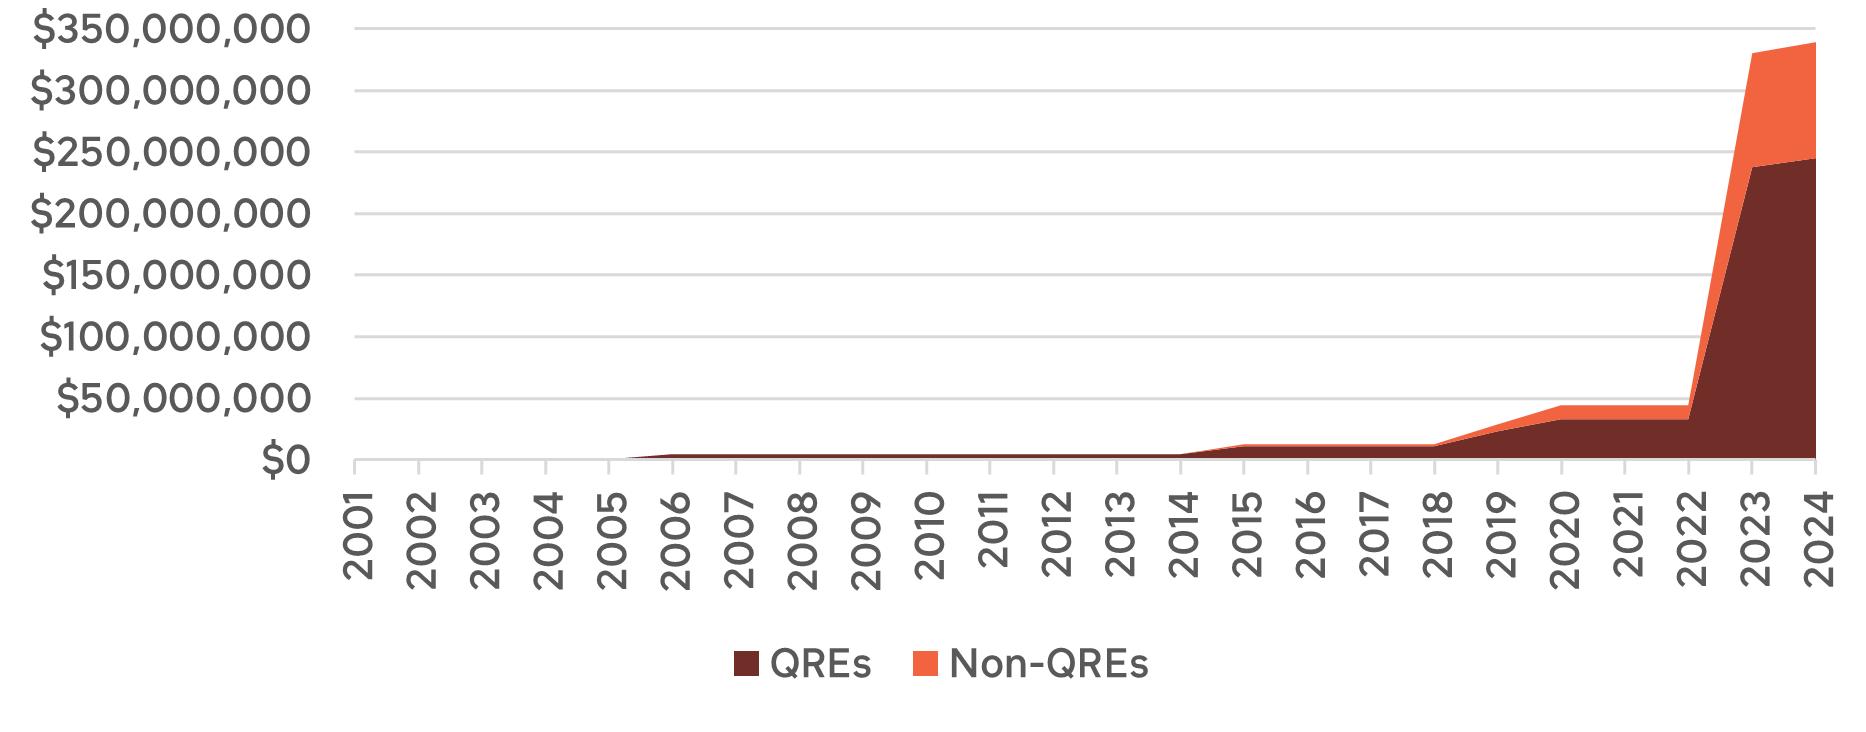
Overall, $244,995,496 in QREs have been invested in projects that have either utilized the Federal Historic Tax Credit program by itself or has paired it with the previous iteration of the State Historic Tax Credit. An additional $94,321,432 was invested in these projects on non-QRE costs, or costs that were not eligible for inclusion in the QREs. In total, almost $340 million has been invested in these projects in Fort Wayne.
CUMULATIVE FEDERAL ONLY AND FEDERAL + STATE HISTORIC TAX CREDIT INVESTMENT
Source: Indiana Department of Natural Resources, Division of Historic Preservation and Archaeology (SHPO)
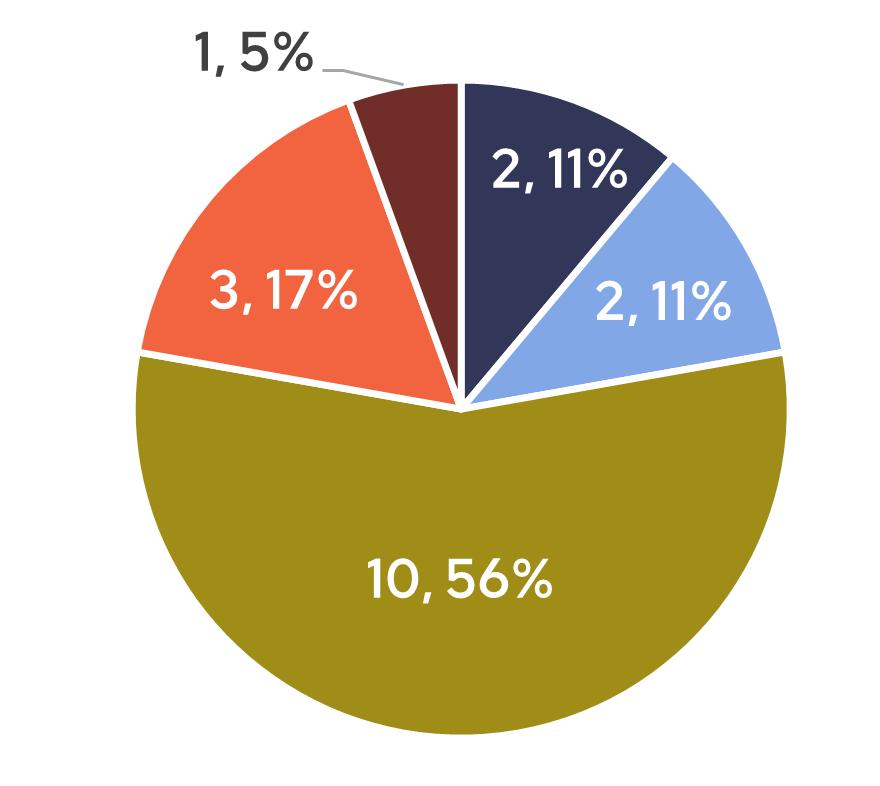
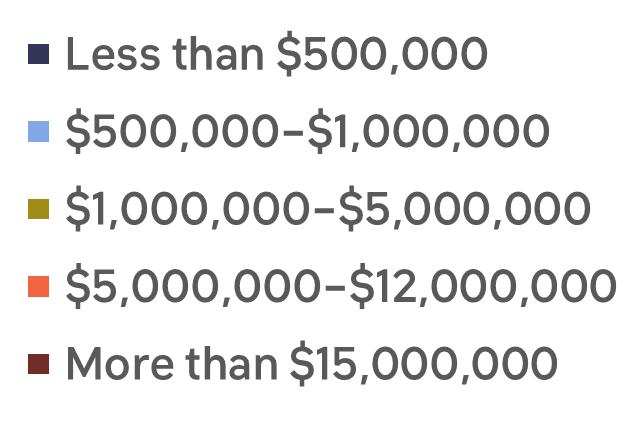
The Federal and State historic tax credits are typically used on large, income-producing projects. These historic tax credits have supported projects of all sizes. Seventy-eight percent of all Federal Historic Tax Credits in Fort Wayne have been used on projects that have a total project cost of less than $5,000,000.
FEDERAL HISTORIC TAX CREDIT PROJECTS BY QUALIFIED REHABILITATION EXPENDITURE AMOUNT
Source: Indiana Department of Natural Resources, Division of Historic Preservation and Archaeology (SHPO)
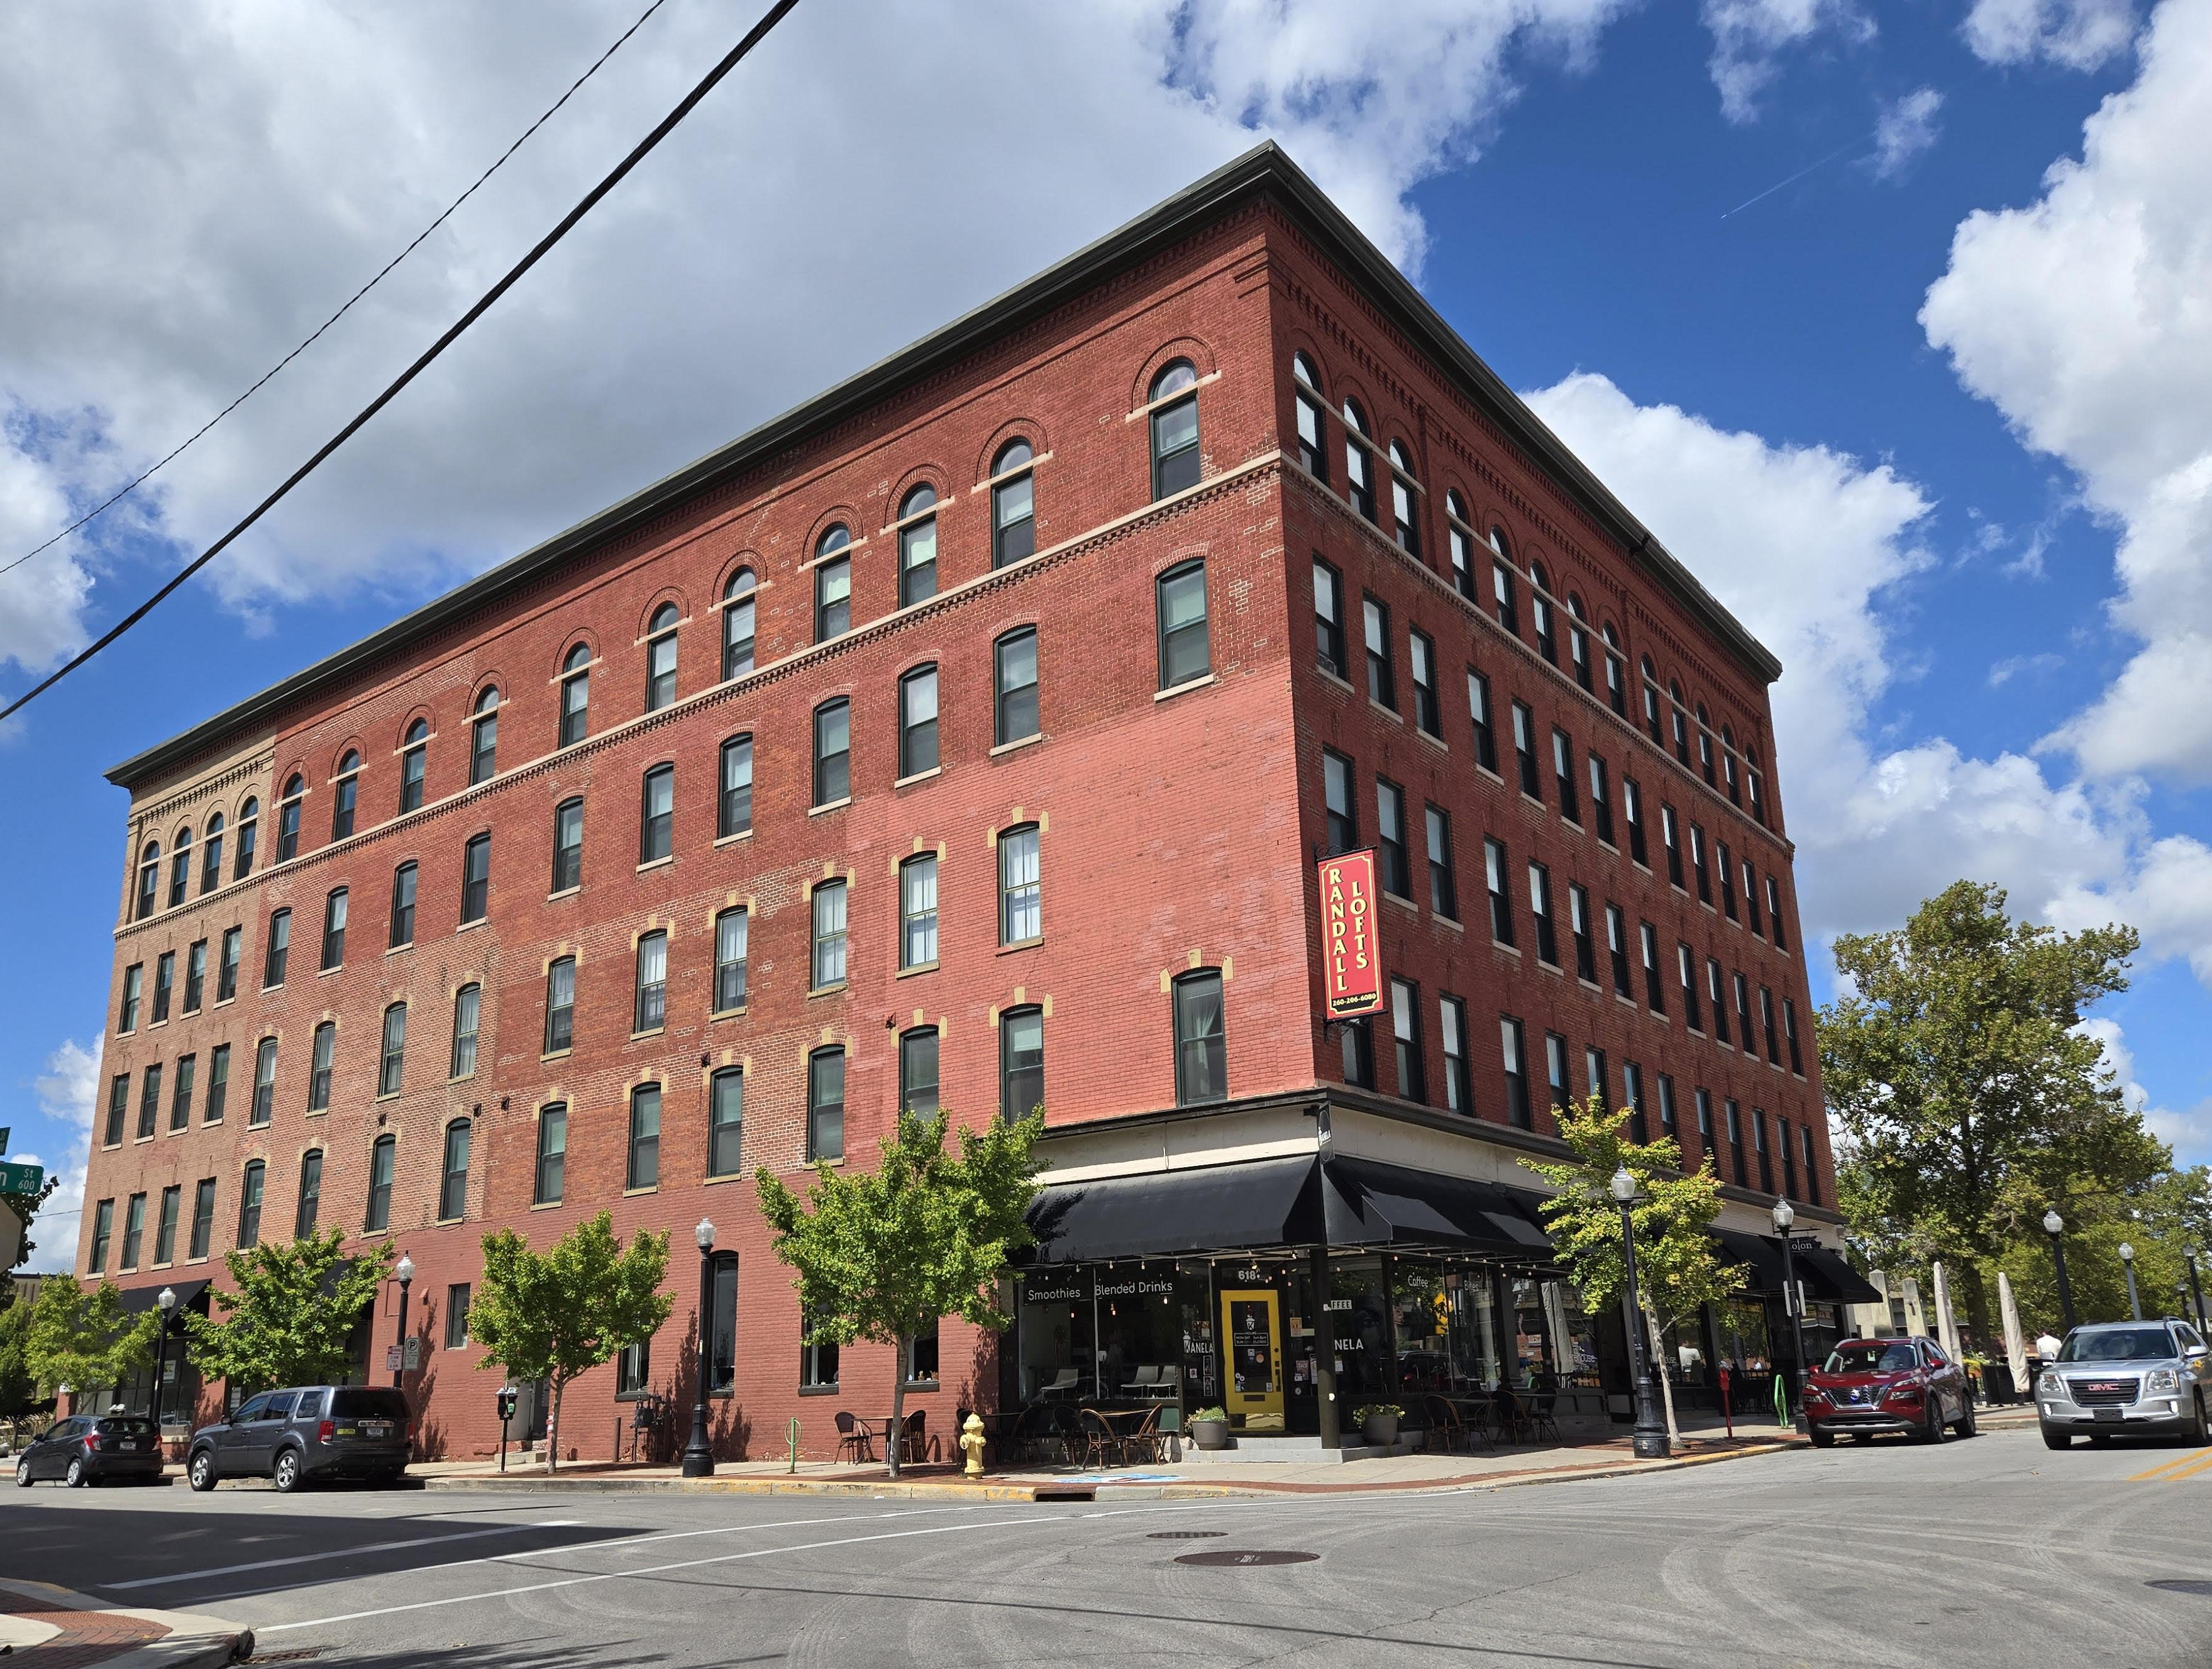
The Randall building in the Landing Historic District was rehabilitated into lofts using state and federal historic tax credits in 2015. The project created 44 housing units.
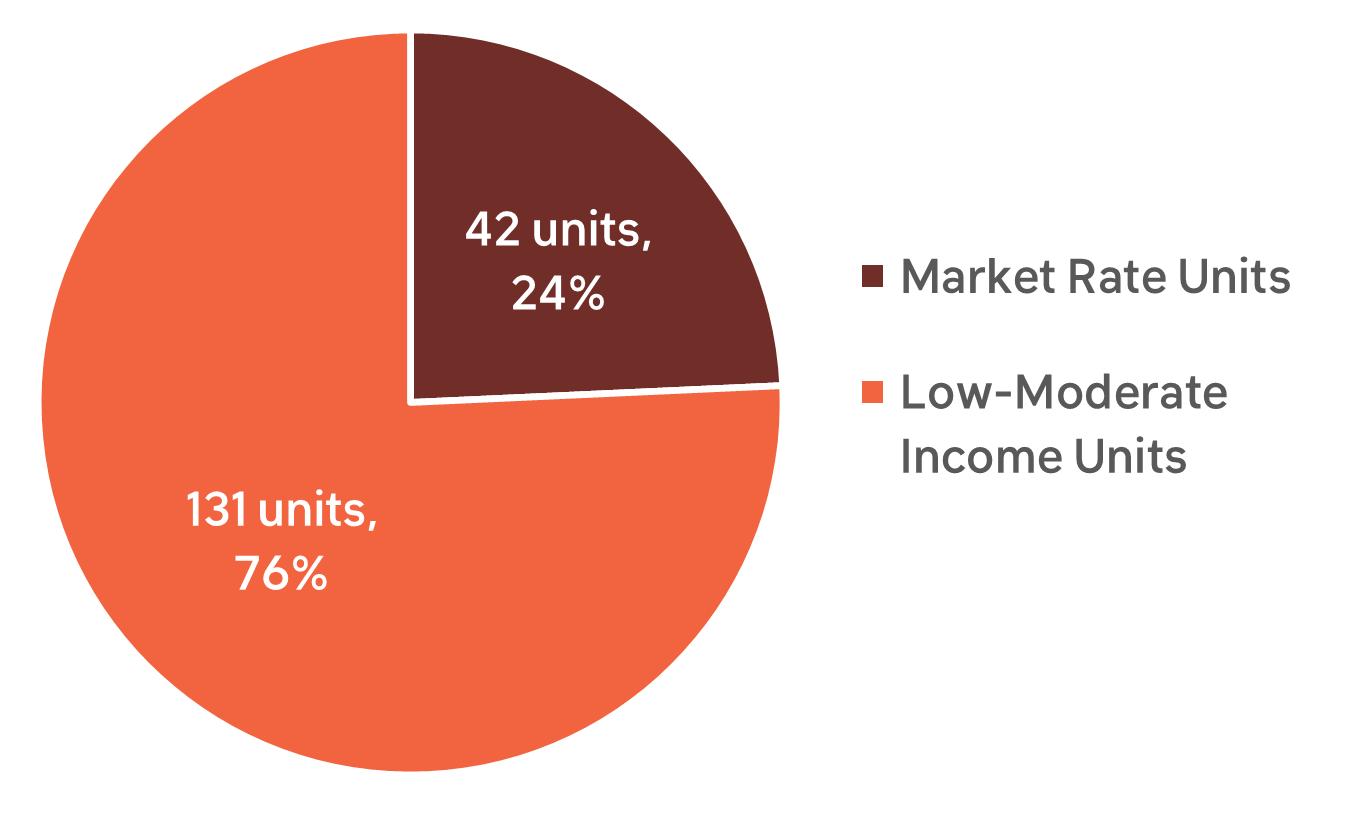
Historic tax credits are powerful tools for transforming vacant and underutilized buildings into housing. Overall, federal and state income producing tax credit projects have created 173 housing units, 76% of which are affordable to low- to moderateincome households.
HOUSING UNITS CREATED FROM STATE AND FEDERAL HISTORIC TAX CREDIT PROJECTS (2001-2024)
Source: Indiana Department of Natural Resources, Division of Historic Preservation and Archaeology (SHPO)
Jobs and Labor Income from Historic Tax Credit Projects
Over the last 10 years (2014-2024), historic tax credit investment has created each year, on average:

258 jobs

$18,230,345
(154.2 direct jobs +103.8 indirect/ induced jobs) in labor income
($11,985,669 direct labor income + $6,244,675 indirect/ induced labor income)
Local governments have been major beneficiaries of the significant increase in historic preservation tax credit activity. In the last decade, local governments have received more than $500,000 in tax revenues from these projects. This compares with only $7,000 in the prior 10 years.
What are direct, indirect, and induced jobs?
A “direct job” is a job that is created by the project. In the case of historic rehabilitation, that would include a carpenter, plumber, electrician, etc. “Indirect jobs” are not created by the project but are supported by it. In this case, the salesperson at the lumberyard or the truck driver who delivered materials to the job site are good examples of indirect jobs. An “induced” job is a job that is supported by employees’ own spending on goods and services with wages earned through direct and indirect jobs.
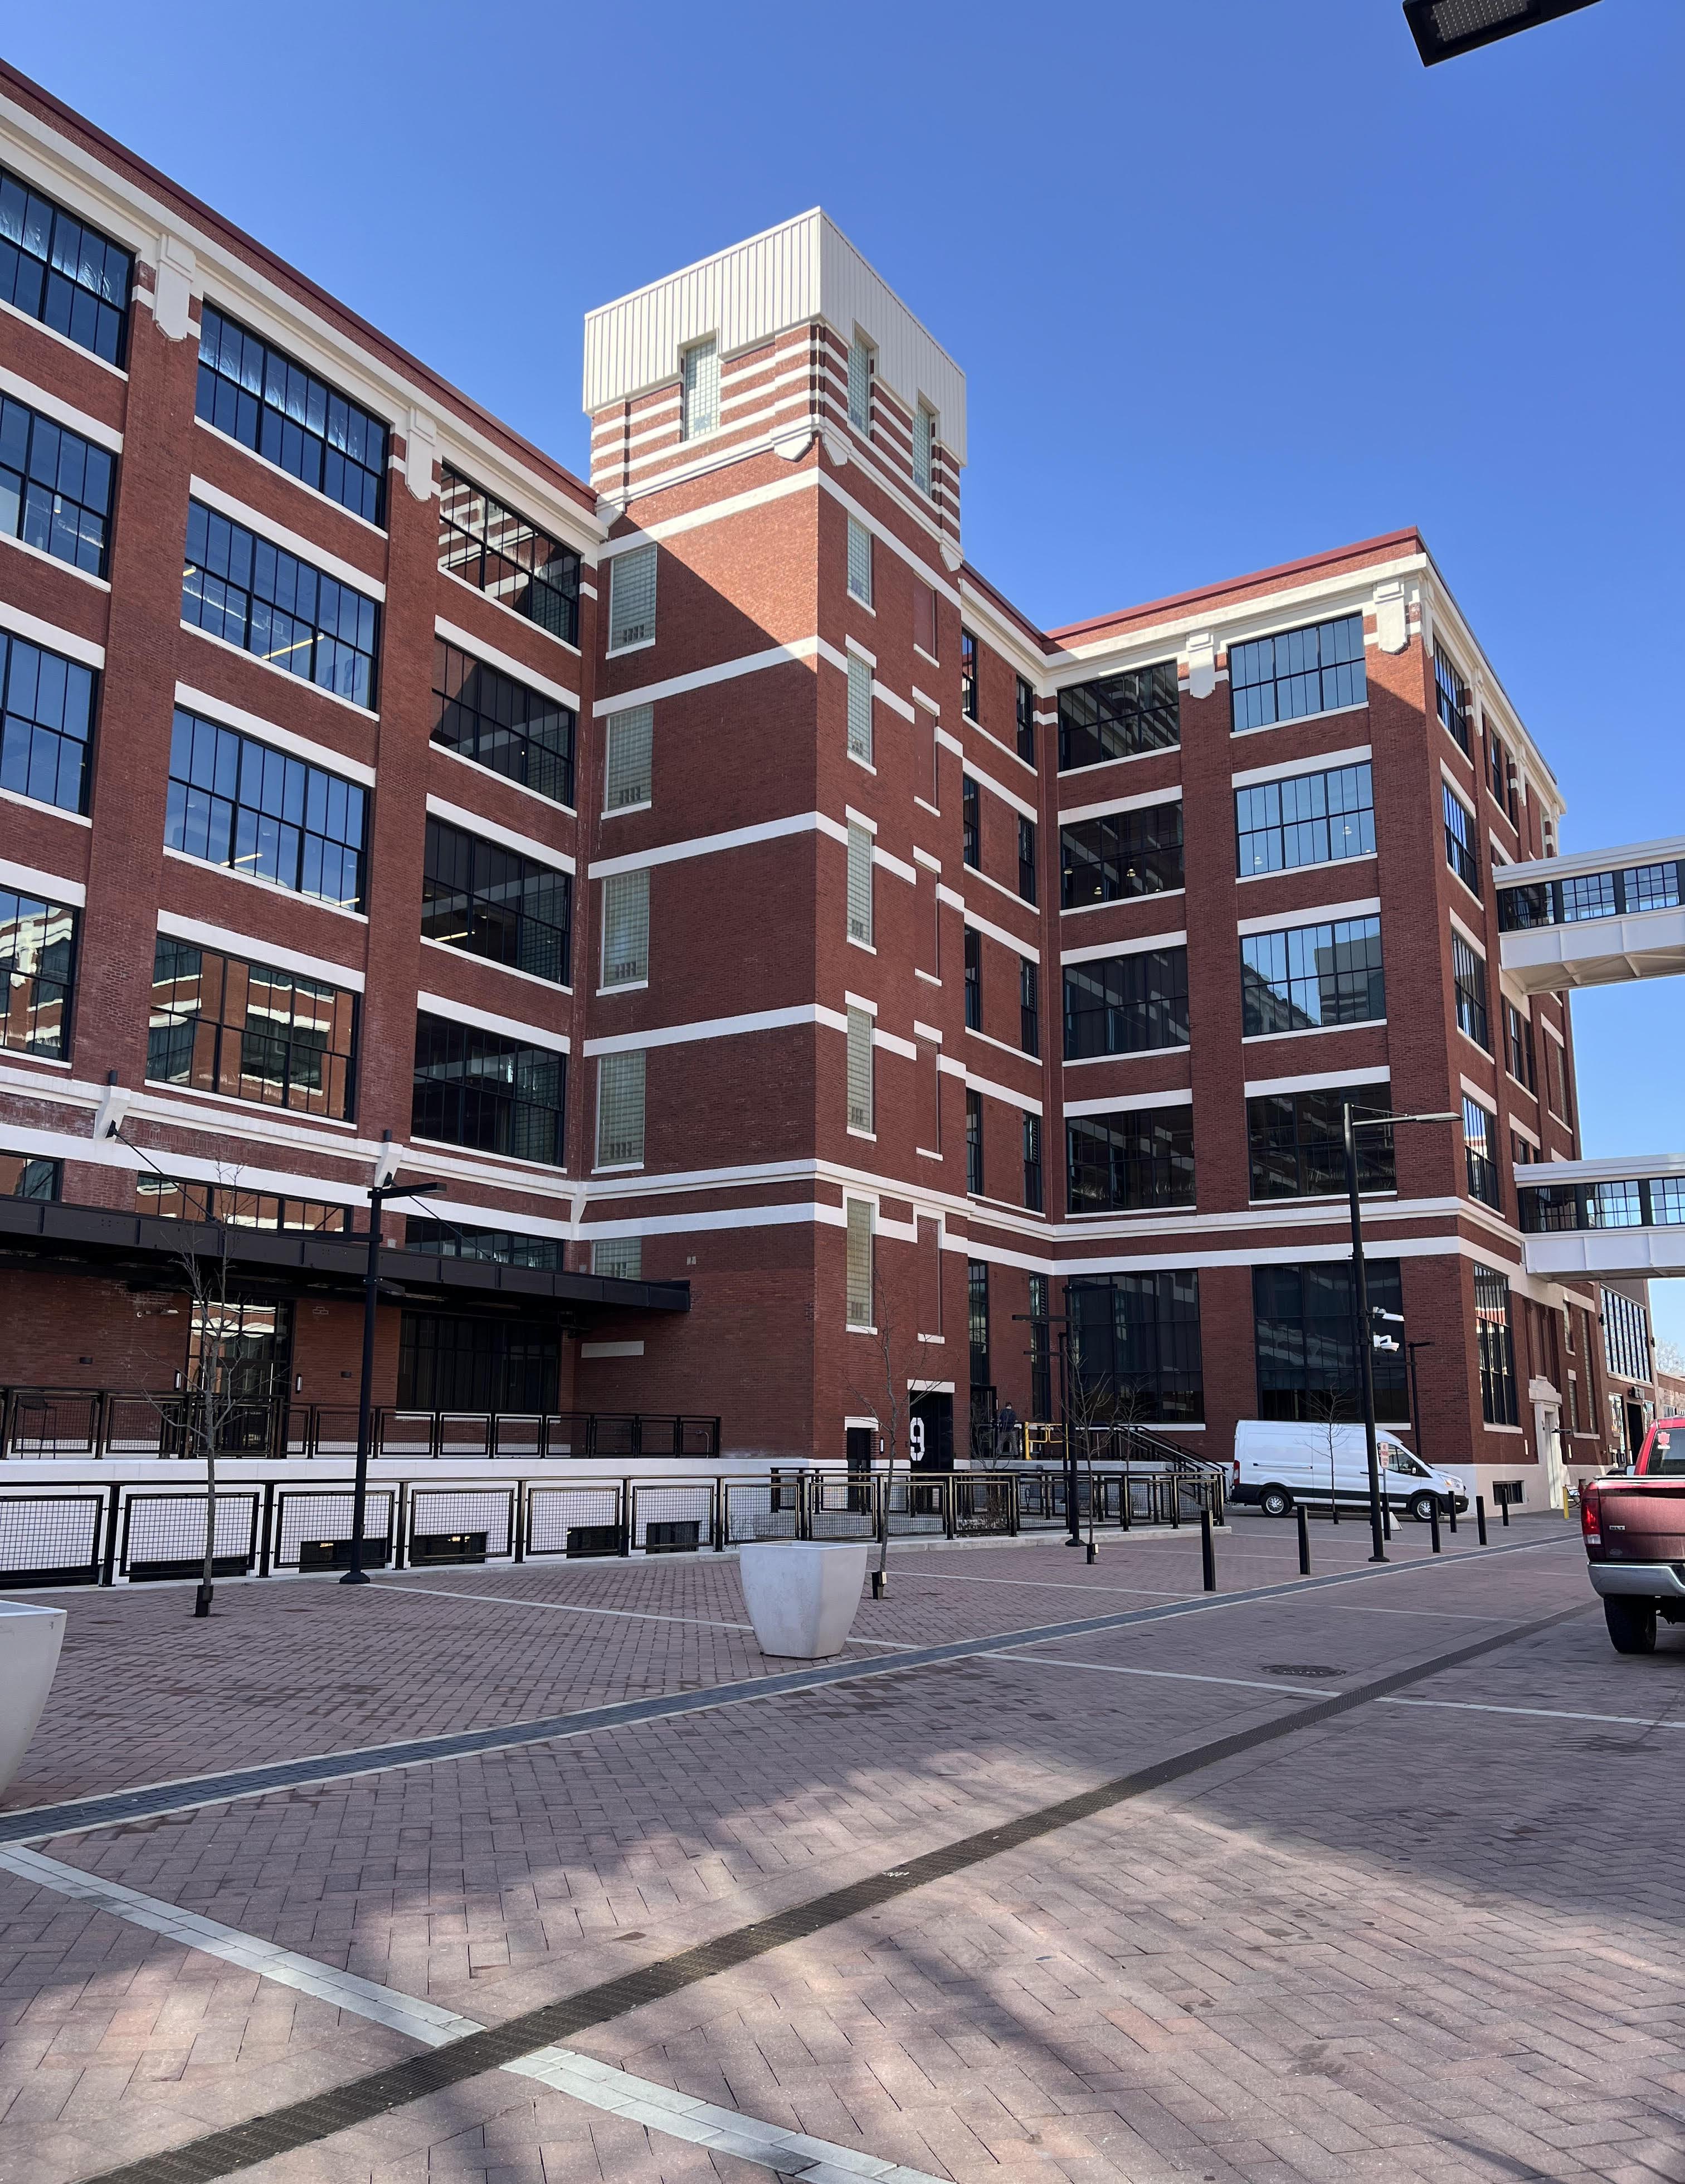
Electric Works is a great example of 21st Century redevelopment and re-purposing of a historic industrial campus. What was once the employment center for a third of Fort Wayne’s workforce has become the next wave of business and job creation and innovation. Beginning in the late 19th Century as the Jenney Electric Light Company, then later as General Electric (GE), this 39-acre site has been the home to thousands of workers over time. After GE closed in 2015, there was concern about what might happen to this important piece of Fort Wayne history.
Today, after nearly $300 million in investment, the site has been reactivated, with new businesses filling the once vacant space. Phase One brought the Do It Best corporate headquarters, the K&K Insurance Group corporate headquarters, a public high school program focused on science, technology, engineering, arts and math, a primary care and health clinic, food court, public art, and space for other entrepreneurial endeavors. Future phases will include housing, additional commercial and retail space, recreation space, a childhood learning center, and advanced manufacturing. Electric Works has taken one of Fort Wayne’s most historic buildings and sites and made a statement for what the 21st Century can look like in Fort Wayne and throughout Indiana.
Building Investment
through Permit Activity
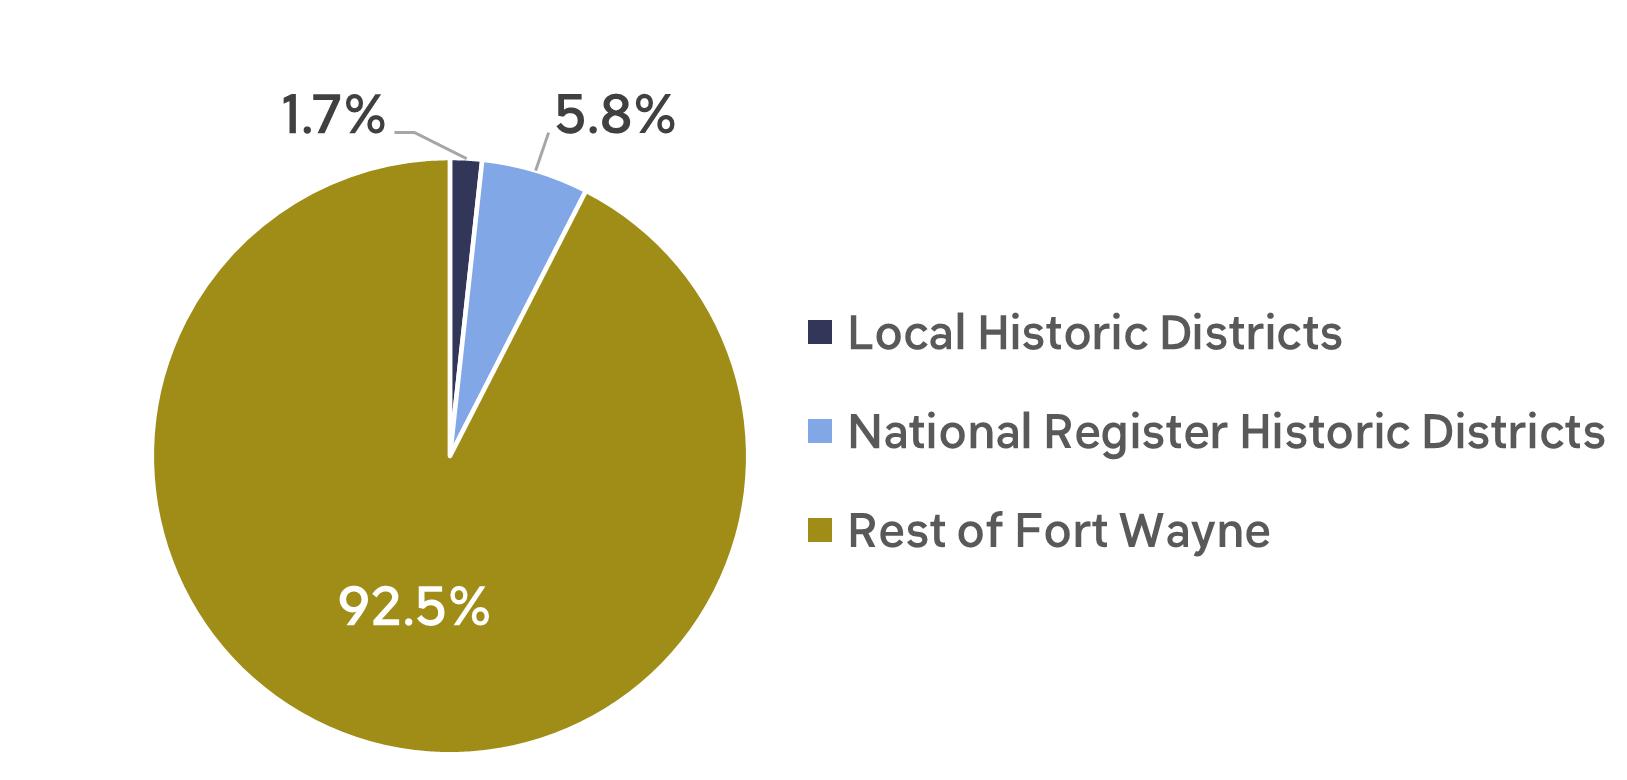
Almost 173,000 building permits were issued in Fort Wayne between 2010 and 2024. Of those permits, nearly 3,000 (1.7%) were in local historic districts, while another 10,000 (5.8%) were in National Register historic districts.
SHARE OF BUILDING PERMITS
(2010-2024)
Source: Permit Systems, IT Department, Allen County, Indiana
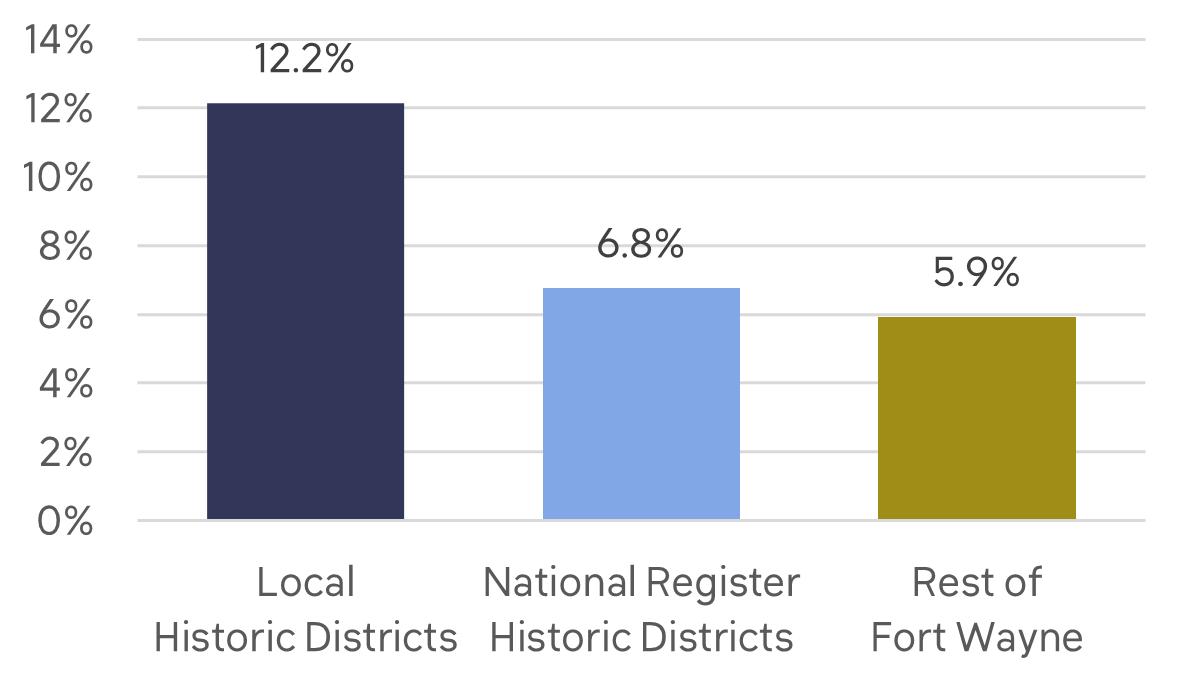
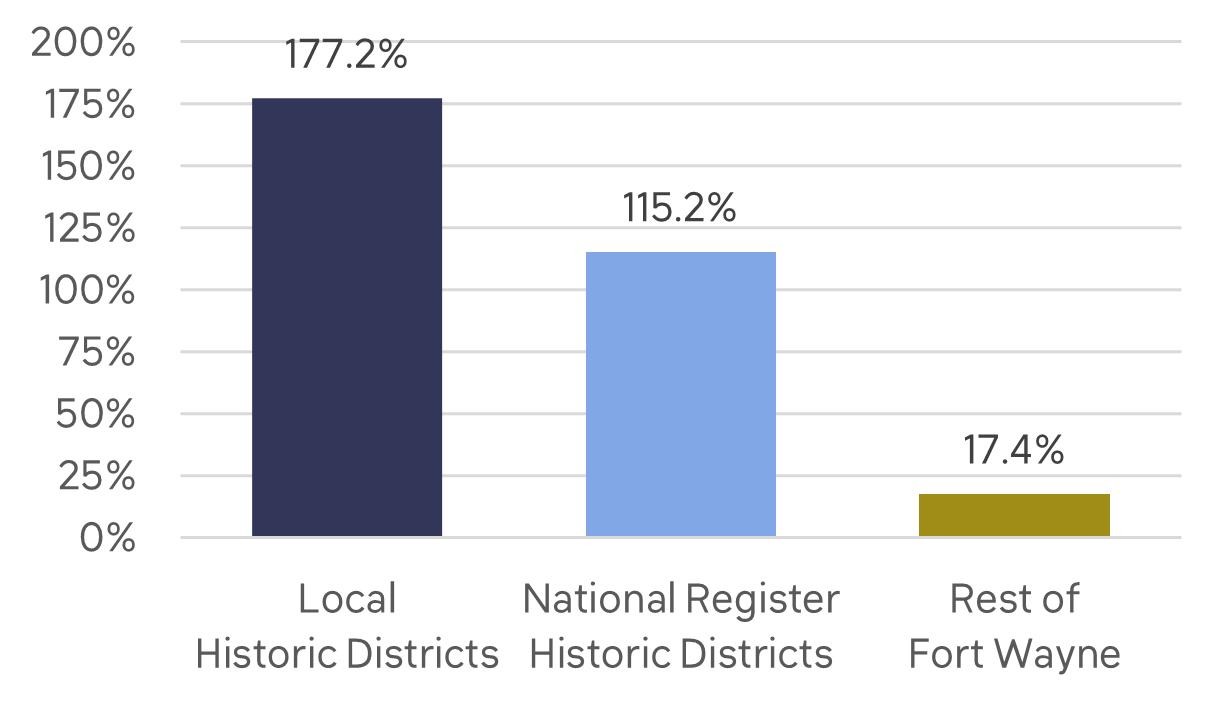
On average, local historic districts have seen a 12% increase in the number of permits issued and a 177% increase in investment each year since 2010. That far outpaces the average annual increase in the number of permits and investment in National Register historic districts and the rest of the city. It is evident that the owners of historic properties in Fort Wayne take their stewardship responsibilities seriously.
AVERAGE ANNUAL CHANGE IN NUMBER OF PERMITS
AVERAGE ANNUAL CHANGE IN PERMIT INVESTMENT
Source: Permit Systems, IT Department, Allen County, Indiana
Jobs and Labor Income from Permit Investment
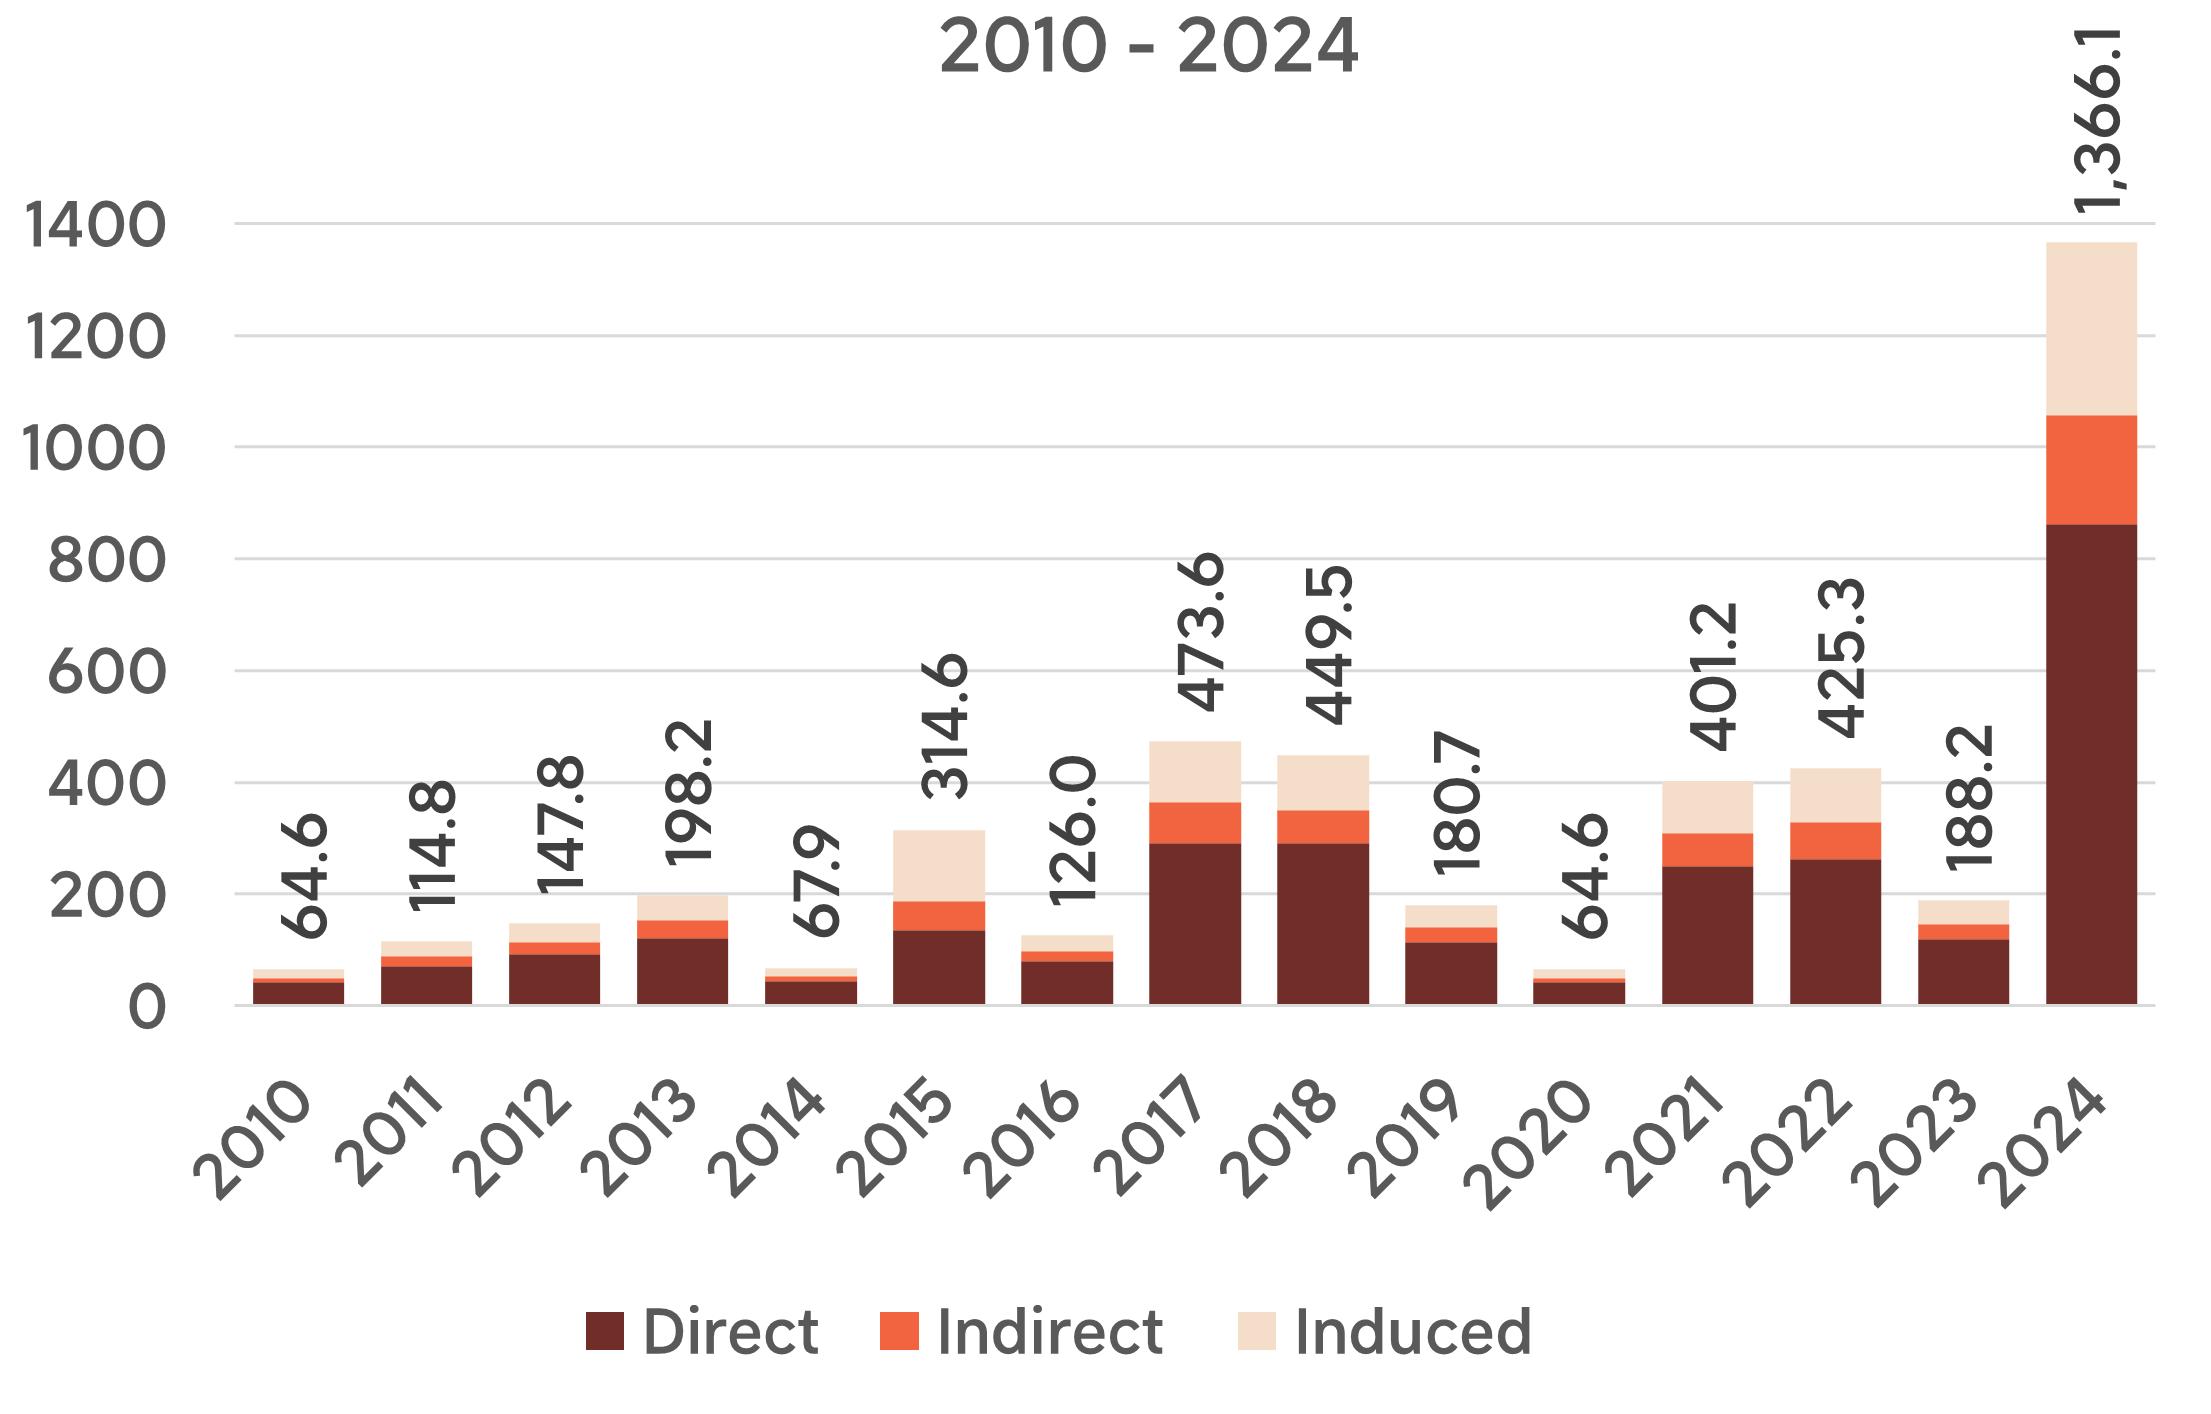
The year after year investment by owners of historic properties significantly impacts the Fort Wayne economy. Over the last fifteen years, an average of 188 direct jobs and an additional 118 indirect and induced jobs have been created in Fort Wayne each year as a result of this reinvestment. 2024 was an extraordinary year in terms of investment, so the averages are skewed somewhat. But even excluding 2024, an average of 139 direct jobs and an additional 90 indirect and induced jobs were generated by these construction activities. If historic rehabilitation was a single industry, it would be among the largest 50 employers in Allen County.3
Even excluding the exceptionally large Electric Works project (completed in 2024), rehabilitation projects have created an average of over 200 jobs a year in Fort Wayne.
JOBS CREATED BY CONSTRUCTION IN HISTORIC DISTRICTS, 2010 - 2024
Source: Permit Systems, IT Department, Allen County, Indiana and IMPLAN
3 The permit data and the data from the tax credit project cited earlier (pages 5-12) are not directly comparable. Tax credit numbers will reflect expenditures that do not have to be included in local building permit declarations. The jobs, income, and tax generation numbers above are actually less than were likely created, so this is a very conservative estimate of total impact. Also in many cases a single project will be included in both the Tax Credit numbers and the Permit Investment numbers, meaning there is some duplication of impacts. Therefore the two sets of numbers should not be combined for overall impact. That would be double counting some investment, jobs, labor income, and tax receipts.
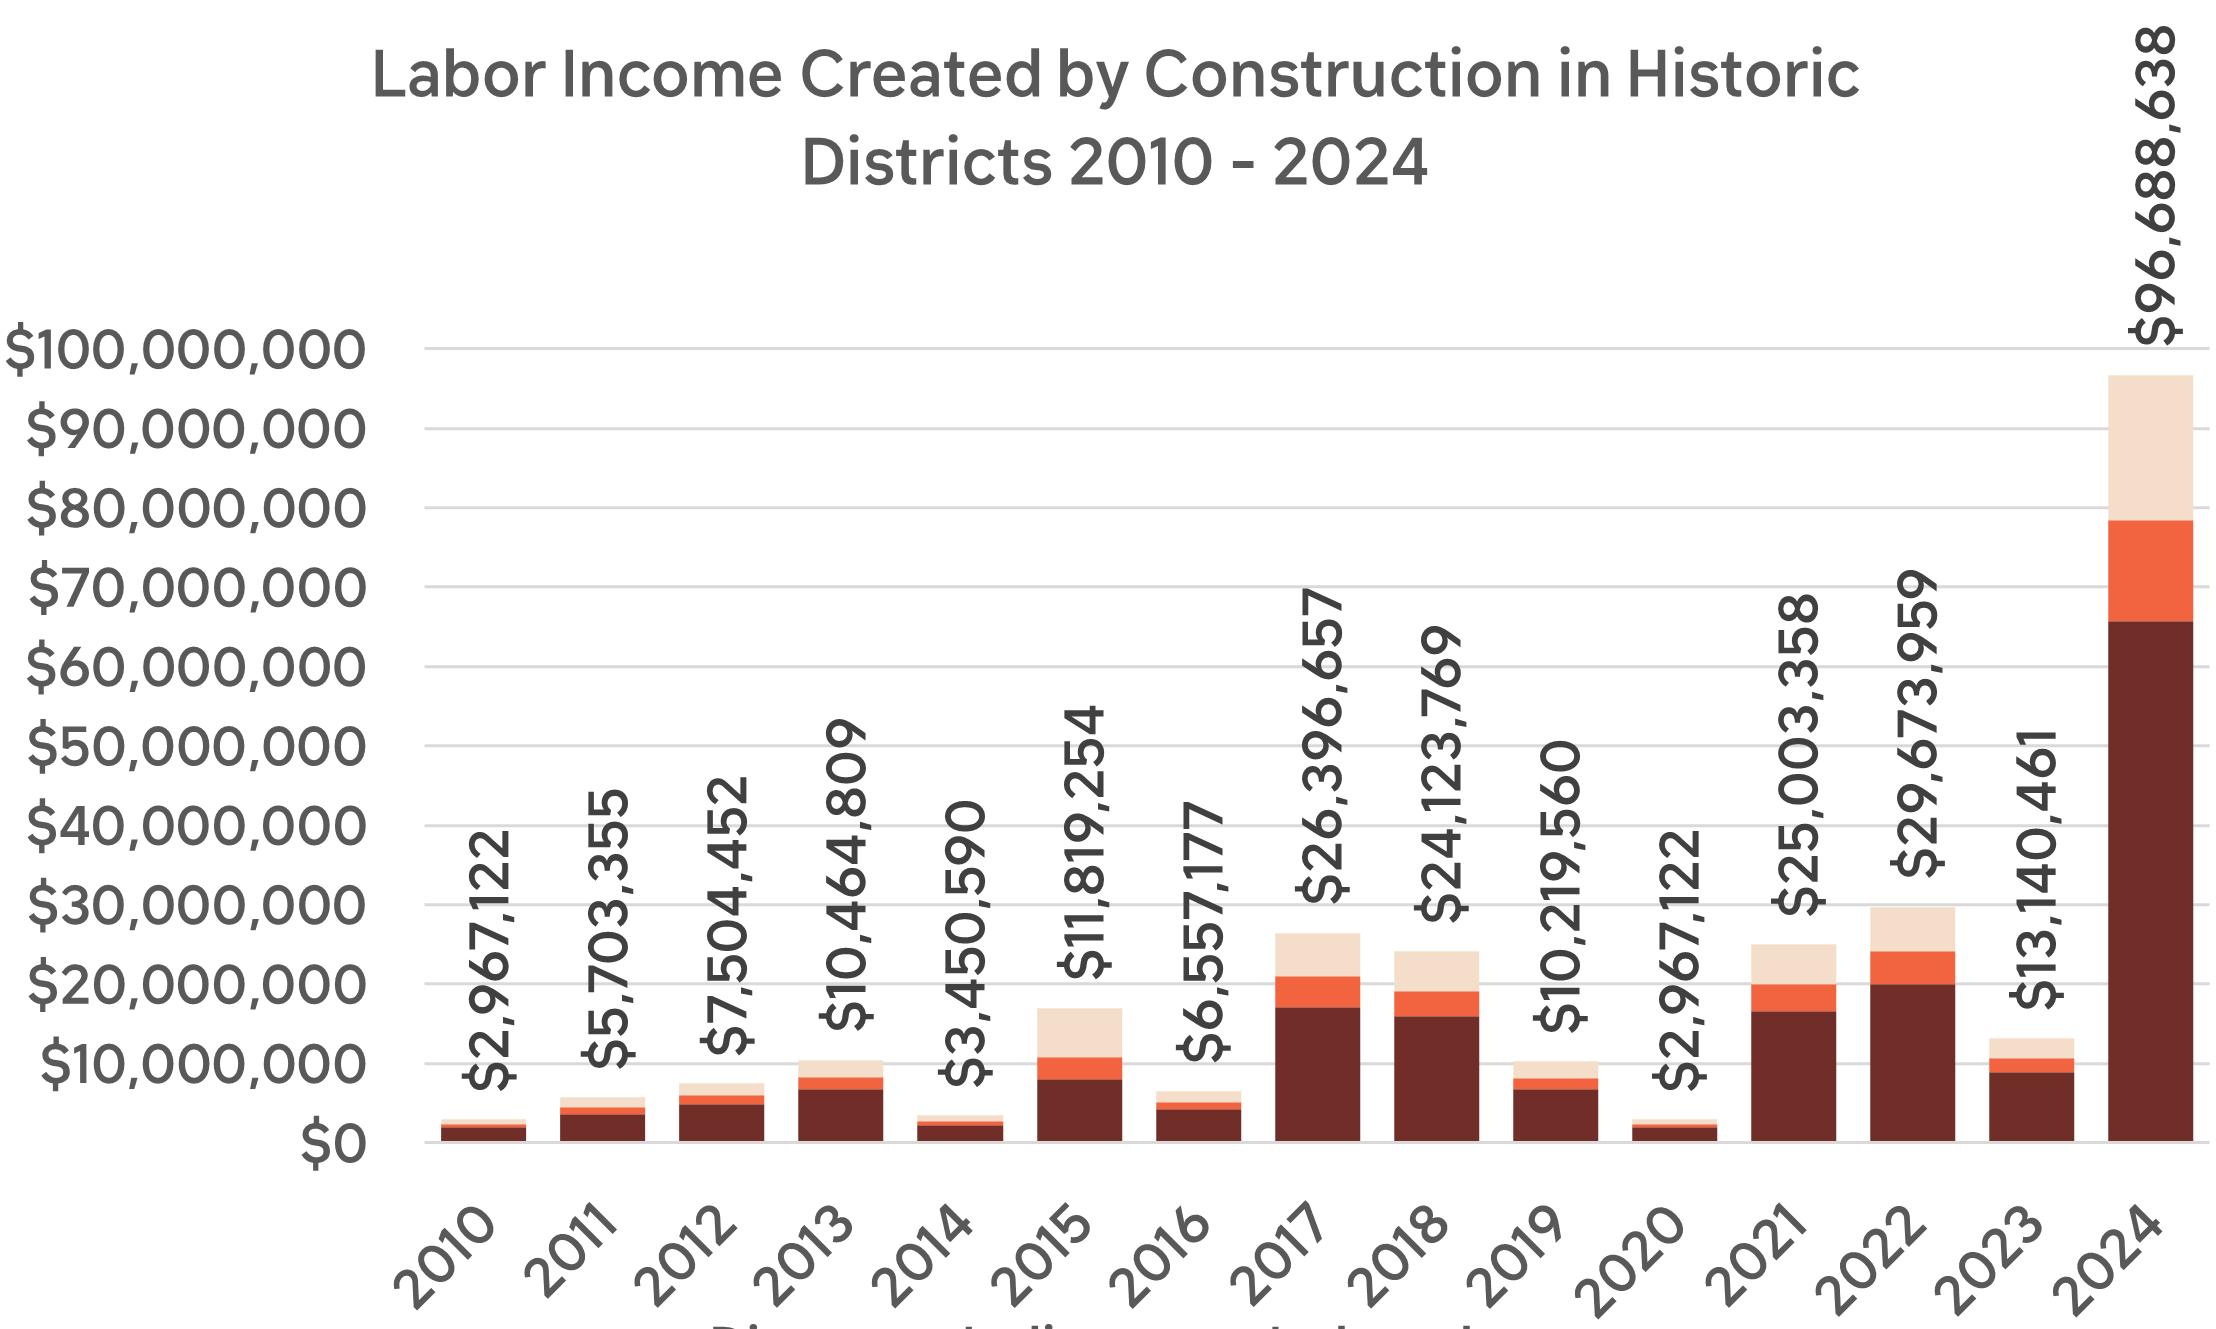
The jobs created by construction activity in historic districts also represent paychecks. Between 2010 and 2024, local workers have received paychecks totaling nearly $277 million ($185 million direct and $97 million indirect/induced). Again, even excluding the banner year of 2024, labor income from these projects averaged $8.5 million in direct payroll and an additional $4.7 million in indirect and induced salaries and wages.
LABOR INCOME CREATED BY CONSTRUCTION IN HISTORIC DISTRICTS, 2010 - 2024
Source: Permit Systems, IT Department, Allen County, Indiana and IMPLAN
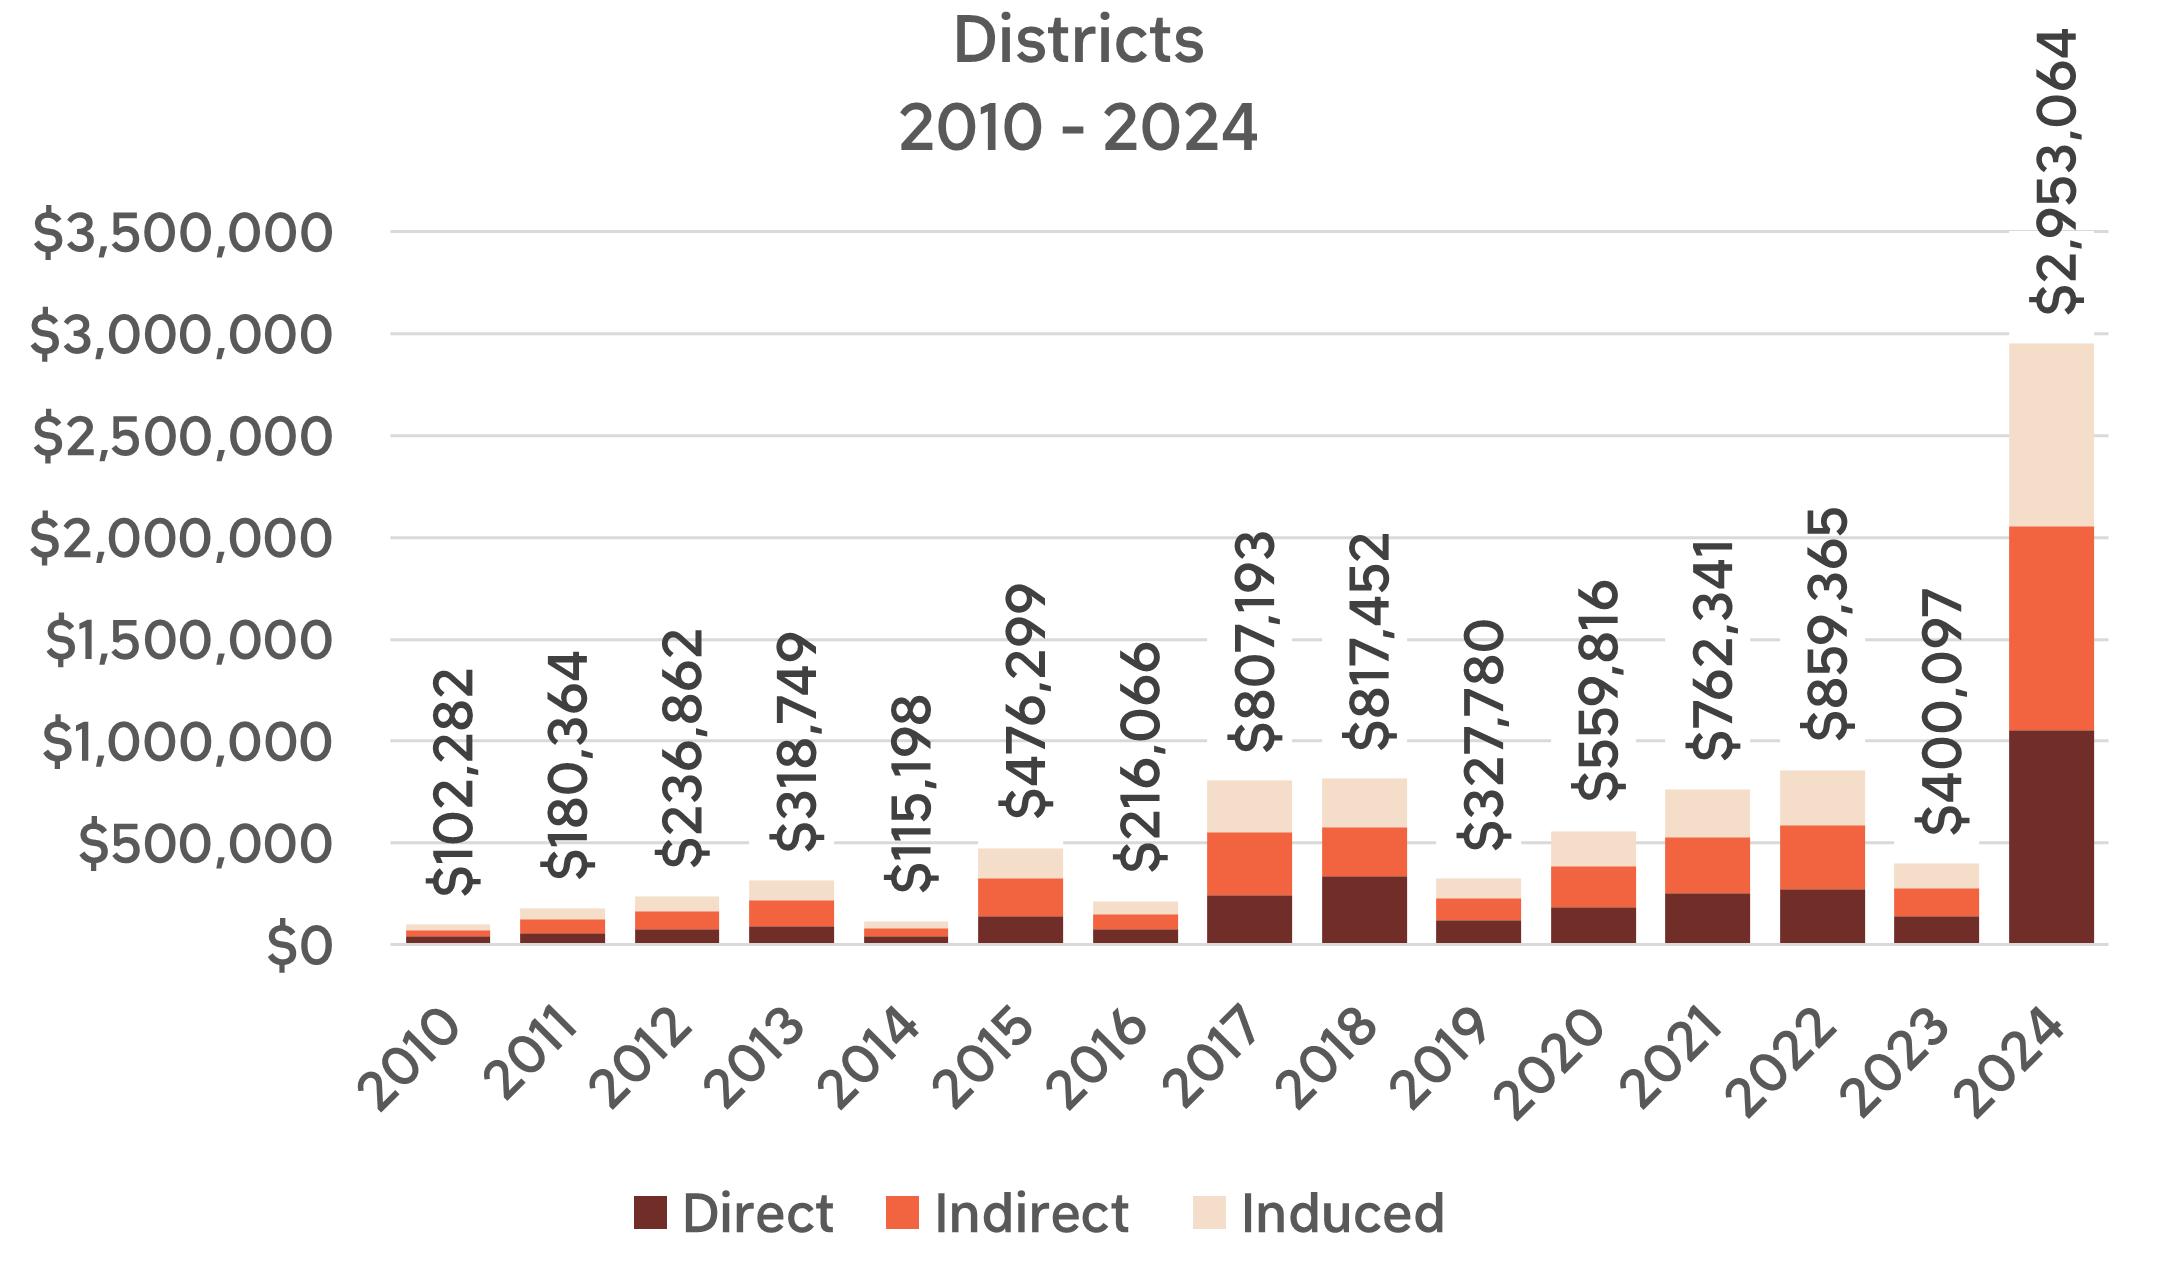
Fort Wayne is committed to preserving the city’s built heritage. This commitment provides educational, cultural, and environmental benefits. But it also creates financial returns. Over the last fifteen years, local governments in Allen County have received a total of more than $9 million ($3.1 million direct plus $6 million indirect/ induced) from the historic rehabilitation activity in Fort Wayne’s Local and National Register historic districts.
LOCAL TAXES GENERATED BY CONSTRUCTION IN HISTORIC DISTRICTS, 2010 - 2024
Certificates of Appropriateness
The Fort Wayne Historic Preservation Commission (HPC) is empowered to preserve and protect historically or architecturally worthy buildings, structures, sites and districts that serve as visible reminders of the historic heritage of the city. The HPC enforces the provisions found in the Fort Wayne Historic Preservation and Protection Ordinance (Chapter 151 of City Code). When changes are proposed to properties, and if the changes are “subject to public view,” the HPC staff reviews the work for approval, or schedules the application for an HPC meeting. When work is approved by staff or the Commission, a Certificate of Appropriateness (COA) is issued to the contractor or property owner.
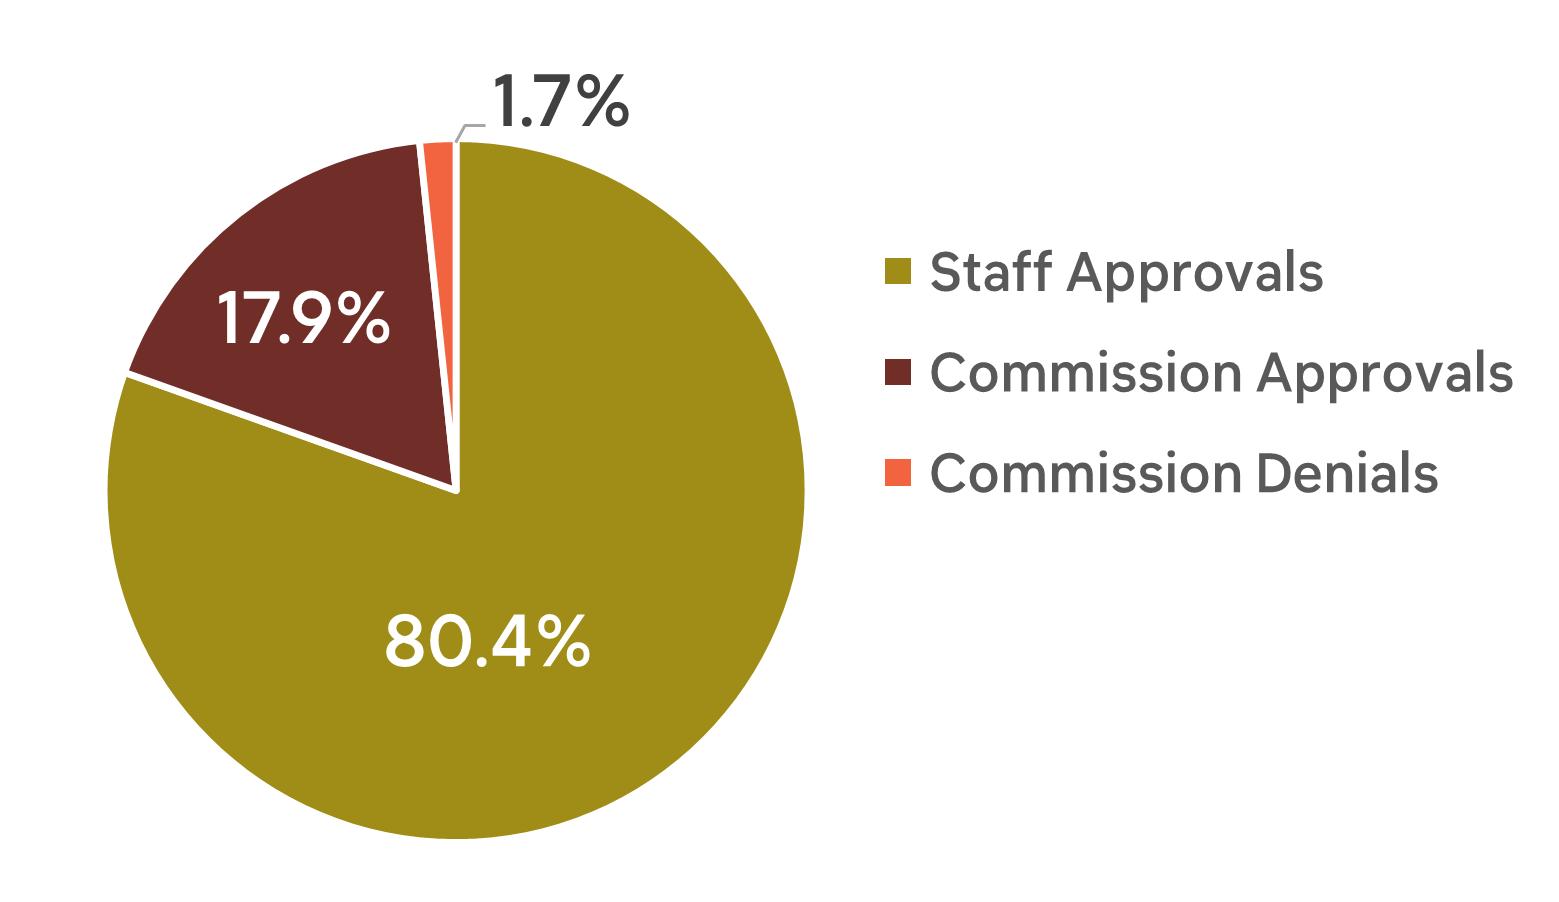
CERTIFICATE OF APPROPRIATENESS ACTIONS
Source: Fort Wayne Department of Planning and Policy, Historic Preservation & Culture
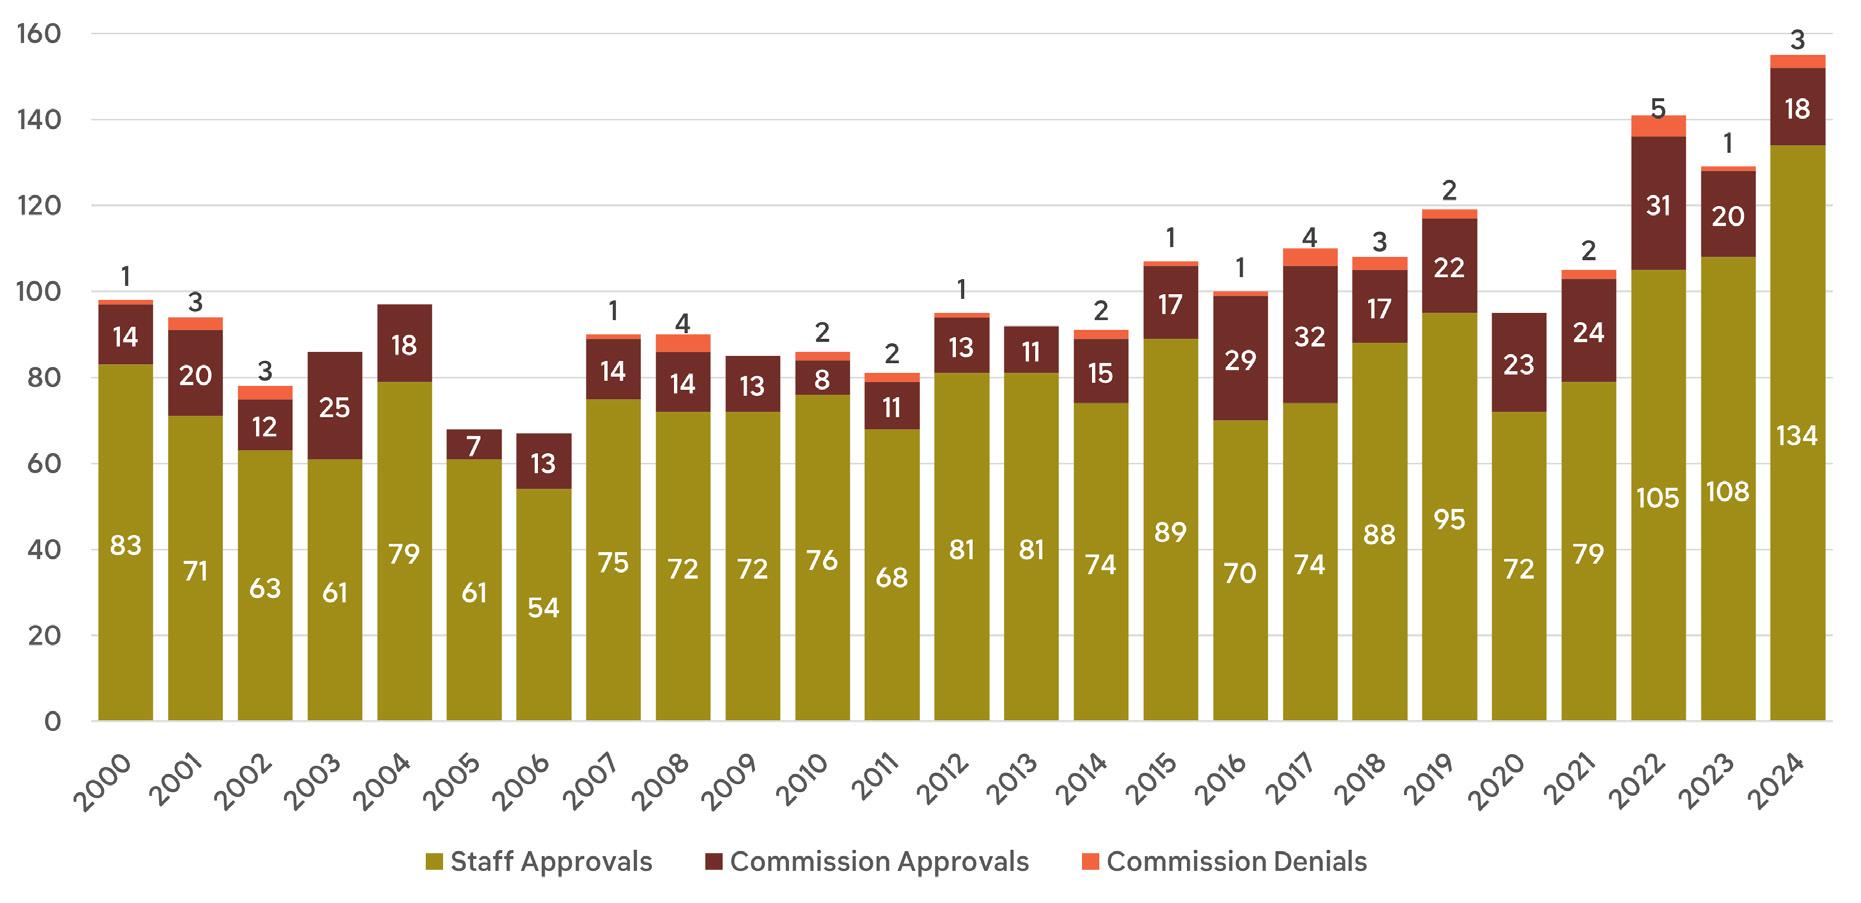
Since 2000, approximately 2,467 Certificate of Appropriateness (COA) applications have come before either the Historic Preservation (HP) staff or the Historic Preservation Commission. Of those, the great majority–almost 80.4% or 1,985–have been approved at the staff level, while another 19.5% (or 482) were reviewed by the Commission. Overall, only 41 (1.7%) of the 2,467 COAs were denied by the Historic Preservation Commission.
While the number of COAs reviewed each year has fluctuated over time, HP staff reviewed and approved a record number of applications in 2024.
COA ACTIVITY BY YEAR
Source: Fort Wayne Department of Planning and Policy, Historic Preservation & Culture
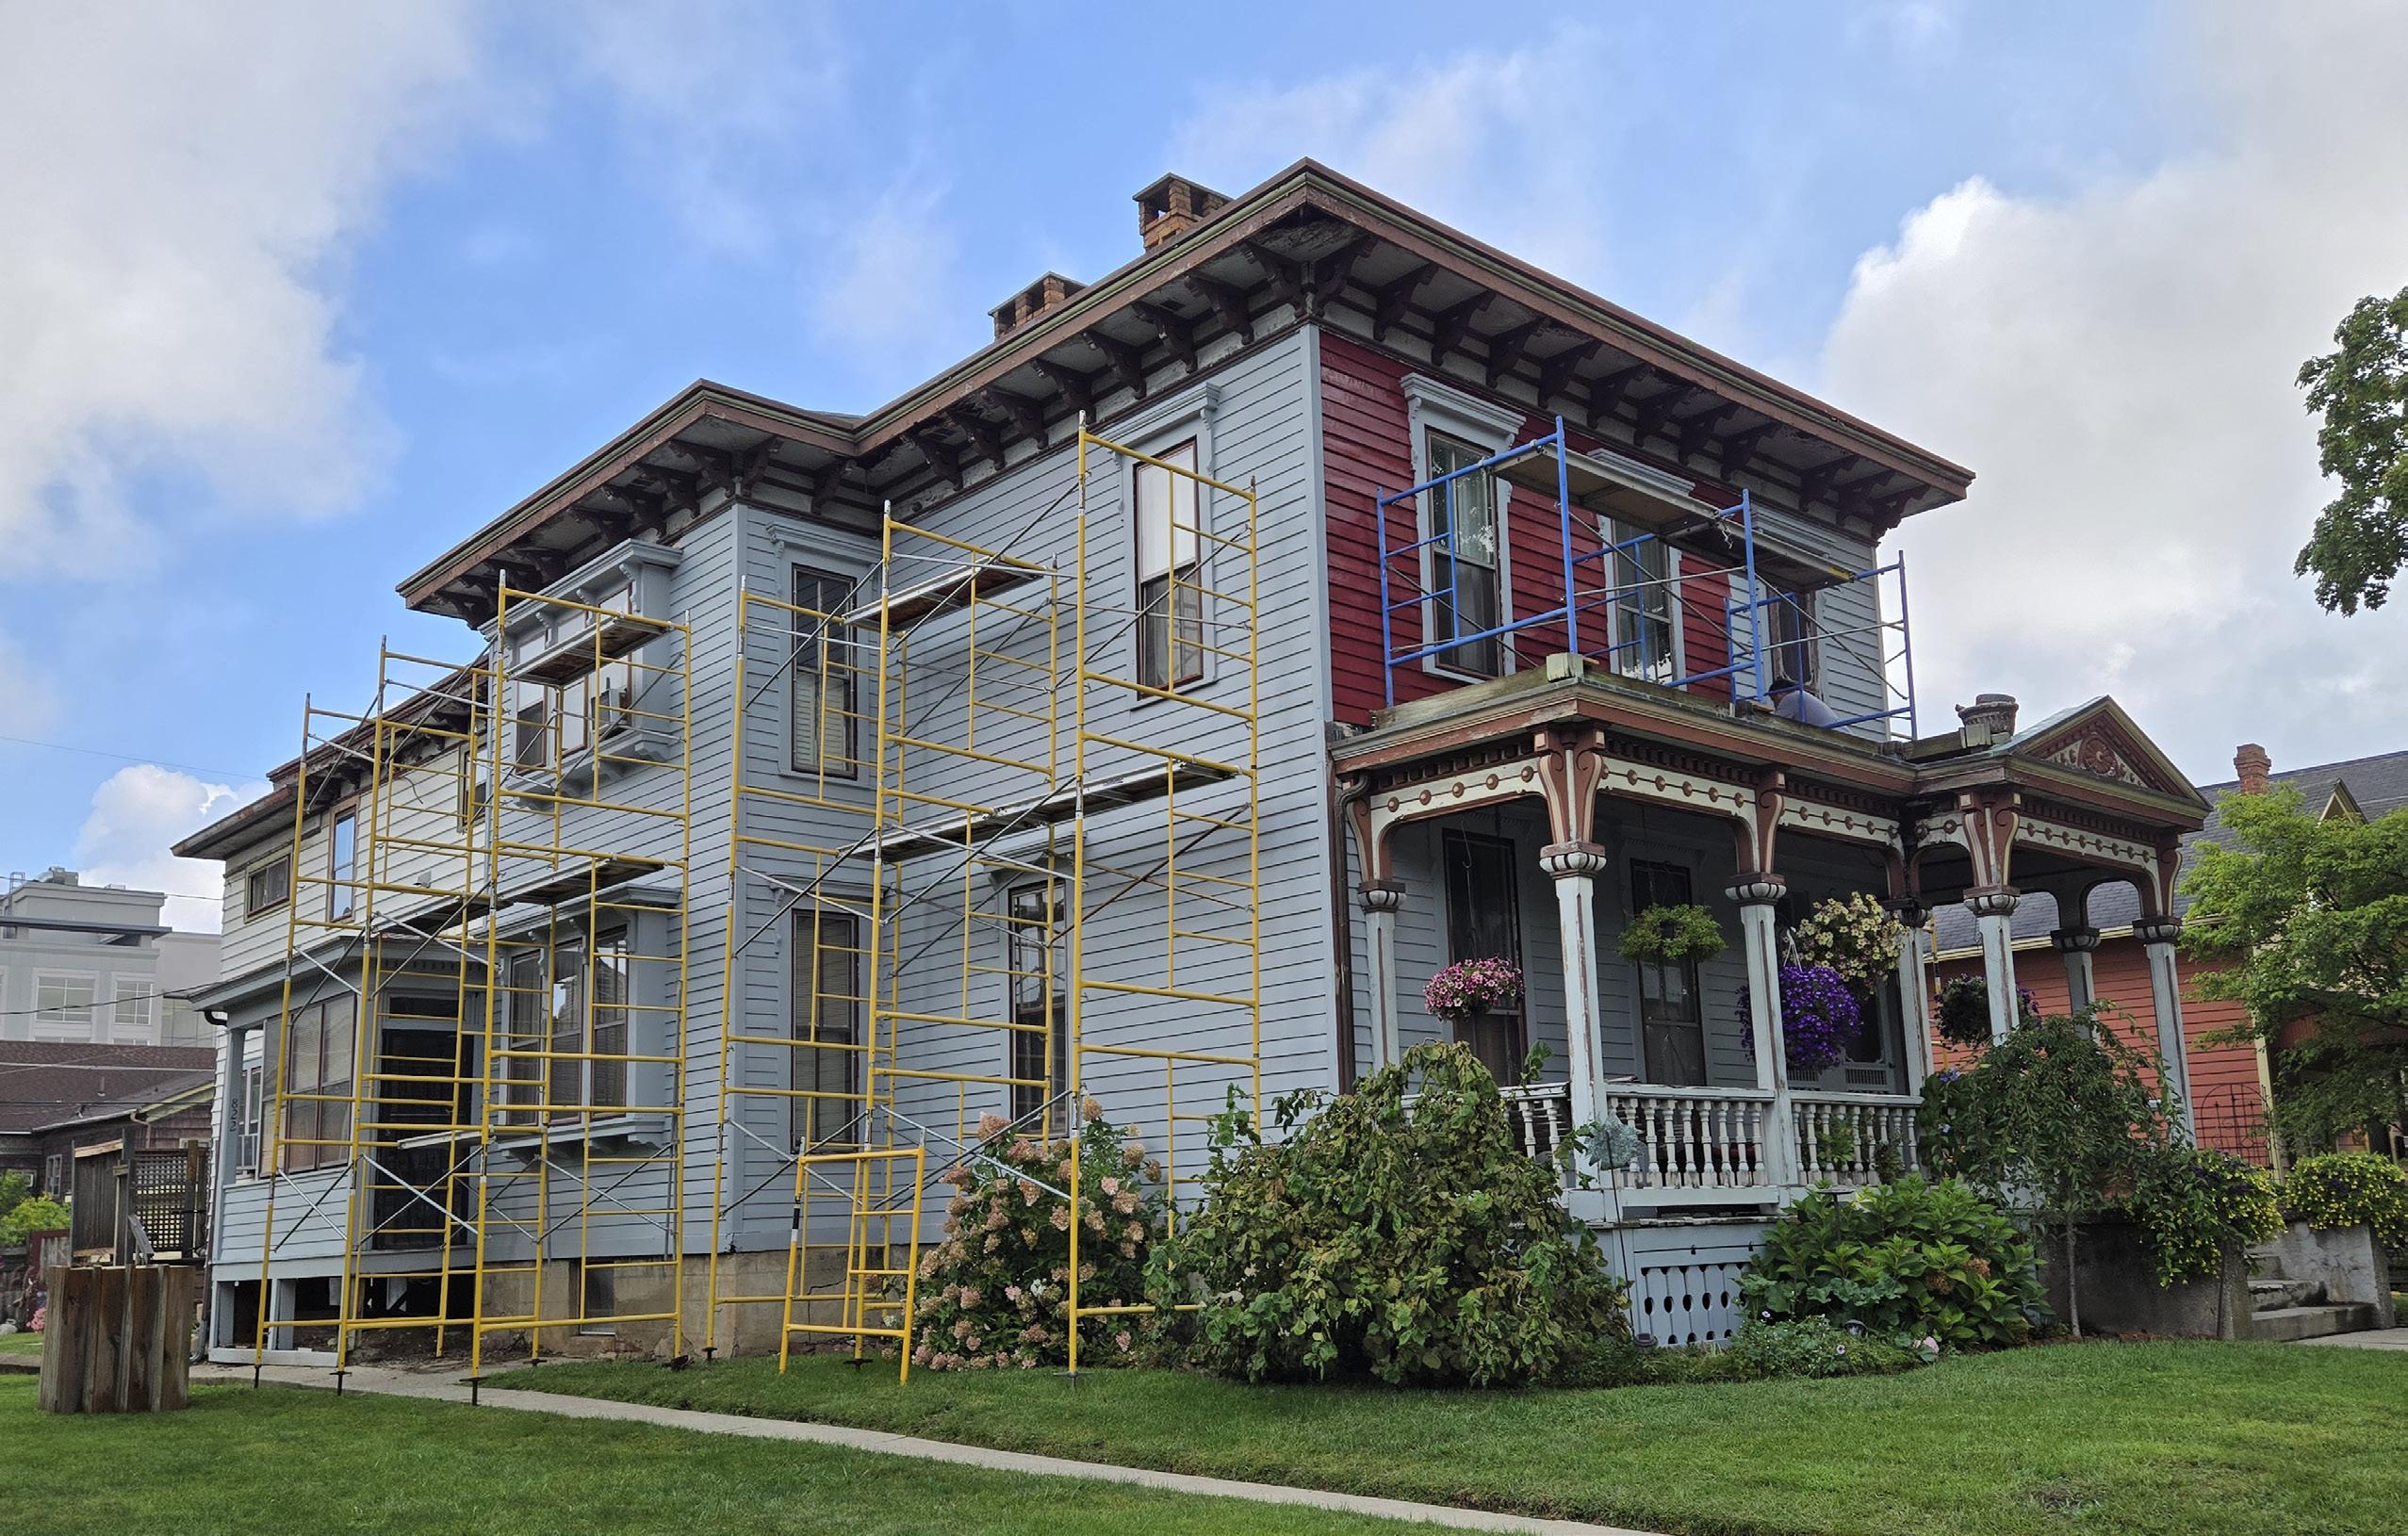
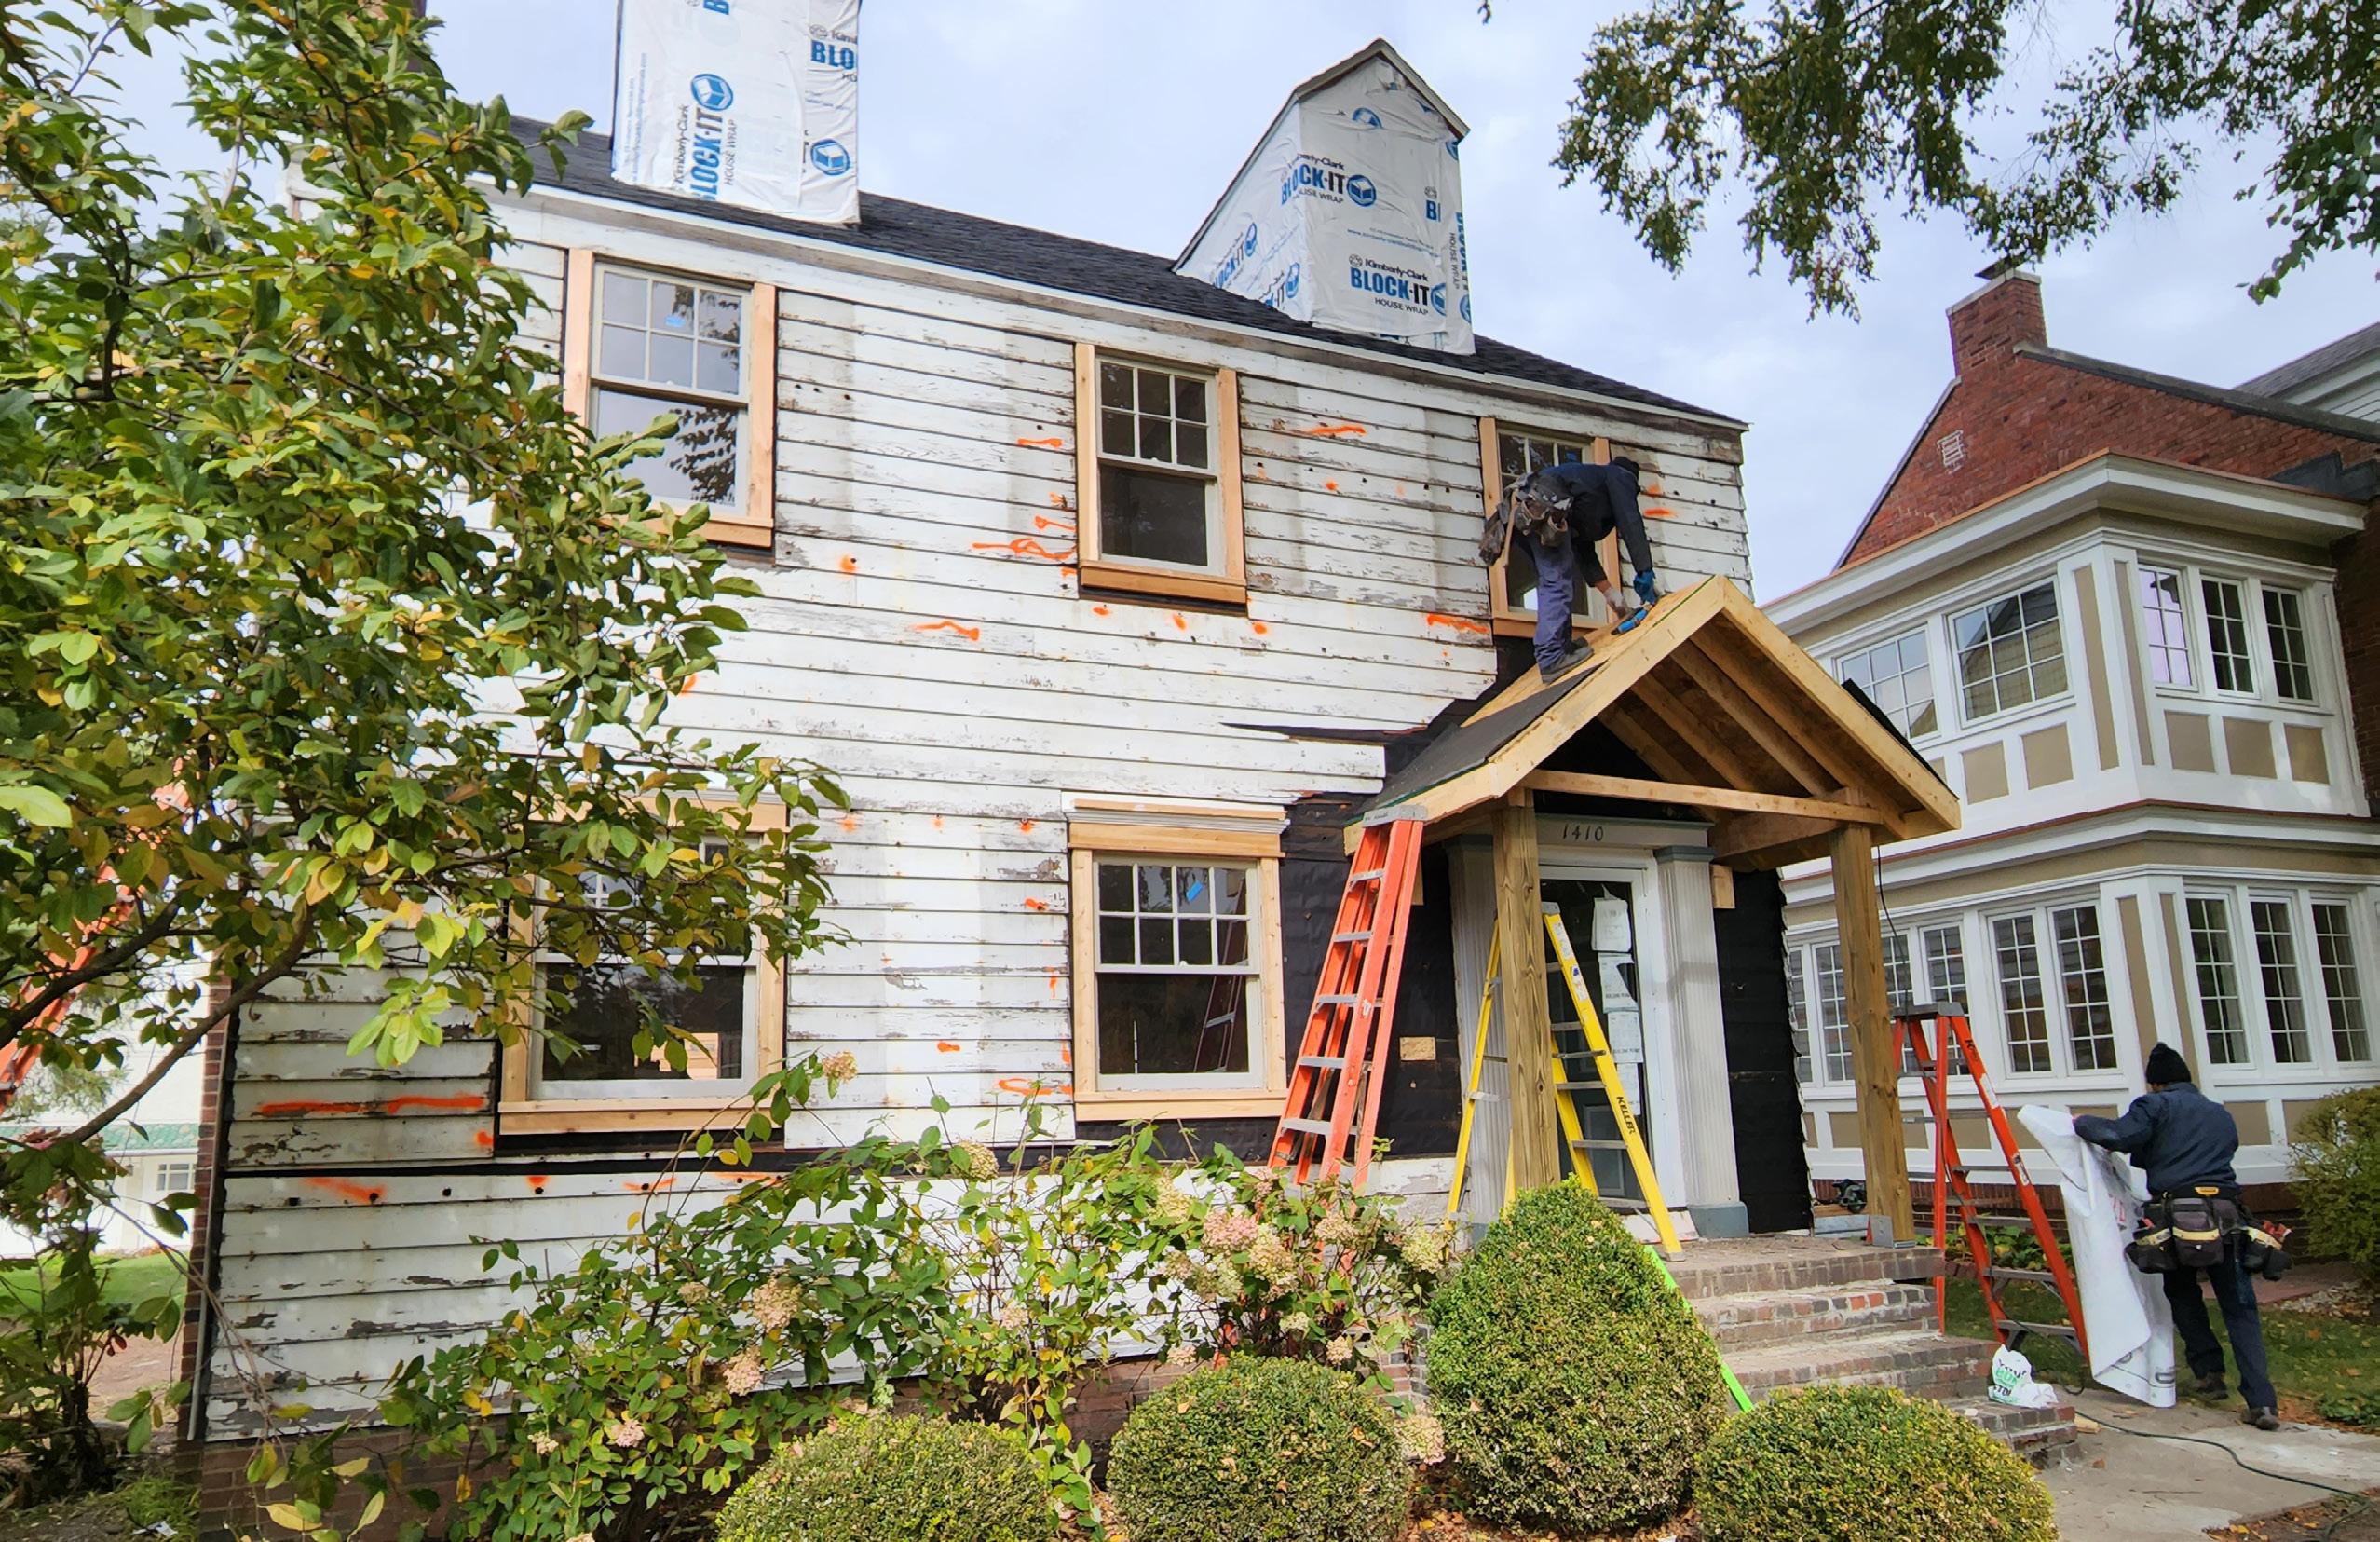
Rehabilitation activity in Fort Wayne’s historic districts.
Purchasing Power
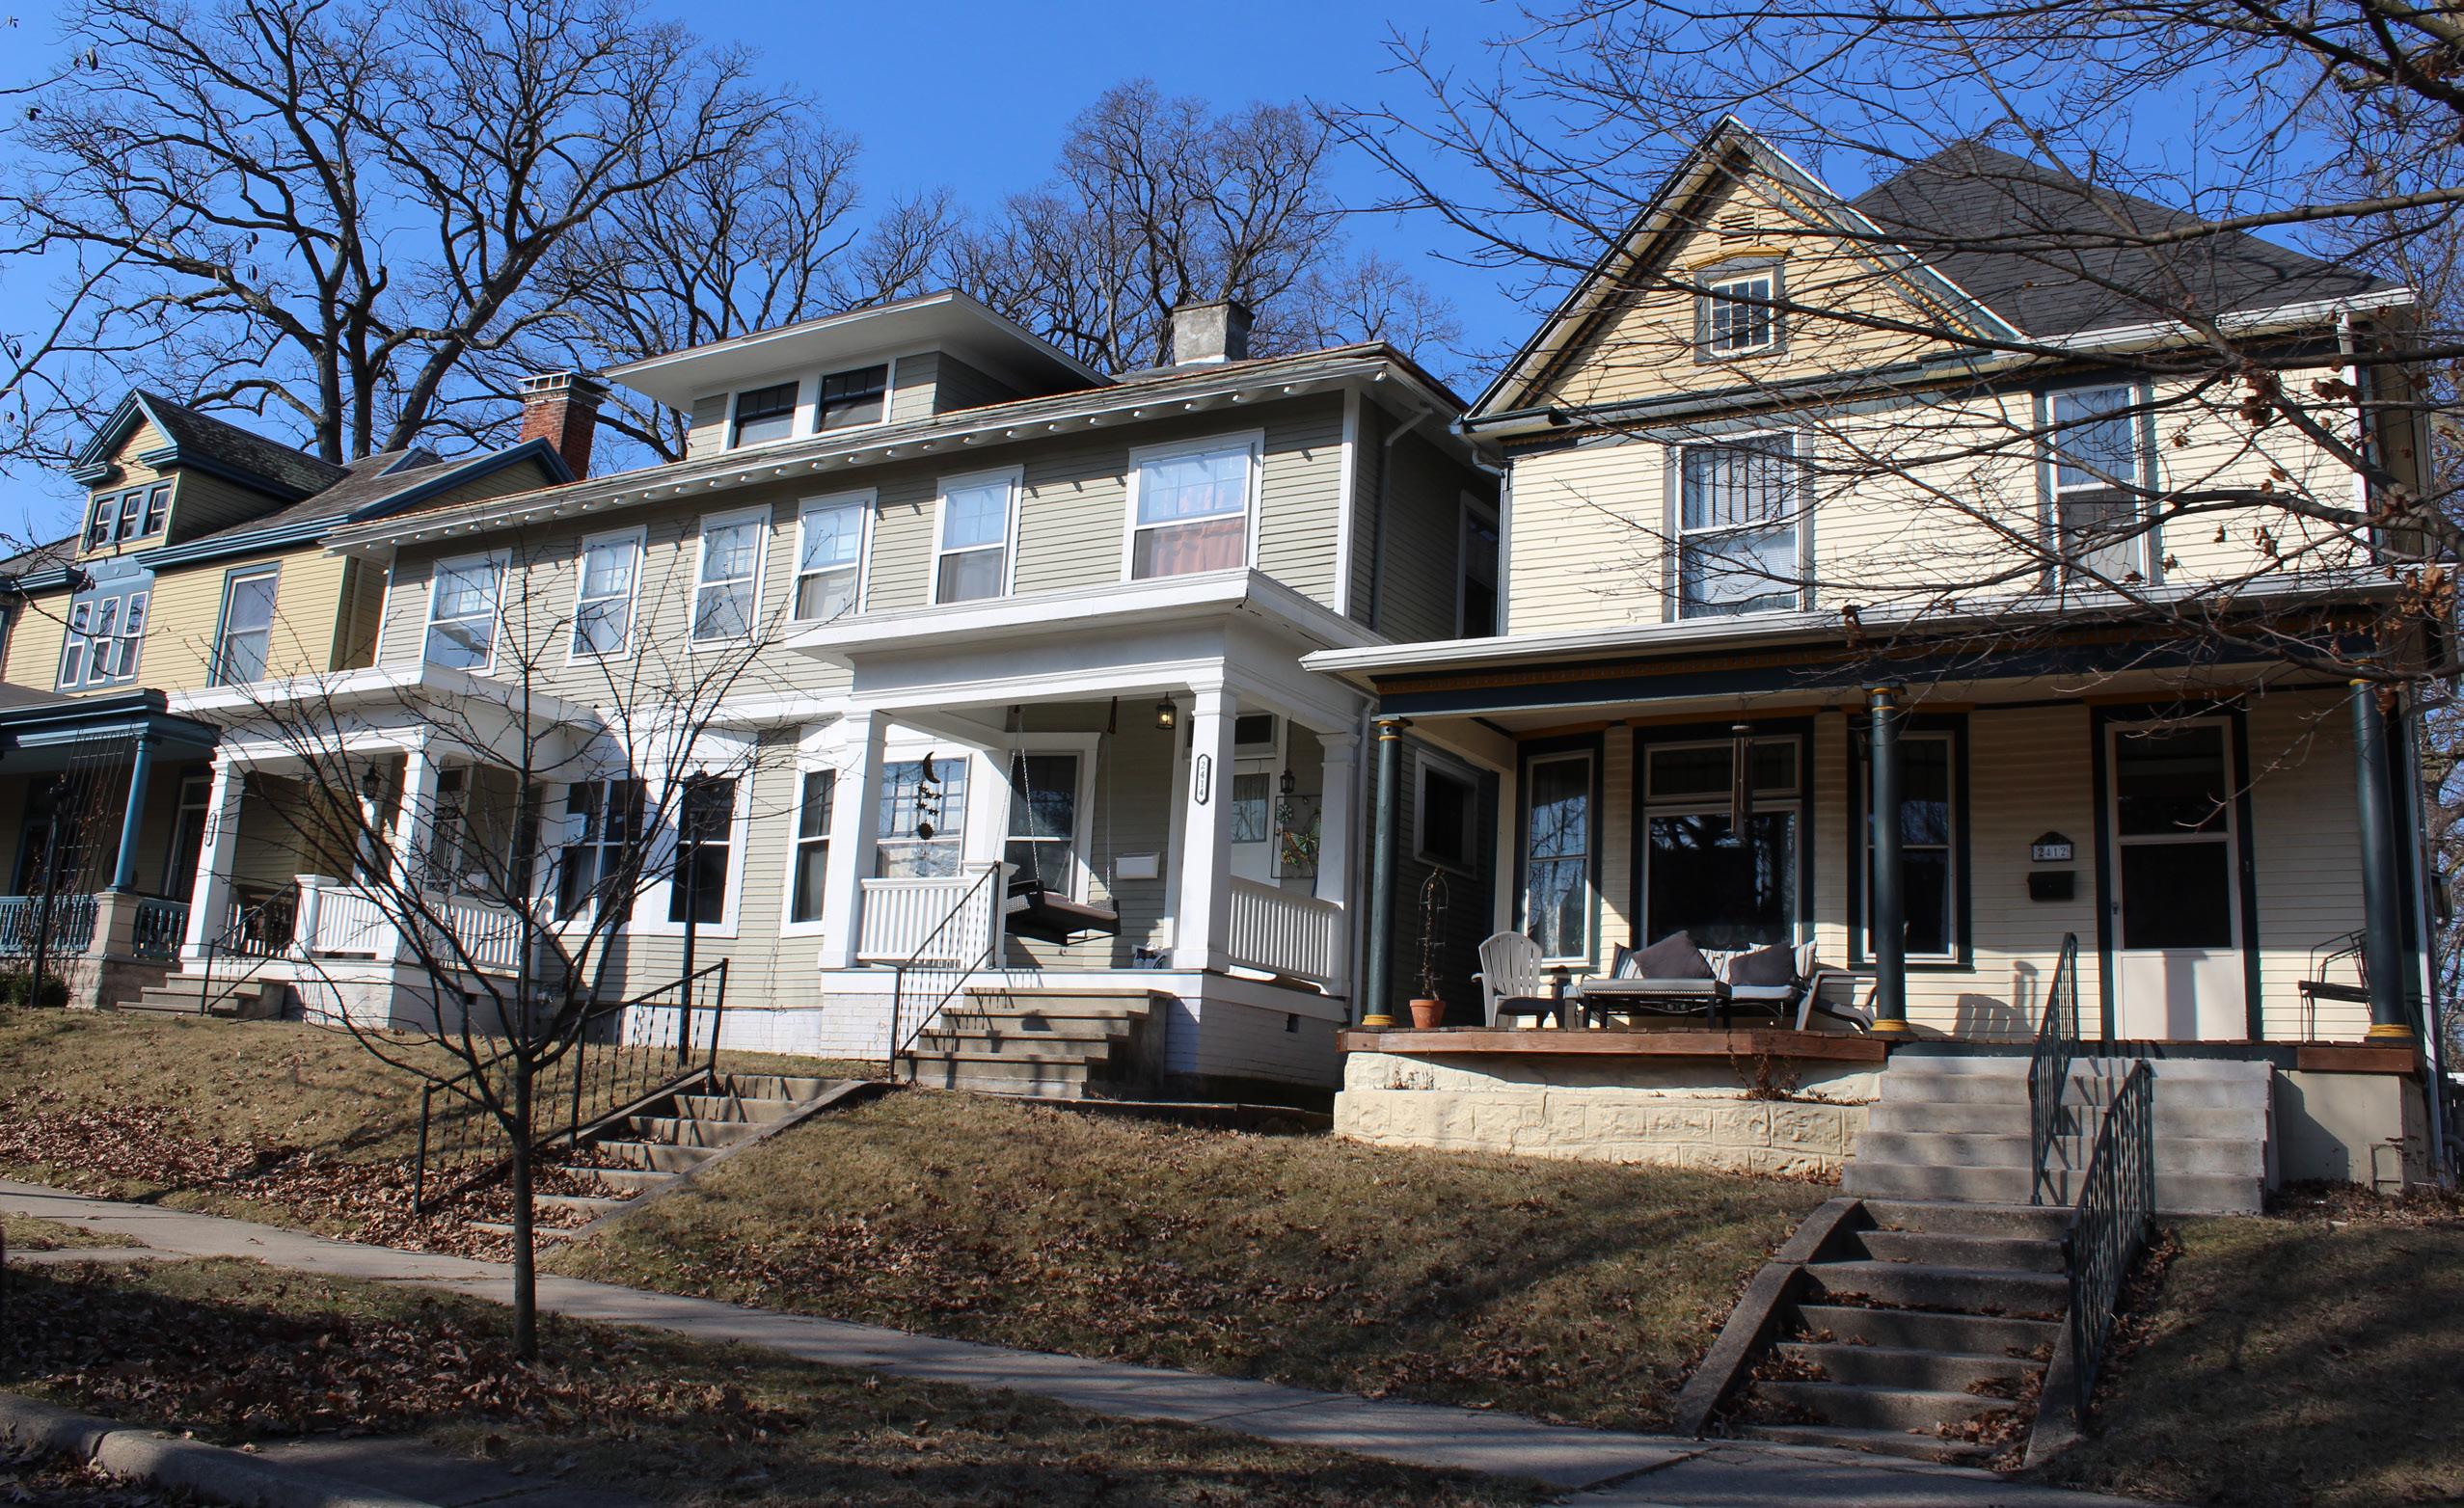
Fort Wayne’s Local Historic Districts are composed of an greater share of low- to moderate-income households than the rest of the city. Often market researchers and national chains disregard neighborhoods that are relatively small with modest median household incomes. Fort Wayne’s local historic districts could be impacted by that bias. However, historic district residents have annual purchasing power of nearly $48.7 million.
Annual Historic District Resident Expenditures
Source: US Bureau of Labor Statistics, Consumer Expenditure Survey
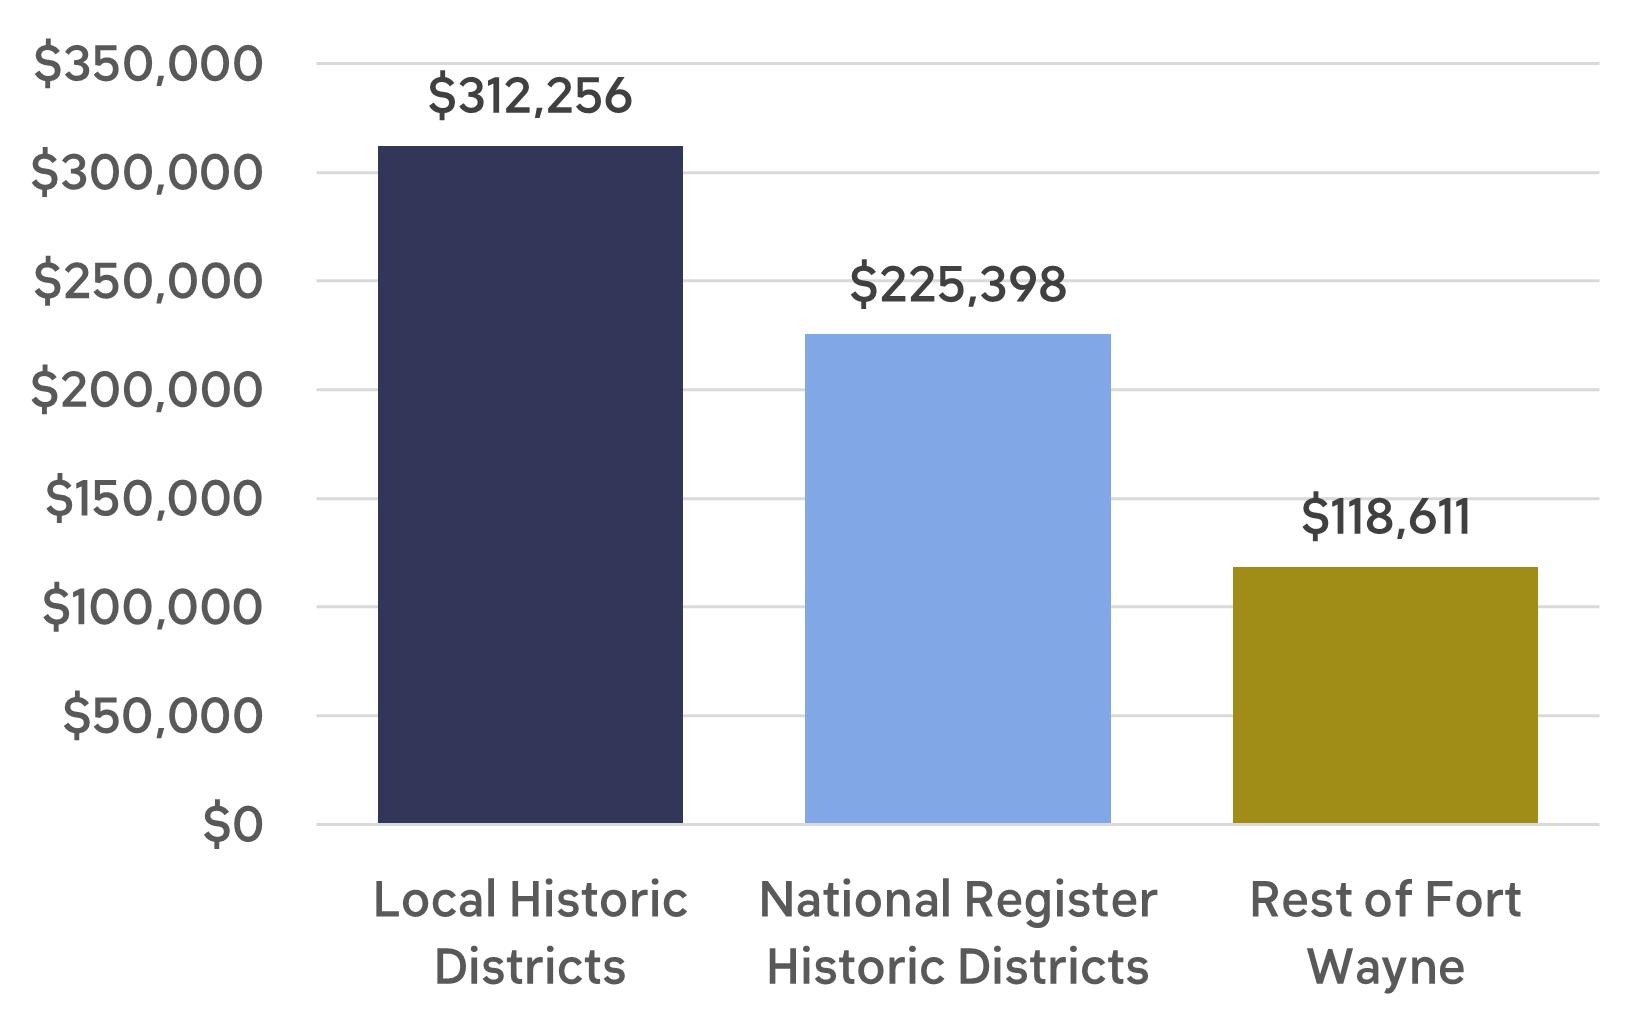
The density of households in historic districts provide a household expenditure of nearly $200,000 more per acre than the rest of Fort Wayne.
That number may not seem significant by itself, but when the per acre expenditures are analyzed, the concentrated buying power of those households becomes apparent. Despite households in local historic districts having a slightly lower median income, the density of these neighborhoods provide a household expenditure of nearly $200,000 more per acre than the rest of Fort Wayne. That is one reason why neighborhood business districts near historic neighborhoods are often both vibrant and successful.
ANNUAL HOUSEHOLD EXPENDITURE PER ACRE
Property Values
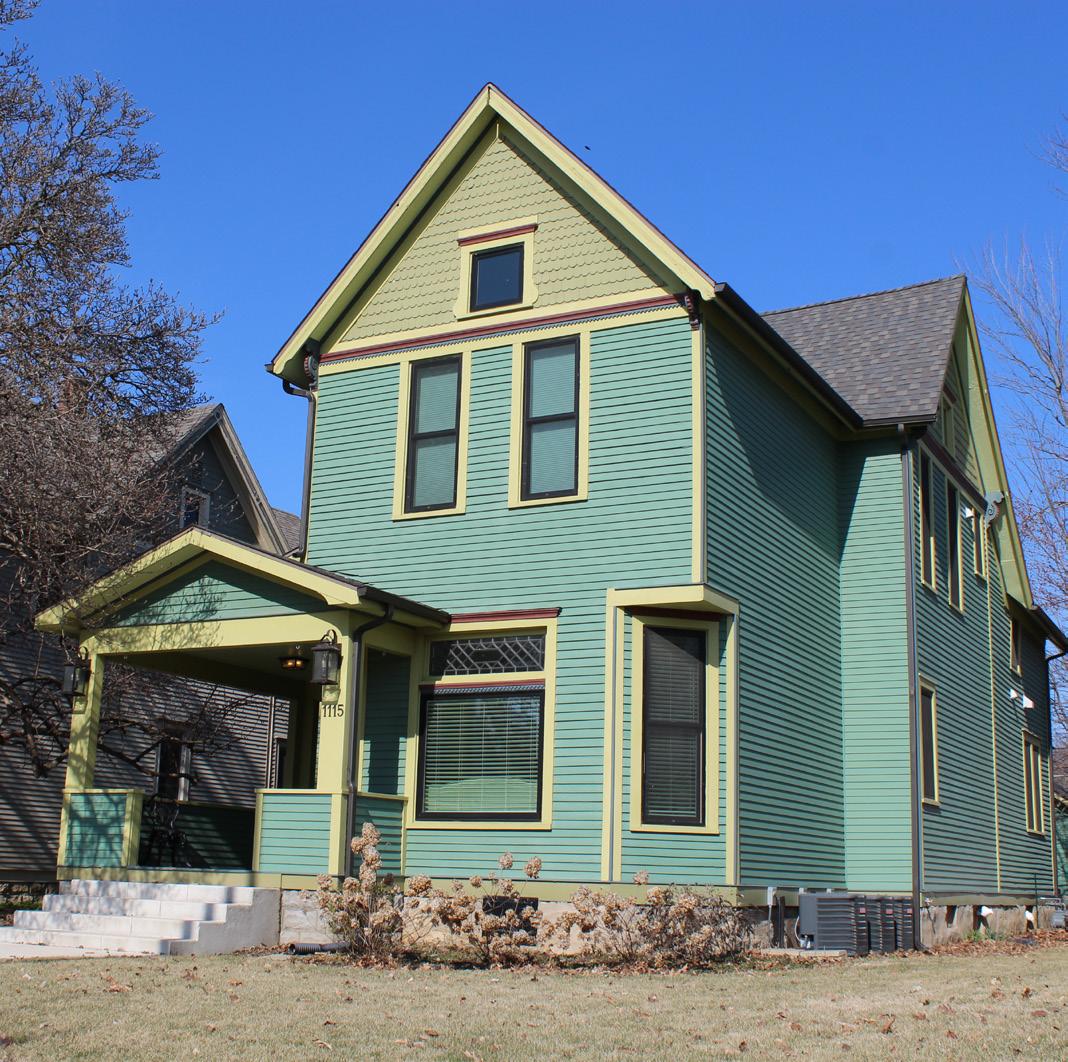
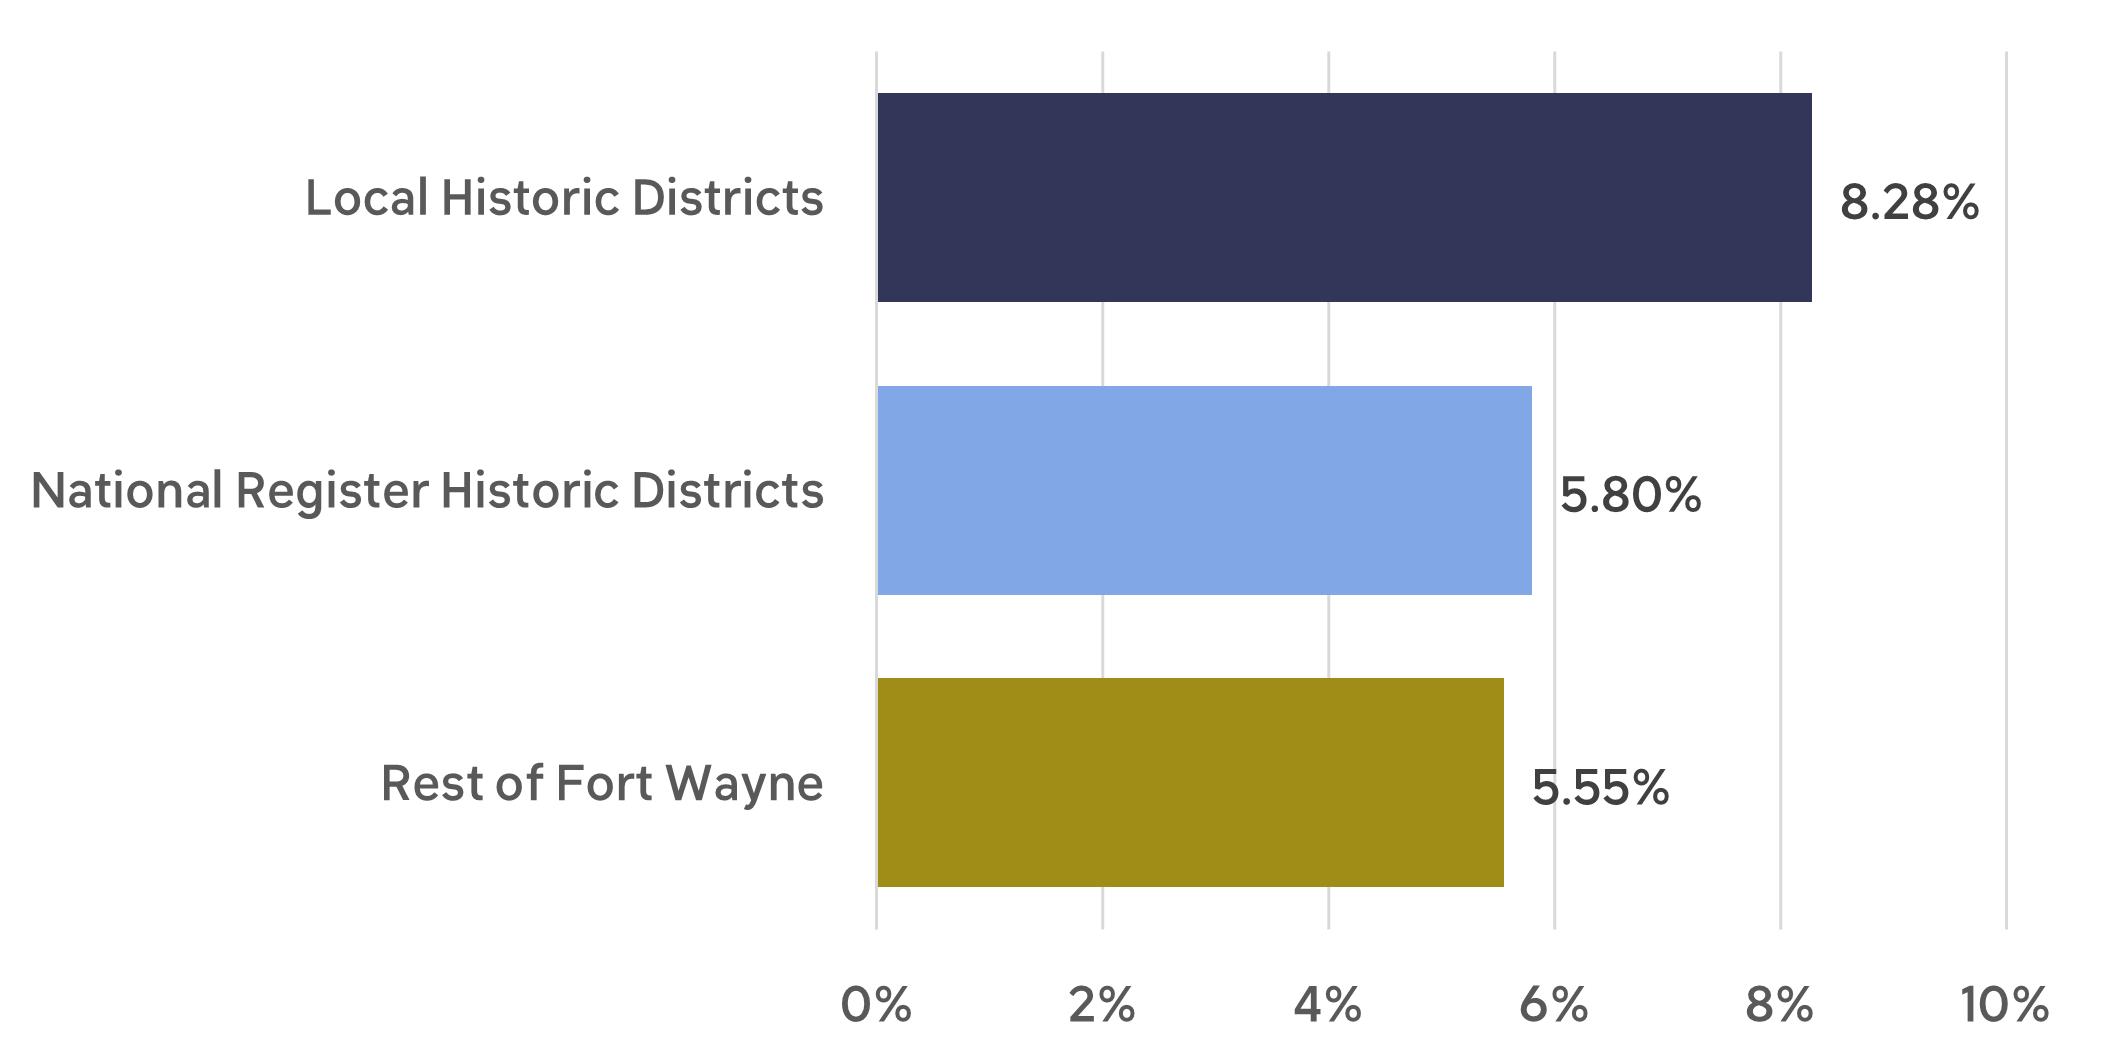
For most individuals, couples, or families, their most significant financial asset is their home. Along with the opportunity to build wealth, buying a home establishes roots in the community. For homeowners in Fort Wayne’s local historic districts their homes have been very good investments that have also built community. The annual increase in value of residential properties in local historic districts has out performed both those in National Register historic districts and the rest of the Residentially Zoned properties in Fort Wayne.4
AVERAGE ANNUAL CHANGE IN VALUE RESIDENTIAL PROPERTIES, 2010 - 2024
Source: Assessment Data, Allen County Assessor’s Office
4 Source: Allen County Assessor’s Office, 2010-2024. All calculations in this section use total property value (land + improvement).
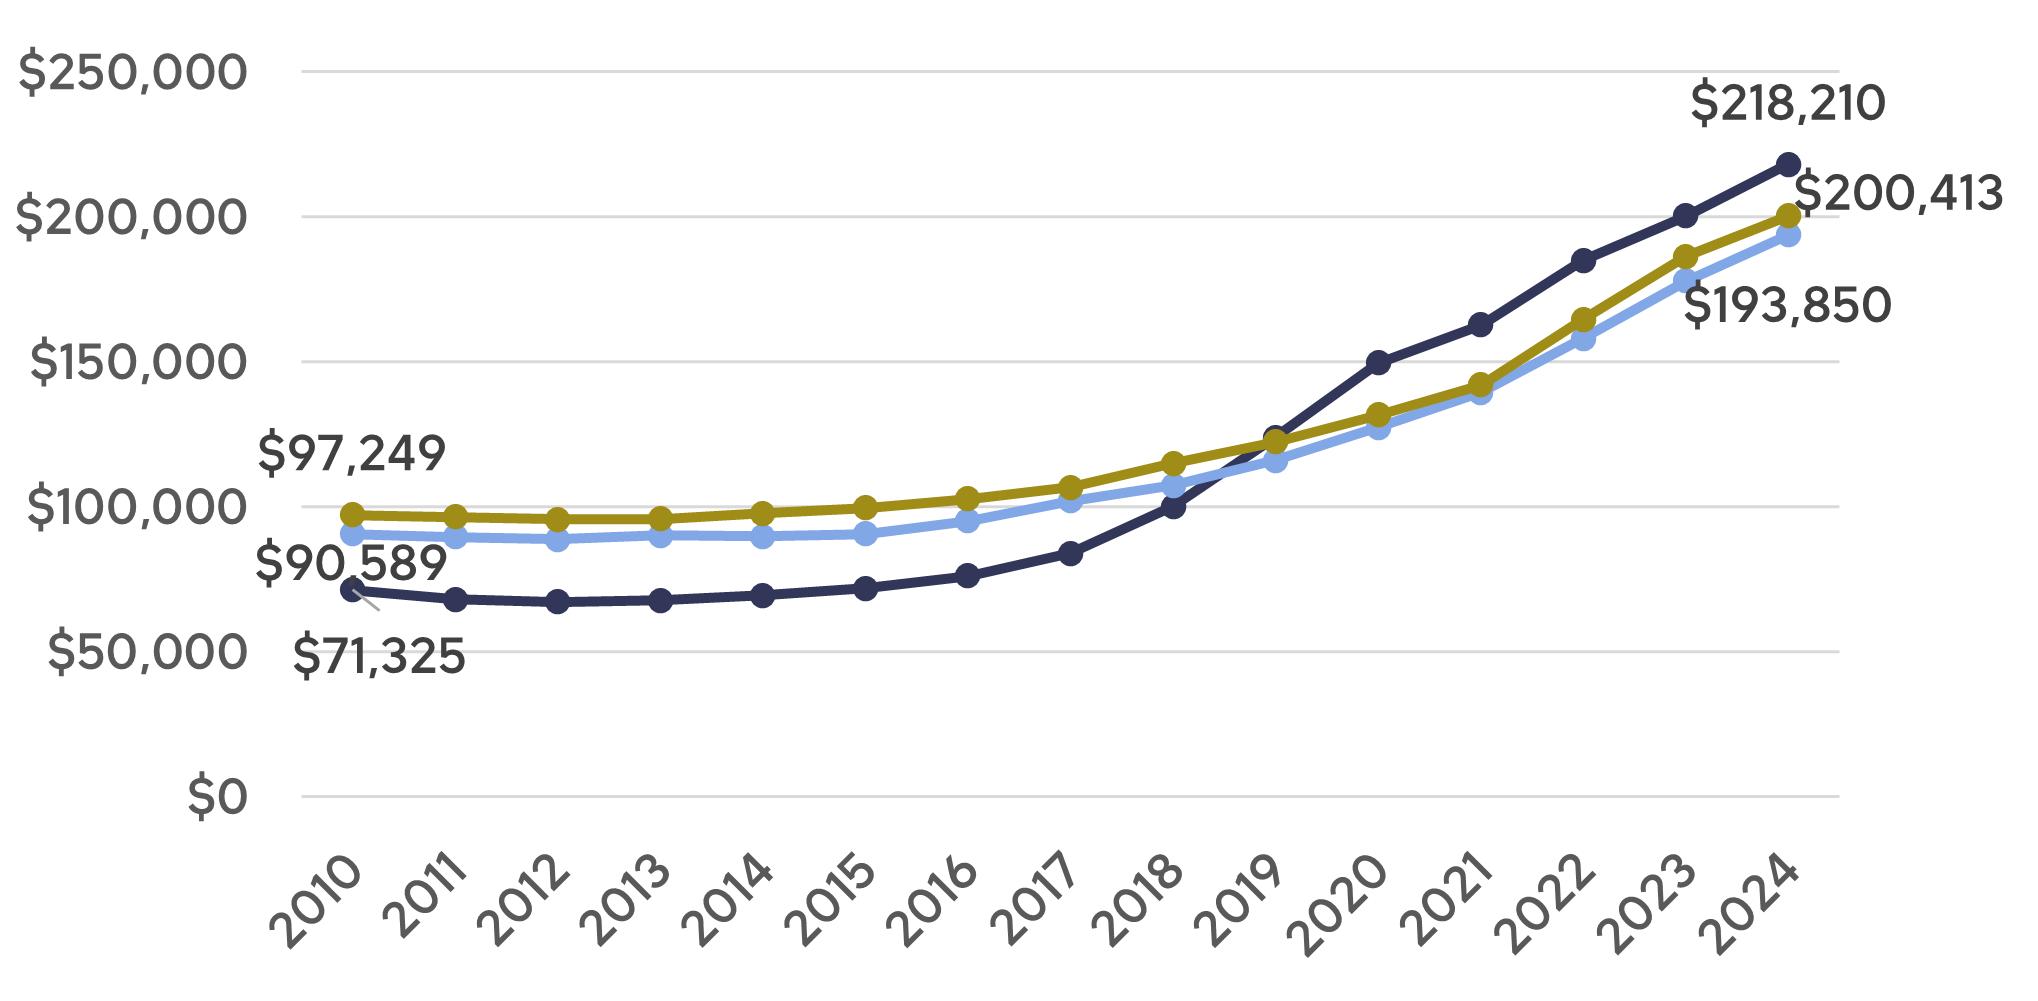
What does that mean in terms of the average house value? In 2010, the average value of a residence in a local historic district was $71,325, lower than houses in both National Register historic districts and the rest of Fort Wayne. Fourteen years later, the average value in local historic districts had increased to $218,000, more than either of the other categories of properties.
Over time, the average home value in local historic districts has increased at a faster rate than National Register historic districts and the rest of Fort Wayne. In 2024, the average home value in local historic districts was 13% higher than the rest of the city.
AVERAGE VALUE RESIDENTIAL PROPERTIES
Source: Assessment Data, Allen County Assessor’s Office
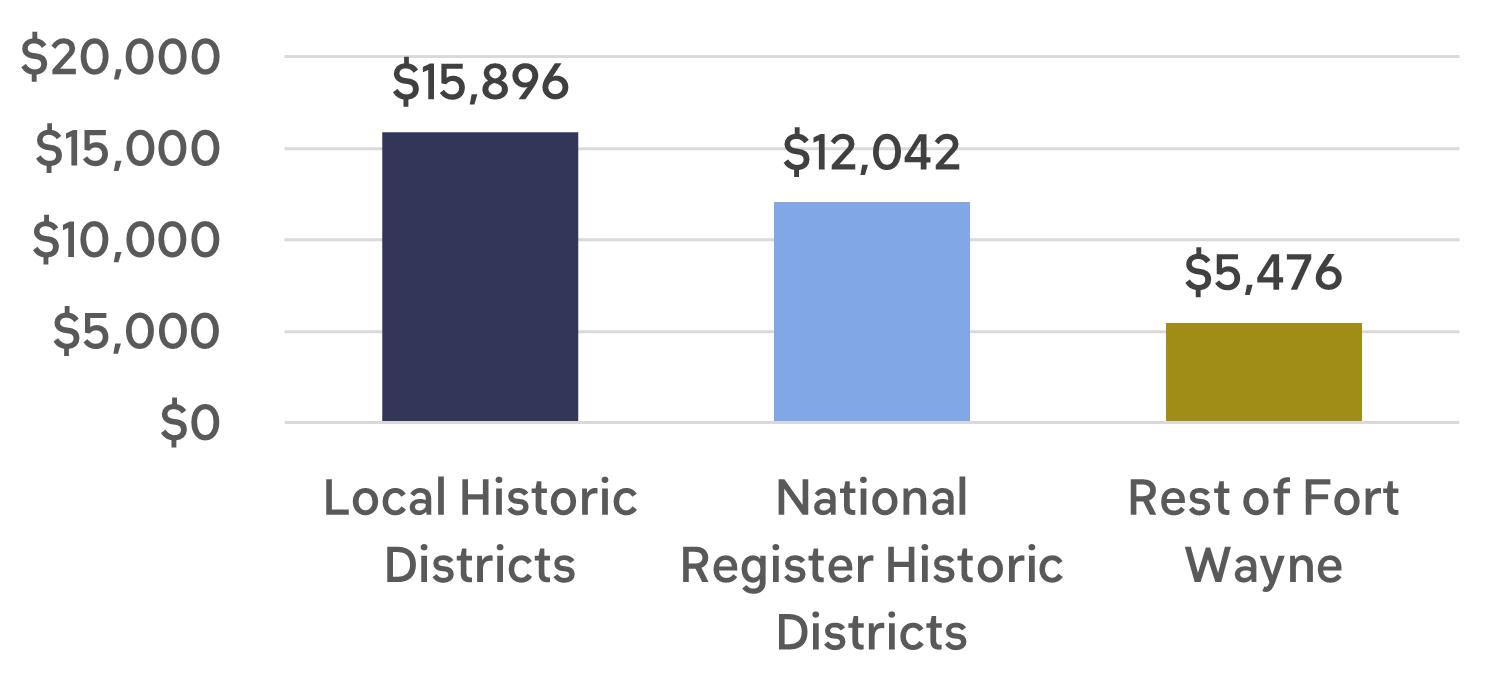
While the major beneficiaries of that value increase are homeowners, units of local government, which rely heavily on property taxes to provide essential public services, also benefit. Farms in Indiana are sold based on their productivity per acre. For local governments in Allen County, Fort Wayne’s local historic districts are the most productive residential property in town. The per acre property tax generation in those districts is three times the per acre property tax yield in the rest of Fort Wayne. In 2024, the total property taxes coming from Fort Wayne’s local residential historic districts is just short of $2.5 million.
PROPERTY TAXES PER ACRE
Source: Assessment Data, Allen County Assessor’s Office
If properties in Fort Wayne’s local historic districts had only increased in value at the rate of the rest of the City, property tax revenues for local government in 2024 would have been $748,000 less. That amount would pay the salaries of four new police officers, eight city employees, and still have enough left over to subsidize the rents $100 per month for fifty low income families for a full year.
The growth in property values in historic districts creates tax revenue for important city services.
THE INCREASED PROPERTY TAX REVENUE FROM LOCAL HISTORIC DISTRICTS IS ENOUGH TO:

four new police officers, plus... Hire

eight new City employees plus... Hire

still have enough money to provide
$100 per month rental subsidies for 50 low income families.
Property Tax Relief for Homeowners and Seniors
Rising property values create long term financial benefits and provide for generational wealth transfer. However, for the retired on fixed income and for those with more modest incomes, while their home is a long-term asset, annual property taxes can create a short-term challenge. Fortunately, Fort Wayne and Allen County have tools available to mitigate that challenge. The Homestead Deduction and the 65+ Circuit Breaker allow property tax relief to affected homeowners, reducing the risk of having to move out of their long-term residence before they are ready.
Housing and Affordability
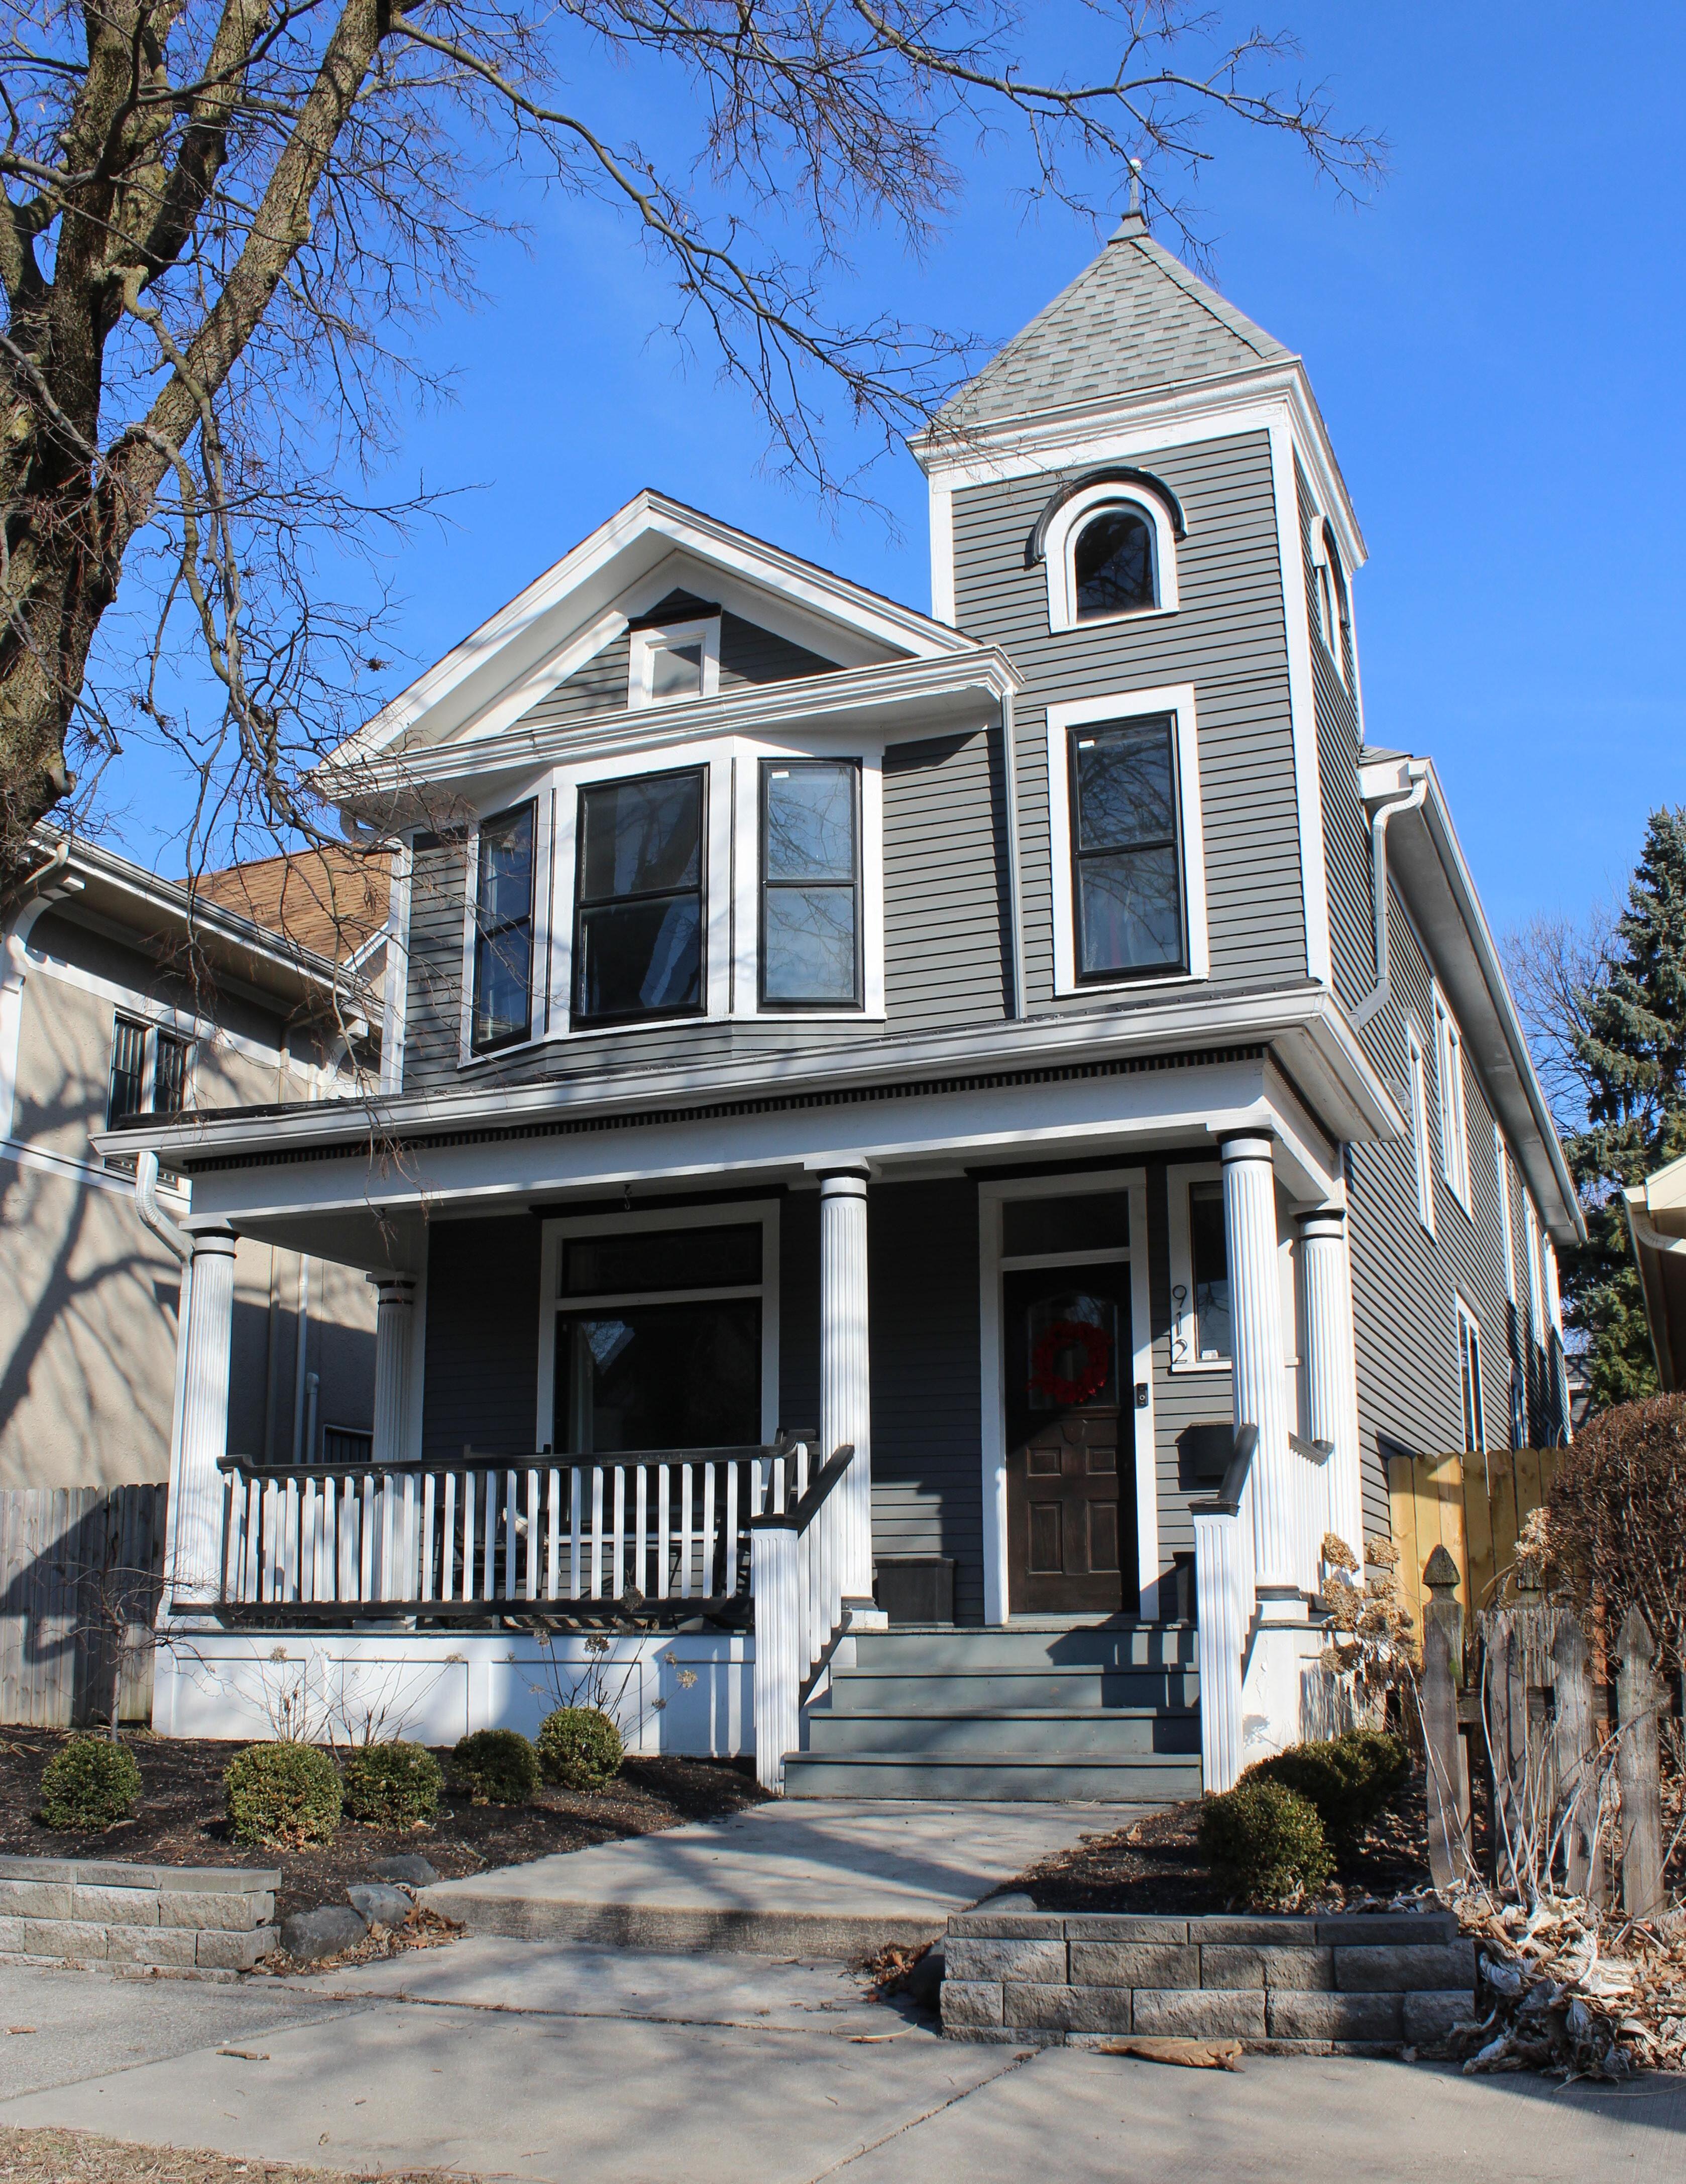
Historic districts in Fort Wayne are home to a higher share of lowincome households and have lower housing costs than the rest of the city.
The relationship between historic preservation and housing affordability is increasingly under scrutiny in cities across the United States. In Fort Wayne, historic districts contribute to the city’s supply of affordable housing by providing a range of housing types at various price points.
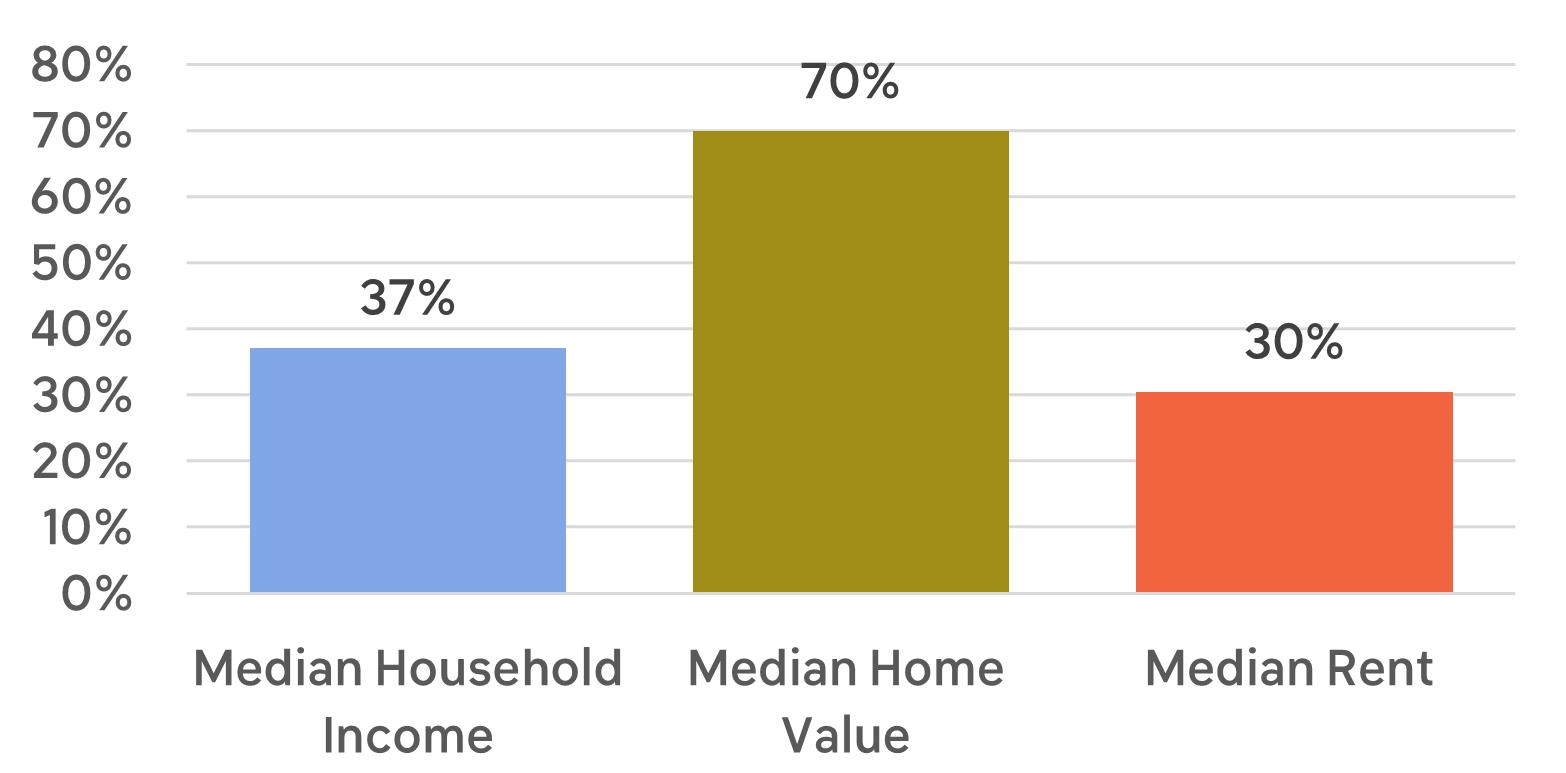
Fort Wayne has long been considered an affordable place to live. It consistently ranks as one of the most affordable cities in the U.S. due to its low cost of living and housing, as well as affordable utilities and stable job market.5 Despite the fact that Fort Wayne’s median home and rent prices are significantly below the national average, home values are still outpacing income growth.
CHANGE IN FORT WAYNE’S MEDIAN INCOME VS MEDIAN HOUSING COST (2010-2023)
Source: PolicyMap
Number of Housing Units
A small share–only 5.4%–of Fort Wayne’s housing stock is located in either Local or National Register historic districts.
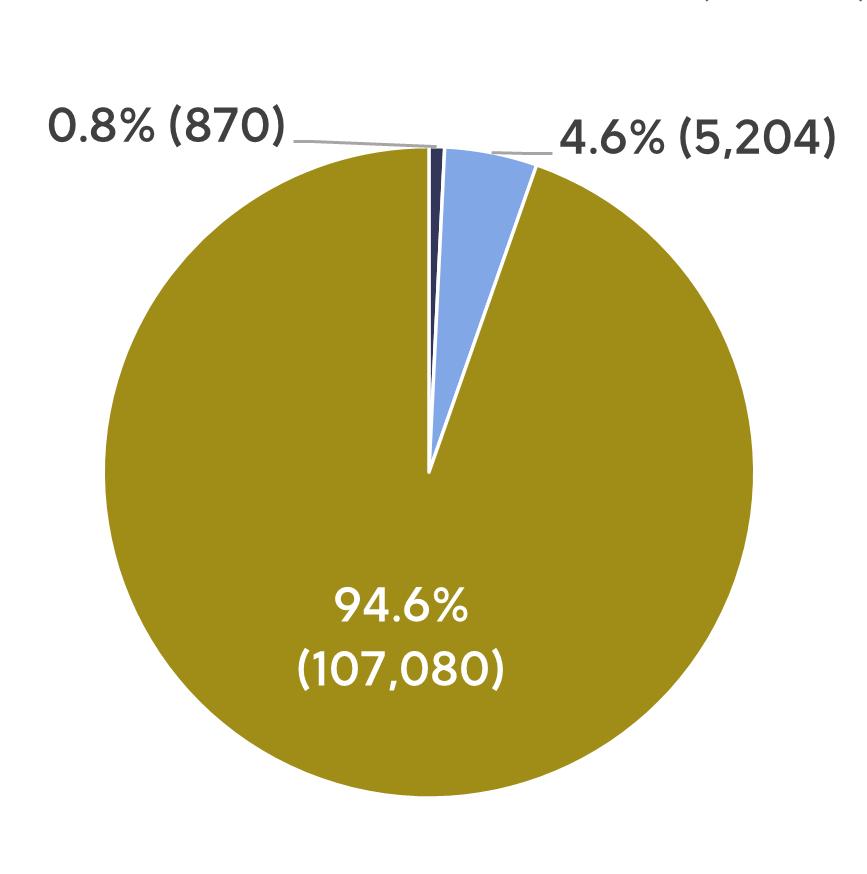
HOUSING UNITS (2023)

Source: U.S. Census Bureau, “Housing Units,” ACS 5-year estimates, Table B25001, 2023
Density of Housing Units
Historic neighborhoods tend to be more dense than newer neighborhoods because their lot sizes are often smaller, the unit sizes are often smaller, and they usually contain a greater variety of housing types.
Historic districts have a high density of housing units.
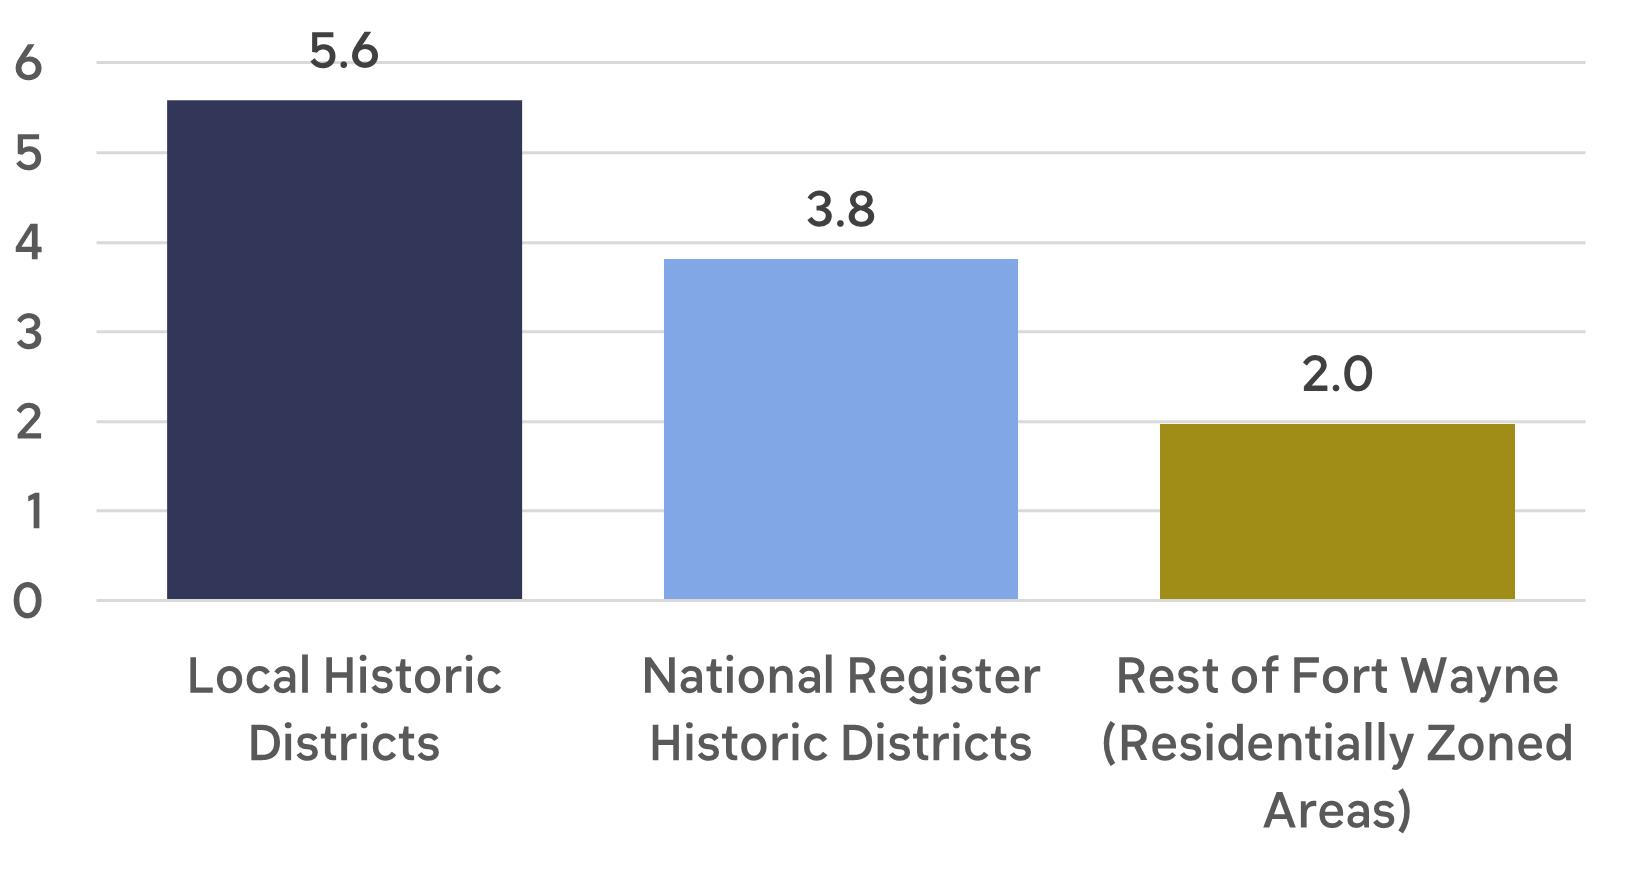
In Fort Wayne, local historic districts have a high density of housing units, with over 5 units per acre. National Register historic districts have almost 4 units per acre, whereas the rest of the city only averages 2 housing units per acre.
HOUSING UNITS PER ACRE
Source: U.S. Census Bureau, “Housing Units,” ACS 5-year estimates, Table B25001, 2023 and Fort Wayne Zoning
Variety of Housing Types
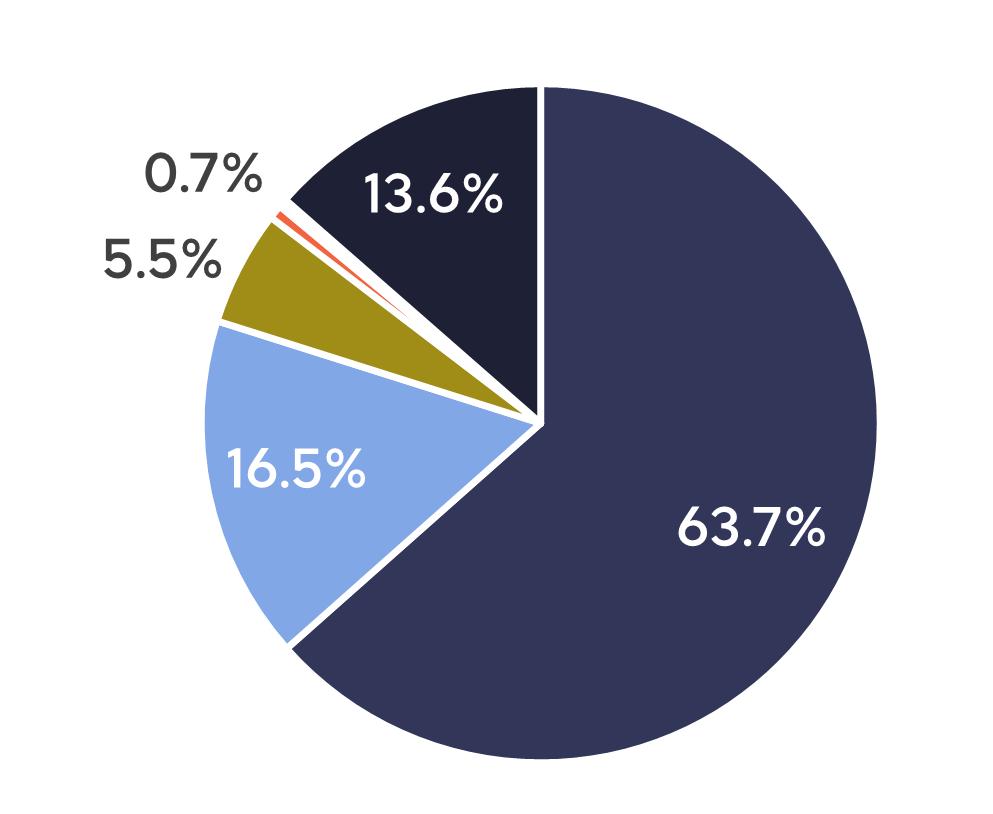
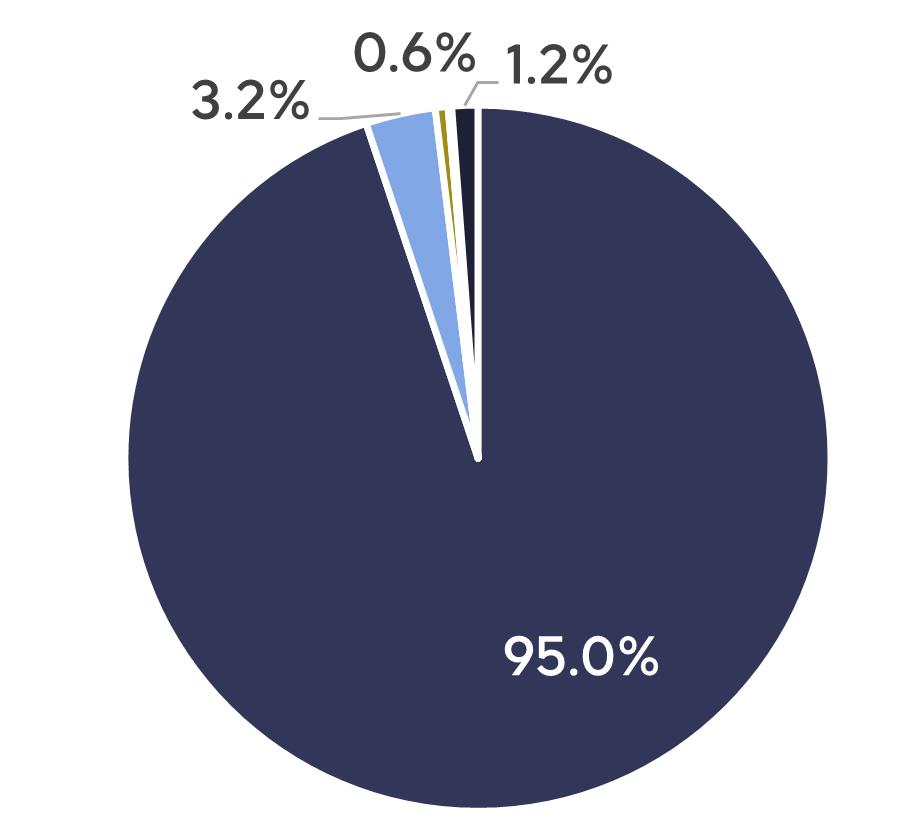
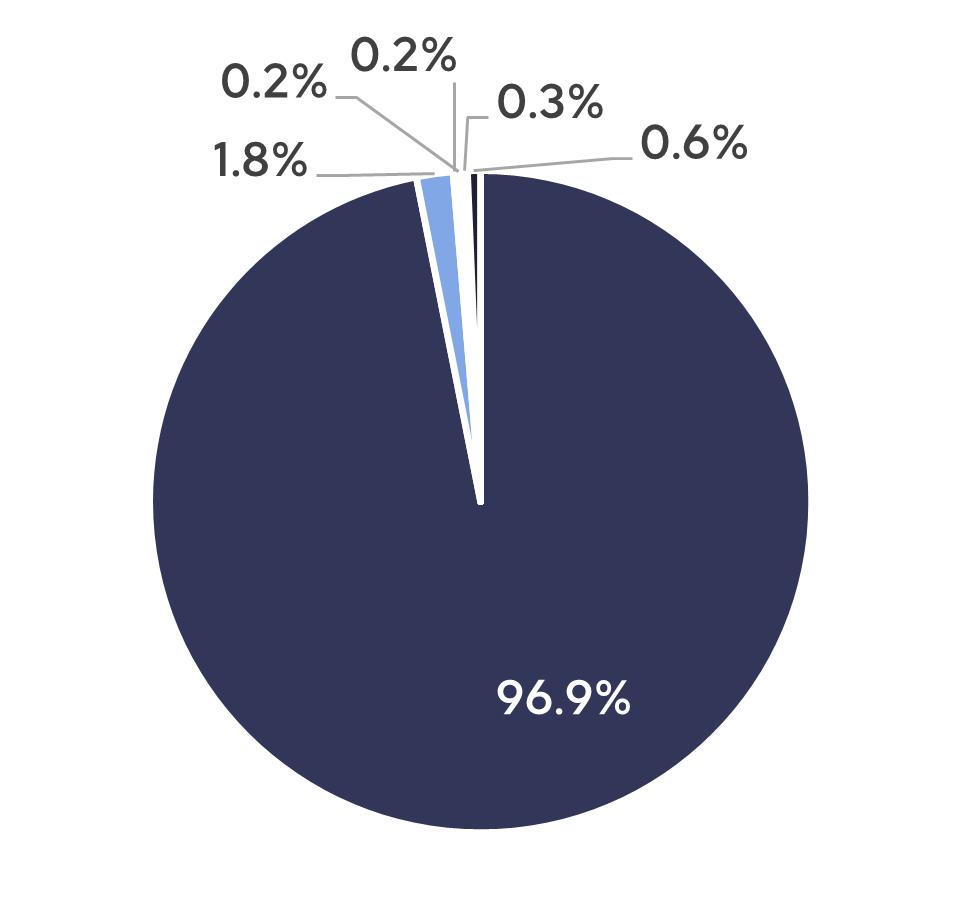
Fort Wayne’s local historic districts have a wider variety of housing types than National Register historic districts and the rest of the city. Only 64% of the parcels in local historic districts have a single-family residence, whereas National Register districts and the rest of Fort Wayne are overwhelmingly single-family. A wider diversity of housing types adds to density but also provides a wider range of rents and, therefore, a wider range of people who can afford to live there.
HOUSING TYPOLOGY
Local Historic Districts
National Register historic districts

Rest of Fort Wayne
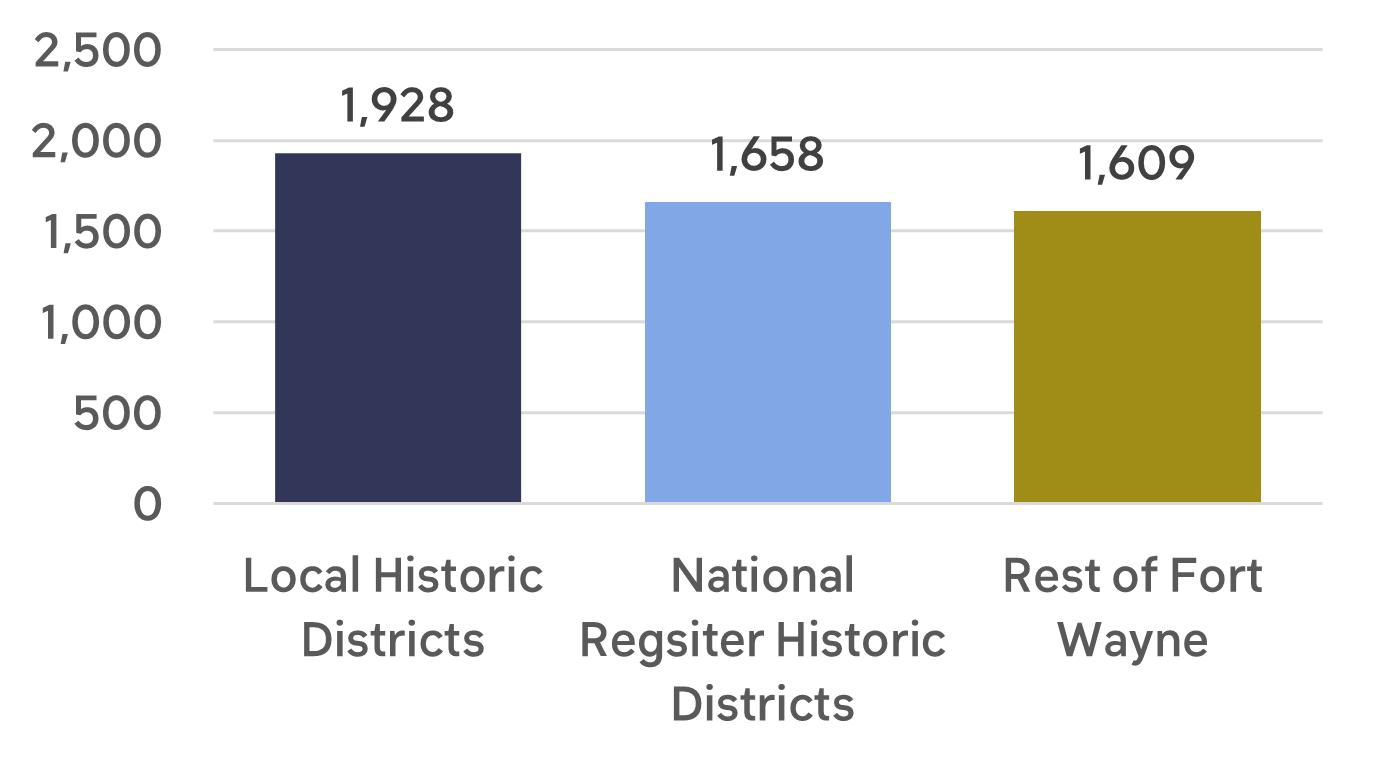
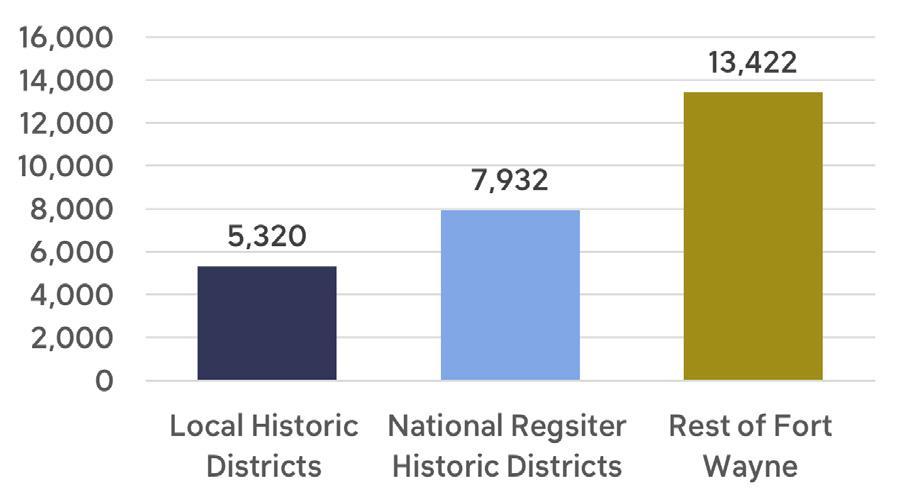
Unit and lot size also contribute to housing density. In Fort Wayne, single family homes in local historic districts are slightly larger than single family homes in National Register historic districts and the rest of the city. However, lot sizes are significantly smaller in local historic districts. Lots in the rest of Fort Wayne are around 2.5 times larger than lots in local historic districts and 1.7 times larger than lots in National Register historic districts.
AVERAGE SINGLE FAMILY DWELLING LIVING AREA (SQ/FT)
AVERAGE SINGLE FAMILY DWELLING LOT AREA (SQ/FT)
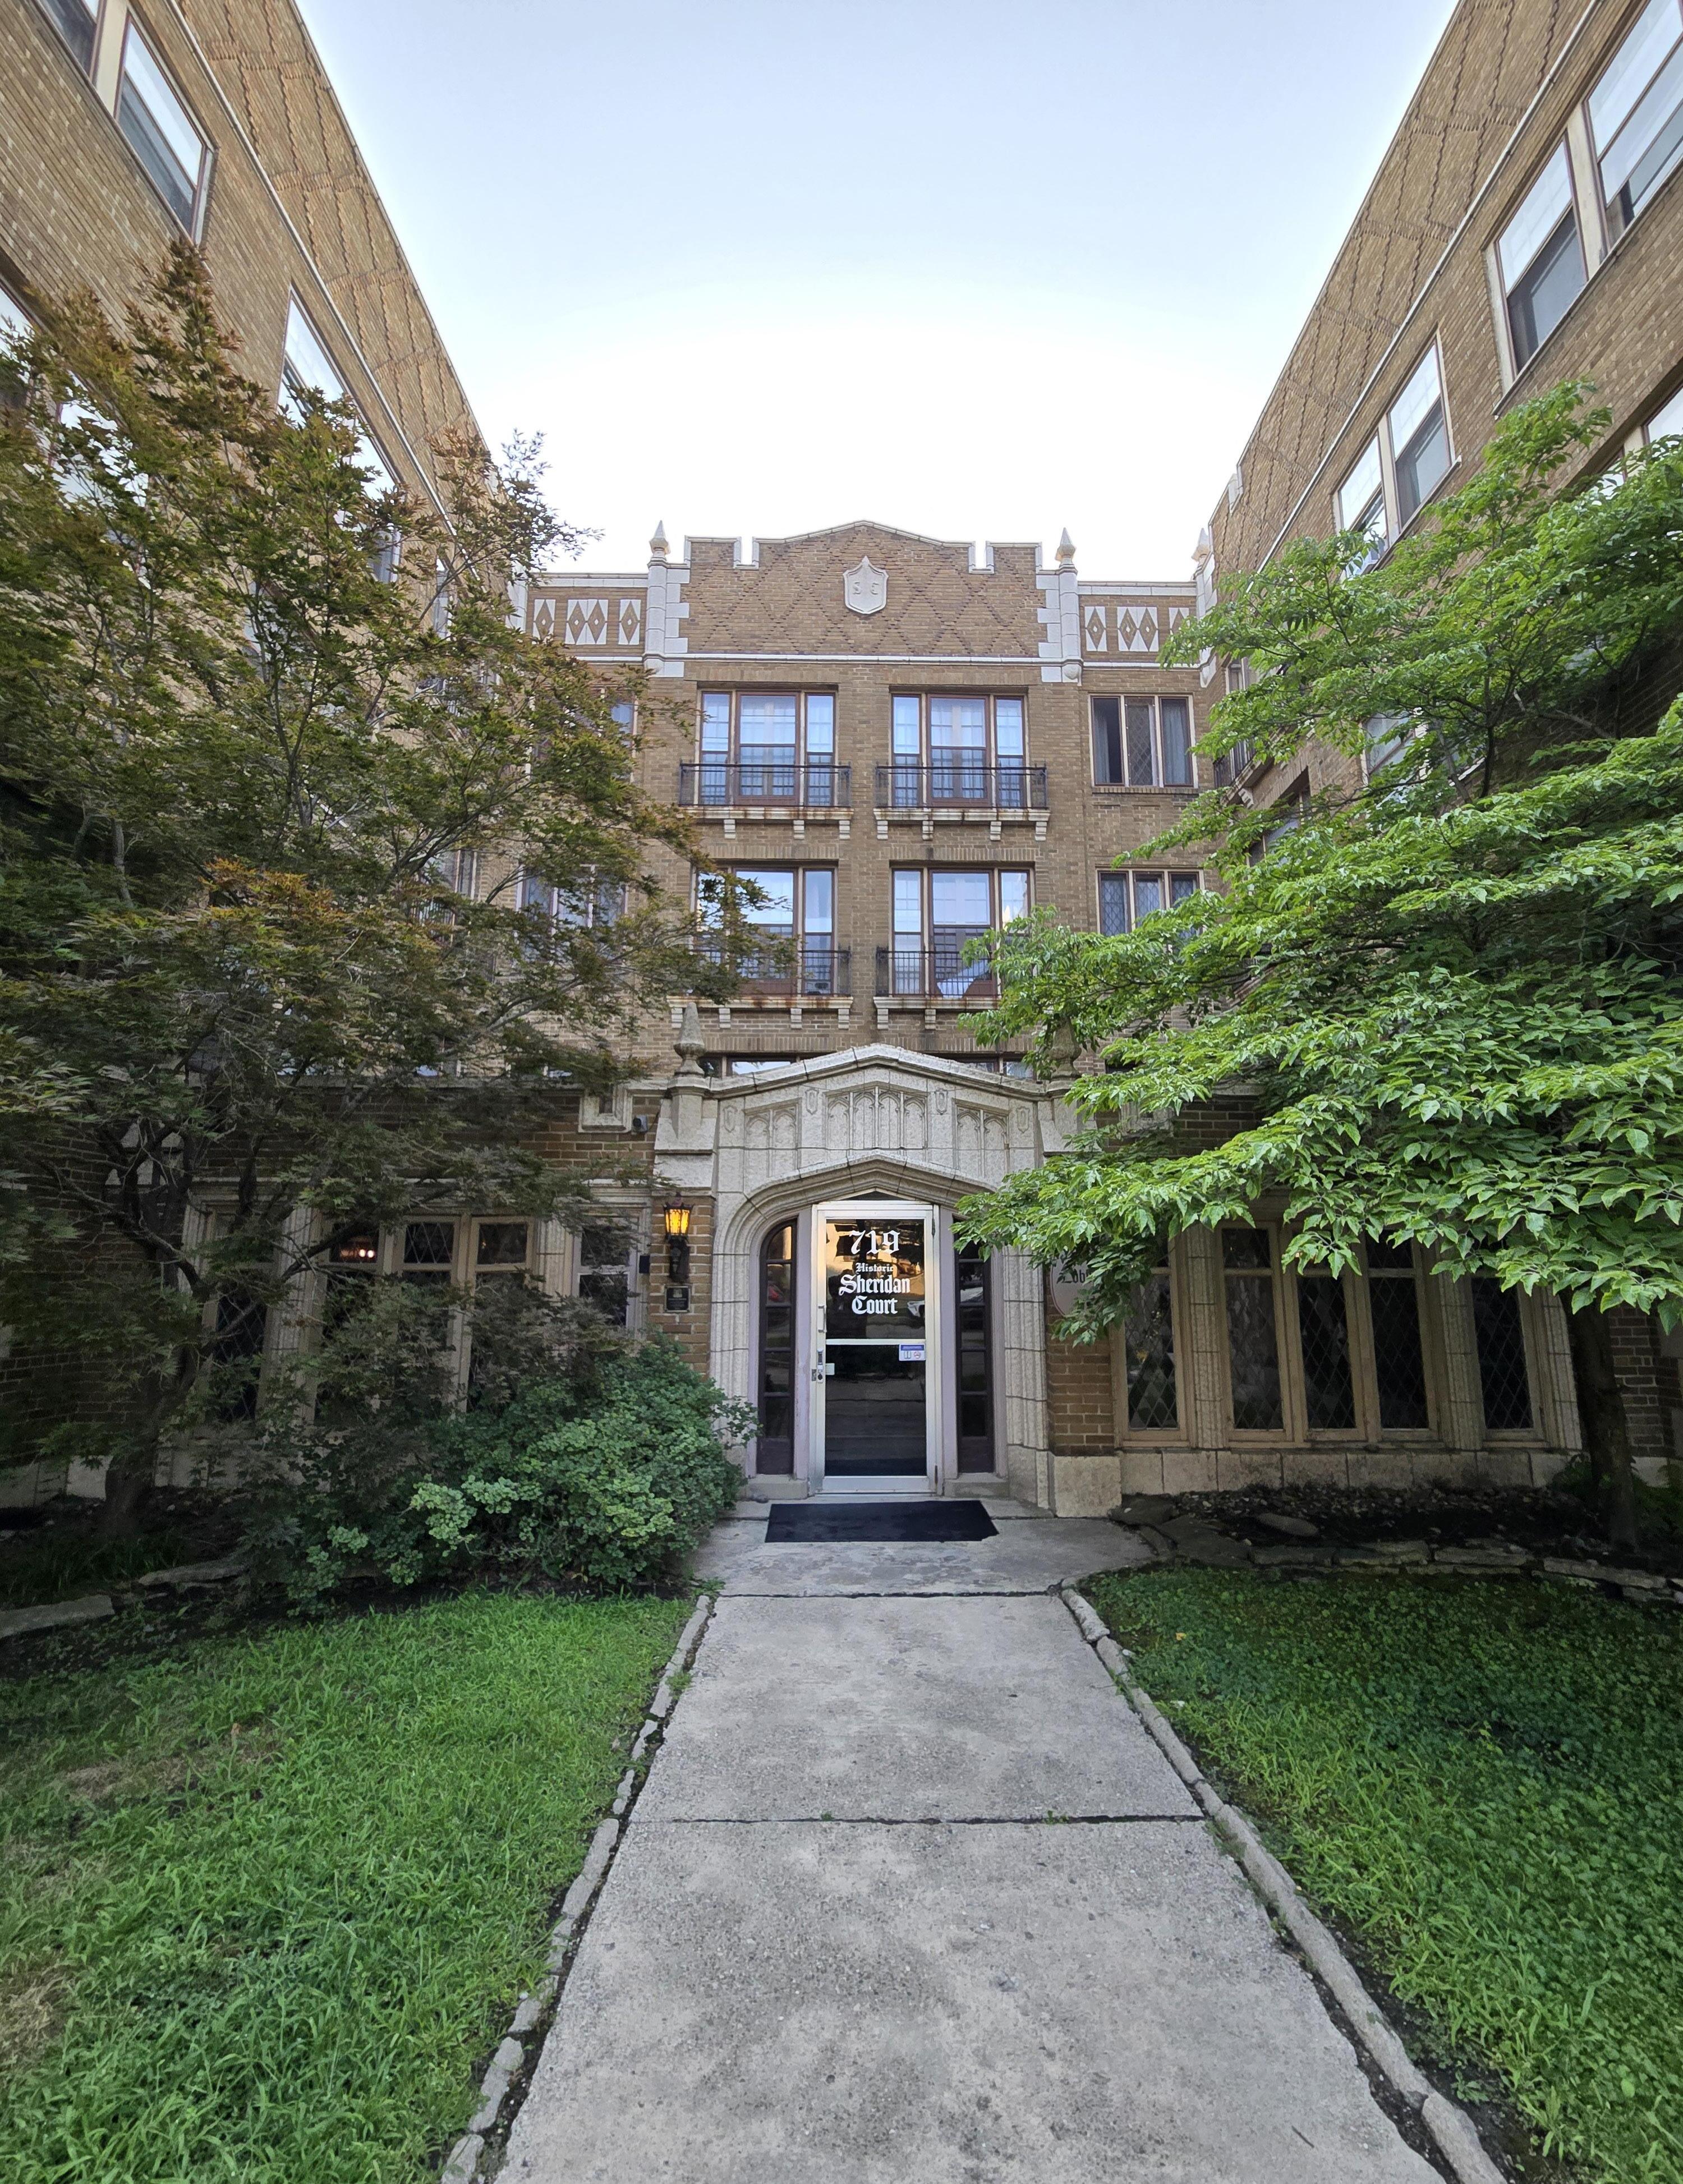
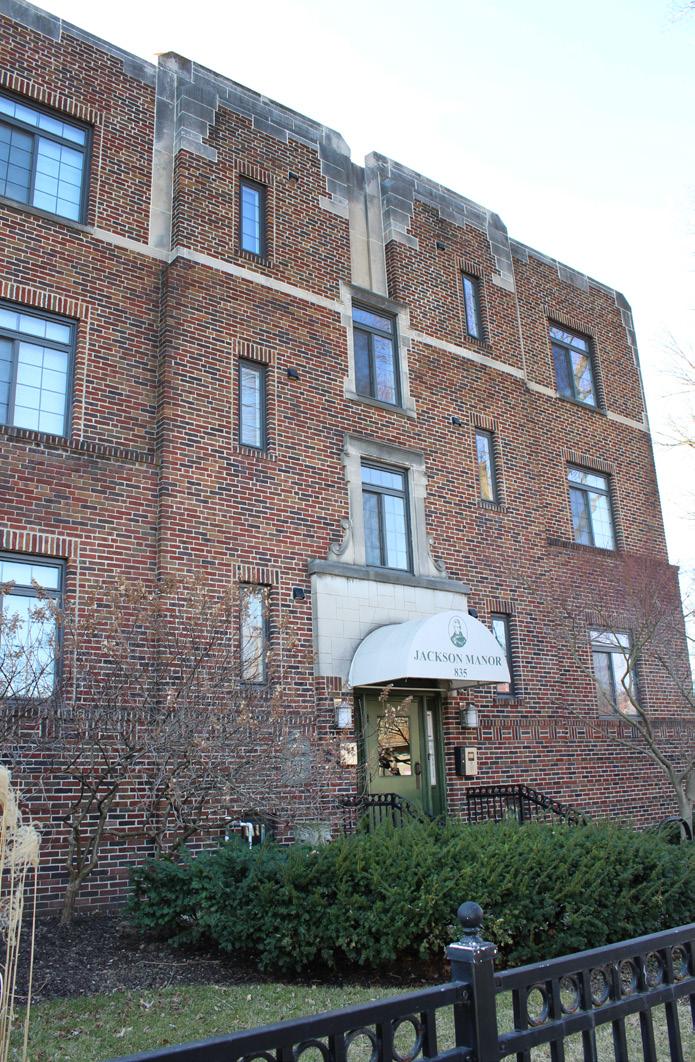
Located in the West Central Historic District, the Sheridan Court apartment building is the largest historic apartment complex in Fort Wayne at 52 units. With units ranging in rent from $350-$1,150 and an average unit size of 850 square feet, this property contributes to the affordability and density of housing in historic districts.
Occupancy Status
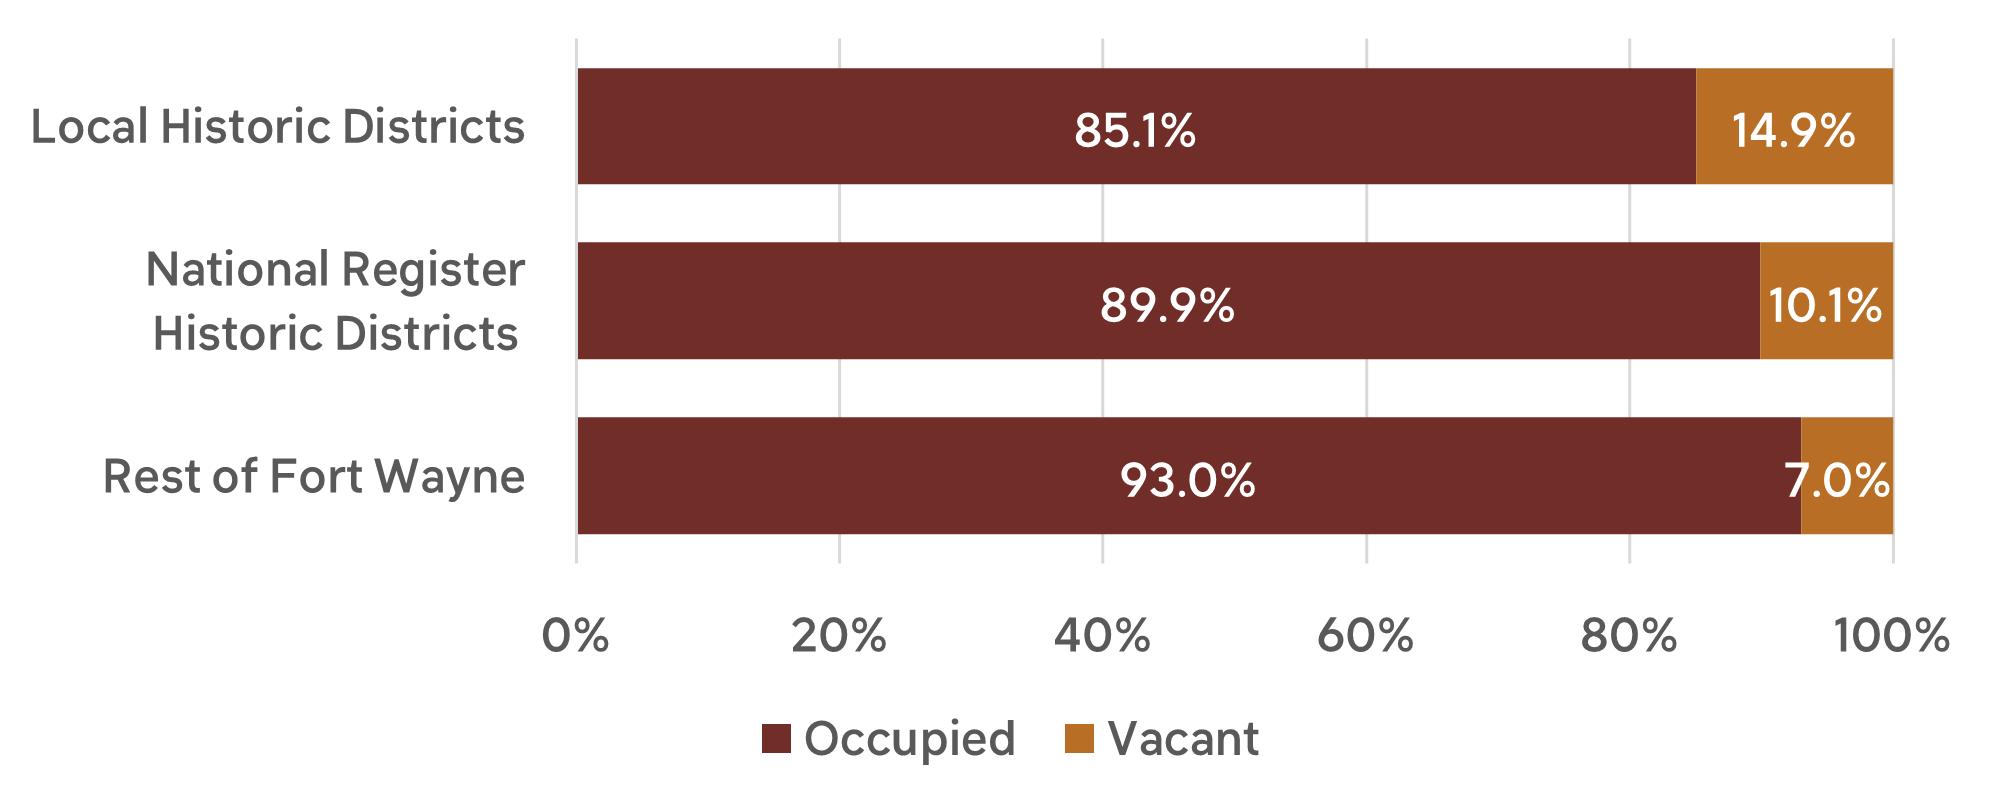
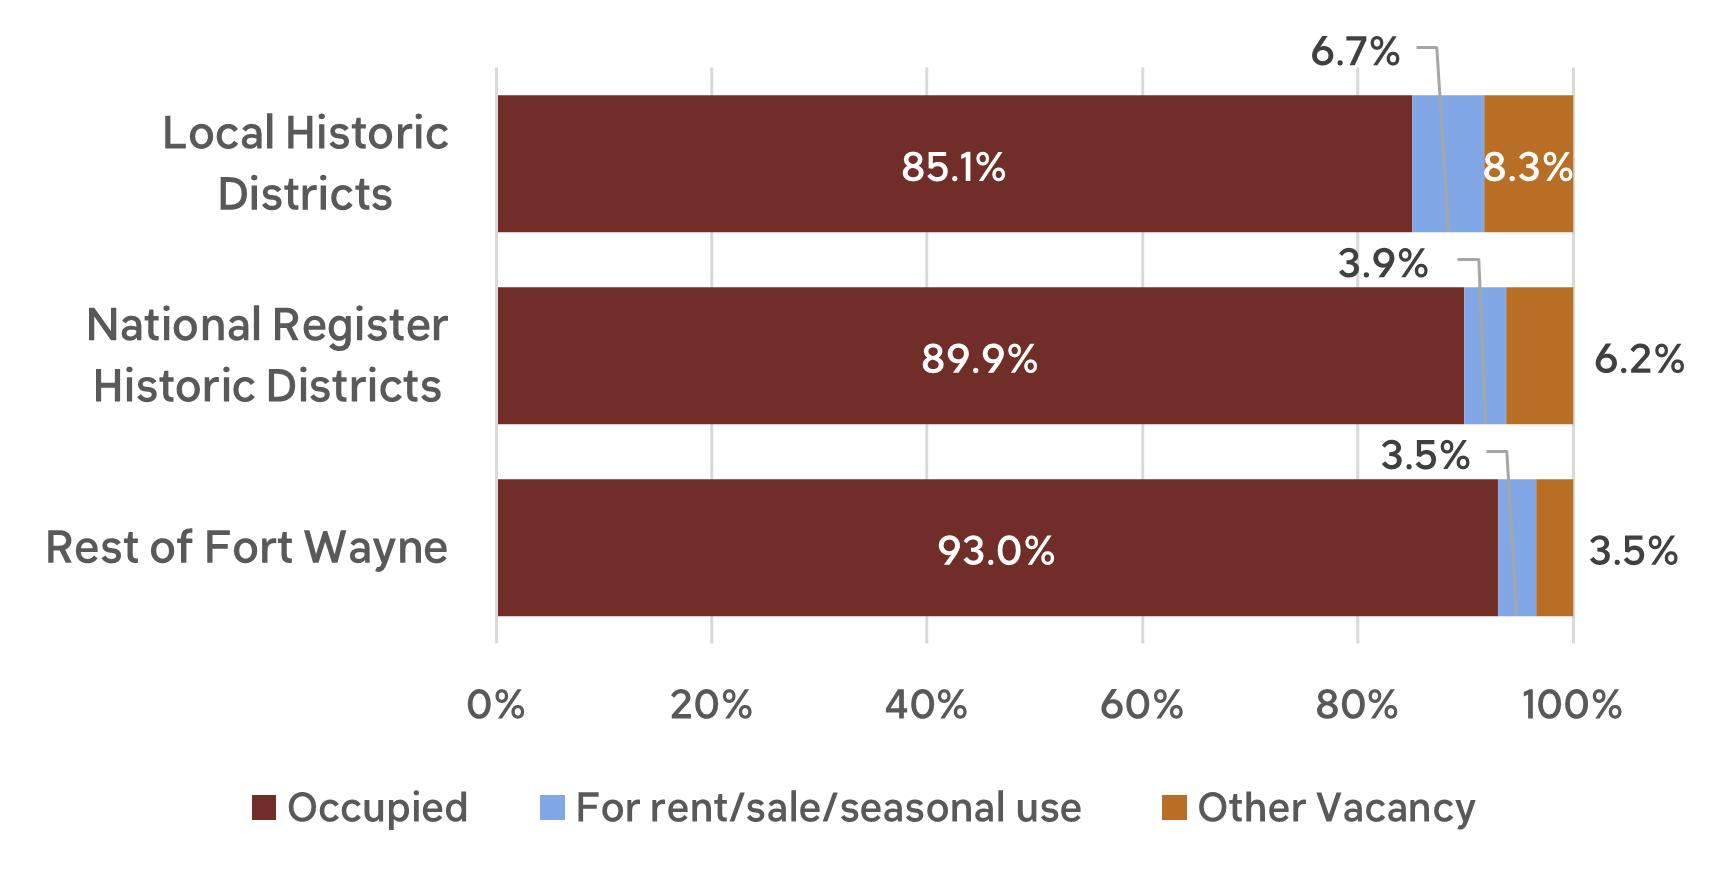
Overall, the City of Fort Wayne has a vacancy rate of 7.2%. Of Fort Wayne’s approximately 8,100 vacant housing units, only 1.6% are in local historic districts, while another 6.5% are in National Register historic districts. The vacancy rate in Fort Wayne’s Local and National Register historic districts is higher than that found in the rest of the City–15% and 10% respectively as opposed to just 7% in the rest of the city.
OCCUPANCY STATUS (2023)
Source: U.S. Census Bureau, “Occupancy Status,” ACS 5-year estimates, Table B25002, 2023
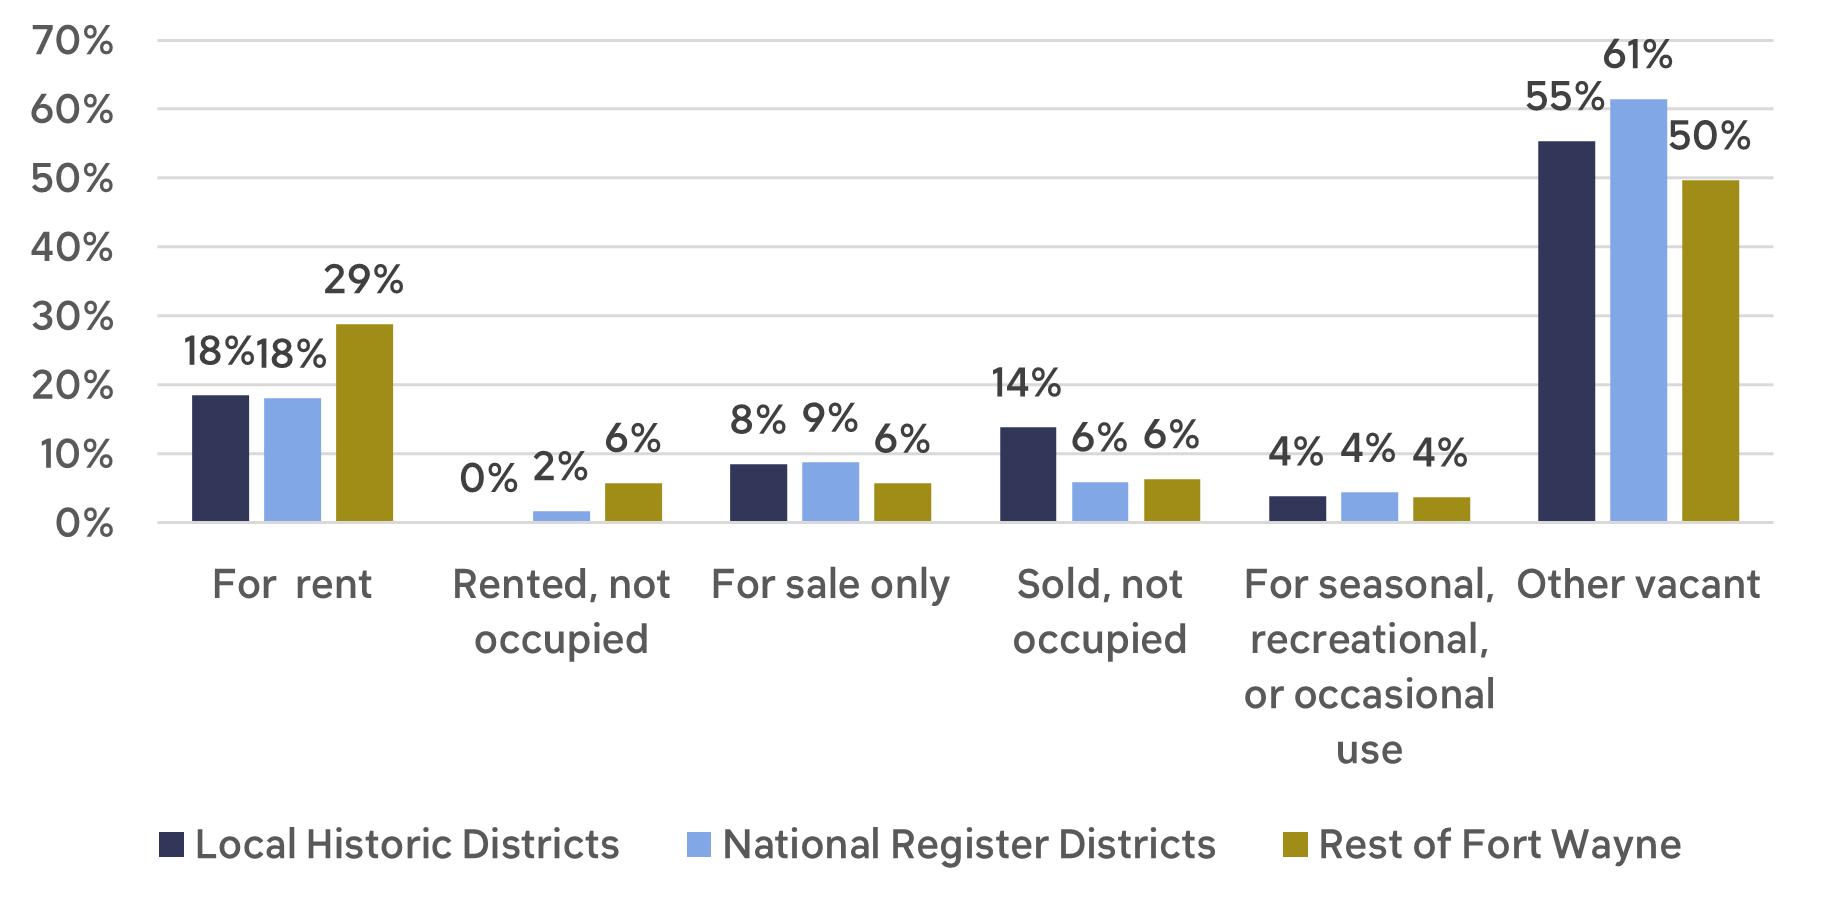
There are a variety of reasons why a unit of housing might be called “vacant” by the US Census. Many vacant units are currently on the market to be rented or sold, or they may only be listed for occasional, short term use. Around 55% of vacant properties in local historic districts and 61% of vacant properties in National Register historic districts are labeled as otherwise vacant. This could include properties in foreclosure or held for other legal proceedings, such as estate settlement, probate, or eviction. It can also include properties with code violations, units in need of repair or currently under renovation, or abandoned and condemned properties.6
VACANCY CHARACTERISTICS (2023)
Source: U.S. Census Bureau, “Vacancy Characteristics,” ACS 5-year estimates, Table B25004, 2023
6 For more information regarding U.S. Census vacancy characteristic definitions, see this document: https://www.census.gov/housing/hvs/definitions.pdf
When accounting for vacancy characteristics, local historic districts and National Register historic districts have a slightly higher rate of “other vacancy” than the rest of Fort Wayne.
OCCUPANCY STATUS WITH VACANCY CHARACTERISTICS, SIMPLIFIED (2023)
Source: U.S. Census Bureau, “Occupancy Status,” ACS 5-year estimates, Table B25002, 2023 and U.S. Census Bureau, “Vacancy Characteristics,” ACS 5-year estimates, Table B25004, 2023
Tenure
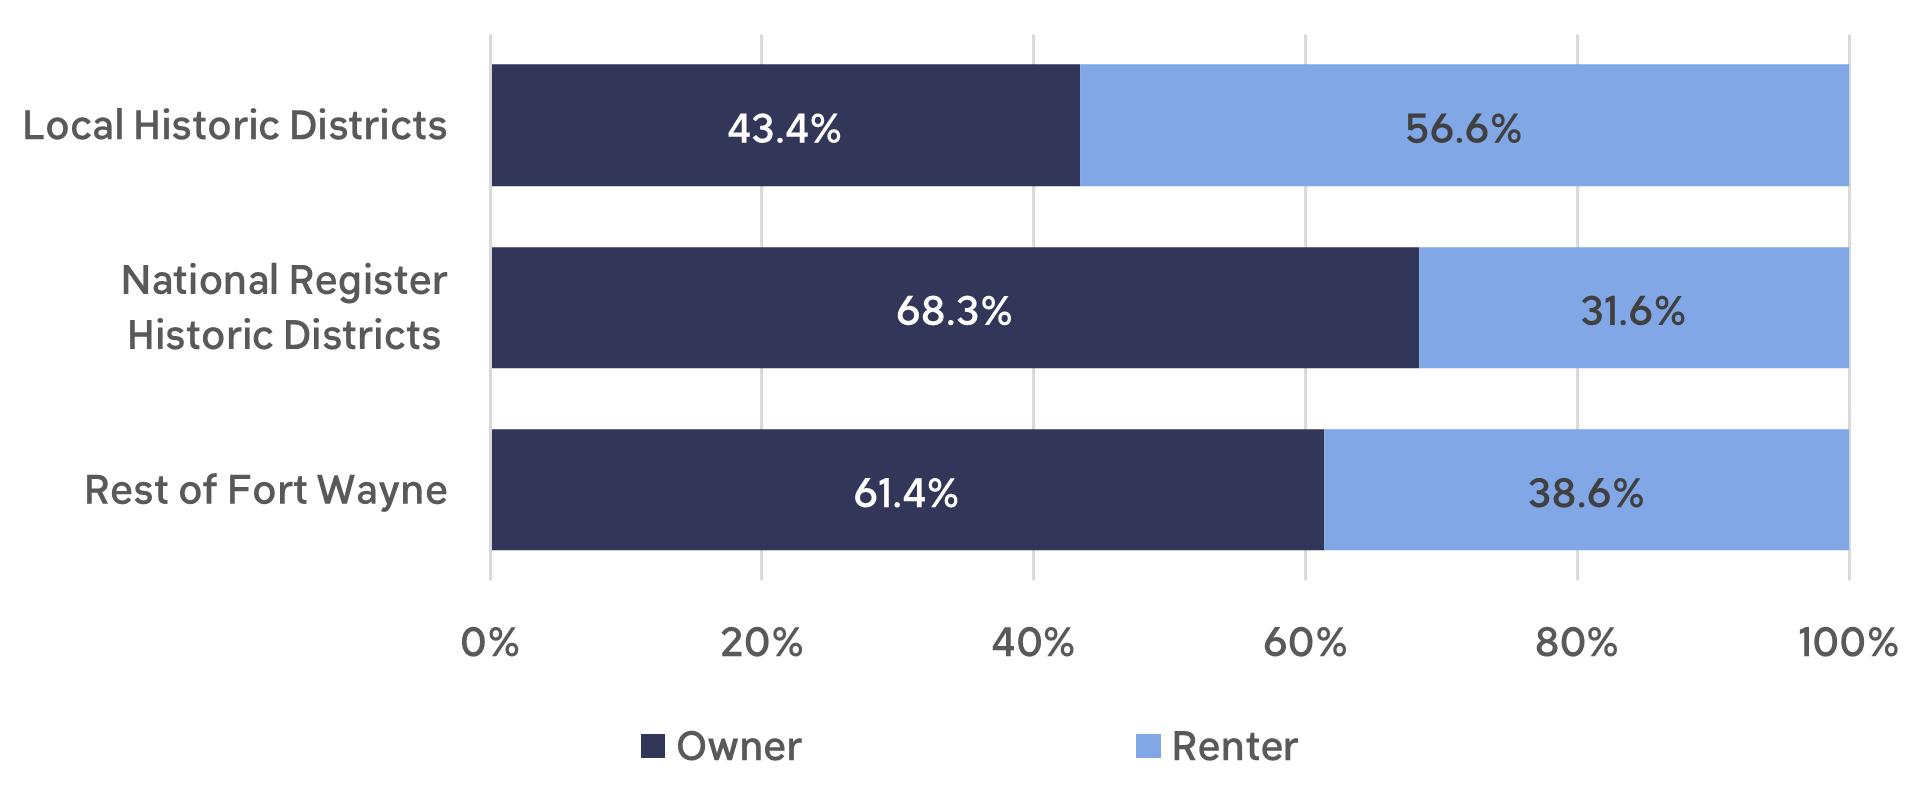
Overall, 61.6% of Fort Wayne’s housing units are owner occupied, while 38.4% are renter occupied. Of Fort Wayne’s 64,650 owner occupied households, .5% are located in local historic districts, while another nearly 5% are in National Register historic districts. Of the nearly 40,400 renter occupied households, 1% are in local historic districts and 3.7% are in National Register historic districts. National Register historic districts have a higher share of owner occupied housing units than both the local historic districts and the rest of Fort Wayne. Local historic districts have a high share of renter occupied units, likely attributable to the diverse types of housing units present there.
TENURE
(2023)
Source: U.S. Census Bureau, “Tenure,” ACS 5-year estimates, Table B25003, 2023
Length of Residency
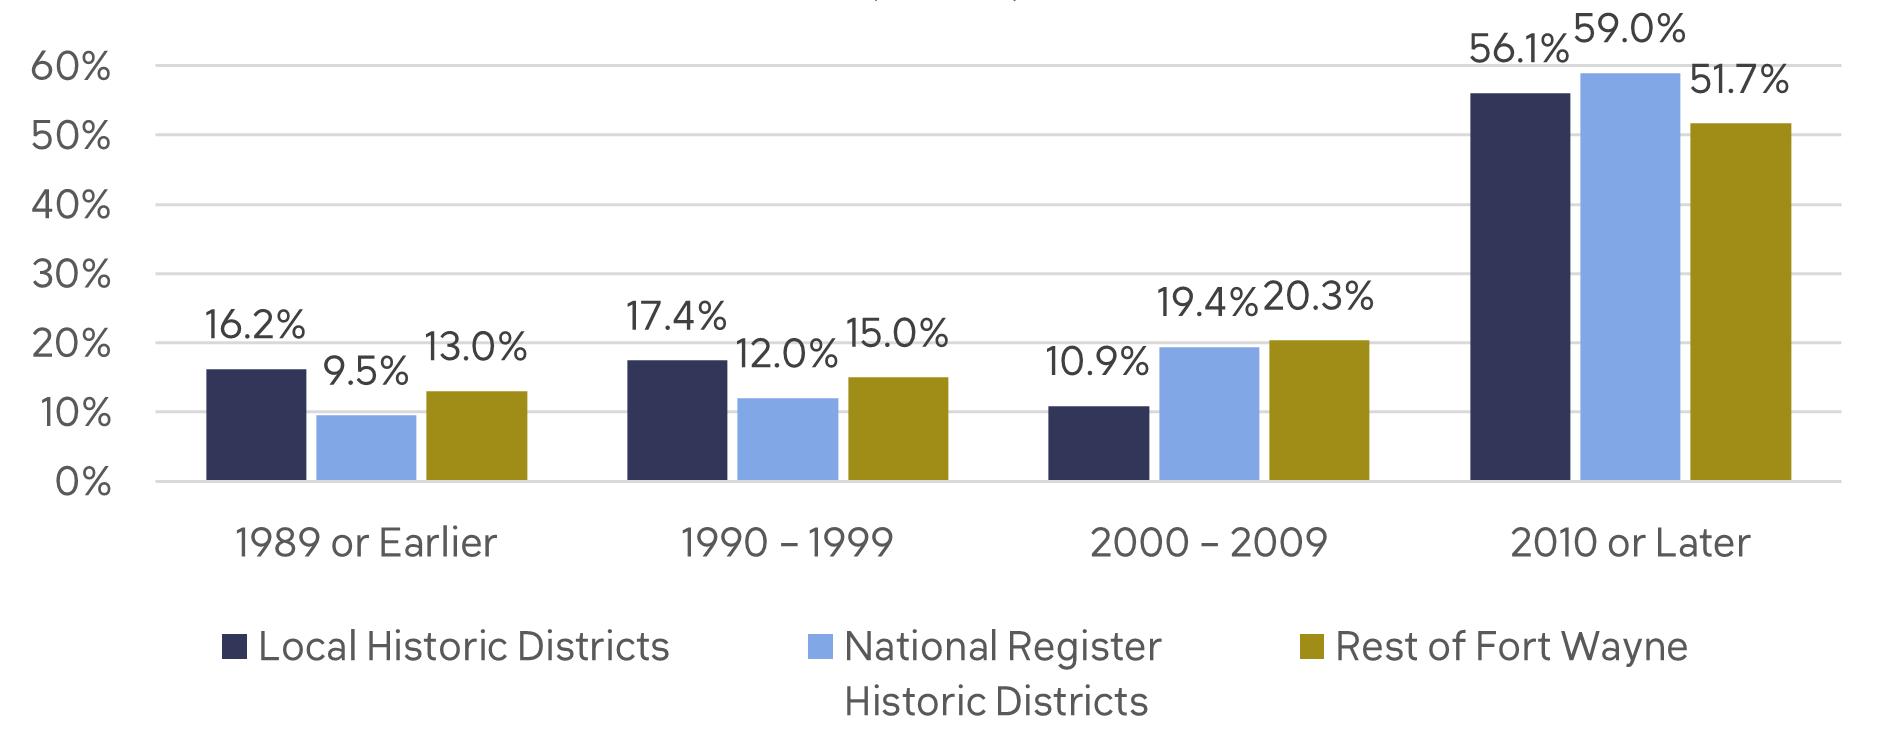
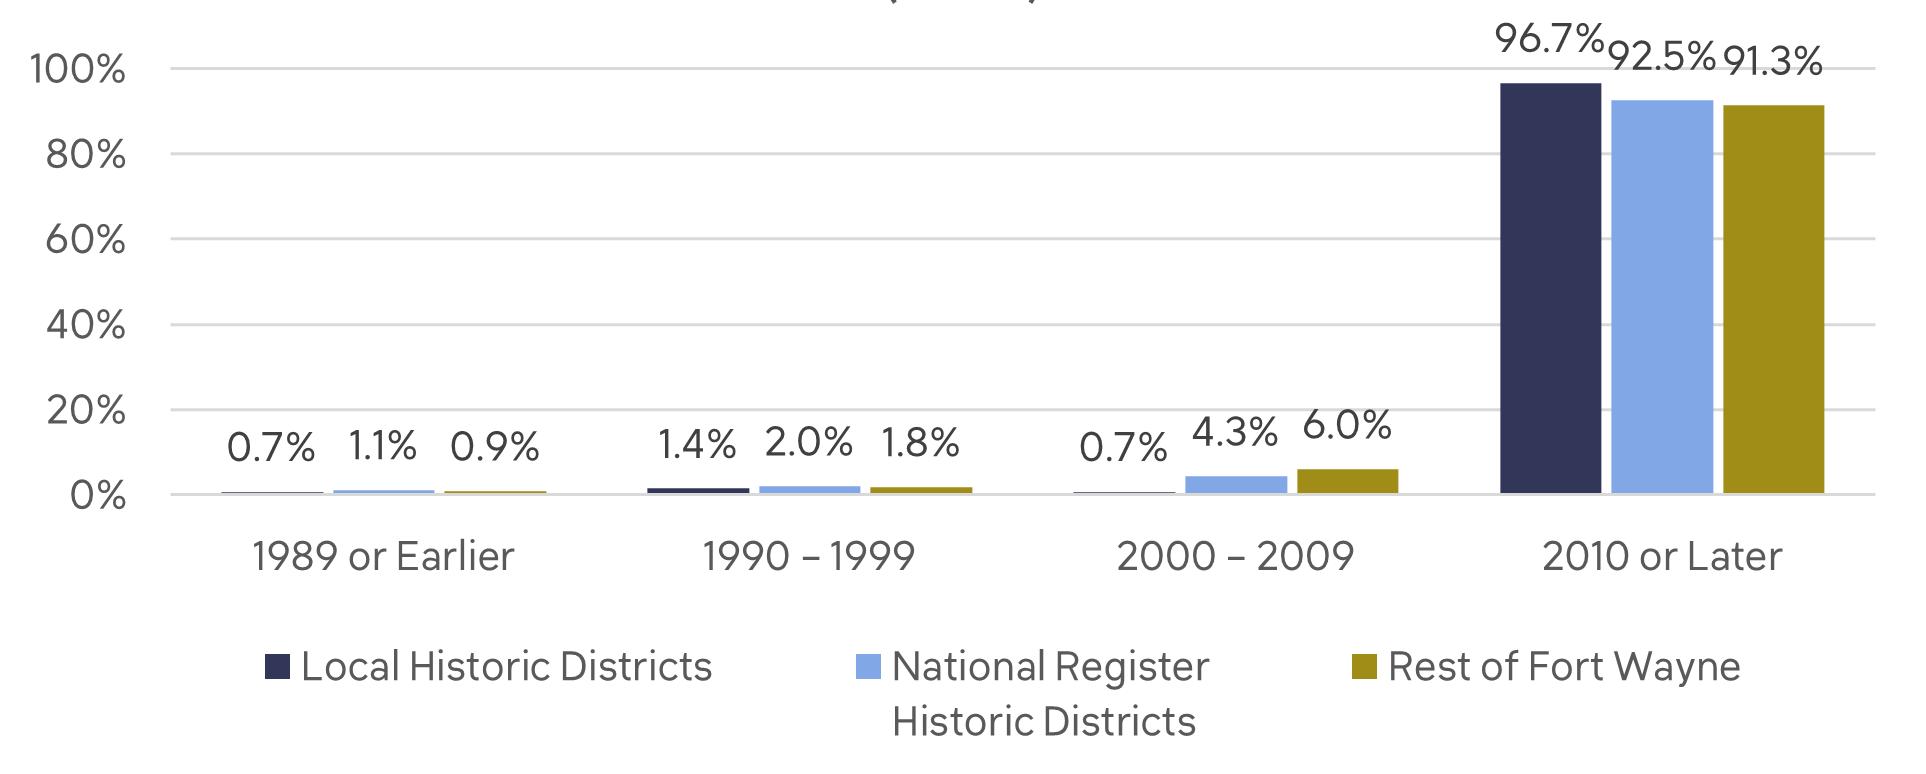
In the City overall, 48% of owner households moved into their homes prior to 2010. However, this is true for only 45% and 41% of owner households in local historic districts and National Register historic districts respectively. This speaks to the dynamic character of real estate in historic districts like West Central but also the dynamic changes in downtown Fort Wayne, which has attracted suburban dwellers to the ring around downtown.
OWNER HOUSEHOLDS BY YEAR MOVED IN (2023)
Source: U.S. Census Bureau, “Tenure by Year Moved In,” ACS 5-year estimates, Table B25038, 2023
Only 8.6% of Fort Wayne’s renters are long term residents. Only 3% of renters in local historic districts have lived in their homes since before 2010. However, a larger share, 7.5%, of renters in National Register historic districts moved into their homes before 2010.
RENTER HOUSEHOLDS BY YEAR MOVED IN (2023)
Source: U.S. Census Bureau, “Tenure by Year Moved In,” ACS 5-year estimates, Table B25038, 2023
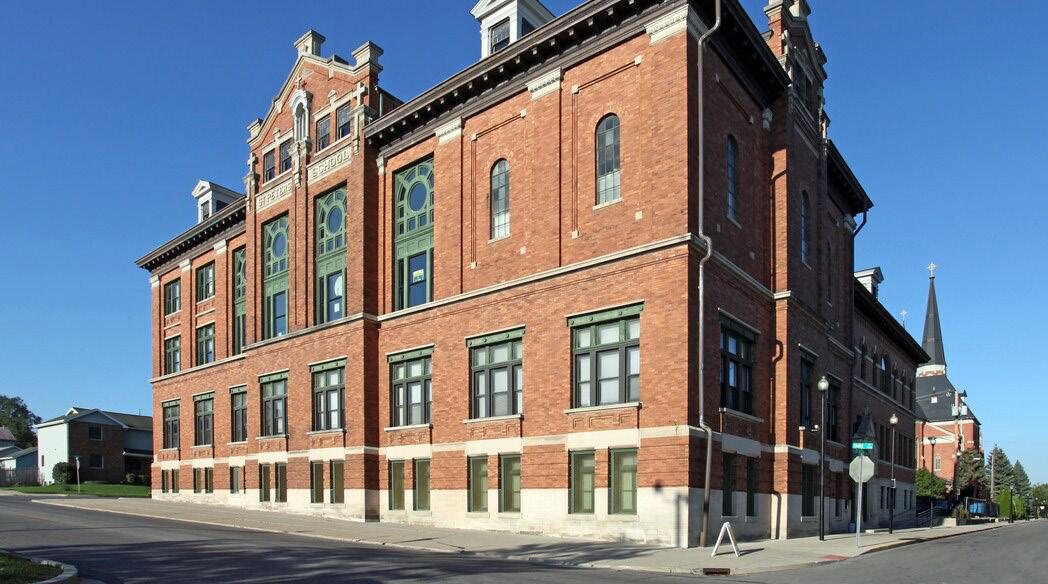
The historic St. Peter’s Catholic School was rehabilitated into 40 affordable senior apartments in 2006 using federal historic tax credits.
Household Income
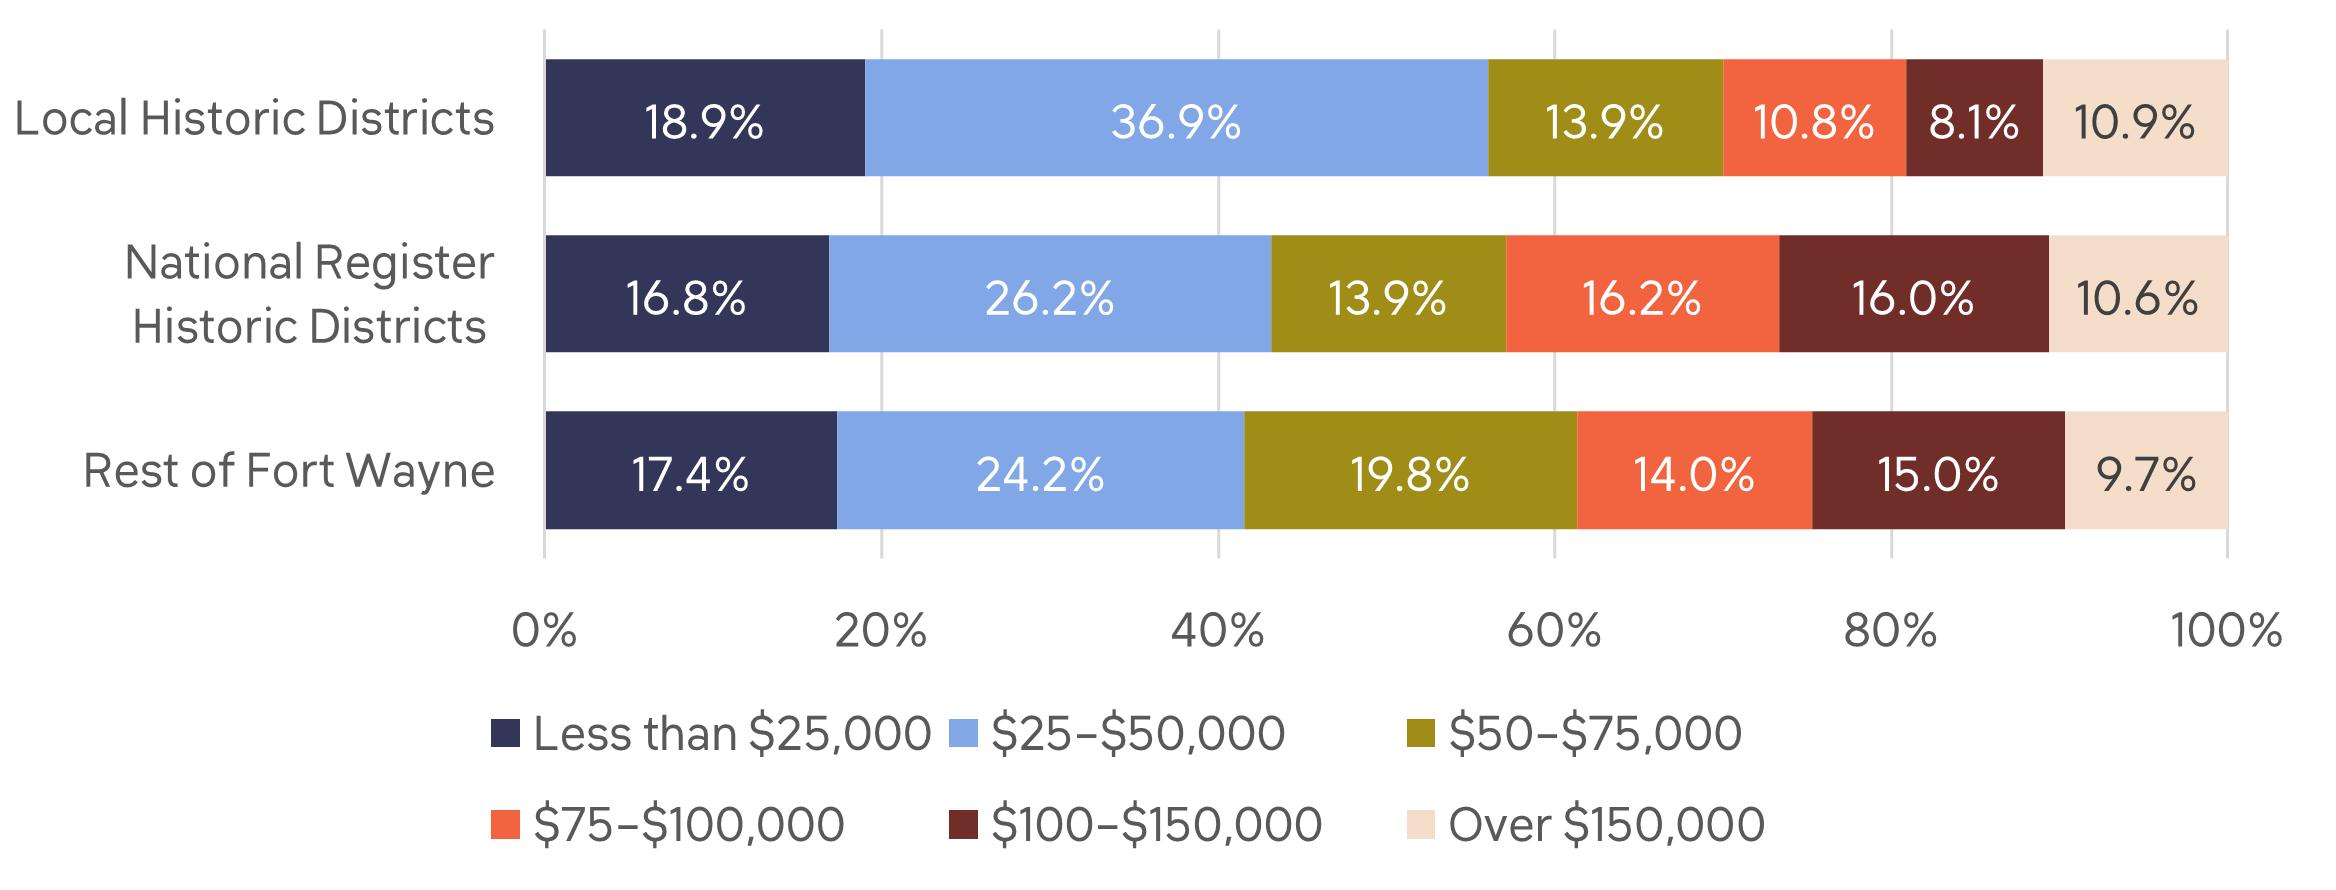
Housing affordability is, by default, a function of household income. In general, a household is considered to be “cost burdened” when they are spending more than 30% of their monthly income on housing costs and “severely cost burdened” when they are spending more than 50% of their monthly income on housing costs.
Overall, Fort Wayne’s median household income in 2023 was $60,293.7 Almost 61% of the households in local historic districts make less than the City’s median income. This suggests that local districts are economically diverse and inclusive.
HOUSEHOLD INCOME (2023)
Source: U.S. Census Bureau, “Household Income,” ACS 5-year estimates, Table B19001, 2023
7 U.S. Census Bureau, Census QuickFacts, Fort Wayne, ACS 2019-2023.
Homeowner Housing Costs
Median selected monthly owner costs, regardless of whether or not there is a mortgage, in 2023 in Fort Wayne is $928. Almost 60% of owner households in local historic districts have owner costs less than the city’s median, while 54% of the owner households in National Register historic districts are paying less than the median.
UNITS
BY MONTHLY OWNER COSTS (2023)

Source: U.S. Census Bureau, “Selected Monthly Owner Costs,” ACS 5-year estimates, Table B25087, 2023
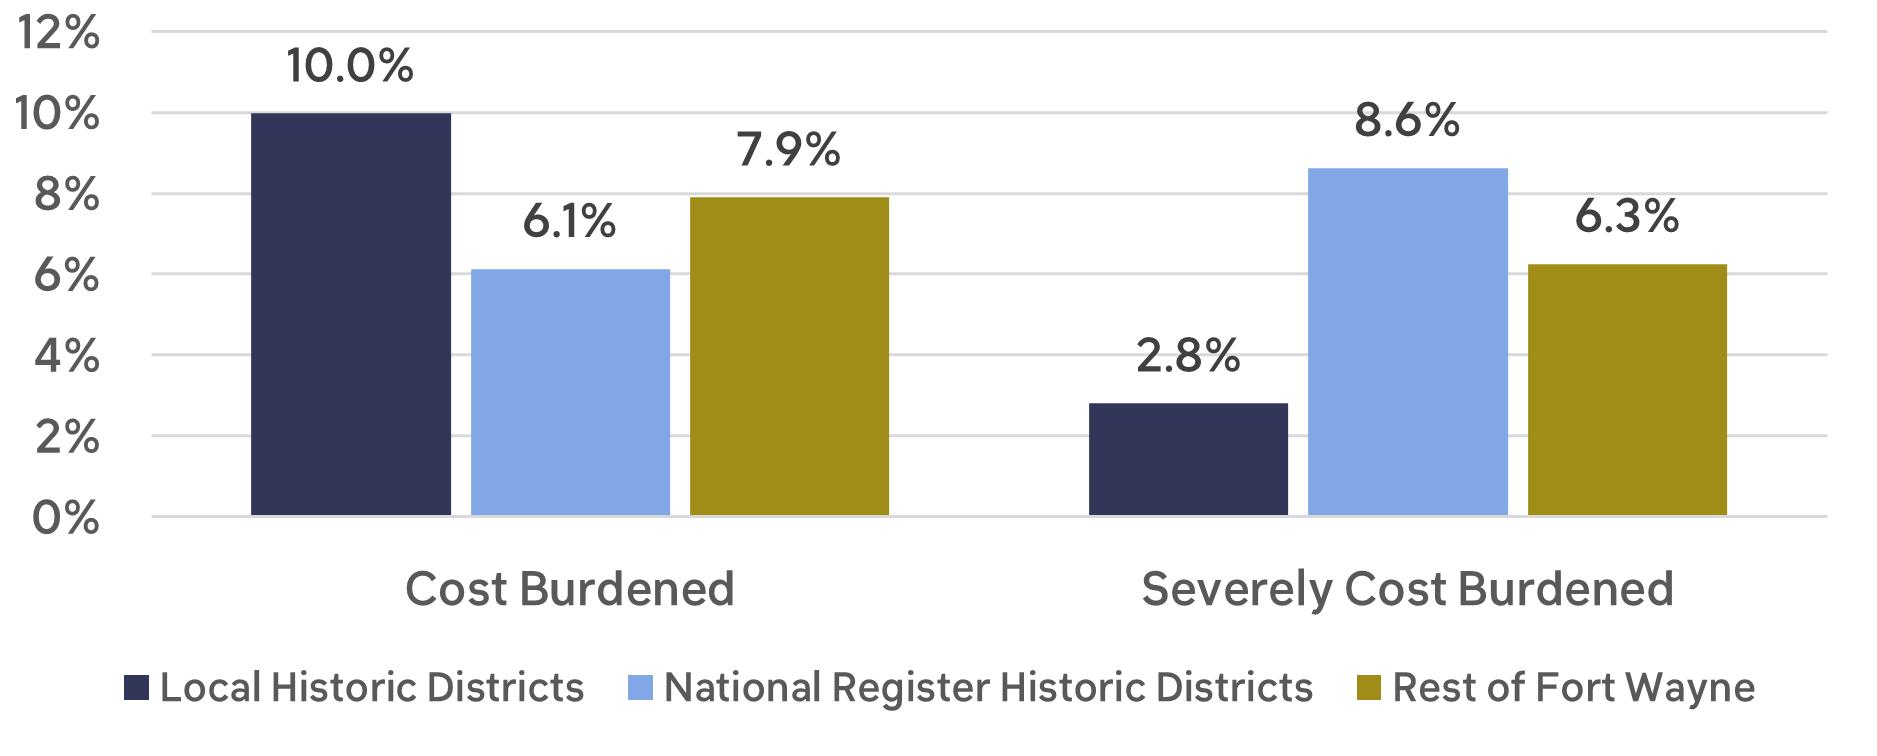
Overall, 14.2% of homeowners in Fort Wayne are cost-burdened or severely costburdened, while this is true of 12.8% of homeowners in local historic districts and 14.8% of homeowners in National Register historic districts. Owner households in local historic districts are slightly less likely to be housing cost burdened than households in the rest of Fort Wayne. This lines up with other data points -- local historic districts have lower incomes, but also lower housing costs. This suggests that housing in local historic districts meets the budgetary needs of residents.
SHARE OF COST BURDENED OWNERS (2023)
Source: U.S. Census Bureau, “Housing Costs as a Percentage of Household Income in the Past 12 Months,” ACS 5-year estimates, Table B25140, 2023
Renter Housing Costs
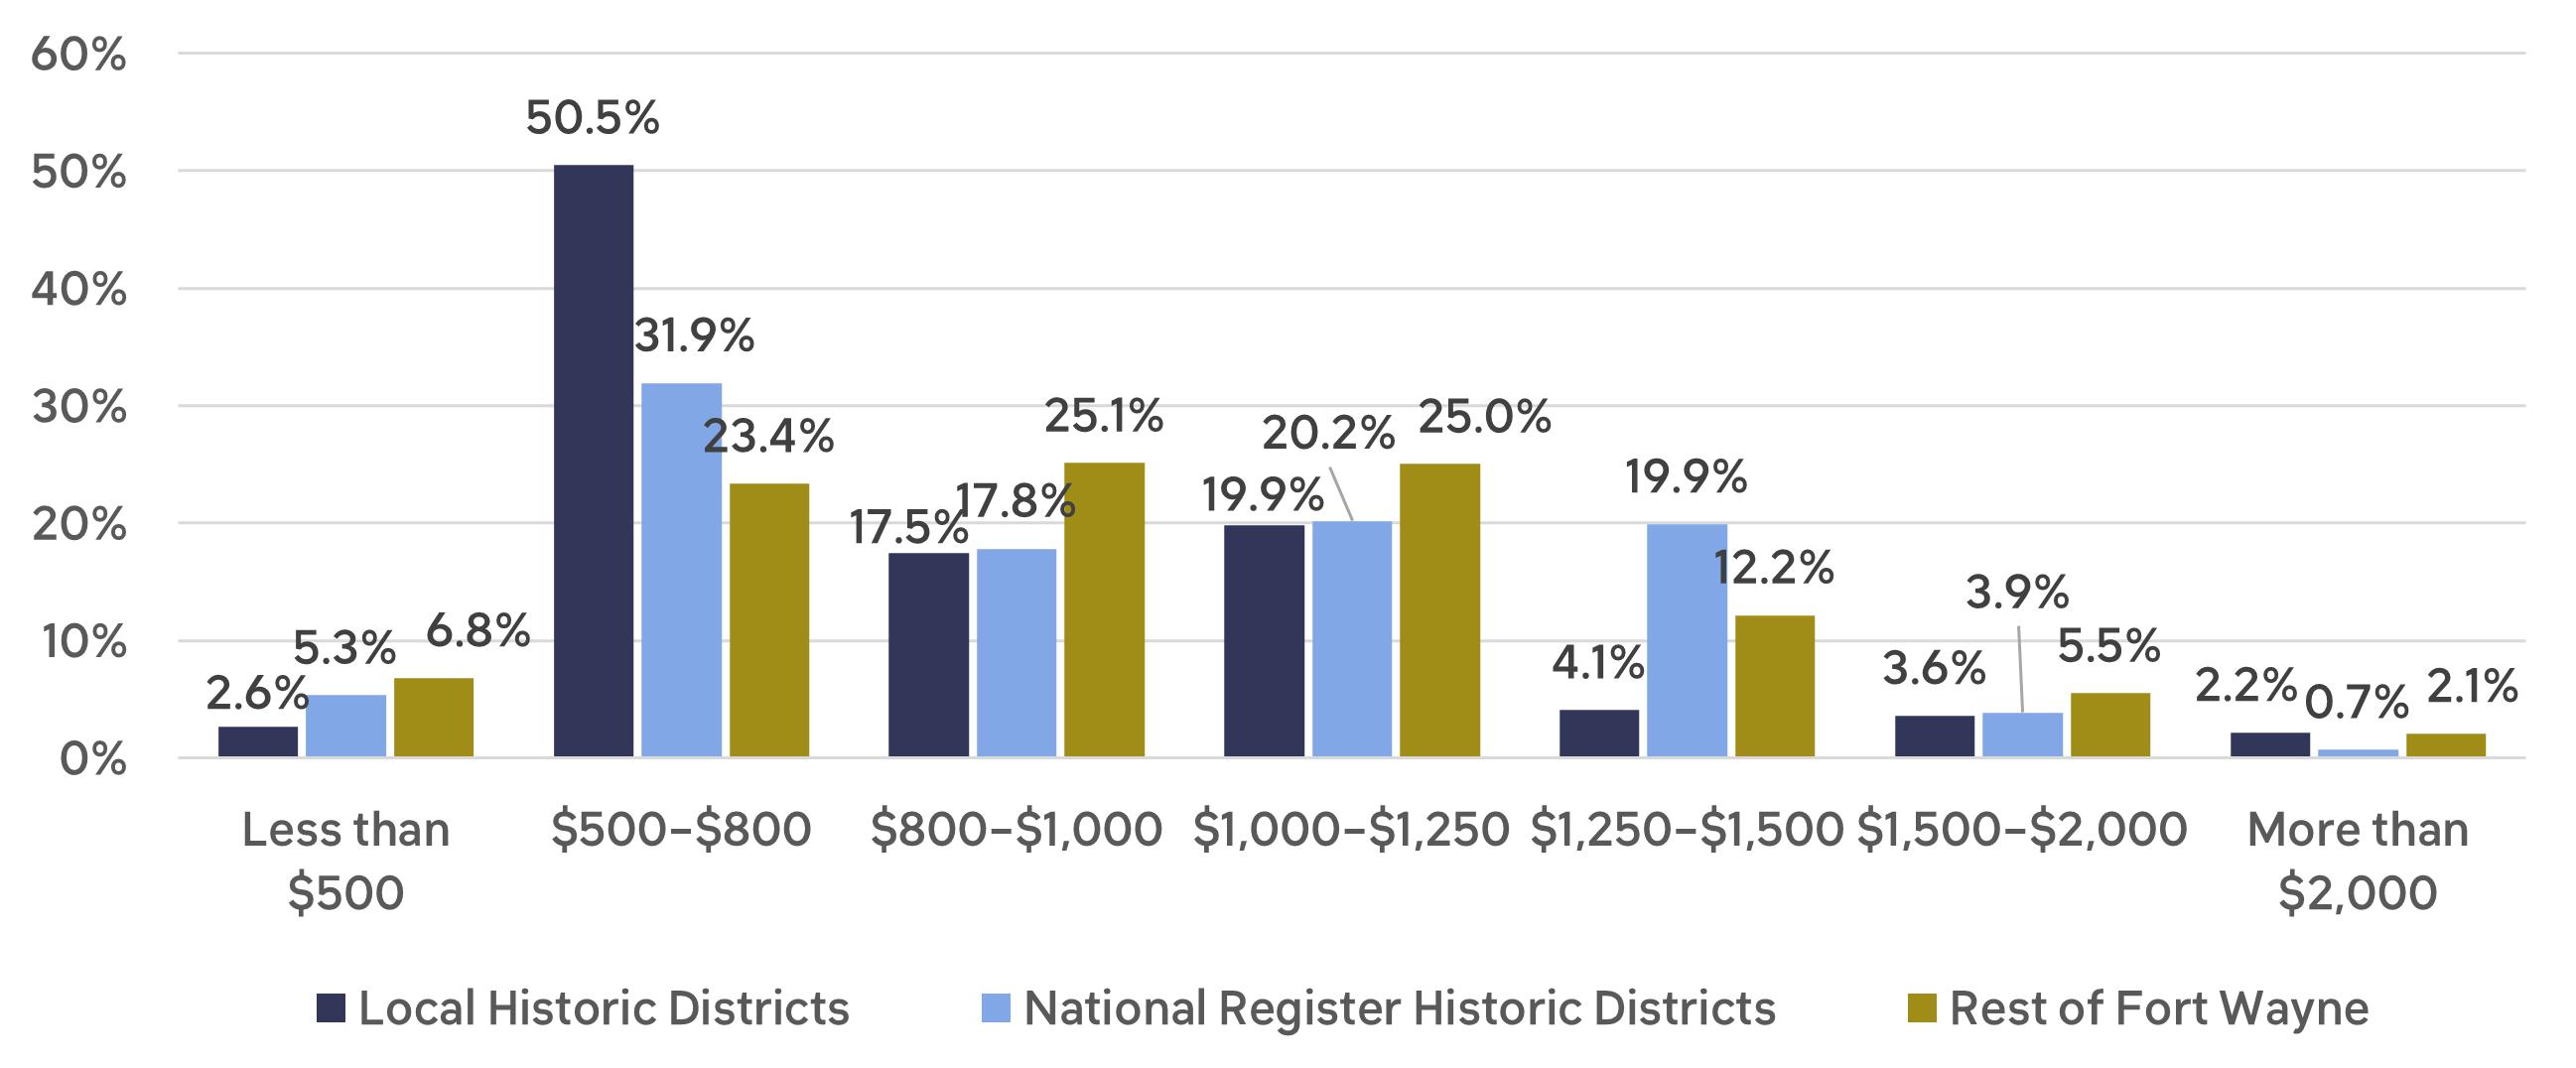
Median gross rent in Fort Wayne in 2023 is $959. Almost 71% of renter households in local historic districts have rental costs less than the city’s median, while 55% of the renter households in National Register historic districts are paying less than the median.
71% of renters in local historic districts spend less than the city’s median on rent.
UNITS BY GROSS RENTAL COSTS (2023)
Source: U.S. Census Bureau, “Gross Rent,” ACS 5-year estimates, Table B25063, 2023
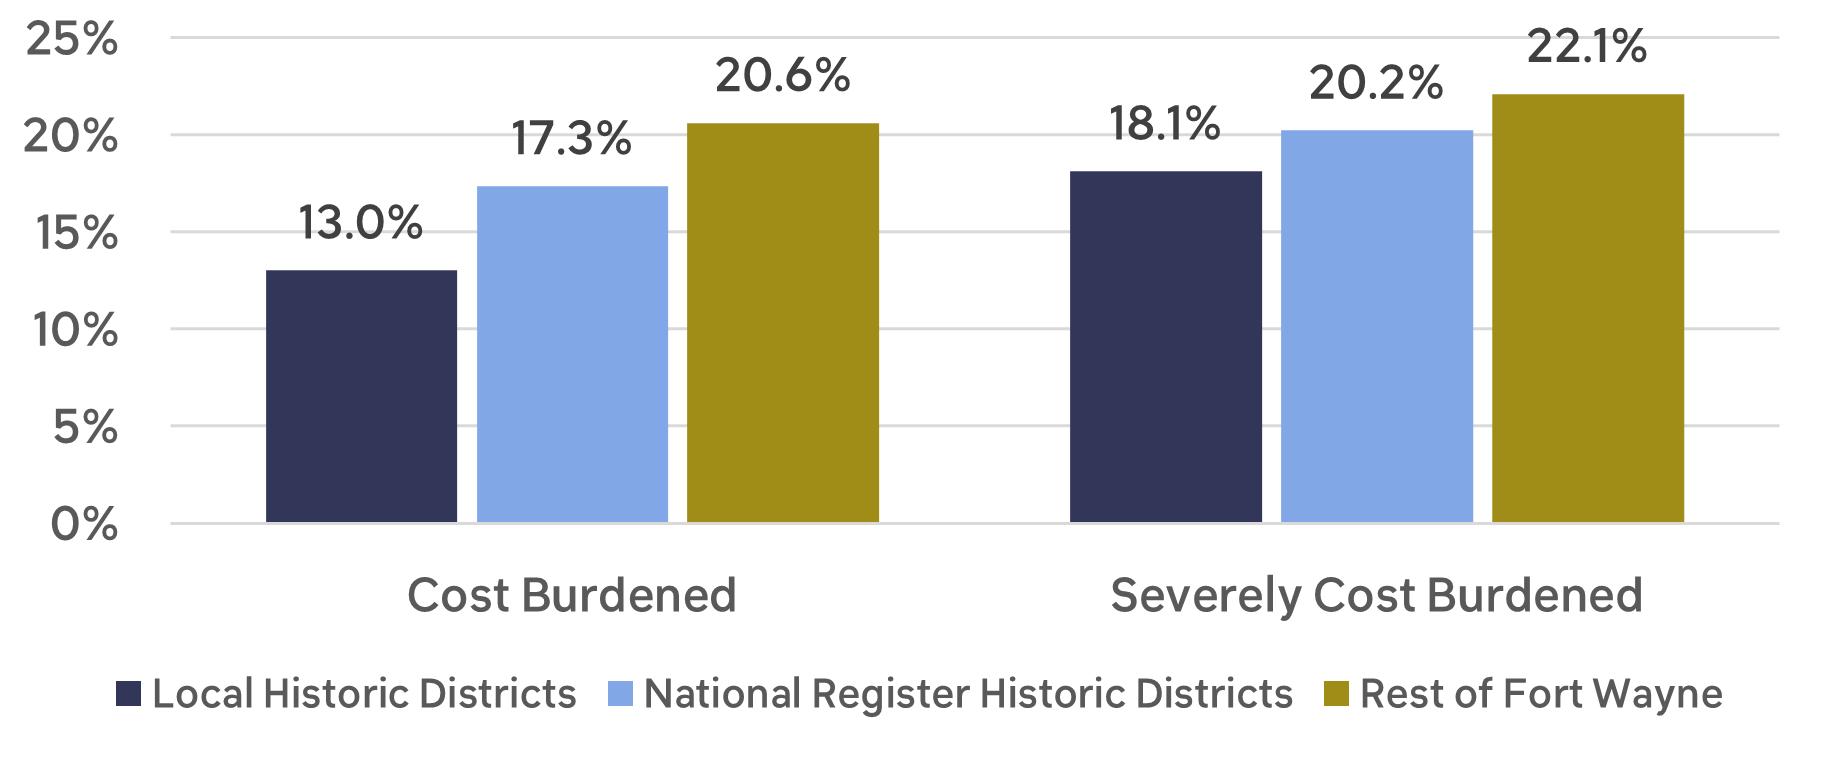
The share of renters that are cost burdened is relatively high in Fort Wayne at 42.4%. However, renters in local historic districts are less likely to be cost burdened than those in either National Register historic districts or the rest of Fort Wayne. Within local historic districts, 13% of renters are cost burdened and an additional 18% are severely cost burdened, meaning they spend over 50% of their monthly income on rent. These figures are much higher in the other study geographies.
SHARE OF COST BURDENED RENTERS (2023)
Source: U.S. Census Bureau, “Housing Costs as a Percentage of Household Income in the Past 12 Months,” ACS 5-year estimates, Table B25140, 2023
Heritage Tourism
Tourism is a major component of the Fort Wayne economy. An estimated 9.2 million visitors came to Fort Wayne last year, spending $1.1 billion dollars. With the Allen County Public Library Genealogy Center, the Old Fort, The History Center, and the Johnny Appleseed Festival as major draws, as well as The Landing, a vibrant historic commercial district, many of Fort Wayne’s visitors fall into the heritage visitor category. Fort Wayne is rich in both tangible (e.g. historic buildings and sites) and intangible (e.g. genealogical information) heritage.
Between now and 2030 nationally the growth rate for tangible heritage is estimated at 3.6% per year and intangible heritage visitation at 5.6% per year. While older travelers are the largest component of heritage visitors, the fastest growth rate in interest are Millennials and GenXers.
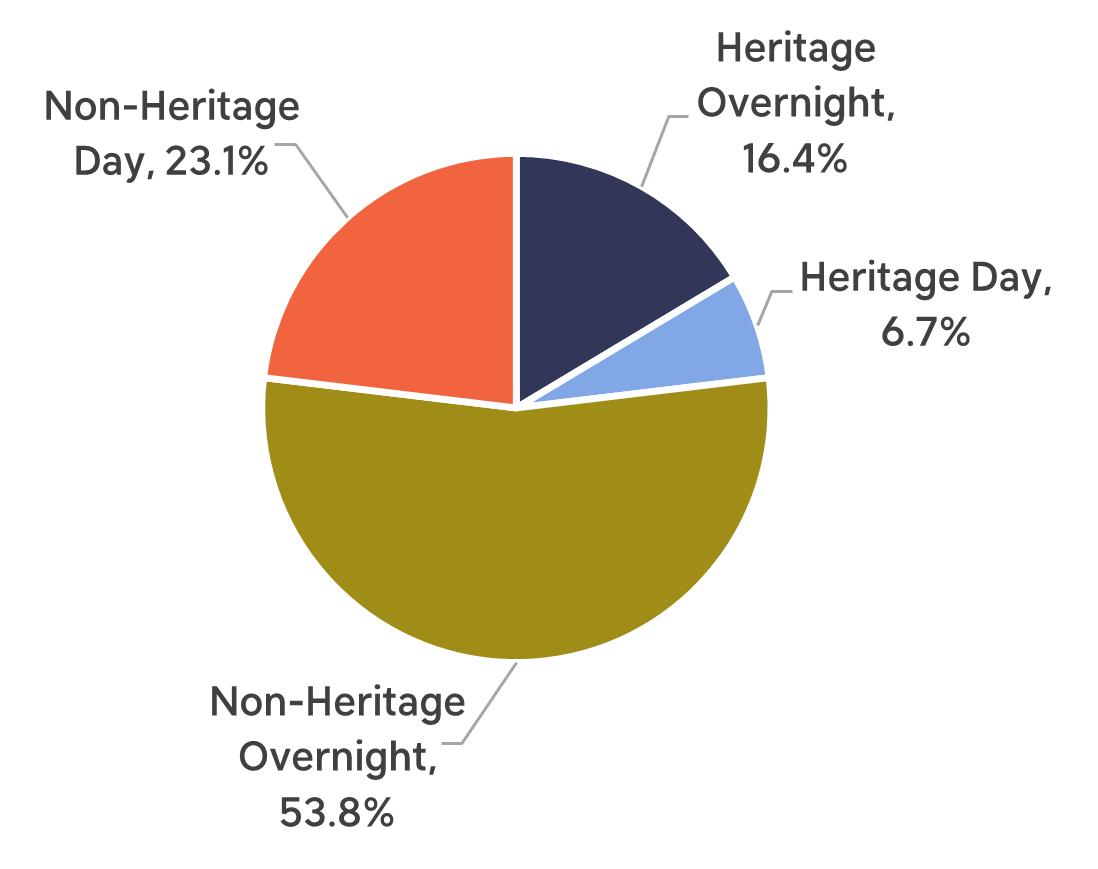
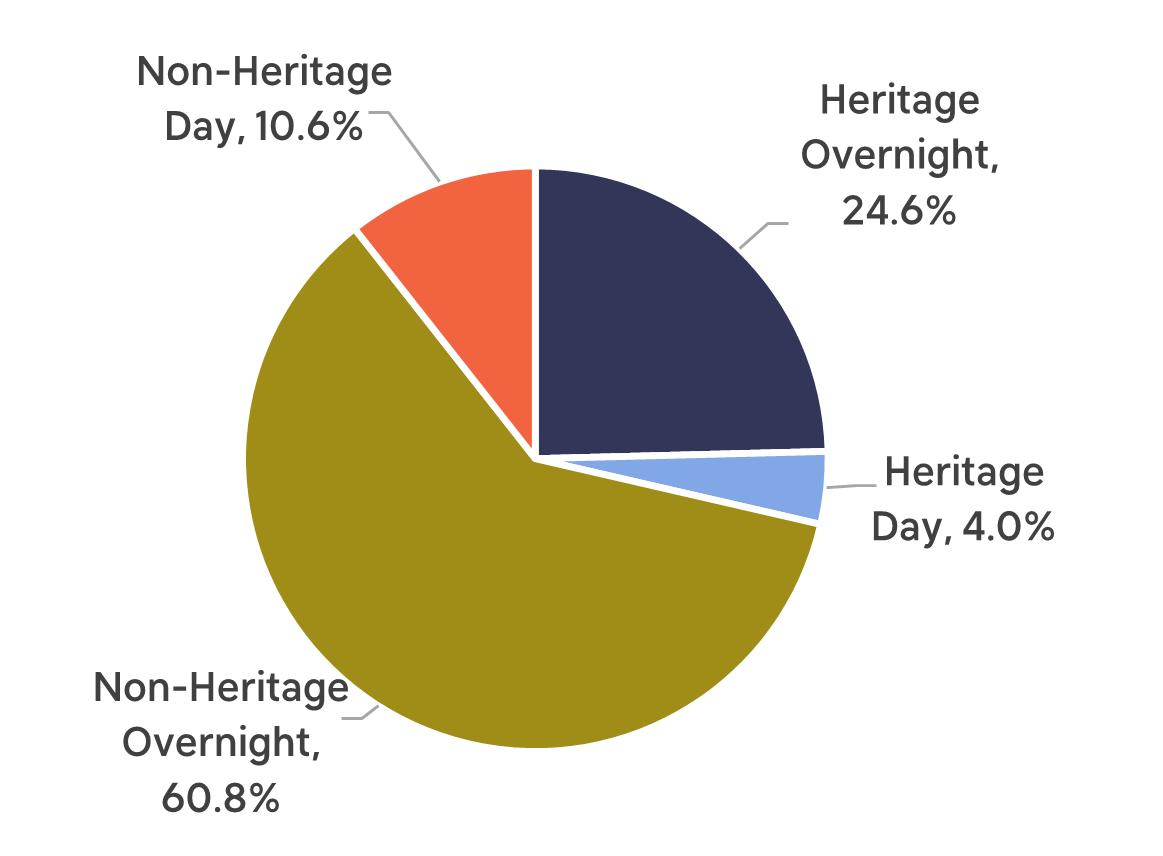
An estimated 23.1% of all visitors to Fort Wayne are heritage visitors, the majority of those staying overnight. Overnight visitors have a larger economic impact because they spend money on hotel stays and meals. Overall, heritage visitors tend to stay longer, visit more places, and spend more per day than other types of tourists. While the heritage visitor share is just over 23% of all visitors, their expenditures are nearly 29% of the total.
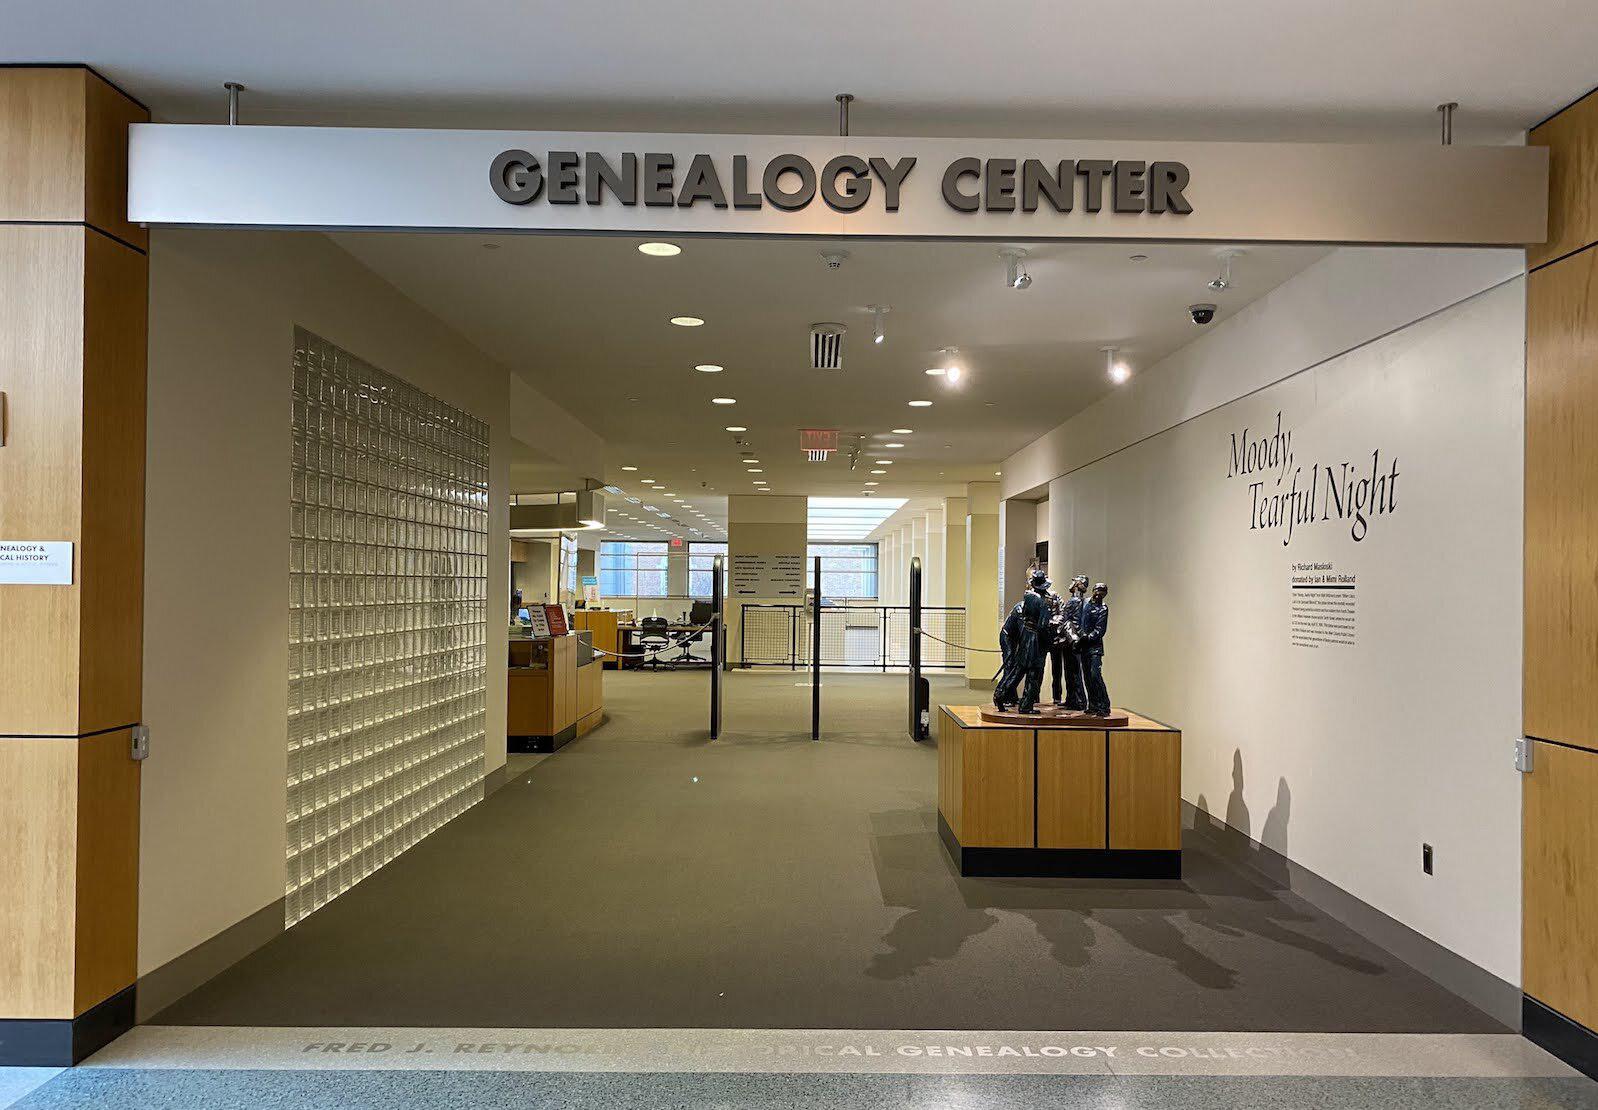
Fort Wayne is the home of the Allen County Public Library, and in addition to providing library services to the citizens of the county, it is home to the Genealogy Center and the Roland Center for Lincoln Research, two magnets for visitors from across the nation.
The Genealogy Center is the largest public library genealogy research center in the United States, housing 1.2 million physical items in its collection and more than 6.2 million items in its free digital collections. Open seven days a week, the Center offers consultation to anyone doing family history and offers on-line search tools for those who cannot visit. It periodically hosts regional, national, and international genealogical societies, as well as individuals, families, and groups from across the country, making it one of the primary tourism magnets for the region.
The Rolland Center for Lincoln Research is another gem for Fort Wayne and Allen County. The center is home to one of the most accessible collections of Abraham Lincoln artifacts nationwide - over 20,000 items. The collection is digitized, and visitors can access interactive displays that are regularly changed, providing detailed history from documents, books, newspapers, maps, and other primary source material. The Lincoln Financial Foundation Collection, valued at $20 million when it was donated to the State of Indiana and the Allen County Public Library, was divided between the Indiana State Museum in Indianapolis and Fort Wayne and is the basis for the Rolland Center’s rich assemblage.

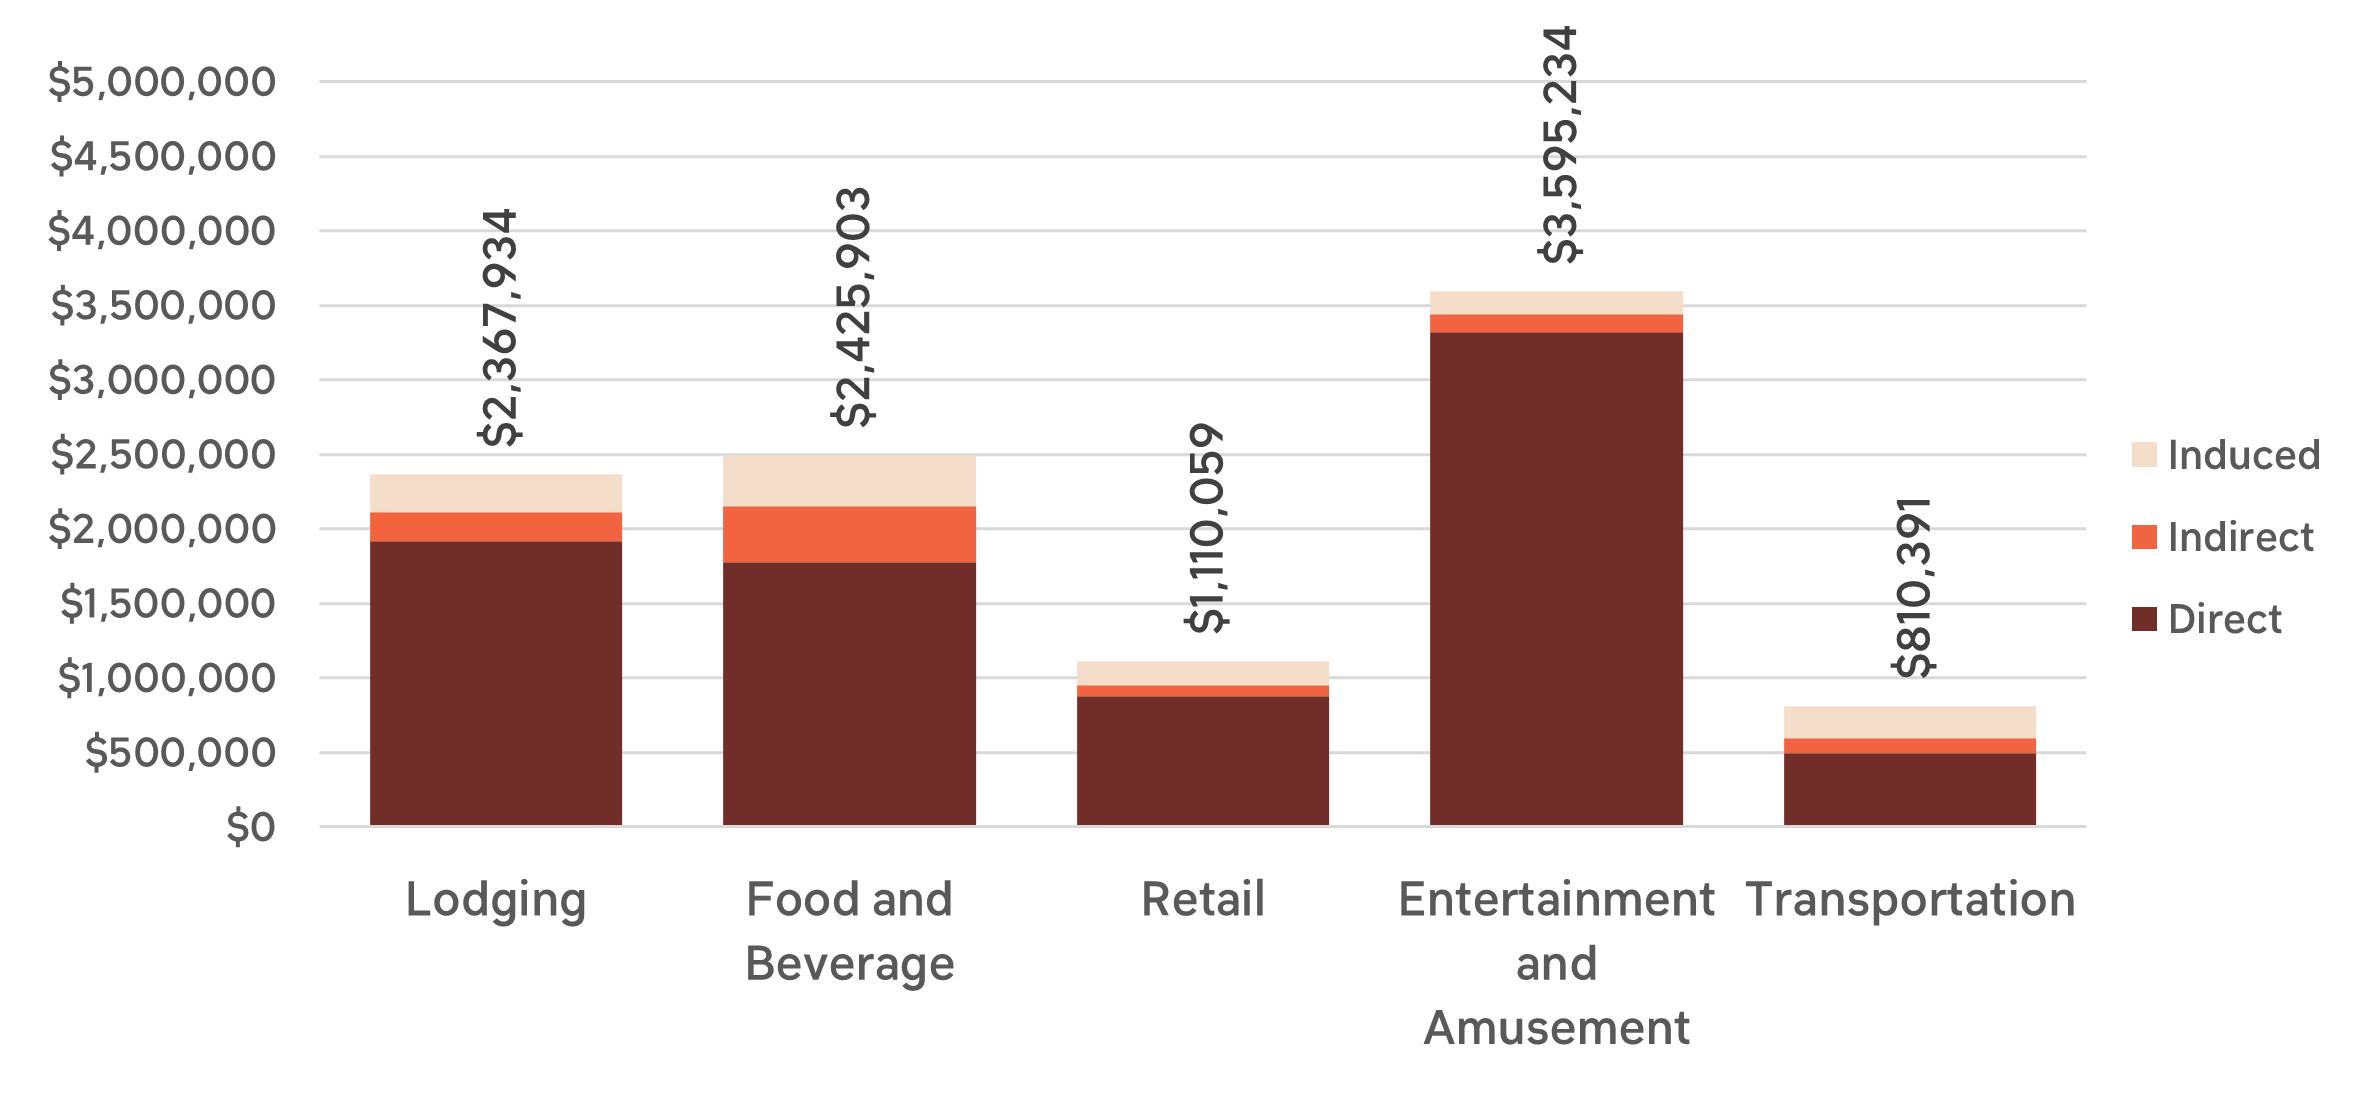
Tourists in general tend to spend their traveling dollars in five areas: food and beverage, lodging, retail purchases, transportation, and recreation (amusements and entertainment). The heritage visitors to Fort Wayne spend nearly a third of a billion dollars a year in those five categories.
Annual Expenditures of Heritage Visitors
Food
Lodging
Retail
Transportation
Recreation
Total
$70,391,742
$57,282,534
$56,475,473
$53,082,113
$32,875,311
$14,430,032 $84,821,774
$0 $57,282,534
$11,577,251 $68,052,724
$10,881,626 $63,963,739
$6,739,310 $39,614,621
$270,107,173 $43,628,220 $313,735,392
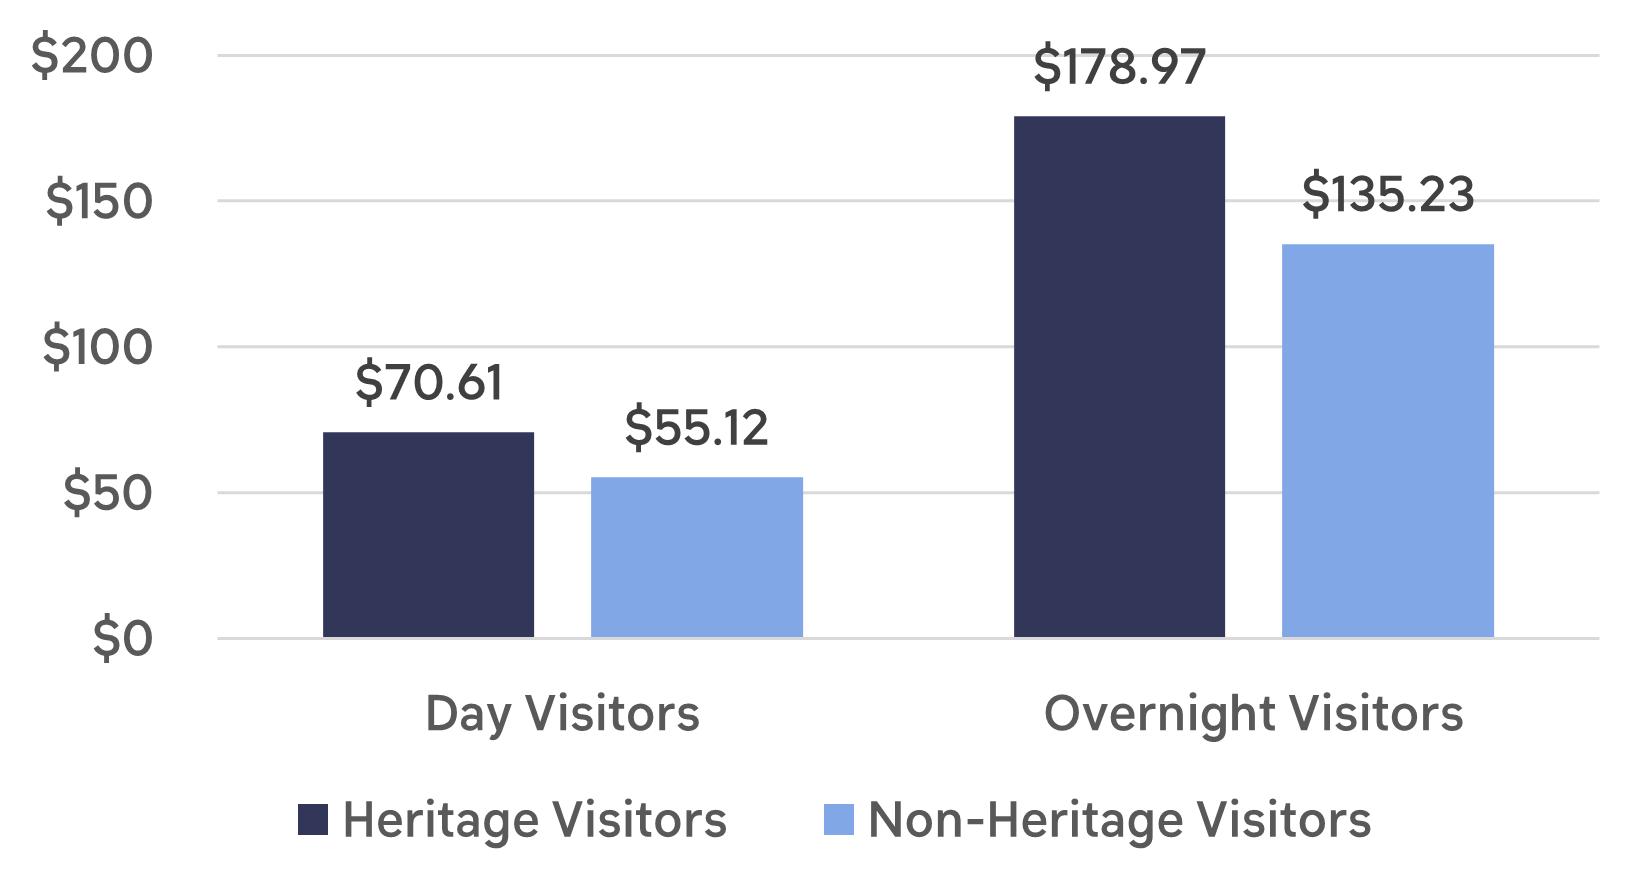
One of the reasons for this sizable impact is that the per trip expenditure of both day and overnight heritage visitors is greater than that of non-heritage tourists.
PER TRIP EXPENDITURES
HERITAGE VISITORS VS NON-HERITAGE VISITORS
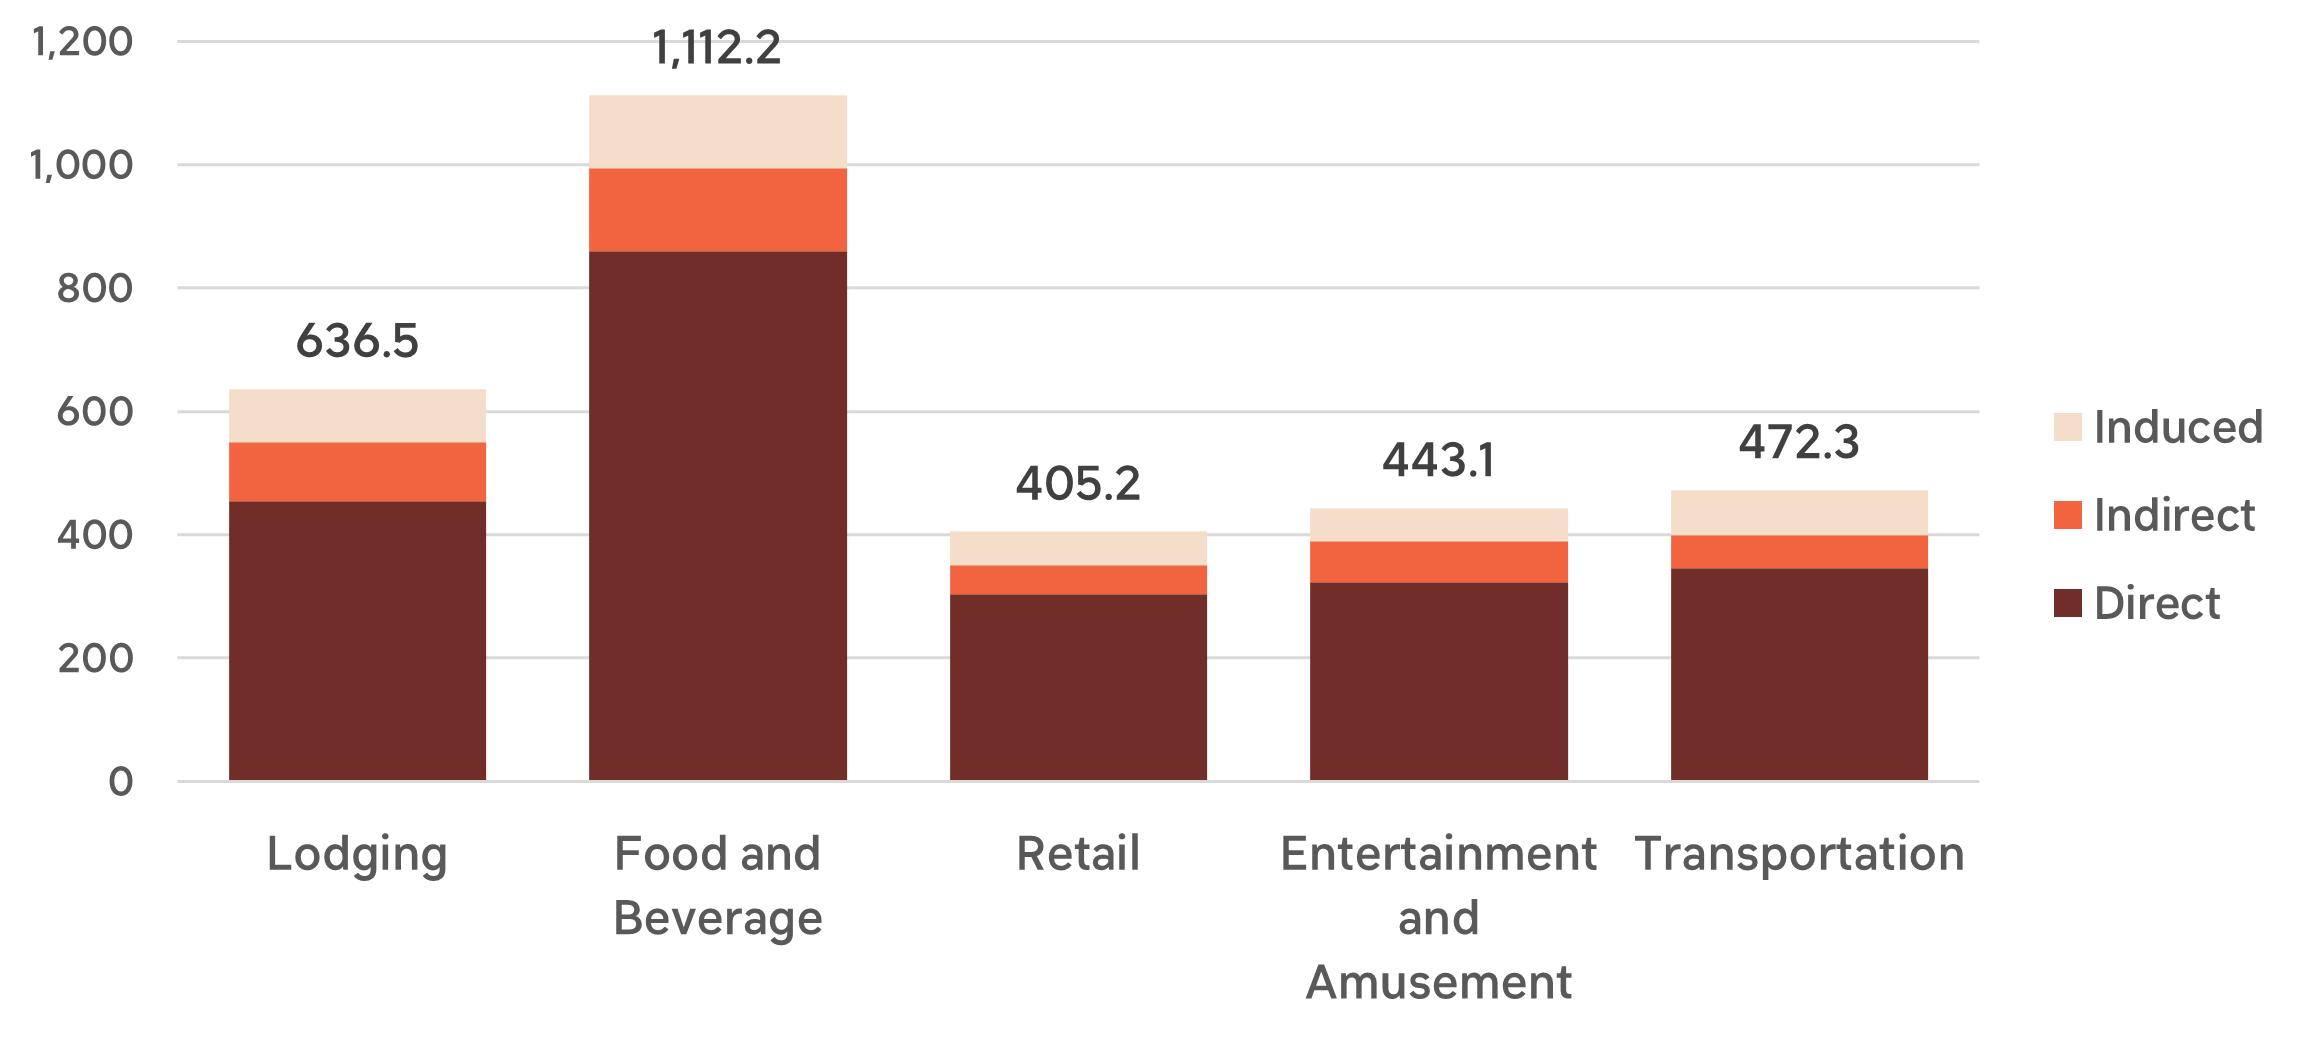
Based on these expenditures, the jobs, labor income, and local taxes generated by these heritage visitors can be calculated. In 2024, more than 3,000 full time equivalent jobs were created through the heritage portion of Fort Wayne’s tourism industry, three-quarters of them being direct jobs. If heritage tourism were a single industry, it would be the 5th largest employer in Allen County.
JOBS FROM HERITAGE TOURISM
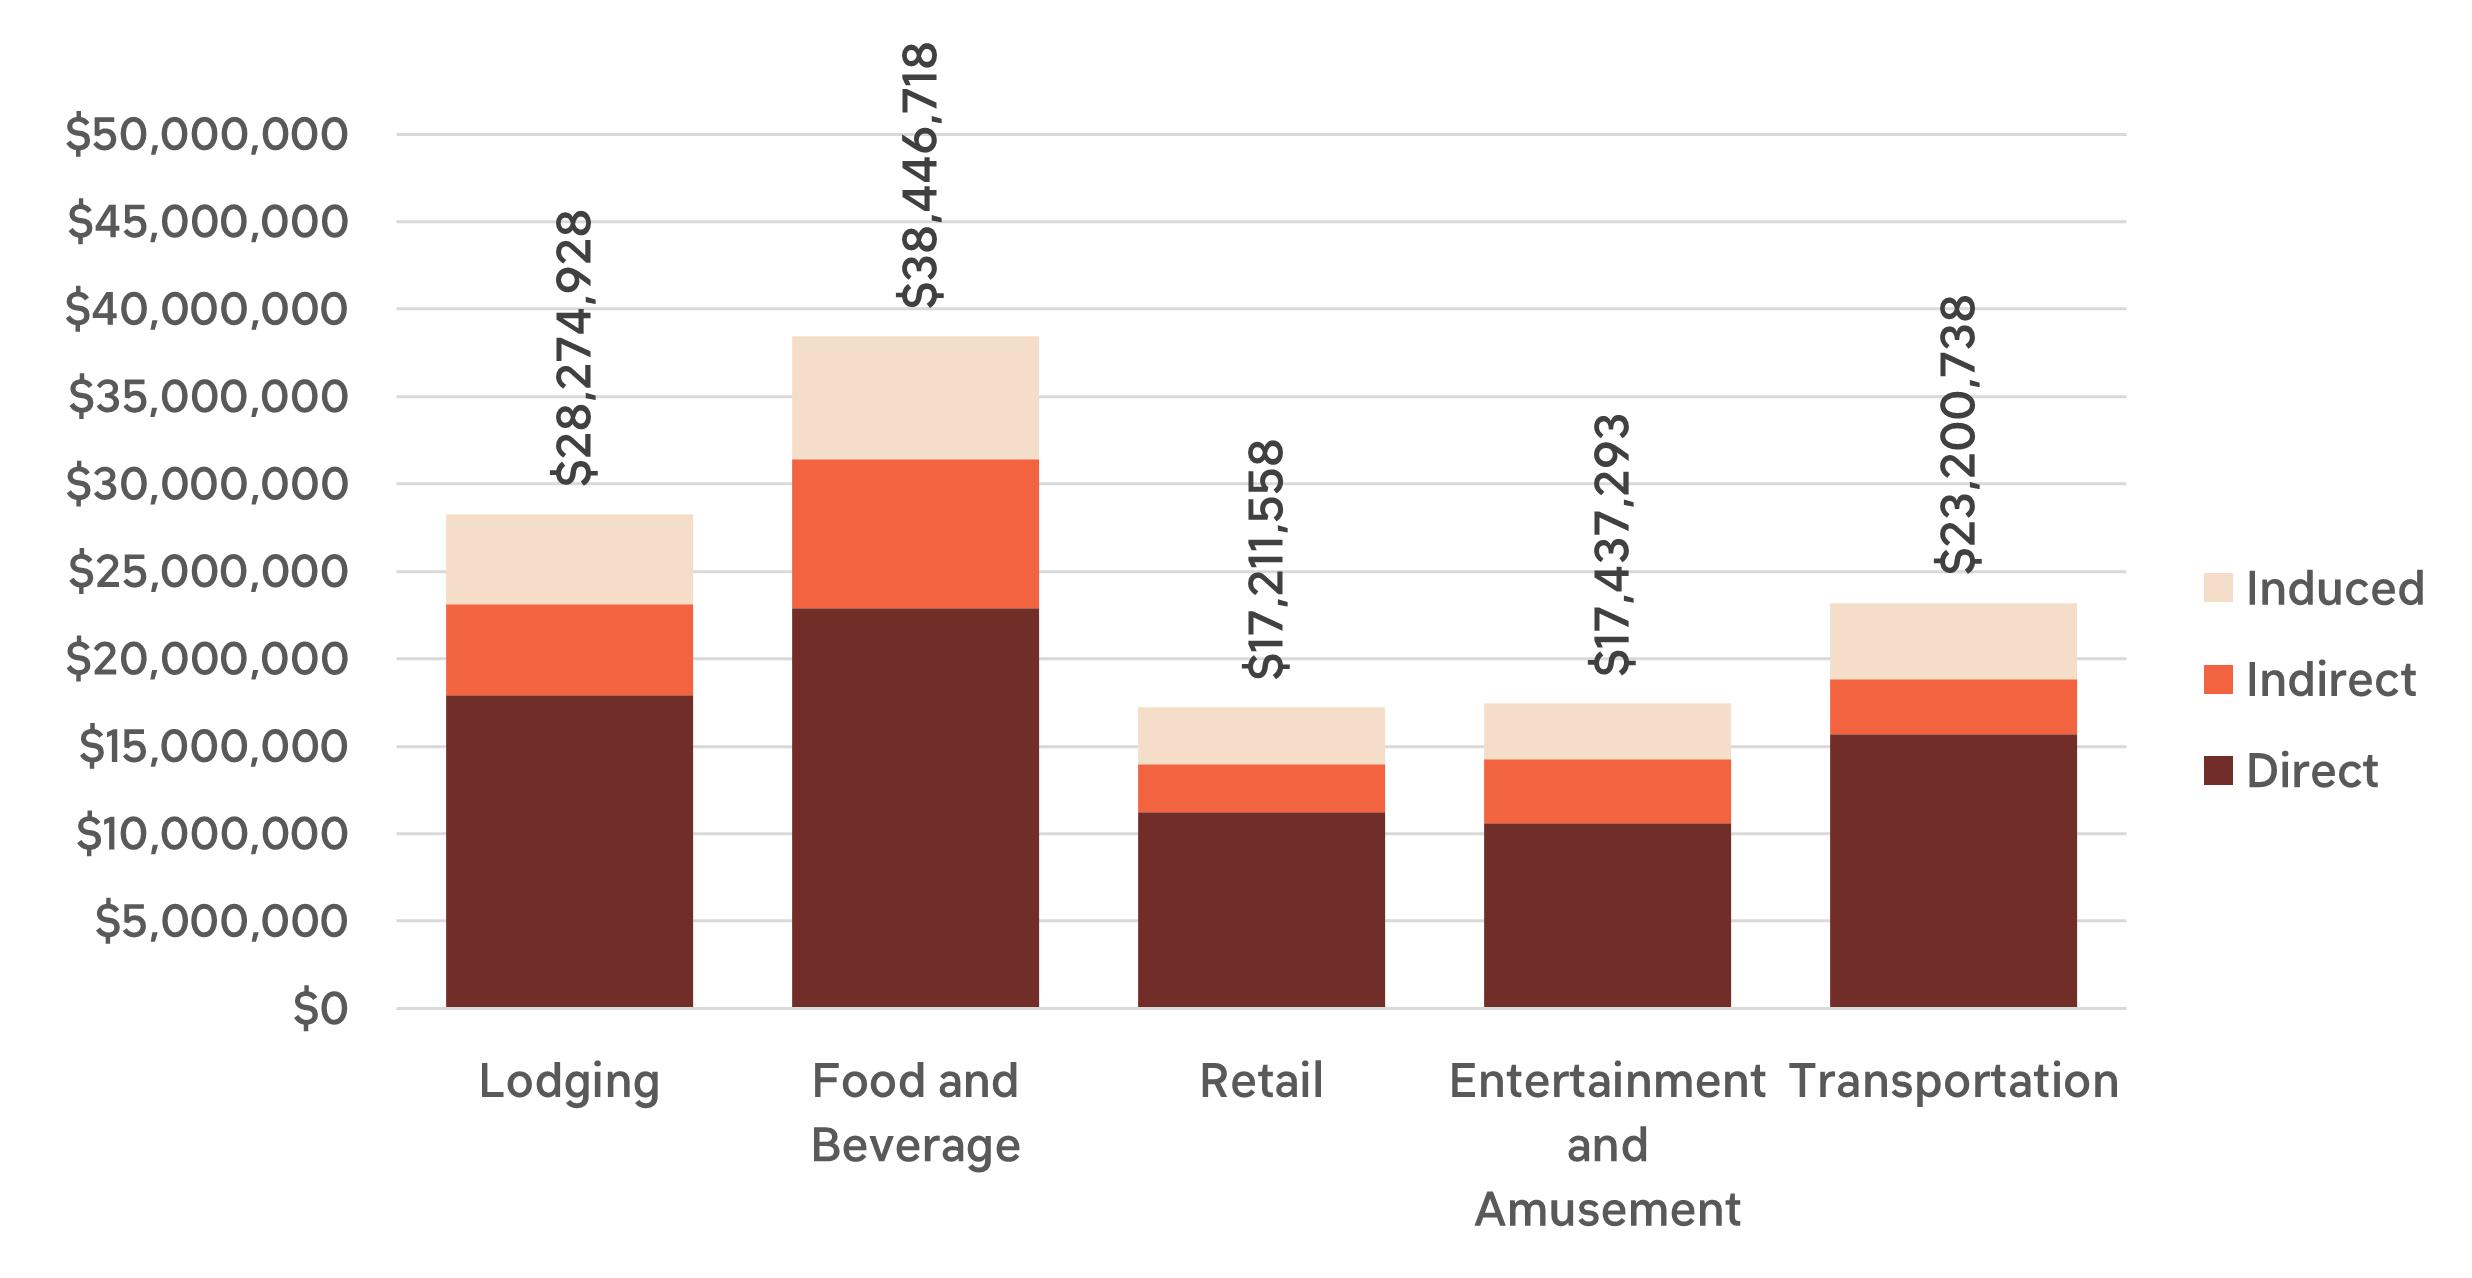
The expenditures of heritage visitors led to paychecks of more than $124 million for Allen County residents. Often the tourism industry is criticized as being a low wage occupation. But the overall average for direct, indirect, and induced jobs in tourism in Fort Wayne last year was more than $40,000, which is more than Fort Wayne’s per capita median income of approximately $35,000.
LABOR INCOME FROM HERITAGE TOURISM
Both the City of Fort Wayne and Allen County have been strong financial supporters of tourism efforts. And that investment has paid off. Last year, local governments received more than $10 million in tax revenues from heritage tourism. This is in addition to the $25.5 million in state tax receipts generated by Fort Wayne’s heritage tourism.
LOCAL TAXES FROM HERITAGE TOURISM
Conclusion
Fort Wayne’s historic districts are not only vital to preserving the city’s rich architectural and cultural legacy—they are also powerful economic and community assets. For decades, the City’s commitment to historic preservation has fostered job creation, tax revenue, and investment, while also supporting diverse, affordable housing options in walkable, high-density neighborhoods. This commitment has driven visitation through heritage tourism and increased the quality of life for Fort Wayne residents. As this report shows, Fort Wayne’s historic districts consistently overperform in measures of economic vitality and livability, affirming their essential role in the city’s past, present, and future.
Methodological Note
Where granular, property level data was used (building permits, property values, etc.) all historic districts, regardless of size, were included in the analysis.
Unless noted otherwise, analysis in the Housing chapter of this report relied on 2023 American Community Survey data from the U.S. Census Bureau.
In order to eliminate instances of small sample size errors while using census data, all existing historic district boundaries were reviewed in relation to their census geographies. Districts, including single-site districts, that only made up a small share of the area in their census geography were excluded from any analysis that relied on census data. Therefore, for the purposes of this report, any metric that relied on census data, only the following districts were included:
Local Historic Districts
• Columbia Avenue Historic District
• West Central Historic District
• Williams Woodland Park Historic District
National Register historic districts
• Beechwood Historic District
• Brookview-Irvington Park Historic District
• Driving Park-Seven States Historic District
• Forest Park Boulevard Historic District
• Foster Park Neighborhood Historic District
• Harrison Hill Historic District
• Illsley Place - West Rudisill Historic District
• Indian Village Historic District
• Kensington Boulevard Historic District
• Lafayette Place Historic District
• Lakeside Historic District
• North Anthony Boulevard Historic District
• Oakdale Historic District
• Shawnee Place Historic District
• South Wayne Historic District
• Southwood Park Historic District
• West End Historic District (aka “West Central”) (parts that do not overlap with the West Central Local district boundary)
• Wildwood Park Historic District
Acknowledgments
A special thanks to this report’s funders!
We would like to give special recognition to the funders for making this project possible. Funding for this study was generously provided by the City of Fort Wayne, Efroymson Family Fund of Indianapolis, Allen County Public Library Genealogy Center, and Visit Fort Wayne.


Thanks also to the city staff, commission members, and project team for their coordination and facilitation of this project:
City of Fort Wayne
• Sharon Tucker, Mayor
• Karl Bandemer, Deputy Mayor
• Michelle Chambers, Fort Wayne City Council, At Large
• Russ Jehl, Fort Wayne City Council President, 2nd District
• Geoff Paddock, Fort Wayne City Council, 5th District
• Jonathan Leist, Director, Fort Wayne Community Development
Fort Wayne Historic Preservation Commission
• Tony Borton
• Tyler Bowers, Chairperson
• Sam Eagleson
• Jessica Franke
• Emily Hower
• Moises Uribe
• Beth Walker, Vice Chairperson
Project Team
• Paul Spoelhof, Deputy Director, Planning and Policy
• Sherese Fortriede, Senior Planner, Planning and Policy
• Creager Smith, Planner II, Historic Preservation and Culture
• Nathan Law, Planner II, Planning and Policy
• Nate Lefever, Planner, Historic Preservation and Culture
• Curt Witcher, Manager, The Genealogy Center, and Director of Special Collections, Allen County Public Library (ACPL)
• Kristen Guthrie, VP of Marketing and Communications, Visit Fort Wayne
Additional thanks to:
The following community stakeholders and organizations provided time and expertise to help the consultant team learn important context in which to situate the data and to gather qualitative stories about the impact of historic preservation in Fort Wayne.
• African-African American Museum: Bryant Rozier
• Allen County Assessor: Kayla Tilley, Deputy Assessor, Thaddeus D. Grantz, Senior Data Analyst
• Allen County Courthouse Preservation Trust: Robyn Zimmerman, Director, Madelaine Elston, Board member
• Allen County Public Library (ACPL) Genealogy Center, Curt Witcher, Manager
• ARCH, Inc.: Beth Walker, Board President
• Arts United: Miriam Morgan, VP of Operations, COO, Dan Ross, President & CEO
• Downtown Fort Wayne, Frank Howard, Director of Operations & COO
• Fort Wayne Parks & Recreation: Steve McDaniel, Director, Chuck Reddinger, Head of Programs
• Historic Fort Wayne: Jennifer Balkenbusch, Norm Gabel, Tom Grant
• Indiana Landmarks, Allen County Black Heritage Committee, Connie Haas Zuber
• Indiana Landmarks: Mark Dollase, Vice President of Preservation Services, Todd Zeiger, Director, Northern Regional Office
• Miami Tribe of Oklahoma, Tribal Historic Preservation Office (THPO): Logan York, THPO, Jared Nally, Deputy THPO
• Northside Neighborhood Association: Lori Stombaugh, President, Abbey Stombaugh
• Packard Area Planning Alliance (PAPA): Holly Munoz, President
• Southwood Park Neighborhood Association: Steve McCord, President, Erika Stuller
• The History Center, Todd Pelfrey
• UPSTAR Realtor’s Association: Kate Dippold, Government Affairs Director, and Ashley Lanning, Membership & Education Director
• Visit Fort Wayne: Kristen Guthrie, Jessa Campbell
• West Central Neighborhood Association: Joel Sauer, President, Bethany Pruitt
• Williams Woodland Park Neighborhood Association: Hunter Schubert, President, Dick Stumpf, Charlie Fritz
Additional thanks to (continued):
Thanks also to the City and County staff who met with the consultant team to share data processes, assist with data acquisition, and lend their expertise to inform the best analysis possible.
City of Fort Wayne Community Development Staff
• Logan Blain, Construction Specialist, Office of Housing and Neighborhood Services
• Chris Blauvelt, Deputy Director, Neighborhood Code Compliance
• Russell Garriott, Senior Planner, Planning and Policy
• Micky Hall, Planner I, Planning and Policy
• Kelly Lundberg, Deputy Director - Housing & Neighborhood Services
• Services
• Paul Spoelhof, Deputy Director, Planning and Policy
• Mary Tyndall, Public Information Officer
• Dan Baisden, Deputy Director, Neighborhood Planning
• Rena Bradley, Neighborhood Planning
• Michael Terronez, Neighborhood Planning
Allen County Department of Planning Services
• Ben Roussel, Executive Director
• Nathan Schall, Principal Planner
• Laura Oberholtzer, Principal Planner
• David Schaab, Senior Planner
• Melissa Woodworth, Permit Systems Coordinator


