THROUGH THIRD QUARTER FY 2024-25

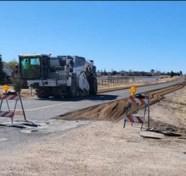


Reed Road Improvements
Luck of the Irish Bingo at the Senior Center
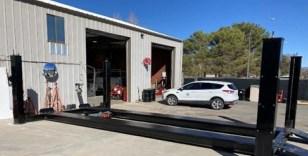
New Fleet Truck Hoist Police
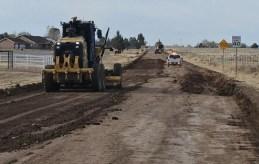
Outer Loop Road Improvements

THROUGH THIRD QUARTER FY 2024-25
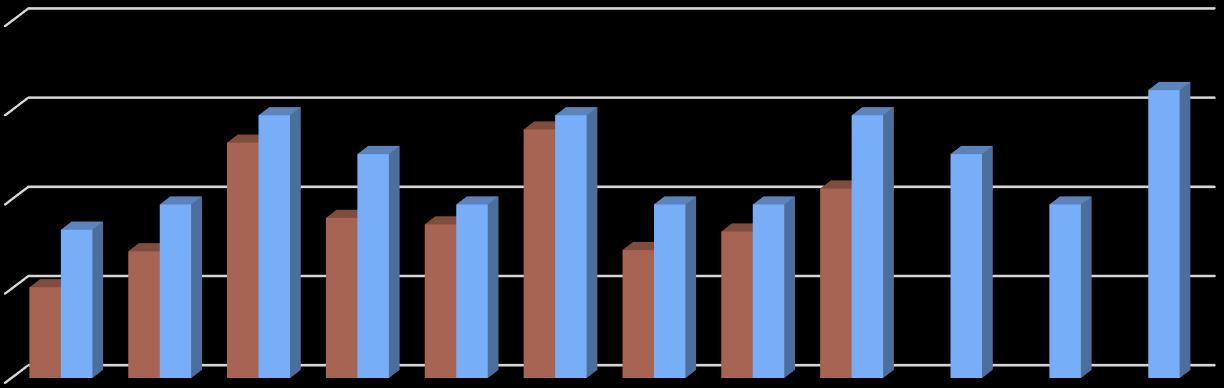
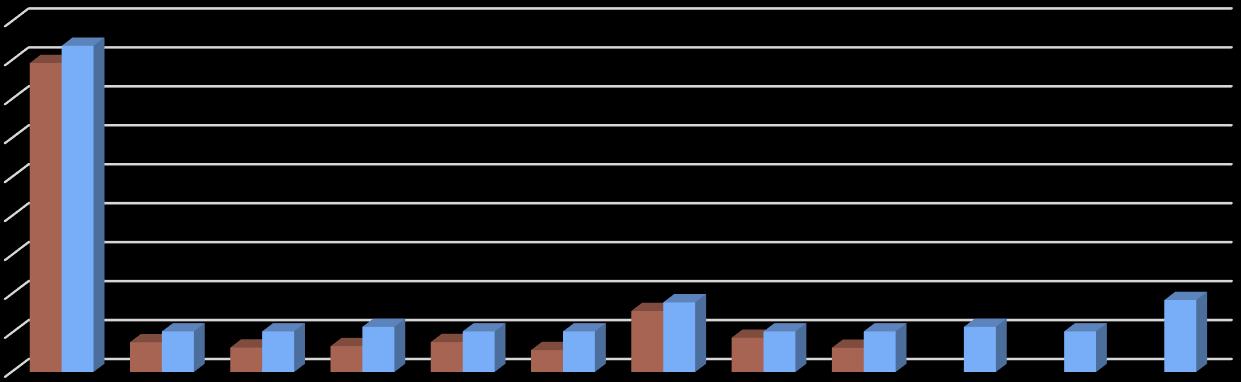
QUARTERLY REVENUE RECEIPTS VS. BUDGET AND PRIOR YEAR
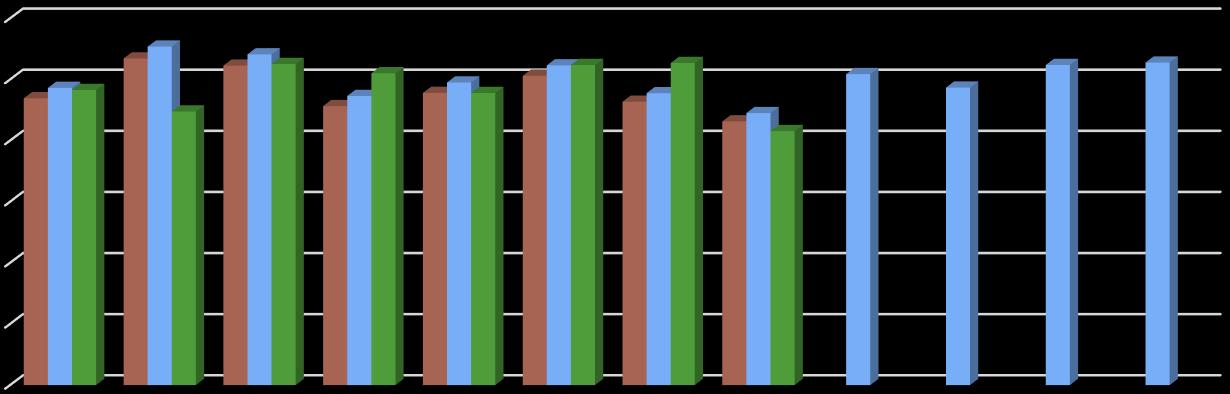
Overall Performance: Actual TPT revenues through February reporting in FY 2024-25 are under budget, with a shortfall of $170,034 or -2.17% The actual YTD is $96,347 more than the FY 2023-24 actuals mainly due to higher than prior year online sales, retail, and utilities offset by lower than prior year construction revenues, food for home consumption revenues, and restaurant and bar revenues.
This variance is being closely monitored due to the importance of tax in the Town's overall revenues. The YTD variance to budget has been reduced by $41,239 since the second quarter YTD report which is a positive indication of slight improvement
500,000 1,000,000 1,500,000 2,000,000 2,500,000 3,000,000
Year-To-Date 2024-25 Variances
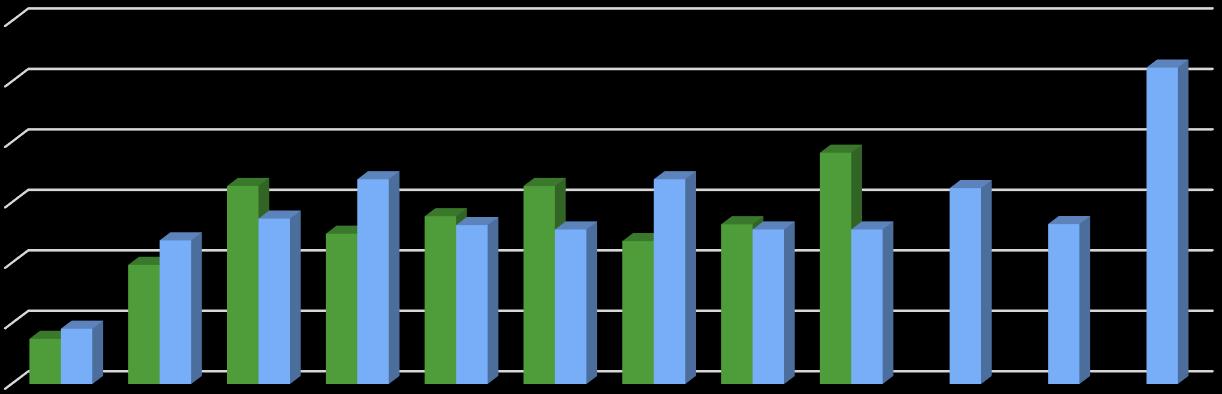
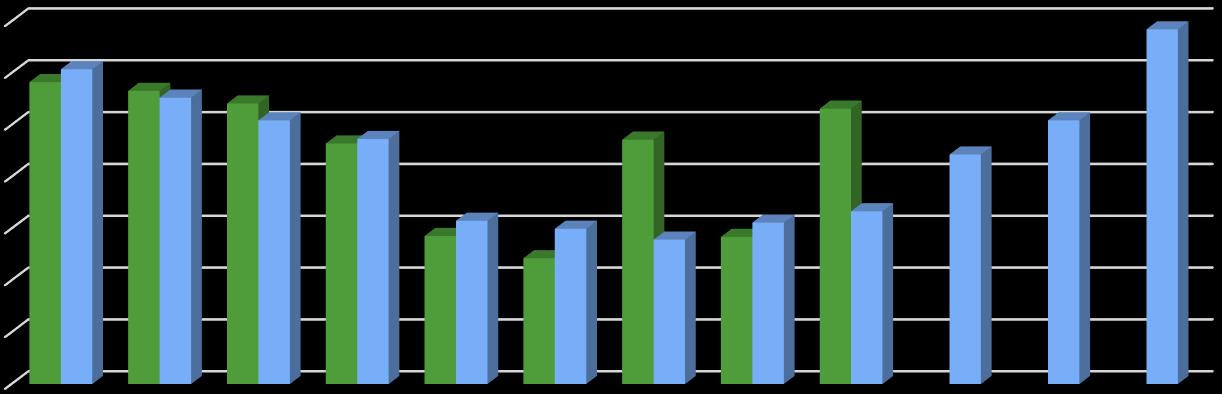
TransactionPrivilege Tax: Revenue is trendingslightlybelowbudgetedprojections,this is primarily due to timing of therevenues received from the State (see detailed TPT section for more information based upon actual reporting periods). Licenses & Permits: Below budget, due to reduced permit activity compared to previous years.
Intergovernmental Revenues: Above budget, primarily attributed to the Vehicle License Tax and State Shared TPT. Interest: Abovebudget, due to greaterreturn on investmentoffset by fewer fundsinvested in theLocalGovernmentInvestment Pool (LGIP).
OverallPerformance: Actualrevenuesthroughthethirdquarter of FY 2024-25areslightlyabovebudget,withasurplus of $133,352 or 1.16%.Theactual YTD is $60,098 lessthanthe FY 2023-24actualsmainly due to thedecrease in theTown'sshare of State Income Tax,
and
by
of TPT
1,600,000 1,800,000 2,000,000

Police
Year-To-Date 2024-25 Variances
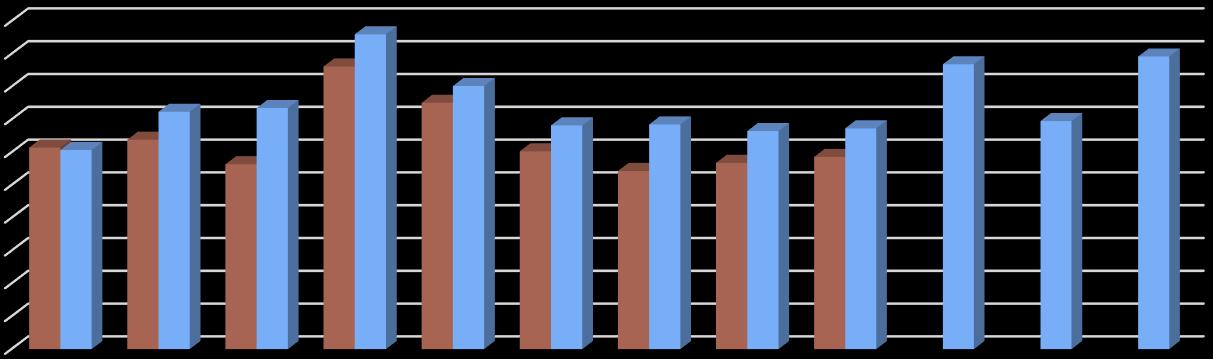
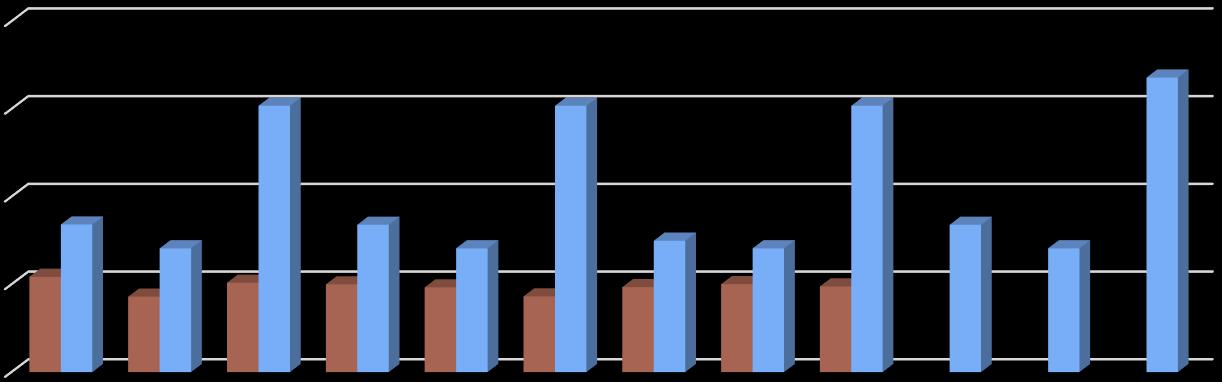
DepartmentBudgets: Expendituresforthemajority of generalfunddepartmentsaretrendingbelowbudget.This is primarily due to long-term,one-timeprojectsthatare in thebeginningstages;zoningcodeupdate,landscapedesign/planning,andtiming of varioustechnologyupgrades.TheTownManager'sdepartment is higherthanbudget due to theseparationagreementwiththe prior Town Manager, a contingency transfer may be needed before the end of the fiscal year.
OverallPerformance: Actualexpendituresthroughthethirdquarter of FY 2024-25areunderbudget,withapositivevariance of $1,607,009 or 12.30%.Theactual YTD is $2,421,069 lessthanthe FY 2023-24actualsmainly due to Non-Departmental(reduced PSPRSunfundedliabilitypayment of $750,000,elimination of theone-timetransfers to theStreetsCapitalImprovementFundand theGeneralCapitalImprovementFund of $1,750,000,reducedtransfer to theCapitalAssetReplacementFund of $75,000,anda contingency fund decrease of $70,745), offset by increases in personnel and operating costs throughout the other departments.
1,000,000 1,200,000 1,400,000 1,600,000 1,800,000 2,000,000
(455,050)
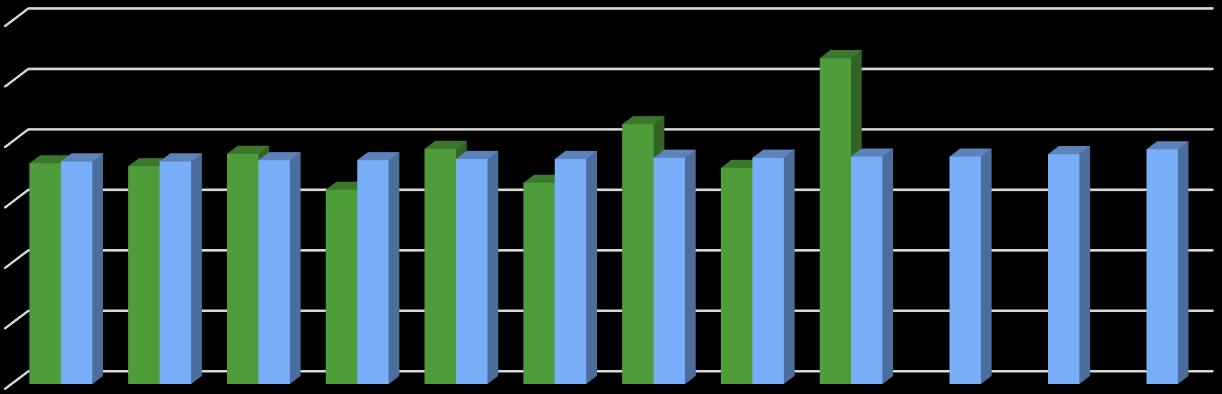
Personnel: Belowbudget, due to staffingvacancies in DevelopmentServices,Police,CommunityServices,andPublicWorks, as well as less pro-tem Municipal Court coverage.
Operating: Below budget, due to the timing of repairs and maintenance, legal services, and other professional services.
One-TimeOperating: Belowbudget, due to long-termone-timeprojects;zoningcodeupdate,landscapedesign/planning,and various technology upgrades.
Contingency: Below budget, no contingency funds have been used to date.
OverallPerformance: Actualexpendituresthroughthethirdquarter of FY 2024-25areunderbudget,withapositivevariance of $1,607,009 or 12.30%.Theactual YTD is $2,421,069 lessthanthe FY 2023-24actualsmainly due lessone-timeoperatingcosts, transfers,andcontingencyfundusage,offset by increases in personnel(newpositionsandCOLA/Meritadjustments)andoperating costs.
Year-To-Date 2024-25 Variances
Highway Users Revenue: Below budget, due to lower than anticipated distributions from the State. Permits: Below budget, due to slightly lower permit activity than estimates.
Miscellaneous: Above budget, attributed to receipt of restitution payments and surplus property disposal. Interest: Above budget, due to slightly more funds invested in the Local Government Investment Pool (LGIP) than anticipated.
OverallPerformance: Actualrevenuesthroughthethirdquarter of FY 2024-25areclose to budget,withashortfall of $40,087 or4.24%.Thisreflects an improvement of approximately 1% compared to thesecondquarterreport.Theactual YTD is $6,423 less than the FY 2023-24 actuals mainly due to reduced interest revenue and less miscellaneous revenue from surplus property disposal.
2024-25 Actual Expenditures 2024-25 Budget
Year-To-Date 2024-25 Variances
Personnel: Below budget, due to staffing vacancies in Public Works - Streets.
Operating: Below budget, due to the timing of contract and support services.
HWY 89 Maintenance: Above budget, due to weed control and monthly landscaping maintenance costs.
Road Materials: Below budget, due to the timing of when various equipment (such as guardrails) is needed.
Contingency: Below budget, no contingency funds have been used to date.
OverallPerformance: Actualexpendituresthroughthethirdquarter of FY 2024-25areunderbudget,withapositivevariance of $210,600 or 20.25%.Theactual YTD is $8,421 morethanthe FY 2023-24actualsmainly due to lessroadmaterialsandoperating costs due to timing, offset by increases in personnel (new positions and COLA/Merit adjustments) and HWY 89 maintenance.
Year-To-Date 2024-25 Variances
Water Service Fees: Above budget, due to slightly higher than anticipated water service fees.
Fill Station Receipts: Above budget, due to slightly higher than expected fill station use.
Water System Buy-In Fees: Below budget, attributed to slightly fewer than anticipated new home construction permits. Miscellaneous: Above budget, attributed to greater than anticipated water meter fees and late fees.
OverallPerformance: Actualrevenuesthroughthethirdquarter of FY 2024-25areclose to budget,withasurplus of $57,902 or 7.87%.Theactual YTD is $258,110 morethanthe FY 2023-24actualsmainly due to waterservice fees in theamount of $117,639 (warmertemperaturesandtheratestructureincreasesapproved in December 2023 contributed to thisincrease),watersystem buy-in fees in theamount of $128,693(minimalbuy-in fees werereceivedduringthefirsthalf of theprioryear),andwatermeter fees and service administrative fees offset by grant revenue received in the prior year.
Year-To-Date 2024-25 Variances
Personnel: Below budget, due to the allocation split between sewer and water.
Operating: Belowbudget, due to thetiming of administrativeindirecttransfers to thegeneralfundandsystemmaintenanceand repairs.
One-Time Operating: Below budget, due to the project timing of the SCADA radios and water meters.
Transfers: Below budget, due to the match for the congressionally directed spending not being needed. Contingency: Below budget, no contingency funds have been used to date.
OverallPerformance: Actualexpendituresforthethirdquarter of FY 2024-25areunderbudget,withapositivevariance of $473,000 or 51.98%.Theactual YTD is $161,857 lessthanthe FY 2023-24actualsmainly due to loweroperatingexpenditures (administrativeindirecttransfers),lowerpersonnelcosts due to allocationsplitbetweensewerandwater,andlowertransfers, offset by minimally higher debt service.
QUARTERLY REVENUE COLLECTIONS VS. BUDGET
50,000
Total (Excludes Grants)
Year-To-Date 2024-25 Variances
SewerServiceFees: Belowbudget, due to slightlylowerthananticipatedsewerservicefees.Thishasremainedlessthana 2% difference and although minimal, staff is closely watching the revenues. Sewer System Buy-In Fees: Above budget, due to more than anticipated new home construction permits. Miscellaneous: Below budget, attributed primarily to lower than anticipated late fee charges. Interest: Above budget, attributed to greater interest than anticipated in the WIFA reserve fund.
OverallPerformance: Actualrevenuesthroughthethirdquarter of FY 2024-25areclose to budget,withasurplus of $64,642 or 3.86%,primarily due to higherthanexpectedbuy-in fees.Theactual YTD is $287,877 morethanthe FY 2023-24actualsmainly due to sewerservice fees in theamount of $50,963(morecustomersandtheratestructureincreasesapproved in December 2023 contributed to thisincrease),sewersystembuy-in fees in theamount of $252,265(significantlylessbuy-in fees werereceived during the prior year), offset by lower service administrative fees collected and less interest in the current year.
QUARTERLY EXPENDITURES VS. BUDGET
2024-25 Actual Expenditures 2024-25 Budget
Year-To-Date 2024-25 Variances
Personnel: Above budget, due to the allocation split between sewer and water. Operating: Belowbudget, due to thetiming of administrativeindirecttransfers to thegeneralfundandequipmentrepairsand maintenance.
One-Time Operating: Below budget, due to the project timing of the surveillance camera project. Contingency: Below budget, no contingency funds have been used to date.
OverallPerformance: Actualexpendituresthroughthesecondquarter of FY 2024-25areunderbudget,withapositivevariance of $319,405 or 18.17%.Theactual YTD is $215,425 lessthanthe FY 2023-24actualsmainly due to loweroperatingexpenditures (administrativeindirecttransfers)offset by increases in personnel(allocationsplitbetweensewerandwater;COLA/Merit adjustments).
BUDGET
1 Only will move forward once funding source is identified (grant or loan).
2 Excludes rollovers that were included in FY 2024-25 budget but were completed in FY 2023-24. 1
15,000 20,000 46,967 60,440 (2,779) 20,954 39,697 20,954
1 Only will move forward once funding source is identified (grant or loan).
2 Will not move forward at this time. Congressionally Directed Spending request that was not approved.
3 Only will move forward once funding source is identified (program income or contribution).
4 Excludes rollovers that were included in FY 2024-25 budget but were completed in FY 2023-24.
1
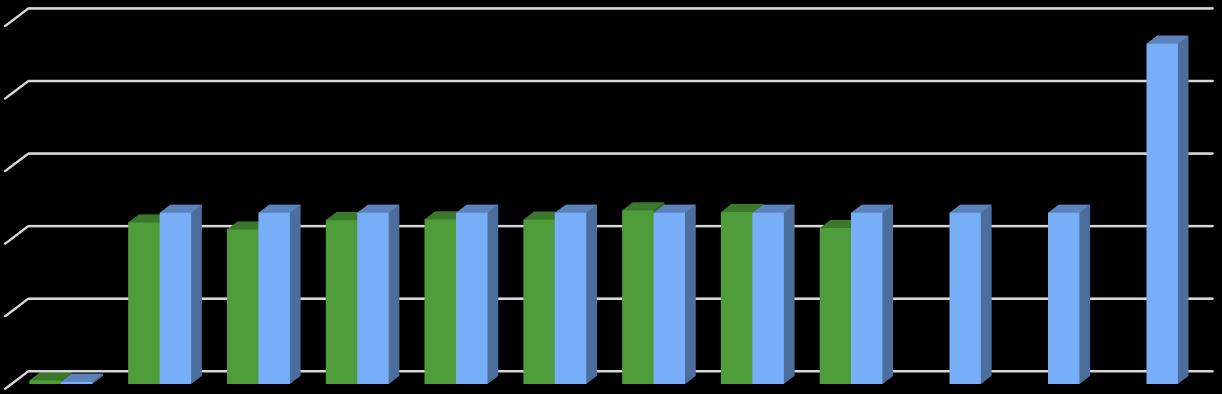
Beginning Cash Balance Quarter 1 Quarter 2 Quarter 3 Quarter 4
(2,000,000) (1,000,000)1,000,000 2,000,000 3,000,000 4,000,000 5,000,000 6,000,000 7,000,000 8,000,000 9,000,000
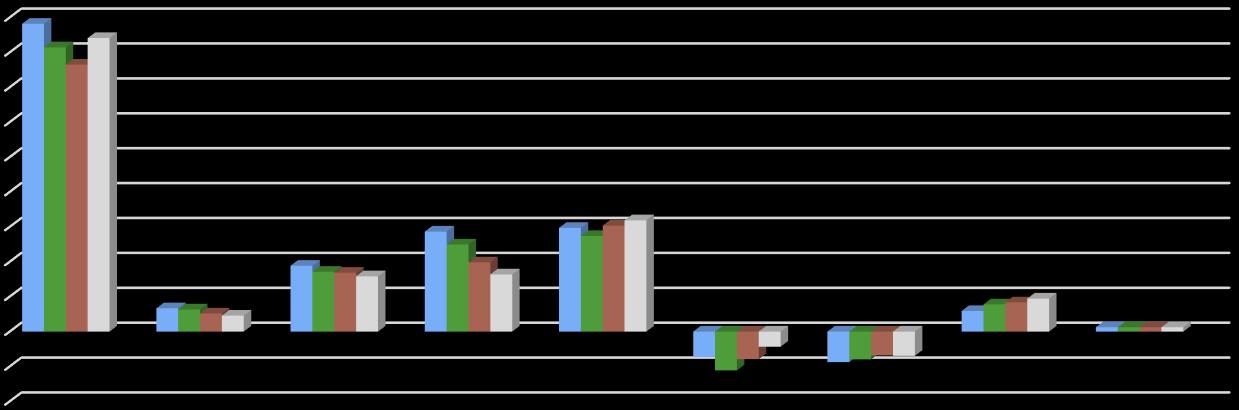
General Fund
Special Revenue Funds
Capital Asset Replacement Fund Cemetery Fund
Court Fund
Grant Fund
Highway User Revenue Fund
Police Impoundment Fee Fund
CVSLID
Del Sol MID
Debt Service Funds
Revenue Bonds Fund
Capital Project Funds
General CIP Fund
SLFRF Fund
Streets CIP Fund
ENTERPRISE FUNDS
Wastewater Fund
Wastewater CIP Fund
Water Fund
Water CIP Fund