LUXURY MARKET REPOR T


The Institute for Luxury Home Marketing has analyzed a number of metrics — including sales prices, sales volumes, number of sales, sales-price-to-list-price ratios, days on market and price-persquare-foot – to provide you a comprehensive North American Luxury Market report.
Additionally, we have further examined all of the individual luxury markets to provide both an overview and an in-depth analysis - including, where data is sufficient, a breakdown by luxury single-family homes and luxury attached homes.
It is our intention to include additional luxury markets on a continual basis. If your market is not featured, please contact us so we can implement the necessary qualification process. More in-depth reports on the luxury communities in your market are available as well.
Looking through this report, you will notice three distinct market statuses, Buyer’s Market, Seller’s Market, and Balanced Market. A Buyer’s Market indicates that buyers have greater control over the price point. This market type is demonstrated by a substantial number of homes on the market and few sales, suggesting demand for residential properties is slow for that market and/or price point. By contrast, a Seller’s Market gives sellers greater control over the price point. Typically, this means there are few homes on the market and a generous demand, causing competition between buyers who ultimately drive sales prices higher.
A Balanced Market indicates that neither the buyers nor the sellers control the price point at which that property will sell and that there is neither a glut nor a lack of inventory. Typically, this type of market sees a stabilization of both the list and sold price, the length of time the property is on the market as well as the expectancy amongst homeowners in their respective communities – so long as their home is priced in accordance with the current market value.
REMAINING INVENTORY: The total number of homes available at the close of a month.
DAYS ON MARKET: Measures the number of days a home is available on the market before a purchase offer is accepted.
LUXURY BENCHMARK PRICE: The price point that marks the transition from traditional homes to luxury homes.
NEW LISTINGS: The number of homes that entered the market during the current month.
PRICE PER SQUARE FOOT: Measures the dollar amount of the home’s price for an individual square foot.
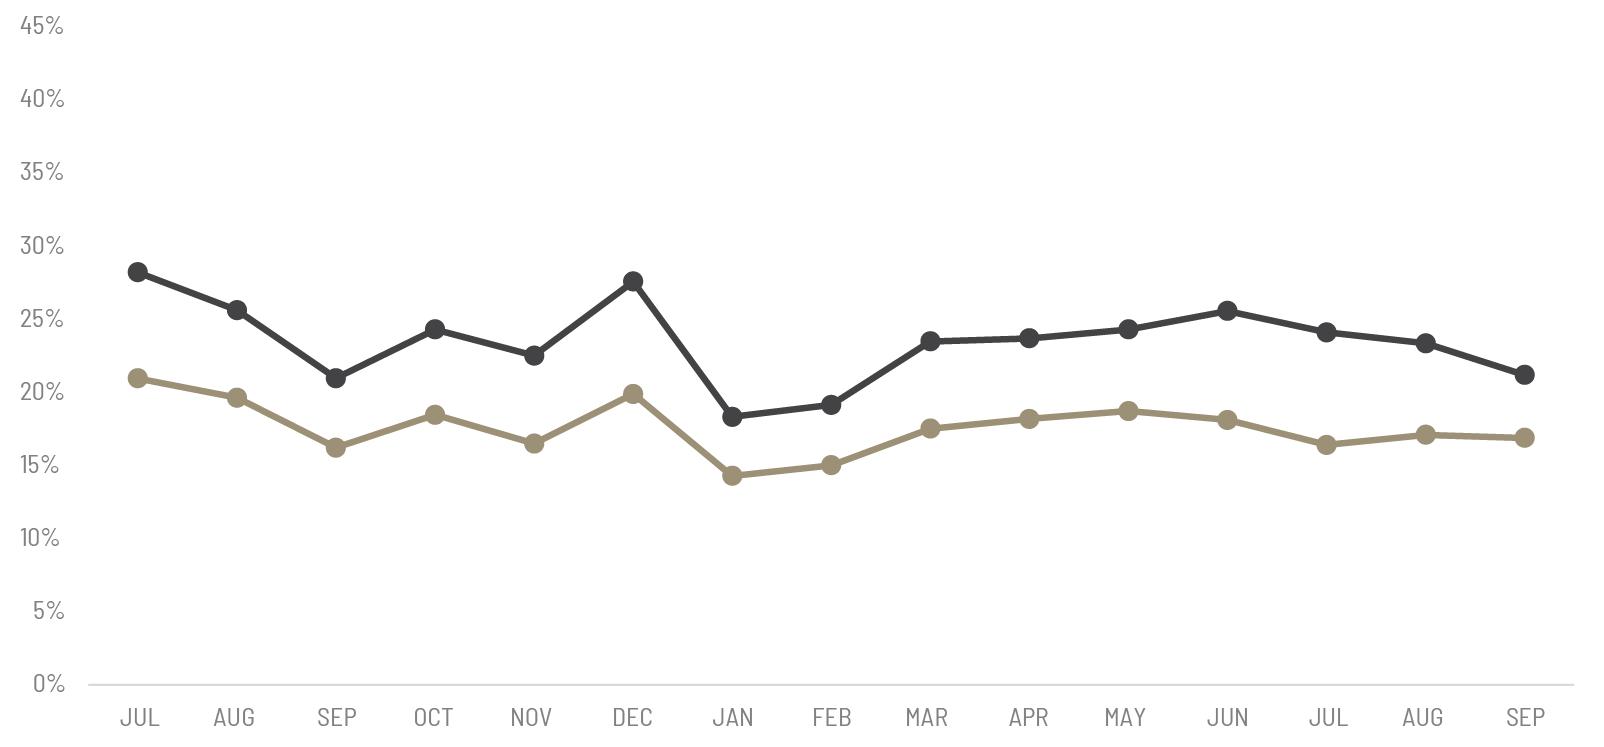
SALES RATIO: Sales Ratio defines market speed and determines whether the market currently favors buyers or sellers. A Buyer’s Market has a Sales Ratio of less than 12%; a Balanced Market has a ratio of 12% up to 21%; a Seller’s Market has a ratio of 21% or higher. A Sales Ratio greater than 100% indicates the number of sold listings exceeds the number of listings available at the end of the month.
SP/LP RATIO: The Sales Price/List Price Ratio compares the value of the sold price to the value of the list price.

"ACROSS THREE CONSECUTIVE MONTHS, THE MARKET EVOLVED FROM STABLE YET CAUTIOUS GROWTH IN JULY, THROUGH SELECTIVE RESILIENCE IN AUGUST, TO MATURE BALANCE AND RENEWED CONFIDENCE IN SEPTEMBER."
9.2% compared to the previous year. Yet prices remained stable, suggesting that while fewer deals were closing, buyer appetite for the right property persisted. New listings slowed almost to a standstill, rising by only 0.3%, signaling that many sellers preferred to hold rather than compete in a cautious environment.
July confirmed that luxury real estate has entered an era where inventory expansion no longer automatically suppresses price. Properties that meet affluent buyers’ standards, i.e. turnkey, welldesigned, and strategically located, continue to command nearasking prices. The average sold-to-list ratio hovered around 98%, underscoring ongoing demand for quality assets.
This equilibrium between supply and selectivity marked a pivotal moment: the luxury market was no longer driven by scarcity or speculation but by discernment.
If July was about stability, August was about restraint - particularly among sellers. While a summer slowdown is typical, this year’s pattern was underscored by deliberate market control on both sides of the transaction.
Sales of single-family luxury homes climbed 6.7% year over year, outpacing July’s modest gains. However, inventory growth decelerated sharply to 17.3%, down from 29.8% in 2024. New listings rose by only 2.5%, a clear signal that sellers were exercising patience, opting to wait for optimal timing rather than rush into the market.
This restraint coincided with a subtle but significant economic shift: declining mortgage rates. Expectations of the Federal Reserve’s first rate cut in over a year and similar moves by the Bank of Canada began to influence sentiment. While most high-net-worth buyers transact in cash, improved liquidity and lower borrowing costs will nevertheless bolster confidence.
The attached segment showed early signs of balance. Sales slipped only 0.4% year over year, a marked improvement from July’s steeper decline. Inventory rose at a manageable 17.3%, while new listings increased by just 0.9%.
Buyers in this space continued to prioritize convenience, amenities, and urban access. The easing of mortgage rates hinted at a potential rebound in this segment heading into fall, as affordability and access improved modestly.
August encapsulated the luxury market’s paradox: buyers were confident yet calculated, while sellers were cautious yet strategic. Both sides were watching interest rates and economic indicators closely, adjusting expectations in real time.
Buyer behavior was shaped by lifestyle intent rather than opportunism. They favored homes that offered immediacy such as move-in readiness, architectural distinction, or experiential value. Generationally, Millennials and Gen Z continued to redefine luxury through priorities like sustainability, tech integration, and community access, while Baby Boomers and Gen X remained focused on comfort, security, and ease of living.
On the supply side, patience emerged as the dominant strategy. Sellers preferred timing over concession, expecting that declining rates would eventually expand the buyer pool and lift demand further into the fall.
By September, the trends observed in July and August had crystallized into a clear narrative: the luxury real estate market was not slowing - it was normalizing. The Institute for Luxury Home Marketing described it as entering “a new phase of balance and maturity.”
Inventory in the single-family sector rose 14% compared to the previous year, while new listings climbed 10.2%. Sales surged 15.2%, reflecting a healthy and engaged buyer base. Median sold prices increased 2.9%, while list prices rose just 0.8%, demonstrating that sellers had adjusted to more realistic valuations.
Although monthly sales volumes have declined slightly since June, typical for the late summer cycle, the third quarter totals increased by 7.5% compared to Q3 2024, underscoring the underlying health of the sector.
Buyers in September were guided by fundamentals. They sought intrinsic value over speculative gain, looking for longevity in both lifestyle and investment terms. As a result, negotiation centered on quality and alignment rather than discounting.
The attached market continued its recovery path, with September sales up 14.6% year over year and median sold prices rising 3.46%. Although this segment remains more sensitive to supply and pricing shifts, the consistent improvement since midsummer indicates stabilization.
Inventory peaked earlier in the year and has since declined by 7.3% - a reversal from the same period in 2024 when it continued to rise. Sellers have clearly recalibrated, matching offerings more closely to demand.
September’s data underscored one of 2025’s most defining shifts: the return of regional differentiation.
California, Connecticut, Illinois, Maryland, Michigan, Minnesota, North Carolina, New Jersey, Ohio, and Virginia remained solid seller’s markets in September, driven by tight inventory and robust absorption rates. In contrast, much of the Sun Belt and Mountain West - Arizona, Colorado, Florida, Georgia, Idaho, and Texas - transitioned toward balanced or buyer conditions as new supply normalized after years of in-migration.
In Canada, Alberta continued to outperform, buoyed by diversification and relative affordability, while British Columbia and Ontario softened slightly amid international capital moderation and regulatory constraints. The takeaway is unmistakable: luxury real estate has re-localized. While understanding the luxury market still depends on appreciating national trends there also needs to be greater focus applied to analysing local economic, policy, and cultural drivers.
The third quarter of 2025 unfolded against a backdrop of renewed confidence. Rate cuts by the Federal Reserve and the Bank of Canada helped stabilize equity markets, improve liquidity, and set expectations for a gentler monetary environment heading into 2026. Increased sales in 2025, compared to 2024, indicate that luxury real estate remains a preferred asset combining stability, lifestyle, and long-term value.
Challenges persist, particularly labor shortages and high material costs that continue to limit new construction. As a result, turnkey homes in prime locations command premiums, while properties needing upgrades take longer to sell.
Overall, the market showed evolution, not volatility. Buyers are more selective, sellers more strategic, and pricing more disciplined. Regional differences are widening, making local expertise essential.

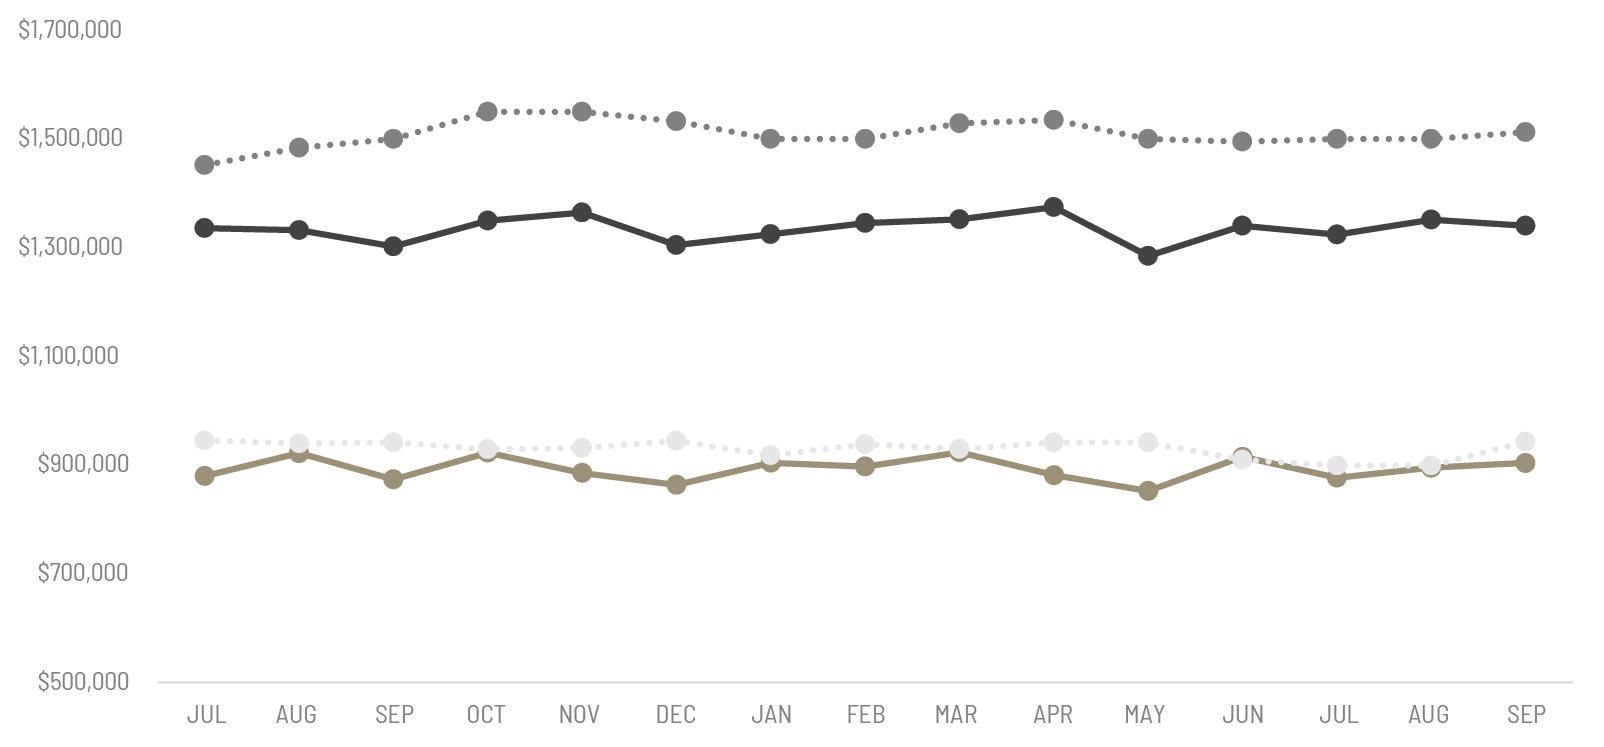
Single-Family Homes Attached Homes Single-Family List Price Attached List Price
All data is based off median values. Median prices represent properties priced above respective city benchmark prices.
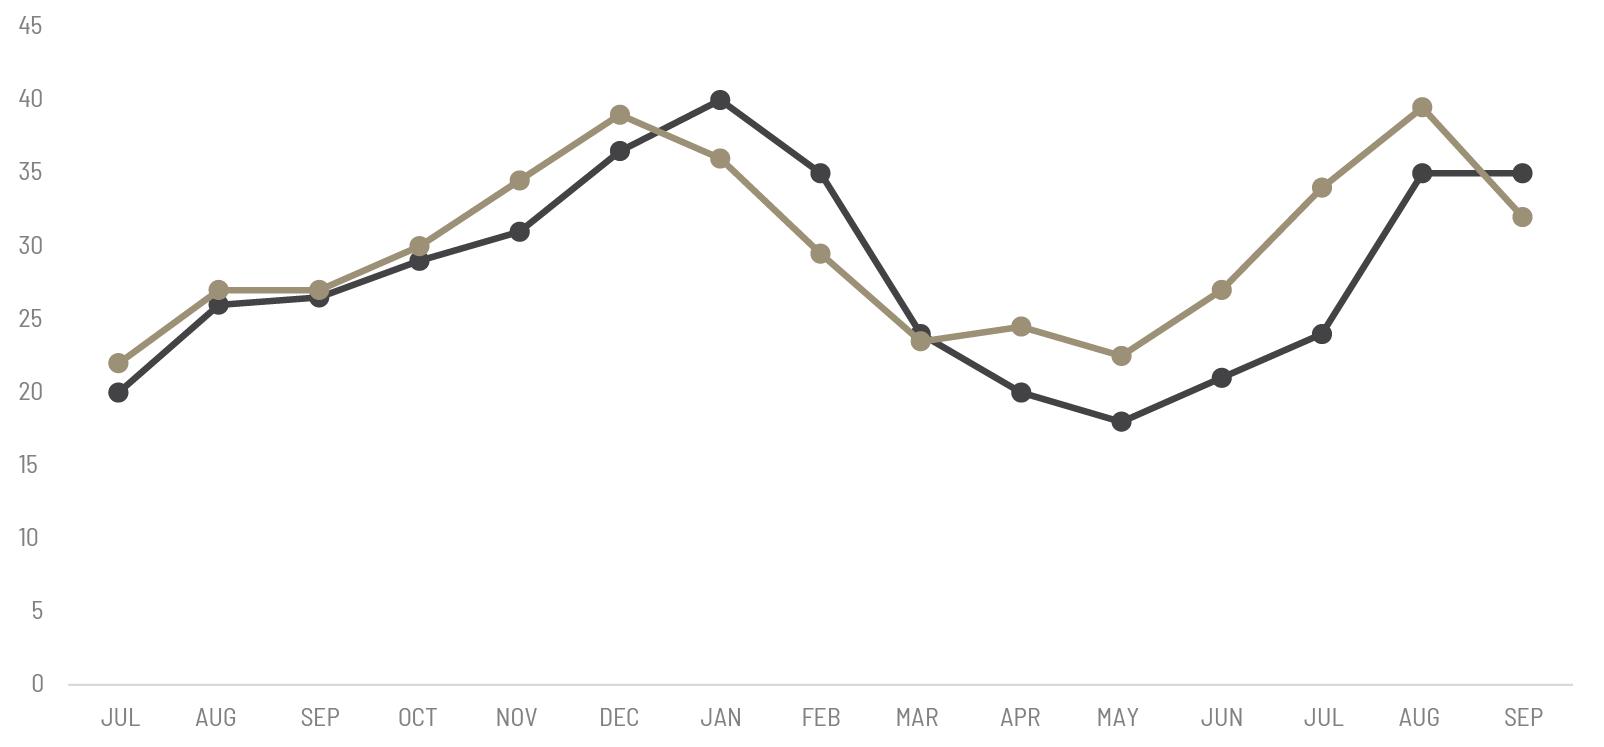
Q3 2024 | Q3 2025
• Official Market Type: Seller's Market with a 22.89% Sales Ratio.1
• Homes are selling for 98.05% of list price
• The median luxury threshold2 price is $900,000, and the composite luxury home sales price is $1,338,690.
• Markets with the Highest Sales Price: Pitkin County ($10,483,333), Telluride ($5,604,167), Eagle County ($4,933,333), and Whistler ($4,416,667).
• Markets with the Highest Sales Ratio: Cleveland Suburbs (89.5%), Central Connecticut (72.3%), Morris County (63.5%), and Chicago (63.3%).