Welcome to the inaugural quarterly Luxury Market Report for 2025, a collaborative endeavor between CENTURY 21 Fine Homes & Estates® and The Institute for Luxury Home Marketing. With the economy continuing to evolve, we are seeing positive signs of momentum within the luxury housing market and are cautiously optimistic for the year ahead. As you consider whether now is the time to jump in, we want to make sure that you have the most accurate and insightful data to help you best understand where the market is today. This comprehensive report offers an in-depth overview and analysis of the current North American luxury markets, featuring key real estate sales and price metrics.
With the knowledge and expertise of The Institute of Luxury Home Marketing behind them, CENTURY 21 Fine Homes & Estates designated independent agents are committed to guiding you along your personal real estate journey and helping you make informed decisions in this dynamic market. We hope this report serves as a valuable resource as you continue along your path to homeownership.
Thank you for your continued trust in the CENTURY 21® brand.
Mike Miedler President & CEO, Century 21 Real Estate, LLC.
LUXURY REPORT EXPLAINED
The Institute for Luxury Home Marketing has analyzed a number of metrics — including sales prices, sales volumes, number of sales, sales-price-to-list-price ratios, days on market and price-persquare-foot – to provide you a comprehensive North American Luxury Market report.
Additionally, we have further examined all of the individual luxury markets to provide both an overview and an in-depth analysis - including, where data is sufficient, a breakdown by luxury single-family homes and luxury attached homes.
It is our intention to include additional luxury markets on a continual basis. If your market is not featured, please contact us so we can implement the necessary qualification process. More in-depth reports on the luxury communities in your market are available as well.
Looking through this report, you will notice three distinct market statuses, Buyer’s Market, Seller’s Market, and Balanced Market. A Buyer’s Market indicates that buyers have greater control over the price point. This market type is demonstrated by a substantial number of homes on the market and few sales, suggesting demand for residential properties is slow for that market and/or price point. By contrast, a Seller’s Market gives sellers greater control over the price point. Typically, this means there are few homes on the market and a generous demand, causing competition between buyers who ultimately drive sales prices higher.
A Balanced Market indicates that neither the buyers nor the sellers control the price point at which that property will sell and that there is neither a glut nor a lack of inventory. Typically, this type of market sees a stabilization of both the list and sold price, the length of time the property is on the market as well as the expectancy amongst homeowners in their respective communities – so long as their home is priced in accordance with the current market value.
REPORT METHODOLOGY
REMAINING INVENTORY: The total number of homes available at the close of a month.
DAYS ON MARKET: Measures the number of days a home is available on the market before a purchase offer is accepted.
LUXURY BENCHMARK PRICE: The price point that marks the transition from traditional homes to luxury homes.
NEW LISTINGS: The number of homes that entered the market during the current month.
PRICE PER SQUARE FOOT: Measures the dollar amount of the home’s price for an individual square foot.
SALES RATIO: Sales Ratio defines market speed and determines whether the market currently favors buyers or sellers. A Buyer’s Market has a Sales Ratio of less than 12%; a Balanced Market has a ratio of 12% up to 21%; a Seller’s Market has a ratio of 21% or higher. A Sales Ratio greater than 100% indicates the number of sold listings exceeds the number of listings available at the end of the month.
SP/LP RATIO: The Sales Price/List Price Ratio compares the value of the sold price to the value of the list price.
COMPOSITE STATISTICS: Are the mean average of monthly medians for the time frame represented. Medians are calculated for each city/area, for each month, these medians are averaged to create composite values. Composite statistics were used for list price, sale price, SP/LP Ratio, sales ratio, price per square foot, days on market, and home size.
"Q1 FIGURES INDICATE GROWING CONFIDENCE IN THE LUXURY REAL ESTATE MARKET. DESPITE ONGOING ECONOMIC VOLATILITY, MORE HOMEOWNERS ARE LISTING THEIR PROPERTIES, WHILE BUYERS, THOUGH SELECTIVE, REMAIN READY TO ACT WHEN THE RIGHT OPPORTUNITY APPEARS."
Q1 2025 LUXURY REVIEW
MOMENTUM BUILDS AMID MEASURED OPTIMISM
The first quarter of 2025 opened with strong momentum, carried over from the late-2024 surge sparked by a series of interest rate cuts. January was a standout month, marked by a surge in buyer activity, increased inventory, and robust sales volume across primary, secondary, and vacation markets. Buyers re-entered the market with renewed confidence, motivated by improved borrowing conditions and fresh opportunities. February, however, introduced a brief but notable deceleration. External macroeconomic pressures, including sharp volatility in equity markets and concerns over new trade tariffs, are thought to have prompted a wave of caution. High-net-worth buyers, particularly those eyeing ultra-luxury or speculative purchases, adopted a more conservative posture, leading to a pause in market activity.
That said, March delivered a decisive rebound. A strong uptick in both sales and inventory, especially within the single-family segment, indicated that the February slowdown may have been more of a recalibration than a shift in overall direction. By quarter’s end, the market tone was one of cautious optimism, with clear signs that luxury buyers and sellers are actively engaging, although still with a keen eye on broader economic signals.
Q1 2025 saw steady and significant growth in luxury inventory across both single-family and condominium/ townhome markets, a key indicator of returning seller confidence. Compared to 2024, inventory in the first quarter of 2025 increased by 26.3% for single-family homes and 27.3% for condominiums and townhomes.
After a promising January and a quieter February, March was the most active month of the quarter. In the single-family home segment, new listings jumped up 33.8% compared to March 2024 and rose 28.0% month-over-month.
The condo and townhome sector showed a parallel trend, albeit with slightly less acceleration with new listings increased 25.7% year-over-year and 14.8% month-over-month.
This rise in inventory has given buyers more choices and signaled a broader market recovery from the lowinventory environment that defined much of 2023 and early 2024. Sellers appear to be responding to both increased buyer interest, especially as pricing remains firm in high-demand markets.
SALES TRENDS: STRONG GROWTH FOR SINGLE-FAMILY HOMES, MODEST GAINS FOR CONDOS
Sales activity throughout Q1 reflected evolving buyer preferences and market responsiveness. Luxury homes purchases are being driven by demand for lifestyle flexibility, and long-term investment security. Compared to 2024, sales in the first quarter of 2025 increased by 9.4% for single-family homes and 2.4% for condominiums and townhomes.
In March 2025, sales of single-family luxury homes were up 7.3% compared to the same month last year and surged 39.9% over February - an impressive month-over-month gain that illustrates how quickly buyer confidence returned. January also saw solid sales growth, helping set the tone for the quarter.
The condo and townhome segment, while showing a year-over-year decline of 4.9% in March, still experienced a substantial rebound from February with a 26.5% increase in sales.
Q1 figures indicate growing confidence in the luxury real estate market. Despite ongoing economic volatility, more homeowners are listing their properties, while buyers, though selective, remain ready to act when the right opportunity appears.
BUYER PROFILE: LONG-TERM VISION AND LIFESTYLE IN FOCUS
Luxury buyers in the first quarter of 2025 demonstrated a strategic and lifestyle-driven mindset. Rather than speculative flips or short-term gains, most transactions were anchored in long-term goals such as relocation, upsizing, or the acquisition of secondary homes.
A growing demographic shift was also apparent. Affluent millennials and Gen X buyers are entering the market in greater numbers, many propelled by intergenerational wealth transfers and the desire for homes that reflect post-pandemic lifestyle priorities. These include a preference for flexible living spaces, proximity to nature or cultural hubs, and homes with potential for personalization.
Cash buyers, who remain less impacted by interest rate fluctuations, held a distinct advantage in negotiations, often able to move faster and close with fewer contingencies. However, even financed
buyers appeared more confident, thanks to the improved interest rate environment and increasing inventory.
SELLERS: TIMING MOVES FROM TACTICAL TO STRATEGIC
Sellers in Q1 2025 approached the market with a more strategic mindset, often balancing personal circumstances with market signals. While many homeowners with ultralow mortgage rates continued to sit tight, those with compelling reasons to sell, such as relocation, lifestyle changes, or the disposition of investment properties, found a receptive buyer pool.
High-quality, well-located properties continued to attract competitive interest, especially in markets where supply still lags demand. Sellers of luxury properties that generate high rental incomes, including short-term rentals in resort markets, appeared more inclined to hold, anticipating further appreciation or stabilization later in the year.
Overall, the quarter marked a shift from hesitancy to calculated engagement among sellers, many of whom are likely watching March’s rebound closely to see if it’s a significant indicator for the remainder of 2025.
ECONOMIC INFLUENCES: EXTERNAL FORCES CONTINUE TO SHAPE BEHAVIOR
The luxury market remained highly attuned to macroeconomic factors in Q1. The interest rate cuts in late 2024 provided a crucial boost, but future monetary policy remains a wildcard that could influence the pace of deals in upcoming quarters.
Equity market volatility had a significant psychological impact on affluent buyers, many of whom tie their purchasing power and liquidity decisions to investment performance. The sharp fluctuations in the stock market during February contributed to a temporary slowdown in buyer activity.
While sales rebounded in March, ongoing concerns around tariffs, recession risks, tech sector valuations, persistent inflation, and budget negotiations continued to fuel market uncertainty and may have dampened overall transaction volume.
March brought renewed focus to several factors likely to influence luxury real estate through 2025. Tariffs on construction materials are weighing on developer sentiment, with rising costs potentially slowing new builds or driving prices higher in supply-constrained markets.
Insurance risks are also reshaping buyer behavior in states like California and Florida, where premiums and stricter policies are impacting demand—especially for high-risk coastal and hillside properties.
Interest rates remain a key variable. Should rates decline, pent-up demand could quickly translate into stronger sales, but uncertainty may keep some buyers on the sidelines in the near term.
LONG-TERM
FUNDAMENTALS:
DEMAND REMAINS RESILIENT
Despite the quarter’s momentary ebbs and flows, the long-term fundamentals of the luxury real estate market remain strong. The underlying supply-demand imbalance continues to favor sellers over time. New construction still lags pre-2008 levels, while demographic trends—including wealth accumulation among younger buyers and population growth in key markets—support sustained demand.
Luxury real estate remains a preferred hedge against economic volatility and inflation, with many highnet-worth individuals viewing property as a core component of their portfolio. As confidence grows and supply improves, the market appears well-positioned to absorb short-term shocks and continue its upward trajectory.
CONCLUSION
Q1 2025 showcased a market in motion - one defined by strategic behavior, a cautious but strengthening tone, and clear signs of renewed engagement from both buyers and sellers. While February presented a brief slowdown, the strength of January and the strong rebound in March helped solidify an upward trend heading into Q2.
With inventory expanding and interest rates still favorable, conditions are ripe for well-positioned buyers. Sellers, especially those with high-quality assets or clear financial motivation, are seeing encouraging results.
Looking ahead, the key factors to watch remain external: interest rate policy, geopolitical developments, tariffs, and insurance trends. But with core demand intact and market fundamentals resilient, luxury real estate continues to offer both lifestyle fulfillment and long-term value in 2025.
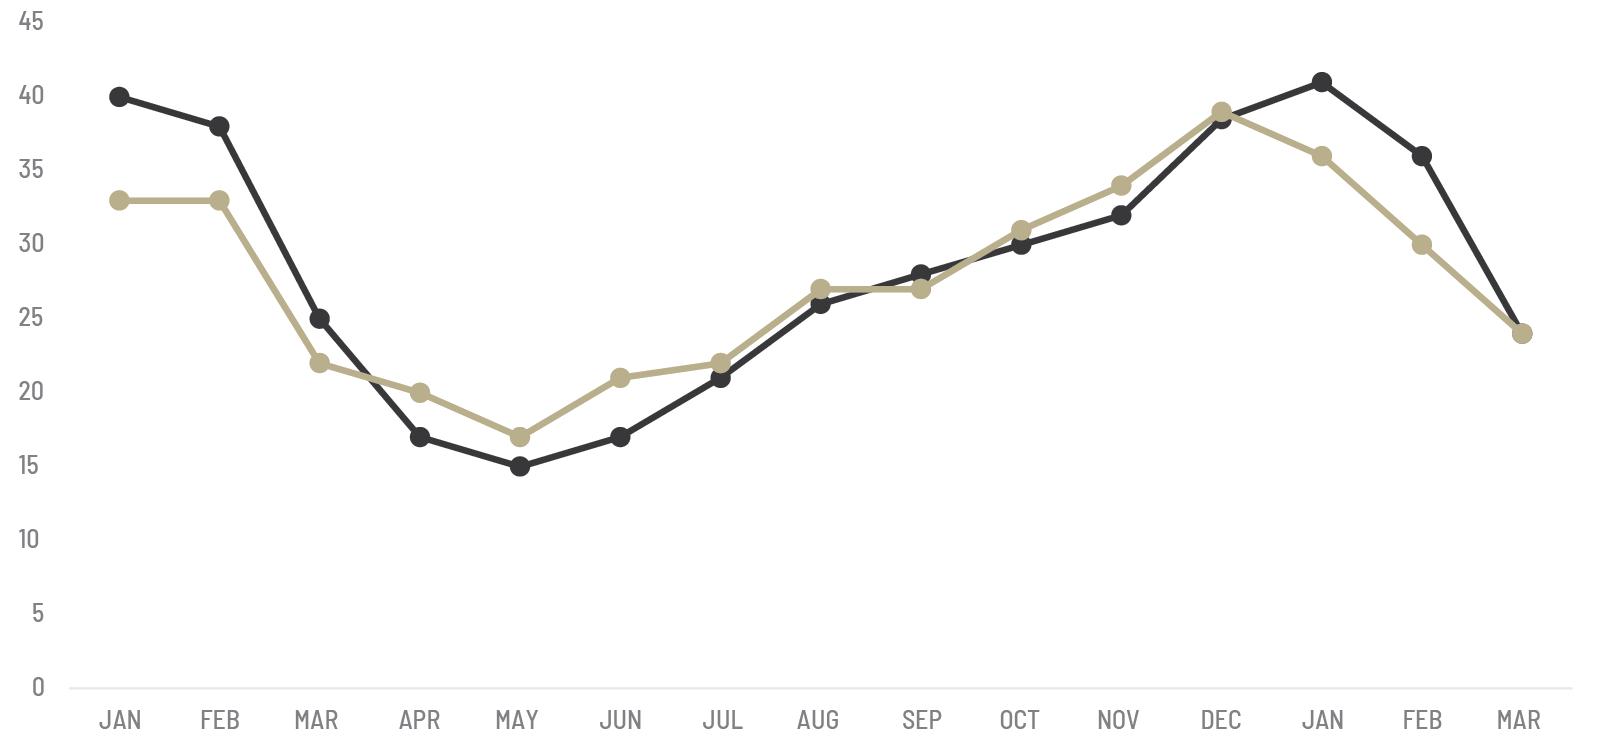
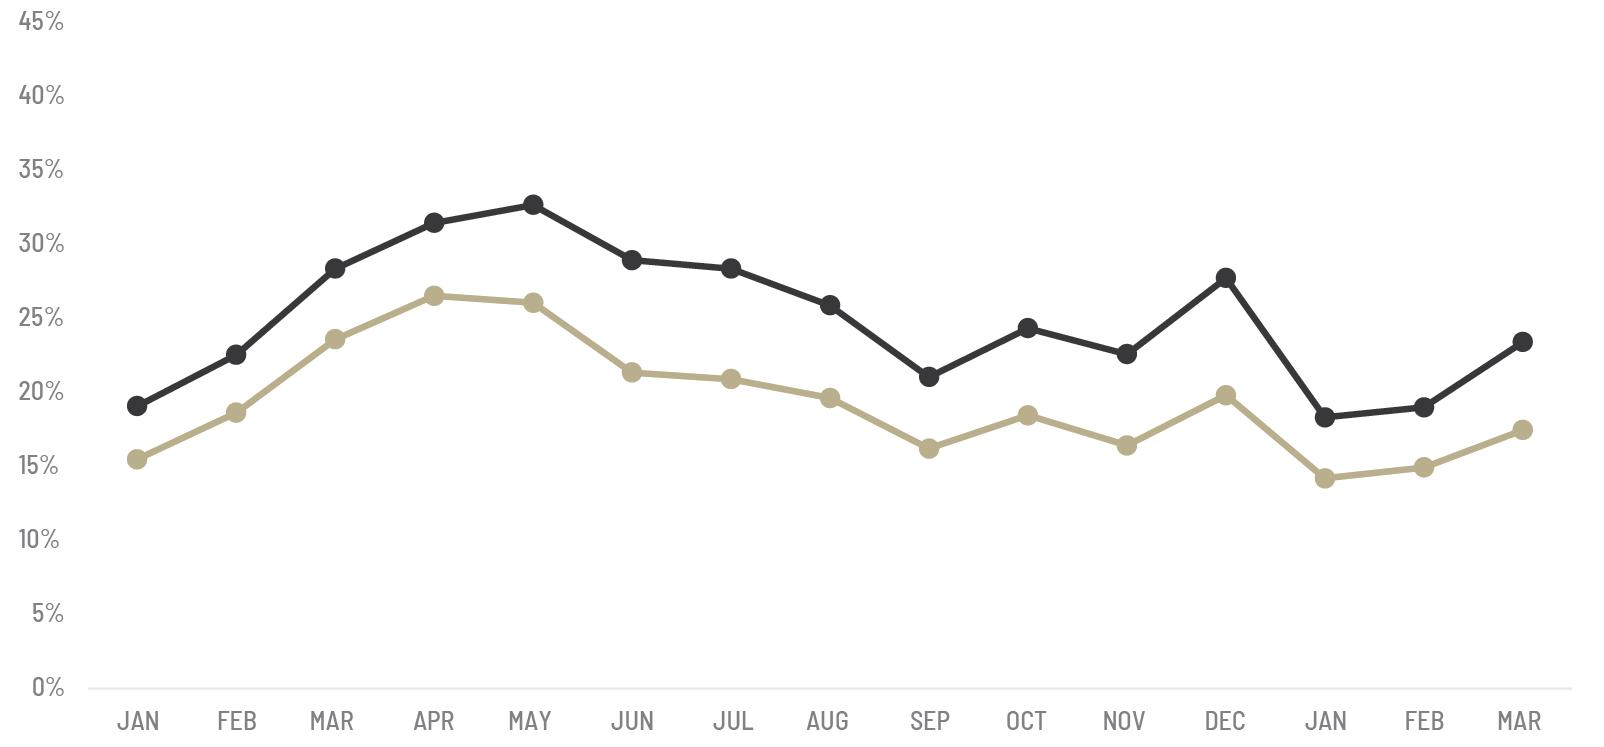
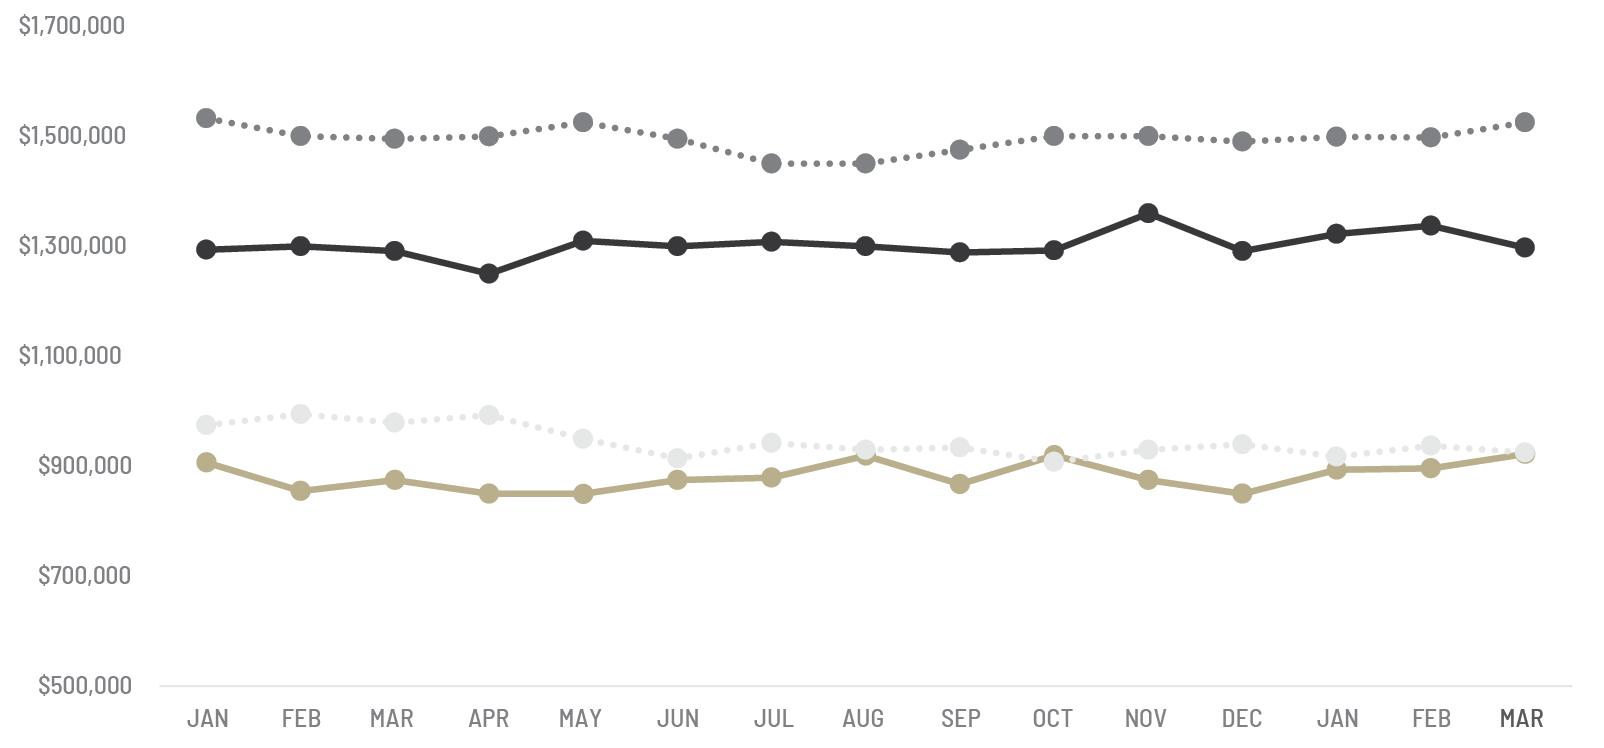
13-MONTH MARKET TRENDS
FOR THE LUXURY NORTH AMERICAN MARKET
Single-Family Homes Attached Homes Single-Family List Price Attached List Price
All data is based off median values. Median prices represent properties priced above respective city benchmark prices.
LUXURY MARKET REVIEW
A REVIEW OF KEY MARKET DIFFERENCES YEAR OVER YEAR
Q1 2024 | Q1 2025
SINGLE-FAMILY HOMES
13,310 3,377
SINGLE-FAMILY HOMES MARKET SUMMARY | Q1 2025
• Official Market Type: Balanced Market with a 20.46% Sales Ratio.1
• Homes are selling for 98.28% of list price
• The median luxury threshold2 price is $900,000, and the composite luxury home sales price is $1,319,125.
• Markets with the Highest Sales Price: Pitkin County ($11,803,158), Telluride ($5,400,833), Eagle County ($4,625,000), and Paradise Valley ($4,241,667).
• Markets with the Highest Sales Ratio: East Bay (69.6%), Seattle (55.9%), Howard County (55.8%), and Morris County (54.3%).
LUXURY MARKET REVIEW
A REVIEW OF KEY MARKET DIFFERENCES YEAR OVER YEAR
Q1 2024 | Q1 2025
ATTACHED HOMES
List Price, Sale Price, SP/LP Ratio, Sales Ratio, Price Per Square Foot, Days on Market, and Home Size are
ATTACHED HOMES MARKET SUMMARY | Q1 2025
• Official Market Type: Balanced Market with a 15.55% Sales Ratio 1
• Attached homes are selling for 98.65% of list price
• The median luxury threshold2 price is $700,000, and the composite attached luxury sale price is $904,150.
• Markets with the Highest Median Sales Price: Park City ($3,310,788), Pitkin County ($3,295,667), San Francisco ($2,748,333), and Telluride ($2,714,667).
• Markets with the Highest Sales Ratio: Howard County (96.6%), Fairfax County (93.8%), Arlington & Alexandria (81.3%), and Anne Arundel County (71.8%).