
14 Petrophysical Considerations in Evaluating the Montney Formation (Unit C), West-Central Area, Alberta, Canada – Part 1 19 The Value of Borehole Image Logs 30 Geomodeling: A Team Effort 34 Go Take A Hike $10.00 MARCH 2015 VOLUME 42, ISSUE 3 Canadian Publication Mail Contract – 40070050 CSPG – Suite 110, 333 – 5 Ave SW, Calgary, AB, T2P 3B6

CSPG OFFICE
#110, 333 – 5th Avenue SW Calgary, Alberta, Canada T2P 3B6
Tel: 403-264-5610
Web: www.cspg.org
Please visit our website for all tickets sales and event/course registrations Office hours: Monday to Friday, 8:00am to 4:30pm
The CSPG Office is Closed the 1st and 3rd Friday of every month.
OFFICE CONTACTS
Membership Inquiries
Tel: 403-264-5610 Email: membership@cspg.org
Technical/Educational Events: Biljana Popovic
Tel: 403-513-1225 Email: biljana.popovic@cspg.org
Advertising Inquiries: Emma MacPherson
Tel: 403-513-1230 Email: emma.macpherson@cspg.org
Sponsorship Opportunities: Candace Seepersad
Tel: 403-513-1227 Email: candace.seepersad@cspg.org
Conference Inquiries: Candace Seepersad
Tel: 403-513-1227 Email: candace.seepersad@cspg.org
CSPG Educational Trust Fund: Kasandra Amaro
Tel: 403-513-1234 Email: kasandra.amaro@cspg.org
Accounting Inquiries: Eric Tang
Tel: 403-513-1232 Email: eric.tang@cspg.org
Executive Director: Lis Bjeld
Tel: 403-513-1235, Email: lis.bjeld@cspg.org
EDITORS/AUTHORS
Please submit RESERVOIR articles to the CSPG office. Submission deadline is the 23rd day of the month, two months prior to issue date. (e.g., January 23 for the March issue).
To publish an article, the CSPG requires digital copies of the document. Text should be in Microsoft Word format and illustrations should be in TIFF format at 300 dpi., at final size.
CSPG COORDINATING EDITOR
Emma MacPherson, Communications Coordinator, Canadian Society of Petroleum Geologists
Tel: 403-513-1230, emma.macpherson@cspg.org
The RESERVOIR is published 11 times per year by the Canadian Society of Petroleum Geologists. This includes a combined issue for the months of July and August. The purpose of the RESERVOIR is to publicize the Society’s many activities and to promote the geosciences. We look for both technical and non-technical material to publish. The contents of this publication may not be reproduced either in part or in full without the consent of the publisher. Additional copies of the RESERVOIR are available at the CSPG office. No official endorsement or sponsorship by the CSPG is implied for any advertisement, insert, or article that appears in the Reservoir unless otherwise noted. All submitted materials are reviewed by the editor. We reserve the right to edit all submissions, including letters to the Editor. Submissions must include your name, address, and membership number (if applicable).The material contained in this publication is intended for informational use only. While reasonable care has been taken, authors and the CSPG make no guarantees that any of the equations, schematics, or devices discussed will perform as expected or that they will give the desired results. Some information contained herein may be inaccurate or may vary from standard measurements. The CSPG expressly disclaims any and all liability for the acts, omissions, or conduct of any third-party user of information contained in this publication. Under no circumstances shall the CSPG and its officers, directors, employees, and agents be liable for any injury, loss, damage, or

expense arising
manner whatsoever from
acts,
third-party user. Designed and Printed by McAra Printing, Calgary, Alberta. FRONT COVER Upper Antelope Canyon, Page, Arizona. The Antelope Canyons were formed by erosion of Early Jurassic Navajo Sandstones. Rainwater, especially during monsoon season rushes through the narrow passageways at high speeds making the corridors deeper and smoothing out the hard edges creating the characteristic “flowing” shapes. Photo by: Mike Lam MARCH 2015 – VOLUME 42, ISSUE 3 ARTICLES Petrophysical Considerations in Evaluating the Montney Formation (Unit C), WestCentral Area, Alberta, Canada – Part 1 ............................................................................. 14 The Value of Borehole Image Logs 19 2014 R.J.W. Douglas Medal Award – Dr. George Pemberton ......................................... 22 Honorary Member – Colin Yeo 25 2014 CSPG Honorary Address .............................................................................................. 26 Geomodeling: A Team Effort – Part 2 30 Go Take a Hike ........................................................................................................................... 34 CSPG University Outreach 2014 Fall Lecture Tour 38 DEPARTMENTS Message from the Board 5 Technical Luncheons ................................................................................................................... 8 Division Talks 12 Rock Shop ................................................................................................................................... 37 RESERVOIR ISSUE 3 • MARCH 2015 3
in any
the
omissions, or conduct of any
(You may never return to the office)

Now, get geoLOGIC’s value-added data almost any place, any time, any way you want it. Available through gDCweb on your tablet, smartphone or computer.
With 30 years of data experience behind it, gDC is the source for high quality, value-added well and land data from across Western Canada and the Northern United States. Another plus – our data is accessible through an expanding range of industry software utilizing our own easy-to-use gDC GIS and our geoSCOUT software.
View, search, import and export well, land and production data, documents, logs and more from almost anywhere. For more information visit our website at www.geoLOGIC.com
Leading the way with customer-driven data, integrated software and services for your upstream decision-making needs.
geoSCOUT | gDC | petroCUBE at www.geoLOGIC.com
Our data has gone mobile
Warning:
CSPG BOARD

PRESIDENT
Tony Cadrin • Journey Energy Inc. president@cspg.org@cspg.org Tel: 403.303.3493

PRESIDENT ELECT
Greg Lynch • Shell Canada Ltd presidentelect@cspg.org Tel: 403.384.7704

PAST PRESIDENT
Dale Leckie pastpresident@cspg.org

FINANCE DIRECTOR
Astrid Arts • Cenovus Energy directorfinance@cspg.org Tel: 403.766.5862

FINANCE DIRECTOR ELECT
Astrid Arts • Cenovus Energy directorfinanceelect@cspg.org Tel: 403.716.3205

DIRECTOR
Mark Caplan • Athabasca Oil Sands Corp. mcaplan@atha.com Tel: 403.975.7701

DIRECTOR
Milovan Fustic • Statoil Canada Ltd. publications@cspg.org Tel: 403.724.3307

DIRECTOR
Michael LaBerge • Channel Energy Inc. memberservices@cspg.org Tel: 403.301.3739

DIRECTOR
Ryan Lemiski • Nexen Energy ULC youngprofessionals@cspg.org Tel: 403.699.4413

DIRECTOR
Robert Mummery • Almandine Resources Inc. affiliates@cspg.org Tel: 403.651.4917

DIRECTOR
Darren Roblin • Kelt Exploration corprelations@cspg.org Tel: 587.233.0784

DIRECTOR
Jen Russel-Houston • Osum Oil Sands Corp. Jrussel-houston@osumcorp.com Tel: 403.270.4768

DIRECTOR
Eric Street • Jupiter Resources street@jupiterresources.com Tel: 587.747.2631

EXECUTIVE DIRECTOR
Lis Bjeld • CSPG lis.bjeld@cspg.org Tel: 403.513.1235
Message from the Board
A message from Michael LaBerge and Darren Roblin

Generally, CSPG Members are geoscientists in academia or the oil and gas industry in Canada who find and develop hydrocarbons, and strive to understand modern and past geological processes in the pursuit of a better characterisation of subsurface geology pertaining to oil and gas. The approximately 3200 CSPG Members – comprised of Full, Associate, Honorary, Emeritus, and Student Members – represent considerable knowledge capital and are an essential segment of the Canadian oil and gas industry. (Note: membership type and other demographics shifts were presented in the article, Message from the Board, presented in the October 2014 Reservoir.) The CSPG offers a home for the Canadian geoscience community where all vintages and specializations benefit from sharing scientific and technical concepts, obtaining published academic and practitioner materials, and participating in conventions, talks, and social events.
The demands of the energy market (in the context of cyclic and relatively unpredictable commodity prices), take-away capacity constraints, regulatory and royalty environments, and ever changing technological developments influence the focus of the geoscientist. Member Services will seek to understand the Members’ demographics and current focus, and will be conducting a survey in 2015 similar to that which was done in 2009 and 2012. This survey is important for the CSPG to understand what is relevant to Members and to determine how we are performing. Your opinion counts!
CSPG Member Services interacts and participates with other CSPG portfolios to further the CSPG’s mission: To advance the professions of the energy geosciences - as it applies to geology; foster the scientific, technical learning and professional development of its members; and promote the awareness of the profession to industry and the public.
Member Services
Member Services is specifically active in advancing our mission in four key areas:
1. Individual Members: The CSPG exists by and for the benefit of the Members. Simply stated, the CSPG is the membership. Member Services will look into what our membership wants, understand our demographics, gauge the level of satisfaction with various CSPG activities, and encourage new Members, continued membership, and Member involvement.
2. Corporate Involvement: A large portion of the CSPG membership and potential Members work for corporations in the energy industry. These companies depend on the Geoscience Community to be knowledgeable and innovative; to find, quantify, and optimize oil and gas; and to manage risk in operations. Member Services will seek to understand what these corporations want from our Members and understand which corporations are involved with and partner with the CSPG and why.
3. Sporting Events: (revise or remove). Sporting events created for and operated by dedicated CSPG Members offer a variety of annual athletic social events. The fiscal year begins with the CSPG 10K Road Race and 5K Fun Run in September, followed by the CSPG Squash Tournament in February, the CSPG Classic Golf Tournament in June, and the CSPG Mixed Golf Tournament in August to finish off the year. The CSPG Slo-Pitch Ball Tournament is in the works for its 2015 debut. Member Services will assist the sporting event committees with demographic and regulatory information, administrative assistance, and seamless processes to maximize Member participation.
RESERVOIR ISSUE 03 • MARCH 2015 5


SPONSORED BY: Produced by Geoscientists for Geoscientist's, the Playmaker Forum brings wellknown, successful and distinguished Canadian speakers together for a day of unparalleled discussion. Register now at www.cspg.org or by calling 403-513-1227 Speakers include: David Gardner Charles Sternbach Ted Beaumont Tom Sneddon Bill Haskett Nathan Meehan Your ticket includes: Complimentary networking lunch at the Hyatt Regency with a Q&A forum Energy Drivers Reception; appetizers and refreshments will be served Join AAPG President-Elect John Hogg as the Playmaker Forum makes its Canadian debut!
CORPORATE
SPONSORS
SAMARIUM
geoLOGIC systems ltd.
DIAMOND
AGAT Laboratories
The CSPG Educational Trust Fund
Cenovus Energy
TITANIUM
Tourmaline Oil Corp.
ConocoPhillips Canada Limited
APEGA PLATINUM
Nexen ULC
Imperial Oil Resources
Schlumberger Canada Limited
IHS Global Canada Limited
Baker Hughes
GOLD
Suncor Energy
Devon Energy Corp
Seitel Canada Ltd.
Enerplus
Husky Energy Inc.
SILVER
Canadian Natural Resources Ltd
Chinook Consulting
CSEG
Arcis Seismic Solutions
MJ Systems
Cabra Consulting Inc.
Emerson Process Management
EOG Resources Canada Inc.
BRONZE
Weatherford Canada Partnership
Talisman Energy
SeisWare
Halliburton
Osum Oil Sands Corp.
Pro Geo Consultants
Qatar Shell GTL Limited
AAPG - Canada region
Ikon Science Ltd.
Pengrowth Corporation
Crescent Point Energy Trust
Geovariances
Paradigm
Pason System
Geomodeling Technology Corp.
Painted Pony Petroleum Ltd.
Canadian Discovery Ltd.
RPS Energy Canada Ltd.
Encana Corporation
GLJ Petroleum Consultants Ltd.
Sproule Associates Limited
Streamsim Technologies, Inc.
Tucker Energy Services Canada
As of January 31, 2015
A Special Thanks to Geologic Systems Ltd., CSPG’s Top Sponsor of the Month.
4. Social and Networking Events: Members find abundant networking opportunities at a variety of CSPG activities such as conferences, division talks, and technical luncheons to name a few. In addition, there are specific events that provide a social setting for Members, including the Young Geoscientists Networking Reception, Honorary Address, Energy Drivers, International Division Reception, and Long-Time Members’ Reception. Member Services will touch base with all Members to see what sorts of events interest them.
Your CSPG membership matters! The Canadian oil and gas industry is an active participant in the provision of energy to domestic and world markets. A quick look at the Government of Canada - Statistics Canada website (http://www.statcan.gc.ca/tablestableaux/sum-som/l01/cst01/gblec04-eng.htm) shows that in 2013, 23.7% of Canada’s exports of goods on a balance-of-payments basis were energy. The largest category of energy exports are crude oil and crude bitumen. We suspect the pending 2014 data will demonstrate similar contribution levels to the Canadian economy. The 2015 projections are probably lower with the current commodity prices, but one thing is certain – the petroleum industry, and thus petroleum geosciences, matters to Canada. As such, it is important to maintain your connection to the geoscience community and to stay informed through continued membership.
If you are not a CSPG Member, but are interested in joining, please call us at 403-264-5610.
Don’t miss out on our upcoming events! For more information and for event registration, please visit www.cspg.org.
March 10 - CSPG Technical Luncheon
March 11 - CSPG International Division Talk
March 24 - CSPG Technical Luncheon
March 31 - AAPG CSPG Playmaker Forum


RESERVOIR ISSUE 03 • MARCH 2015 7
Do
about the Corporate Membership Advantage? Buy memberships for
Geoscientists today! www.cspg.org When ALL
geoscientists are registered as CSPG members, CSPG
compensate
Current Corporate Membership
you know
your
of your
will
you $1000 as a Corporate Supporter. Your company name will run in our ads throughout the year recognizing you as a Corporate Supporter of CSPG!
Supporter:
TECHNICAL LUNCHEONS MARCH LUNCHEON
Characterization of Multi-Porosity
Unconventional Reservoirs and their Relationship to Oil and Gas Productivity
SPEAKER
Robert Aguilera Ph.D., P.Eng. McMaster University University of Calgary
11:30 am
Tuesday, March 10th, 2015 Calgary, TELUS Convention Centre Macleod Hall C/D Calgary, Alberta
Please note: The cut-off date for ticket sales is1:00 pm, three business days before event. [Thursday, March 5th, 2015]. CSPG Member Ticket Price: $45.00 + GST. Non-Member Ticket Price: $47.50 + GST.
Each CSPG Technical Luncheon is 1 APEGA PDH credit.Tickets may be purchased online at https:// www.cspg.org/eSeries/source/Events/index.cfm.
ABSTRACT
This presentation discusses how to build and how to use multi-porosity petrophysical models of unconventional reservoirs and how to link them with production decline analysis. The essential premise is that if we know from
cores and petrographic work that, in addition to inter-particle porosity, there are fractures, slots, vugs, dissolution and/or any other type of secondary porosities, these porosities and associated permeabilities must not be ignored. They have to be accounted for quantitatively.
Unconventional reservoirs are very complex heterogeneous systems that many times are handled in the oil and gas industry with the use single porosity models. This presentation shows that unconventional reservoirs can be better represented by dual, triple and/ or multi-porosity models for more rigorous quantitative petrophysical characterization, production decline analysis, completion and stimulation design. Complicating the problem of unconventional reservoirs is the fact that many times we have to deal with commingled completions, and in the case of shales and coals, with adsorbed and diffused gas.
The presentation demonstrates with the use of core data and drill cuttings that there is a continuum that goes from conventional to tight gas to shale gas to tight oil to shale oil reservoirs. Results indicate that there are distinctive flow units for each type of reservoir that can be linked empirically to gas and oil rates and under favorable conditions to production decline. To make the work tractable the bulk of the data used in this presentation have been extracted from published geologic and petroleum engineering literature.
Production decline models are used to illustrate the effect of commingled completions on the production decline performance of some wells in the Western Canada Sedimentary Basin.
Webcasts
BIOGRAPHY
Aguilera is Professor and CNOOC Limited and Nexen Industrial Research Chair in Tight Oil and Unconventional Gas (TOUG) in the Schulich School of Engineering, Chemical and Petroleum Engineering Department at the University of Calgary, Canada and a principal of Servipetrol Ltd. He is the creator and Principal Investigator of the GFREE* research program at the University of Calgary. He is a petroleum engineering graduate from the Universidad de America at Bogota, Colombia and holds Masters and Ph.D. degrees in Petroleum Engineering from the Colorado School of Mines. He was an AAPG instructor on the subject of naturally fractured reservoirs from 1984 through 1996. He has lectured, presented his course entitled Naturally Fractured Reservoirs and/or has rendered consulting services in more than 50 countries throughout the world.
*GFREE stands for an integrated multidisciplinary team researching geoscience (G), formation evaluation (F), reservoir drilling, completion and stimulation (R), reservoir engineering (RE), and economics and externalities (EE).
 Roberto
8 RESERVOIR ISSUE 03 • MARCH 2015
sponsored by
TECHNICAL LUNCHEONS MARCH LUNCHEON
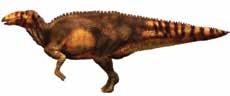
Dinosaurs, mummies & space-shuttles
SPEAKER
Phillip Manning
Professor of Natural History & Director of the Interdisciplinary Centre for Ancient Life, University of Manchester
11:30 am
Tuesday, March 24th, 2015
Calgary, TELUS Convention, Exhibition Hall D, North Building, Calgary, Alberta
Please note: The cut-off date for ticket sales is 1:00 pm, three business days before event. [Thursday, March 19th, 2015].
CSPG Member Ticket Price: $45.00 + GST. Non-Member Ticket Price: $47.50 + GST.
Each CSPG Technical Luncheon is 1 APEGA PDH credit.Tickets may be purchased online at https:// www.cspg.org/eSeries/source/Events/index.cfm.
ABSTRACT
The word “mummy” has been used to mean many different things, but is synonymous with excellent preservation in the realms of archaeology and palaeontology. The term signifies the preservation of soft tissue, such as hair, muscle, tendon, but especially skin. The most familiar examples to us are human, usually of the Egyptian variety, but many such remains include both human and animal remains from all over the world. While some mummies are artificially created by human effort, many are the natural product of accidents or specific environmental conditions. There are multiple preservation types that are unique to each environment in which the physical remains of organisms come to rest. The processes that impact upon a body post-deposition introduce the splendidly macabre science of taphonomy, literally ‘burial-laws’.
The fossilized impressions/remains of dinosaur skin occur in various contexts. Post-mortem factors can move both bones and soft-tissue elements from a body after death, often generating frustratingly
isolated samples. The fossil skin impressions attributable to dinosaurs may also be found as isolated patches not associated with a dinosaur skeleton. In other cases, fragmentary skin impressions are found associated with a skeleton. It is curious to note that for some reason, patches of skin on hadrosaur tails are the most common. Only a select few palaeontologists and fossil hunters have ever known the experience of discovering, excavating, preparing and studying the fossil remains of a dinosaur mummy. Such stories illustrate the changing nature of palaeontological science as new ideas and techniques can be applied to the most special of dinosaur fossils. While it is possible to deploy 21st Century science on such ancient remains, the recovery of such animals has changed little since the first dinosaur mummy was discovered a little over 100 years ago.
Charles H. Sternberg and his sons, possibly the most successful palaeontological dynasty, were the first to discover the mummified remains of a dinosaur in 1908. This was a find that surpassed anything that Sternberg had ever seen in his forty years of fieldwork. This must have been not unlike the feelings of Howard Carter upon opening the intact tomb of the Egyptian pharaoh Tutankhamen in 1922, resulting in equally unprecedented insight to another world.
In 1999 a prehistoric burial site scene was discovered by a young fossil hunter, Tyler Lyson, now a successful scientist working at the Smithsonian in Washington D.C.This is the discovery that would lead to an international interdisciplinary alliance centred around a beautiful fossil. Tyler had discovered the mummified remains of a hadrosaur dinosaur in the Hell Creek Formation of North Dakota (USA). Through a series of very fortunate events, I got to work with Tyler and was able to help build the team of scientists who gained access to this remarkable fossil. The dinosaur was nicknamed ‘Dakota’ and is possibly the first dinosaur to properly wear the ‘mummy’ badge, based upon the information harvested from these fossil remains.
The study of this remarkable fossil took our team from NASA facilities where we probed Dakota’s innermost secrets with highpowered tomography to particle accelerators where the chemical ghosts of past biology were still present in the fossilized soft-tissues. Even the diagnostic chemistry that typifies melanin skin pigment has now been mapped and its coordination chemistry constrained within the prehistoric hide of this very special fossil. This lecture will take you on a whistle stop tour of the people, places, science and
Webcasts sponsored by
discoveries associated with a very special fossil dinosaur called Dakota! - See more at: http://www.aapg.org/career/training/ in-person/distinguished-lecturer/abstract/ articleid/11553/dinosaurs-mummies-spaceshuttles#sthash.ll3xEYUg.dpuf
BIOGRAPHY
Phil Manning is Professor of Natural History and Director of the cross-faculty Interdisciplinary Centre for Ancient Life (ICAL) at the University of Manchester (UK). Phil is also a Fellow (International) of the Explorer’s Club (New York). He has a BSc from Leicester University in Earth Sciences, an MSc from the University of Manchester in Geology and a PhD from the University of Sheffield in Paleontology.
Phil has worked as a paleontologist for over 25 years, including positions in museums and universities, working in both the laboratory and the field. A pivotal theme of his research is the study the multiple contemporary problems of natural-resource conservation and environmental quality and how they relate to the history of life on Earth. His work explores both the past and present interactions of processes that integrate the four terrestrial spheres: lithosphere, hydrosphere, atmosphere and biosphere. Phil’s research is both broad and interdisciplinary with active research topics including: biomechanics, geobiology, taphonomy and soft tissue preservation, synchrotron-based imaging and spectroscopy, de novo applications of LiDAR-based imaging (including landscape and skeletal modeling), x-ray microtomography, as well as the application of numerical modeling techniques to biomaterials. Phil and his team have worked extensively in the Hell Creek Formation of South Dakota and Montana, but his field program also includes sites in South America, Europe, Asia, Africa and Australia.
Phil has presented several documentaries including a recent series for National Geographic Channel (‘Jurassic CSI’) that showcased the application of new technologies in paleontology and he has also contributed to many BBC, Discovery Channel, Channel 4 and History Channel TV documentaries. Phil plays an active role in the University of Manchester’s public programs, contributing to opendays, public lectures, workshops and fieldwork. He has authored both children and popular science books and is a regular contributor to public speaking programs around the world, promoting the public engagement of science. Phil has been appointed as the Science and Technology Research Council (STFC) Science in Society Fellow (2013-2017), so as to further promote science and technology to as wide an audience as possible. The ‘Dinosaur CSI’ blog is authored and regularly updated by Phil and includes information on recent publications from ICAL as well as their extensive field programs around the globe.You can follow Phil on Twitter @DrPhilManning
RESERVOIR ISSUE 03 • MARCH 2015 9
TECHNICAL LUNCHEONS MARCH LUNCHEON
Extensional and Transtensional Rift Basins in California and Mexico
SPEAKER
Cathy Busby University of California
11:30 am
Tuesday, April 7th, 2015 Calgary, TELUS Convention Centre Macleod Hall C/D Calgary, Alberta
Please note: The cut-off date for ticket sales is1:00 pm, three business days before event. [Thursday, April 2nd, 2015].
CSPG Member Ticket Price: $45.00 + GST. Non-Member Ticket Price: $47.50 + GST.
Each CSPG Technical Luncheon is 1 APEGA PDH credit.Tickets may be purchased online at https:// www.cspg.org/eSeries/source/Events/index.cfm.
ABSTRACT
Cenozoic volcanism and sedimentation in the western U.S. and Mexico occurred under extensional to transtensional strain regimes, resulting in excellent preservation of stratigraphy in deep, fault-controlled basins. At ~50-16 Ma, fallback of the subducting Farallon slab resulted in long-distance westward-migration of arc front volcanism across the southwest US and western Mexico, accompanied by E-W extension and basin development. Initially (pre-22 Ma), Farallon slab fallback caused asthenospheric upwelling,
producing supervolcano silicic caldera fields in the east, including the Sierra Madre Occidental silicic large igneous province. Our new work there shows that extension accompanied the ignimbrite flareup and swept westward with it, producing the largest epithermal gold province on Earth.
Continued Farallon slab fallback at ~22-16 Ma produced stratovolcano/lava dome chains on thinner crust in the west, including the Sierra Nevada Ancestral Cascades arc and Comundú arc, in Alta and Baja California, respectively. By ~16-12 Ma, the Pacific/North America plate boundary lengthened, causing E-W extension over a broad arc/backarc region in the southwest U.S. and Mexico (northern and southern Basin and Range).
Thermal softening weakened the continent in the arc front, just inboard of a strong lithospheric block created by the Cretaceous batholith in Alta and Baja California. This became exploited by focused NNW-SSE transtension at ~12 Ma, in response to a change in Pacific plate motion, from more westerly to more northerly. Baja California was quickly rifted off of North America at 12-6 Ma, due to stalling of large Farallon microplates, but extension in Baja basins has continued during the “drift” phase.
California is calving off more slowly, following northward migration of the Mendocino triple junction (MTJ). The onset of transtension is marked by a burst of ~1210 Ma high-K arc volcanism. The leading tip of the transtensional rift exploited a series of large arc volcanic centers localized at major transtensional stepovers (Sierra Crest-Little Walker, Ebbetts Pass), presently occurring at Mount Lassen; in its wake, the largest rift volcanic centers (Long Valley, Coso) are
localized in transtensional stepovers.
This talk will focus on distinguishing sedimentary, volcanic and structural features of basins formed under the tectonic regimes described above
BIOGRAPHY

Cathy Busby has been a professor at the University of California for 32 years. Her B.S. is from Berkeley, and her Ph.D. is from Princeton, both in Geological Sciences. Cathy is a field-based geologist, doing research in sedimentology, volcanology, and structural geology, in convergent margin and rift tectonic settings. Her work is mainly sponsored by the National Science Foundation, but has also been supported by the geothermal, mineral and petroleum industries, and the U.S. Geological Survey. Most recently, Cathy has become involved in oceanographic research, serving as Co-Chief Scientist on International Ocean Discovery Program Expedition 350 to the Izu-Bonin arc (2014). Cathy teaches short courses and field workshops on sedimentary tectonics, deepwater sedimentation, and volcanic-volcaniclastic geology. Cathy’s two offered talks will focus on the two main themes of her current NSF-funded research.
10 RESERVOIR ISSUE 03 • MARCH 2015 APRIL LUNCHEON
Webcasts sponsored by
TECHNICAL LUNCHEONS APRIL LUNCHEON
Reducing Exploration and Development Risk Using Gas Geochemistry
SPEAKER
Mark A. McCaffrey, Ph.D. Weatherford Laboratories
11:30 am
Tuesday, April 21th, 2015 Calgary, TELUS Convention Centre Macleod Hall C/D Calgary, Alberta
Please note: The cut-off date for ticket sales is1:00 pm, three business days before event. [Thursday, April 2nd, 2015].
CSPG Member Ticket Price: $45.00 + GST.
Non-Member Ticket Price: $47.50 + GST.
Each CSPG Technical Luncheon is 1 APEGA PDH credit.Tickets may be purchased online at https:// www.cspg.org/eSeries/source/Events/index.cfm.
ABSTRACT
“Gas Fingerprinting” refers to using the composition of a gas as a tool to resolve various exploration and development problems. Two characteristics of a gas define the gas “fingerprint”:
(i) the molecular composition of the gas (i.e., how MUCH of each gas species is present –e.g. methane, ethane, propane, butanes, CO2, N2 etc.) and
(ii) the isotopic composition of the gas (i.e., the abundances of the stable isotopes of carbon and hydrogen in each gas species).
The primary applications of gas fingerprinting to exploration and development of petroleum in unconventional oil and gas reservoirs are:
• Determination of reservoir thermal maturity (constraining the likelihood of associated hydrocarbon liquids).
• Assessment as to whether or not induced fractures have propagated out of the intended zone and into either an overlying or underlying zone causing the unintended commingling of production from multiple intervals.
• Quantitative allocation of the contribution of individual pay zones to commingled gas production.
• Assessing the origin of hydrocarbon gas in aquifers to determine if such gas is, or is not,
related to petroleum development activity in an area.
Additional applications of gas fingerprinting to conventional reservoirs:
• Determination as to whether or not the gas in each penetrated interval is bacterial or thermogenic in origin (greatly constraining the likelihood of associated hydrocarbon liquids).
• Prevention of “missed pay” (e.g., pay zones could be missed where they have been flushed by drilling while overbalanced, but isotope data identify when an interval contains migrated gas, even if the drilling conditions prevent the migrated gas from appearing clearly on well log data).
• Characterization of hydrocarbon type in a zone (gas, condensate, or oil).
• Identification of reservoir compartment boundaries.
Weatherford Laboratories scientists have developed tools for deriving the maximum information from gas fingerprinting data by thoroughly integrating gas compositional and isotopic data with each other and with geological and engineering data. This talk will use case studies to illustrate such applications of gas data. Both laboratory-based and well-site-based gas analyses will be discussed.
BIOGRAPHY

Dr. Mark McCaffrey is the Geoscience Manager of Interpretive Services at Weatherford Laboratories. He received his B.A. (1985) from Harvard University, magna cum laude with highest honors in geological sciences, and his Ph.D. (1990) in chemical oceanography (in the area of organic geochemistry) from the Massachusetts Institute of Technology/ Woods Hole Oceanographic Institution Joint Program. Mark spent 10 years at Chevron and Arco as a petroleum geochemist, then founded OilTracers LLC, a firm specializing in applications of petroleum geochemistry. After 10
Webcasts sponsored by
years, OilTracers was acquired by Weatherford. He is an author of more than 30 articles on the application of geochemistry to petroleum exploration, reservoir management, and paleoenvironmental reconstruction. As an Expert Witness he has testified (i) in Mississippi State Court, (ii) in Ohio Federal Court, (iii) before the Oklahoma Corporation Commission, and (iv) before the Texas Railroad Commission.
RESERVOIR ISSUE 03 • MARCH 2015 11
DIVISION TALKS GEOMODELING DIVISION
Sweet Spot Analysis Using
Nonlinear Neural Network with Multivariate Input and Multivariate Output
SPEAKER
Tom Cox
Schlumberger Information Solutions, Calgary
12:00 pm
Wednesday, March 25, 2015
Husky Conference Room A, 3rd Floor, +30 level, South Tower, 707 8th Ave SW, Calgary, Alberta
ABSTRACT
The identification of sweet spots in unconventional and resources development plays is a method for focusing efforts on the areas of best potential. These plays often have an abundance of diverse data sets that can be utilized; seismic data (amplitudes, inversions, rock properties, etc), regional maps (gravity, magnetics, stress maps, etc), production information (oil, gas, water rates, etc.), and development parameters (horizontal length, azimuth, fracture design, etc). Combing the information sets requires a multi-variant approach. Neural networks are well suited for predicting multiple parameters due to their ability to simultaneously predict several variables, their lack of sensitivity to highly correlated inputs, and the ability to incorporate non-linear relationships.
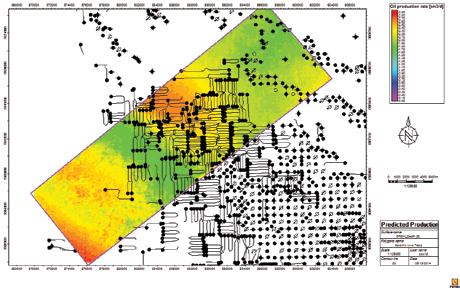
Using seismic, gravity, and magnetic maps production potential is predicted at an edge of the historical Pembina Cardium field where drilling has evolved from vertical wells in a pattern, to horizontal well drilling with stimulation, following the techniques employed in the unconventional plays. The prediction technique uses a neural network to predict production parameters. The actual well production is conditioned to account for varying lengths of horizontal wells, and for varying success in accessing the geologic potential. The neural network is trained with the production data to predict production rate.
The prediction compares very well with input data achieving a 0.789 correlation.
BIOGRAPHY
Tom Cox has been working with Schlumberger Information Solutions since 1992, providing technical support and workflow solutions to oil and gas companies across Canada. Focused on the integration of seismic and well data for the characterization of reservoirs, he has worked extensively with the Petrel Platform and GeoFrame applications helping clients achieve an integrated understanding of their reservoirs. Prior to Schlumberger,Tom worked as a geophysicist for Imperial Oil Limited in the Western Canada basin and East coast offshore. Tom graduated from the
University of Western Ontario with Bachelor of Science (1985) and Masters of Science (1988) degrees in Geophysics, and completed the Citation Program in Applied Geostatistics at the University of Alberta (2008).
INFORMATION
There is no charge for the division talk and we welcome non-members of the CSPG. Please bring your lunch. For details or to present a talk in the future, please contact Weishan at Weishan.Ren@ pennwest.com.
RAINʼS LOG ANALYSIS COURSES For Engineers, Geologists, Geophysicists, and Technologists Every April and Octoberin Calgary Details /Registration at www.spec2000.net/00-coursedates.htmSlide Shows, Reference Manuals, and Exercises Included AV-01 Practical Quantitative Log Analysis AV-02 Advanced Quantitative Log Analysis AV-03 Analysis of Unconventional Reservoirs Details / Order Onlineat: www.spec2000.net/00-av-training.htm Single-User, Corporate, and Academic Licenses Available Individual Reference Manuals and Slide Shows Available Separately Shareware Petrophysical Encyclopediaat www.spec2000.net 50+ Years OfExperience AtYour Fingertips === E. R. (Ross) Crain. P.Eng. 1-403-845-2527 ross@spec2000.net === Figure: Multi-variant neural network predicted oil production rate, P50 of 100 realizations (units of m^3/m length). 12 RESERVOIR ISSUE 03 • MARCH 2015
C
Sponsored by
DIVISION TALKS BASS DIVISION
Perspectives
on, and tools for, analyzing geological risk: Moving beyond the historical analysis of drilling risk to improve unconventional play performance.
SPEAKERS
Kirk G. Osadetz1,3 and Zhuoheng Chen2, 1Programs Development Manager, CMC Research Institutes Inc., 3535 Research Road NW, Calgary, Alberta T2L 2K8, kirk. osadetz@cmcghg.com
2Senior Research Scientist or 3Volunteer Geological Survey of Canada, Natural Resources Canada, 3303, 33rd Street NW, Calgary, Alta., Canada T2L 2A7
12:00 pm
Wednesday, March 11 2015
ConocoPhillips Auditorium, Gulf Canada Square, 401 – 9th Ave. S.W. Calgary, AB
ABSTRACT
Everyone understands the simple a posteriori definition of petroleum drilling risk as the ratio of successful results compared to the result of the total drilling effort. Most people, conceptually at least, treat drilling risk as a statement of past events with little significance for planning future activities. This can be confirmed by the analysis of risk evolution through a play’s history, as exemplified by the “Rainbow Reef” play. Such an analysis suggests that we did not extract fully the past lessons of both successes and failures as conventional petroleum plays were identified and exploited. Could the same be true for unconventional activities like the exploitation of pervasive low porosity and low permeability plays and in situ bitumen project?
If we consider risk more intensively, we observe that it is much more than just a tale of successful and unsuccessful wells. Rather, it is the story of how petroleum system parameters control petroleum system
performance, typically with a focus on the role of the reservoir and the seal rather than on the petroleum generation and migration process. This explains directly the historical success of the anticlinal and stratigraphic accumulation paradigms in conventional exploration. The role of reservoir and seal are as, or even more, important when evaluating unconventional play risks and reservoir engineering interventions. Because many petroleum system parameters have geographic significance it is possible to characterize petroleum system risks geographically, both qualitatively and quantitatively. This use of risk, as a geographic feature of a spatially distributed resource has great potential for improving industrial performance. We will discuss several tools that permit the geographic description of play risk, and we will look at how they might be used and applied to improve unconventional resource development.
BIOGRAPHIES
Kirk Osadetz, a graduate of the University of Toronto, and Zhuoheng Chen, A graduate of the Norwegian University of Science and Technology, Tronheim have worked together at the Geological Survey of Canada in Calgary, addressing topics of petroleum resource appraisal and petroleum geoscience. Kirk now works with CMC Research Institutes
Sponsored by
Inc., in Calgary. Zhuoheng currently leads the GSC’s Unconventional Petroleum Assessment project in the Geoscience for New Energy Resources Program.
INFORMATION
BASS Division talks are free. Lunch is generously provided by NExT of Schlumberger and TarCore. For further information about the division, joining our mailing list, a list of upcoming talks, or if you wish to present a talk or lead a field trip, please contact either Steve Donaldson at 403766-5534, email: Steve.Donaldson@cenovus. com or Mark Caplan at 403-975-7701, email: mcaplan@atha.com or visit our web page on the CSPG website at http://www.cspg.org.


RESERVOIR ISSUE 03 • MARCH 2015 13
PETROPHYSICAL CONSIDERATIONS IN EVALUATING THE MONTNEY FORMATION (UNIT C), WEST-CENTRAL AREA, ALBERTA, CANADA – PART 1
| By Omar Mazen Derder, NeoSeis Technology Group Ltd., Earth Science Section, Calgary, Alberta, Canada
Abstract:
The petrophysical analysis of tight gas reservoirs has been a challenge due to heterogeneity. Non routine methods are required to understand the low-permeability of the Montney reservoir. Pulse-decay permeability under confining pressure was used to calibrate the profile permeability to in-situ stress conditions which in turn was used as a basis to identify flow units and reservoir heterogeneity. Winland Cross-Plot and Modified Lorenz Plot methods relating pore throat size to permeability and porosity are used to define the reservoir flow unit. These methods permit identification of rock types, which can then be used to characterize the reservoir in terms of rock quality and from there, net pay intervals for the study wells. To allow an appropriate classification of the observed rock types, we recognized three sub-petrofacies of the nano-porous rock-type
to better understand reservoir quality. These sub-petrofacies have different petrophysical properties and consequently will form distinct flow units within the reservoir. Best estimates of permeability and porosity cut-offs were read from the best fit line through the data. This paper focuses on tight and shale gas of the Unit C of the Lower Triassic of Montney Formation in the Pouce Coupe Area of westcentral Alberta; petrophysical properties measurements for tight gas reservoir using wire-line logs and lab analysis.
Key words:
Unconventional Reservoir, Montney Formation, Rock type, Petrofacies, Flow Unit, Net Pay.
1. INTRODUCTION
Sedimentation in the Western Canadian Sedimentary Basin (WCSB) in the Triassic was confined to three tectonically controlled contiguous basins, which are the Peace River
Basin, Continental Margin Basin, and the Liard Basin (Davies et al., 1997). The study area overlies the southeastern margin of the collapsed Peace River Arch as defined by Barclay et al. (1990), and northeast trending Upper Devonian Leduc Reef. The second major structural element in the study area is the southern extension of the Fort St. John Graben (Barclay et al., 1990).
The Triassic Montney tight unconventional gas is one of the recent popular exploration and development natural gas reservoirs in Western Canada. The Montney is comprised of upper and lower members, informally subdivided into the Montney B-F (Montney F, Basal Doig in Alberta) and ranges from primarily a conventional gas or oil reservoir on the east side of the play, associated with mainly shoreface depositional environments, to a tight gas and shale gas reservoir, associated with primarily proximal-middle (tight gas)
14 RESERVOIR ISSUE 03 • MARCH 2015
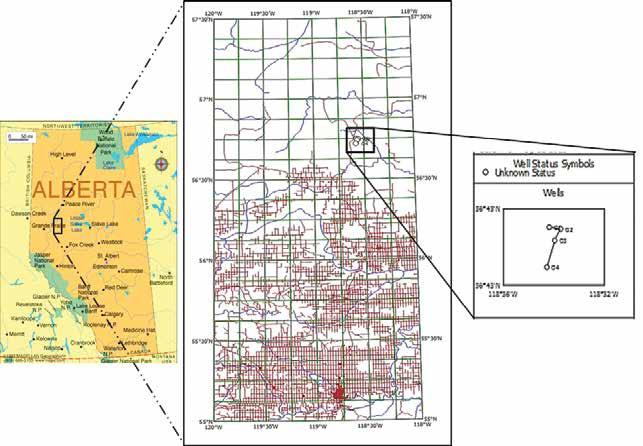
Fig. 1 Map of Alberta showing the location of the study area and the base map of study area showing the well locations within the southern part of the Montney Pouce Coupe Pool. Left picture (Alberta Map) from Alberta Atlas
to distal shelf (shale gas) depositional environments in the west.
There are many technical challenges associated with exploration and development of unconventional gas plays in the Montney: (i) Heterogeneity in the core is finer than the resolution of well logging tools; (ii) The development of relationships between the matrix pore structure and fluid flow, which is difficult to quantify in an extremely low permeability unconventional reservoir; (iii) The understanding and utilization of petrophysical methods to characterize rock typing and reservoir quality; (iv) The estimation of cut-off values and net-pay using well logs.
This paper is aimed at providing a better understanding of the reservoir characteristics of the upper Montney unconventional gas play, by collecting and interpreting critical reservoir data, some of which is not routinely gathered by industry. The information, resulting interpretations, and conclusions are designed to improve industry’s ability to exploit this resource. The area of this study is located in the subsurface from approximately 56° to 57° N latitude and 118° to 119° W longitudes. The selected wells O1, O2, O3 and O4 covered and area of 1546.448 Acres (6.258 km2) (Fig. 1).
The geology of the Montney Formation (MnFM) in the studied wells is variable and consists of inter-laminated very fine sandstone-siltstone-shale successions. This paper is focused on the reservoir properties of the Lower Triassic MnFM (basal part of the upper Montney) for the studied wells of the Western Canadian Sedimentary Basin. The wells are located within the distal part of the basin, Southern Pouce Coupe area.
2. METHODS
Geological Characterization
Core Description and Analysis
As a part of the drilling program, 17.5 m of core obtained from the studied well (O1) in the gas-producing basal part of the upper Montney Member (unit D1 of Davies et al., 1997). The core was collected using invert mud from a vertical well prior to drilling horizontal well. The core interval was subdivided into two informal members, units Montney C (MnC) and Montney (MnB) grainsize distribution and bulk density variations.
Routine Core Analysis
Routine Core Analyses (RCA) on the fulldiameter core was performed by CoreLab to obtain porosity (Ø) from helium porosimetry, permeability (k) from steadystate measurements performed at a confining pressure, grain density (ρ) bulk volume calculation was caliper based and water
saturation (Sw) was obtained from DeanStark (D-S) distillation. RCA were performed at conditions not reflective of the in-situ reservoir condition.
Profile (Probe) Permeability and PulseDecay Permeability
The probe permeability measurements were performed on a slabbed core from the O1 Well using a PDPK-400 (®CoreLab). Measurements were on unconfined core (not representative of in-situ conditions). A measurement was taken at 2.54 cm spacing and a total of 485 measuring points were collected with measurements performed parallel to bedding in the core. The probe permeability measurement was important to the study because it provides the permeability measurement at a finer scale than the RCA, and it can be useful to define the vertical heterogeneity in the MnFM reservoir.
Following the probe permeability measurements, a total of twenty-five core plugs of 1 inch (2.54 cm) diameter were retrieved from the slabbed core of well O1. Samples were selected at the same location as the probe measurements, in addition to being representative of lithological variations across the entire core.
There was a concern of mud invasion into the end of the core due to that the end of the plug intersected the outer diameter of the core. Several mm of the end of the core plug was thus ground-off to remove material that might be subjected to mud invasion. Ten of the twenty-five core plugs were analyzed for pulse-decay permeability measurements at estimated reservoir net overburden stress conditions (NOB).
Petrophysical Reservoir
Characterization
The integration of petrophysical properties derived from wireline logs with the geological data are used to (i) evaluate the reservoir properties; (ii) delineate the different petrofacies and rock types (iii) identify the flow units; (iv) estimate the net pay for the tight gas reservoirs in the studied well.
Porosity Determination
Matrix density is determined in this study using different methods including: (i) log bulk density versus core porosity plots, (ii) cumulative frequency distribution of density logs, (iii) mineral distribution ratios and (iv) “litho-porosity cross-plots”. Routine core porosity was calibrated to the density log porosity for MnC and the result was used to depth shift the core.
In addition, a Bulk X-Ray Diffraction (XRD) was performed by Bustin (2009) in order to determine the mineral composition and distribution of the siltstone and shale for the core in Well O1.
Porosity and Permeability Relationship
The probe permeability data was arithmetically averaged over seven-points because the data was collected at a finer resolution than RCA and correlated to the porosity from the density log.
Pore-throat Radius and Flow Unit
Identification
An empirical equation based on the Winland/ Pittman Plot, which relates permeability to porosity has been widely used as the basis for deriving specific pore throat size distributions (Tiab & Donaldson, 2004). The equation proposed by Aguilera, (2002) applied in this study. The derivation of the equation is discussed in detail by Clarkson et al., (2012). The flow unit can be estimated from the storage and flow calculations in the porous media at 35% mercury saturation (rp35) during a mercury injection capillary pressure test (Aguilera, 2010). Pore throat can be calculated from:
����35=2.665��100∅0.45 (1)
The relationship between the permeability, porosity and pore/pore throat size is used in the recognition of the rock types and to identify the flow units. Rock types have been classified according to their petrophysical properties such as porosity, permeability and saturation. In general, the rock types are categorized by properties related to hydrocarbon storage and flow.
In addition, a Modified Lorenz Plot (MLP) is the suggested method for defining the flow units that are required for interpretation. The MLP plot of the percent flow capacity (% kh) versus the storage capacity (% Øh) is made for the core interval by using continuous core porosity and permeability or the log derived porosity and permeability. The selected flow unit intervals are based on the inflection points from the MLP.
Water Saturation Calculation
Water saturation (Sw) is a critical reservoir parameter as it affects effective gas permeability and gas-in-place (Kukal et al., 1983). Dean-Stark (D-S) water saturation method has been tried using oil-based mud systems. Generally, the results were taken from the industry support database with no further information.
Archie’s water saturation formula is used extensively for the MnFM by many operators (Nieto et al., 2009). The advantage of this conventional technique is that it is wellestablished and is relatively easy to apply. The calculated Sw value is susceptible to error because it requires a large number of parameters such as formation water resistivity (Rw), pore geometry (a), cementation factor (m), and saturation exponent (n) (Bassiouni,
RESERVOIR ISSUE 03 • MARCH 2015 15
1994); consequently affecting the evaluation process.
Petrofacies and Rock Types
The permeability-porosity measurements were related to the different sub-units (petrofacies) defined on the core and on the conventional logs. Petrofacies are defined by Porras et al. (1999) as a rock that has a similar pore throat radius and fluid flow characteristics. A common definition for the petrofacies correlates the petrophysical rock type and pore structure to the physical rock properties such as porosity and permeability (Rushing et al., 2008).
In order to identify and/or differentiate rock types, core samples were used to determine typical petrophysical properties of the studied unit. This analysis was done by comparing the petrophysical properties of core to the logs. The work focused on correlating, comparing and evaluating the parameters existing from core and well log data.
The Montney Formation was divided into three petrofacies. Petropfacies 1 (siliciclastic Montney) in the east of Alberta characterized by coarse grain size. Petrofacies 2 (organicrich Montney). To the basin-ward in the west of Alberta, Petrofacies 3 contains phosphatic and dolomitic material (Nieto et al., 2009).
Sub-petrofacies (SP), based mainly on the core descriptions and petrophysical measurements were assigned to all the samples used in the current study. The reservoir was separated into groups with similar lithology, permeability, pore throat radius, and petrophysical properties. Core and log responses were combined into rock types based on large-scale geologic features defined by the log signatures or electrofacies (rock with specified characteristics based on electric log responses).
Net Pay Estimation
Finally, delineation of the upper and lower limits of the geologic strata or rocks containing hydrocarbons is important for estimating pay zone thickness. To ensure an economical flow rate, a zone of economic interest should have satisfactory permeability. Net pay is determined by applying cut-off values in order to distinguish the pay from the non-pay sections in a given formation (Worthington & Cosentino, 2005).
There are many procedures in order to estimate the cut-off values by using the petrophysical data such as Snyder (1971), Worthington & Cosentino (2005), Jensen and Menke (2006) and Worthington (2010). The cut-off values in the studied unit were estimated by using a statistical method developed by Jensen and Menke (2006). The
output of this method is used to evaluate the net pay zones through MnC unit.
3. RESULTS and DISCUSSION
Geological Characterization
Core Description and Analysis
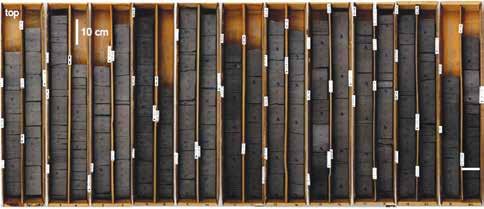
The MnC represents the upper part of the studied core of 13.41 m. The MnB is not included in this study. The core in the subject well is comprised of a series of stacked very fine sandstone-siltstone-shale packages (Fig. 2). The studied core shows vertical changes in composition on a millimeter to centimeter scale (Derder, 2012).
The grain sizes range from shale, siltstone, to a very fine-grained sandstone. The MnC is characterized by finely-laminated planar, rippled laminations, and trace fossils within the siltstone. The presence of siltstone/shale in the MnC suggests a low original porosity, which was further reduced due to compaction and diagenesis.
The studied shale and siltstones were interpreted as being deposited by turbidity currents at the toe of the slope break where the gravity flows decelerate (Moslow & Davies, 1997). In well O1, the thicknesses of the silt bedding are variable with the bedding thickness decreasing toward the top of the core. Siltstone beds range from 4 cm thick at the base to <1 cm at the top, while the distance between siltstone beds decreases upward from 75 cm at the base to 2.5 cm at the top of the core (Derder, 2012).
away from the channels and fan lobes into an outer fan.
Routine Core Analysis
Twenty-seven core plugs from the MnC unit were analyzed from Well O1. Fourteen of the permeability measurements from the Well O1 are equal to or below 0.01 mD, which is the lower resolution of the RCA (Fig. 3). The inability to find a correlation between the permeability and porosity is contributed by an insufficient accuracy of the whole core analysis, or due to the resolution of the RCA measurements and a wide variation in permeability and porosity.
Satisfactory correlations from the cross-plot of the porosity-permeability cannot be obtained by using RCA because the analysis was performed on full-diameter core that contains heterogeneities. For example, there are identical permeability values on the different porosities, or different permeability values on identical porosity values. Also, some outliers that are observed in the characterization of the low permeability regions will have a significant effect on the fluid-flow prediction that is not represented in the correlation.
In general, the full diameter core analysis represents the average rock properties over the studied interval. As a result, the whole core analysis has a tendency to ignore the average of the small scale changes in the rock properties that are common in the heterogeneous MnFM. In addition, this indicates that the porosity is not the only primary control on permeability for this unit.
As previously mentioned the MnC unit is characterized by finely-laminated siltstone and shale, and upward increase in the siltstone content as shown by low core gamma ray reading. The siltstone-shale laminae occurring on the mm scale are separated by shale beds 0.5 cm to 10 cm (2.5 cm in average). These sediments appear to represent a basin plain turbidite deposit based on Mutti’s classification (1977), and can be classified as deposits located further
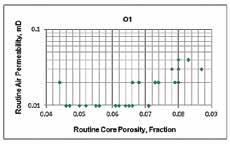 Fig. 2 Core interval 2196-2209.41 m, well O1, consists of grey to light grey very fine grained sandstone, siltstone & shale.The dots marked on the core correspond to the profile permeability measurement location (Derder, 2012)
16 RESERVOIR ISSUE 03 • MARCH 2015
Fig. 3 Cross-plot of RCA data (permeability and porosity) for full diameter core samples showing a poor relationship
Profile (Probe) Permeability and PulseDecay Permeability
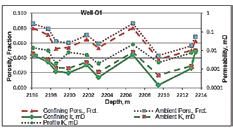
Based on the ten plugs of measured porosity using a CMS-300 (®CoreLab) and permeability using a PDK-200 (®CoreLab) at variable confining pressures. The variation between the probe and pulse-decay in permeability is obsorved due to the difference in the conditions of measurement, namely stressdependence and volume of the sample size.The variable porosity measurements are attributed to lithological differences.
A plot of the pulse-decay permeability measurements and porosity measured at reservoir net confining pressure of 25.5 MPa (at estimated reservoir NOB pressure of 3700 psi) conditions; and at smaller equivalent confining pressures of 4.9 MPa (at estimated a smaller NOB pressure of 710 psi) are shown in (Fig. 4). The NOB stress for the reservoir was estimated from lithostatic gradient and initial reservoir pressure (Clarkson et al., 2012).
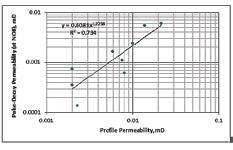
With knowledge of the dependence of permeability on confining pressure, the probe permeability can be corrected to in-situ stress conditions. Profile permeability was related to pulse-decay permeability measurements that were performed at reservoir net confining pressure to allow for correction of probe in-situ conditions. The correction of probe measurements to in-situ permeability is derived (Fig. 5).
A measurement plot of pulse-decay permeability at two different stresses (ambient vs NOB) demonstrated that the difference increases with a decrease in permeability (Fig. 6). Only one sample point out of the ten measurements was eliminated due to an erroneous reading.
weakly correlated. The two values vary significantly in absolute values because of volumes of rock sampled and measurement conditions)
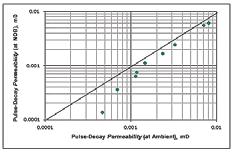
Fig. 6 the pulse-decay permeability measured at net ambient pressure versus pulse-decay permeability measured at estimated reservoir net overburden pressure conditions shows that the difference increases with a decrease in permeability
In this data set, a change in the corrected permeability with depth was observed only in the uppermost 2 m. However, above 2210 m cyclic changes in permeability occur about
every 2 m. Generally, the range of permeability is a relatively from 0.0008 mD to 0.03 mD suggesting a fairly narrow range in dominant pore-throat radius (Fig. 7).
Check out the April issue of the Reservoir for the second part of the “Petrophysical Considerations in Evaluating the Montney Formation (Unit C), West-Central Area, Alberta, Canada” article
References
1. Aguilera, R., 2010. Flow Units: From conventional to tight gas to shale gas reservoirs. Paper SPE 132845 presented at the Trinidad and Tobago Energy Resources Conference, Port of Spain,Trinidad, June 27-30.
2. Aguilera, R., 2002. Incorporating capillary pressure, pore aperture radii, height above free water table and Winland r35 values on Picket Plots: AAPG Bulletin, v.86, p. 605-624.
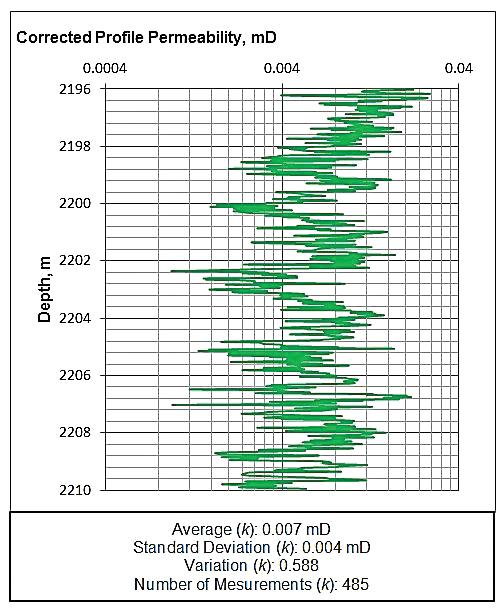
Fig. 7 Log of collected slip-corrected profile permeability on slabbed core with depth,Well O1.The permeability range in values from 0.001 mD to 0.03 mD. No strong changes in permeability with depth, except in interval above 2198 m . The permeability below 2198 m fluctuates for every 2 m cycles. Permeability are relatively small range indicating a small pore throat size. Number of measurements k: 485, Average k: 0.007 mD, Standard Deviation k: 0.004 mD, Variance k: 0.588
Fig. 4 Impact of the ambient and various confining (Overburden) pressures on the porosity and permeability from ten core plugs for tight gas samples)
Fig. 5 the profile permeability versus pulse decay permeability measured at net overburden pressure are
RESERVOIR ISSUE 03 • MARCH 2015 17
3. Alberta Information, Alberta Atlas: Maps and Online Resources [Online], May 28, 2014, www.infoplease/atlas/region/alberta.html.
4. Barclay, J., Krause, F., Campbell, R., & Utting, J., 1990. Dynamic casting and growth faulting: Dawson Creek Graben Complex, Carboniferous-Permian Peace River Embayment, western Canada. Bulletin of Canadian Petroleum Geology, v.38A, p.115-145.
5. Bassiouni, Z., 1994. Theory, Measurement and interpretation of well logs. Richardson, TX, USA: Society of Petroleum Engineers.
6. Clarkson, C., Jensen, J., Pedersen, P.k., & Freeman, M., 2012. Innovative methods for flow-unit and pore-structure analyses in a tight siltstone and shale gas reservoir. AAPG Bulletin, v. 96, No. 2, pp. 355-374.
7. Davies, G., Moslow, T., & Sherwin, M., 1997. The Lower Triassic Montney Formation, west-central Alberta. Bulletin of Canadian Petroleum Geology, v. 45, No. 4, 474-505.
8. Derder, O., 2012. Characterizing Reservoir Properties for the Lower Triassic Montney Formation (Units C and D) Based on Petrophysical Methods. MS thesis, University of Calgary, Calgary, Alberta, Canada (January 2012)
9. Derder, O., 2012. Rock typing and definition of flow units, Montney Formation (Unit C), West Central Alberta. InSite: 31(1): 16-21.
10. Derder, O., 2014. Well-to-Well automated Correlation: Western Canadian Sedimentary Basin, Alberta, Canada. Reservoir: CSPG, v. 41, Issue 02, pp.20-29.
11. Jensen, J., & Menke, J., 2006. Some statistical issues in selecting porosity cutoffs for estimating net pay. Petrophysics: 47(4): 315-320.
12. Kukal, G., Biddison, C., Hill, R., Monson, E., & Simons, K., 1983. Critical problems hindering accurate log interpretation of tight gas sand reservoir. SPE/DOE 11620, 1-10.
13. Moslow, T., & Davies, G., 1997. Turbidite reservoir facies in the Lower-Triassic Montney Formation, west-central Alberta. Bulletin of Canadian Petroleum Geology, v.45, No.4, p.507-536.
14. Mutti, E., 1977. Distinctive thin-bedded Turbidite facies and related depositional environments in the Eocene Hecho Group (south-central Pyrenees, Spain): Sedimentology, v. 24, p.107-131.
15. Nieto, J., Bercha, R., & Chan, J., 2009. Shale gas Petrophysics-Montney and Muskwa, are they Barnett look-alikes?. SPWLA 50th Annual Logging Symposium, the Woodlands, Texas, June 21-24, 2009, pp. 1-18.
GEOEDGES INC.
and accurate geology at your fingertips in Petra, GeoGraphix, ArcGIS, AccuMap, GeoScout and other applications
Edge Set (all colors)
16. Porras, J., Barbato, R., & Khazen, L., 1999. Reservoir flow units: A comparison between three different models in the Santa Barbara and Pirital Fields, North Monagas Area, Eastern Venezuela Basin. Paper SPE 53671 Latin American and Carribbean Petroleum Engineering Conference. Caracas, Venezuela.
17. Rushing, J.A., Newsham, K.E. & Blasingame, T.A., 2008. Rock typing-keys to understanding productivity in tight gas sands. Paper SPE 114164 presented at the SPE Unconventional Gas Reservoir Conference, Keystone, Colorado, USA.
18. Snyder, R., 1971. A Review of the Concepts and Methodology of Determining “Net Pay”. SPE Paper 3609, Society of Petroleum Engineers, Richardson, Texas.
19. Tiab, D., & Donaldson, E., 2004. Pertrophysics: Theory and practice of measuring reservoir rock and fluid transport properties. Oxford: Elsevier.
20. Worthington, P., & Cosentino, L., 2005. The role of cutoffs in integrated reservoir studies. SPE Res Eval & Eng 8(4), 276-290.
21. Worthington, P., 2010. Net pay-what is it? What does it do? How do we quantify it? How do we use it?. SPE Res Eval & Eng 13(5), 812-822
Western Canada: Slave Point, Swan Hills, Leduc, Grosmont, Jean Marie, Horn River Shales, Elkton, Shunda, Pekisko, Banff, Mississippian subcrops and anhydrite barriers in SE Sask., Bakken, Three Forks, Montney, Halfway, Charlie Lake, Rock Creek, Shaunavon, BQ/Gething, Bluesky, Glauconitic, Lloyd, Sparky, Colony, Viking, Cardium, CBM, Oilsands Areas, Outcrops
US Rockies & Williston: Red River, Mississippian subcrops & anhydrite barriers (Bluell, Sherwood, Rival, etc), Bakken, Three Forks, Cutbank, Sunburst, Tyler, Heath, Muddy, Dakota, Sussex, Shannon, Parkman, Almond, Lewis, Frontier, Niobrara, Mesaverde shorelines, Minnelusa, Gothic, Hovenweep, Ismay, Desert Creek, Field Outlines, Outcrops
Texas & Midcontinent: Granite Wash, Permian Basin paleogeography (Wolfcampian, Leonardian, Guadalupian), Mississippian Horizontal Play, Red Fork, Morrow, Cleveland, Sligo/Edwards Reefs, Salt Basins, Frio, Wilcox, Eagleford, Tuscaloosa, Haynesville, Fayeteville-Caney, Woodford, Field Outlines, Outcrops, Structures
North American Shales: Shale plays characterized by O&G fields, formation limit, outcrop, subcrop, structure, isopach, maturity, stratigraphic crosssections. Includes: Marcellus, Rhinestreet, Huron, New Albany, Antrim, UticaCollingwood, Barnett, Eagleford, Niobrara, Gothic, Hovenweep, Mowry, Bakken, Three Forks, Monterey, Montney, Horn River, Colorado
Eastern US / Appalachia: PreCambrian, Trenton, Utica-Collingwood, MedinaClinton, Tuscarora, Marcellus, Onondaga Structure, Geneseo, Huron, Antrim, New Albny, Rhinestreet, Sonyea, Cleveland, Venango, Bradford, Elk, Berea, Weir, Big Injun, Formation limits, Outcrops, Allegheny Thrust, Cincinatti Arch, Field outlines
Mexico: Eagle Ford-Agua Nueva, Pimienta, Oil-Gas-Condensate Windows, Cupido-Sligo and Edwards Reefs, Tuxpan Platform, El Abra-Tamabra facies, Salt structures, Basins, Uplifts, Structural features, Sierra Madre Front, Outcrops, Field Outlines
Deliverables include: -Shapefiles and AccuMap map features -hard copy maps, manual, pdf cross-sections -Petra Thematic Map projects, GeoGraphix projects, ArcView map and layers files
-bi-annual updates and additions to mapping -technical support
Western Canada Geological
Set Northern
Geological
Eastern
North
Geological
for information contact: Joel Harding at 403 870 8122 email joelharding@geoedges.com www.geoedges.com
Edge
US Rockies & Williston Basin
Edge Set
US / Appalachian Basin Geological Edge Set
American Shales
Detailed
Texas & Midcontinent US Geological Edge Set
Mexico Geological Edge Set 18 RESERVOIR ISSUE 03 • MARCH 2015
THE VALUE OF BOREHOLE IMAGE LOGS
Part 3: Image Logs in Unconventional Plays and Horizontal Wells
| By Amy Fox, Canadian Discovery Ltd. and Kris Vickerman, HEF Petrophysical Consulting Inc.
Introduction
The first and second parts of this three-part series focused on describing image logs and their utility in interpreting stress-induced features, structure and natural fractures. This final article will focus on image logs in unconventional plays and horizontal wells. Although the applications of image logs in these environments aren’t necessarily new, some of the challenges in collecting and interpreting image logs in them are. In horizontal wells, for example, depending on the orientation of the well with respect to that of the maximum horizontal in situ stress, induced fractures can easily look like natural fractures and be misinterpreted as such. Horizontal wells also tend to show complex patterns of induced fractures. As if these challenges aren’t difficult enough when interpreting traditional image logs, they become even more problematic when interpreting data from newer, oilbased mud imaging tools. However, despite these limitations, images collected in unconventional plays and horizontal wells can provide extremely valuable information about the reservoir.
Data Collection
The relatively recent change in industry to drilling in unconventional reservoirs, in particular shale reservoirs, which are often drilled horizontally, comes with some unique situations for collecting wellbore image logs. Many wells, for example, are now drilled with invert, or oil-based, drilling fluid. Because oil-based mud is electrically non-conductive, electrical imaging tools designed for use in boreholes filled with water-based mud do not function properly. This has led to the development of specialized, oil-based electrical imaging tools such as Schlumberger’s OBMI (vertical field), Halliburton’s OMRI (vertical field), Baker’s Earth Imager (horizontal field) and Weatherford’s OMI tools (scratcher-based). Vertical field tools produce an electrical field that is oriented vertically to the pad which means that they can see horizontal resistivity discontinuities well (those that break the vertical field lines) but do not see vertical resistivity events well such as fractures in a vertical well or bedding in a horizontal well. Horizontal field tools induce a more standard electrical field through the drilling mud, into the formation and then horizontally (radially)
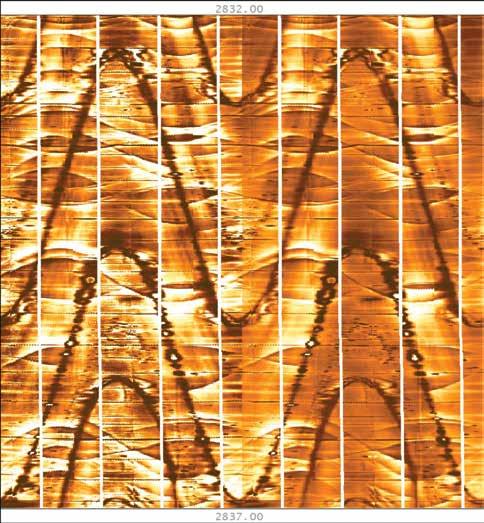
Figure 1: Horizontal electrical image log (dynamic normalization on the left, static normalization on the right) showing bedding (the long, highly inclined spotted black sinusoids), healed fractures (lower amplitude sinusoids with the yellow halos above the peaks and below the troughs) and a number of black, conductive traces, some of which are natural, open fractures and others of which may be drilling induced fractures.
into the image buttons, meaning they are less liable to miss vertically oriented features. Scratcher-based image and dipmeter tools have blade-like electrodes that scratch through the non-conductive mud cake and rarely see fractures. Another consideration is conveying the tool string along considerable distances in a horizontal or nearly-horizontal hole. If this can’t be accomplished using wireline, then the imaging tool must be run on drill pipe or even moved along the hole with a well tractor.
In addition to the operational challenges just discussed, the borehole environment itself can lead to difficulty in obtaining goodquality data. Oil-based images are much more
difficult to interpret due to the presence of repeatable borehole interference (sometimes referred to as desiccation fractures) in vertical field oil-based electrical imaging tools and the presence of sometimes overwhelming bit/tool marks in horizontal field oil-based electrical imaging tools. Further, all oil-based electrical images suffer in intervals with any borehole rugosity that causes the pads to make poor contact on the borehole wall. New electrical oil-based imaging tools are on the horizon (such as Schlumberger’s NGI tool) that look promising and may present a compelling improvement over the firstgeneration imagers.
Acoustic imagers are subject to their own
RESERVOIR ISSUE 03 • MARCH 2015 19
limitations related to an inability to image through heavy muds or thick filter cakes. They have an advantage in that they tend to ignore finer aperture fractures and therefore can differentiate between a conductive but pyrite-filled fracture and an open fracture.
Image Interpretation
Natural Fractures
In electrical image logs run in conventional reservoir rocks, natural fractures typically show up as either dark, conductive, open fractures or bright, healed fractures that show a familiar resistivity halo. Natural fractures in shale reservoirs, however, are not as straightforward. Shale reservoirs can have a variety of materials that can fill (heal) open fractures. These fill materials have electrical signatures ranging from highly resistive (silica, calcite and anhydrite) to highly conductive (pyrite, clays), so it is not always trivial to differentiate natural open fractures from sealed fractures (Figure 1). Many unconventional reservoirs also have a faulting history that introduces a further layer of complexity to fracture interpretation (Figure 2).
An important topic to remember when interpreting a horizontal image log (or, for that matter, any image log) to characterize a natural fracture population is that the well orientation will bias the fracture sets imaged. A horizontal drilled East, for example, has a high probability of intersecting steeply dipping fractures striking North-South and a low probability of intersecting horizontal fractures or steeply dipping fractures with East-West strikes (e.g., Prioul et al., 1997).
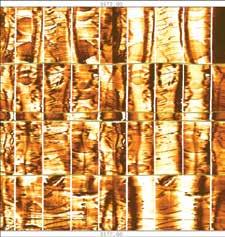
Figure 2: Horizontal electrical image log (dynamic normalization on the left, static normalization on the right) that shows four cross-cutting vertical normal faults (highlighted with the olive-coloured sinusoids). These particular faults appear to be filled with a resistive material, either re-cemented fault gouge or some other healing mineral like silica or calcite. Clearly, these features could have a significant impact on hydraulic fracturing.
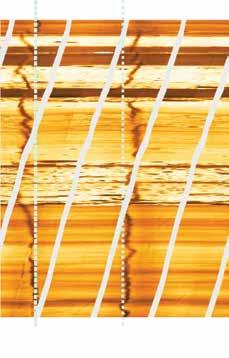
Figure 3: Drilling-induced fractures in vertical wells tend to produce pairs of non-linear, generally axial cracks oriented 180 degrees apart, oriented in the direction of maximum horizontal principal stress.
Induced Features
Compressive and tensile wellbore failure (breakouts and induced fractures, respectively) are caused by the nearwellbore stress concentration, which is controlled by the orientation of the well with respect to the orientation of the three principal in situ stresses, and differences in both temperature and pressure between the well and the formation. In theory, knowing the geomechanical setting and the well information, the pressures at which these features will form as well their positon around the well, and their orientation with respect to the wellbore axis, can be calculated (Peška and Zoback, 1995). In a reverse sense, the presence and geometry of wellbore failure can help determine the in situ stresses when they are not previously known. This type of in situ stress determination is commonly applied in vertical wells. In horizontal wells, however, the wellbore conditions can be affected by operational parameters in ways not normally seen in vertical wells. In addition, horizontal wells drilled through thin horizontal layers of transversely anisotropic, extremely lowpermeability rock set up a very complicated mechanical situation. If the reservoir is in a
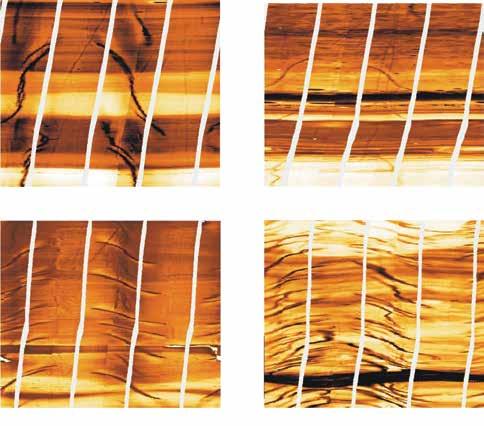
Figure 4: As the wellbore deviation increases, drilling induced fractures tend to curve away from being a pair of vertical cracks into more complex, S or clef-shaped geometries that increasingly look similar to natural fractures.
σhmax σhmax 5 degree deviation 16 degree deviation 7.5 degree deviation 20 degree deviation 20 RESERVOIR ISSUE 03 • MARCH 2015
deep, high-temperature basin, the thermal effects on wellbore failure can also be quite considerable. This all leads to complex feature geometries that, thankfully, do show some common patterns.
In vertical images collected in shale, tensile failure generally looks similar to a conventional image log, usually appearing as a pair of vertical cracks separated by 180 degrees and oriented parallel to the maximum principal horizontal stress direction (Figure 3). As wellbore deviation increases, the position and shape of the tensile cracks change. As deviation increases, e.g., in a direction towards the minimum horizontal in situ stress, induced fractures tend to shorten and become more curved
such that they have a component that tends to be wellbore parallel and a component that curves out of the borehole in a vertical plane towards the maximum horizontal stress (Figure 4). By the time the well is horizontal, induced fractures are generally transverse, perpendicular to the well axis. They usually appear to start on the high and low side of the borehole, spread for about a quarter of the borehole’s circumference, and then propagate parallel to the natural hydraulic parting plane (vertical and parallel to the maximum horizontal in situ stress, Figure 5).
Images in horizontal wells also often show longitudinal induced fractures propagating along the high and low sides of the wellbore, often connecting transverse induced
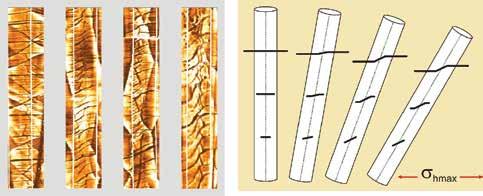
Figure 5: In horizontal wells (such as the four wellbore close-ups shown above), drilling induced fractures can have a component that propagates parallel to the borehole (longitudinal) and a component that propagates towards the direction of maximum horizontal stress (σhmax). If there is an angle between the wellbore and σhmax, the transverse-induced fracture geometry can change from linear bars to S and zipper-shaped configurations. These transverse induced fractures can be seen with or, commonly, without accompanying longitudinal induced fractures.
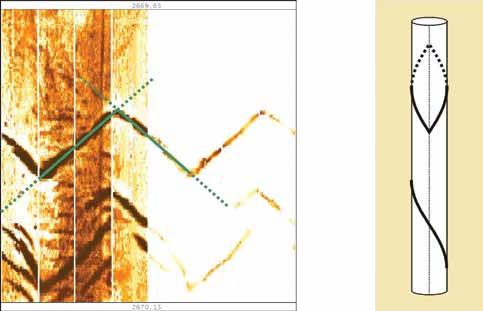
Figure 6: Some fractures come in a paired V shape as shown in the example above (Dynamic image on the Left, Static image on the Right). Since a straight line in a borehole image log is a helix shape, these peculiar failure structures must be mirrored helixes and thus cannot be natural fractures.
fractures at a right angle. These types of features occur at the bit and are thought to be a result of complex hoop stress immediately at the bit.
Also sometimes seen in horizontal wells is a chevron fracture pattern suggestive of helical shaped cracks (Figure 6).
Conclusion, and the Case for Horizontal Image Logs
As the examples in the figures have shown, bedding, natural fractures and even induced features can often be identified on images collected in shales and horizontal wells despite the challenges involved in their collection and interpretation. Frequently if a vertical pilot well is drilled prior to a horizontal, an image log might be run, but it remains unclear how a few tens or hundreds of meters of image through a vertical reservoir section can accurately represent a kilometer or more of horizontal reservoir section.
Although an oil-based and/or horizontal image log may seem costly up front, the fact is that it pales in comparison to the cost of a multi-stage hydraulic fracture treatment. General consensus is that only a relatively small number of frac stages actually contribute to the productivity of a given well. Decisions in designing well completions and hydraulic fracturing might be made differently if horizontal image logs indicated important changes in stress, lithology and/or fractures along the horizontal section.
References
Peška, P. and Zoback, M. D., Compressive and tensile failure of inclined well bores and determination of in situ stress and rock strength, Journal of Geophysical Research, v. 100, no. B7, p. 12,791-12,811, 1995.
Prioul, R., Donald, A., Koepsell, R., El Marzouki, Z. and Bratton, T., Forward modeling of fracture-induced sonic anisotropy using a combination of borehole image and sonic logs, Geophysics, v. 72, no. 4, p. E135-E147, 2007.
RESERVOIR ISSUE 03 • MARCH 2015 21
2014 R. J. W. DOUGLAS MEDAL AWARD
Dr. George Pemberton
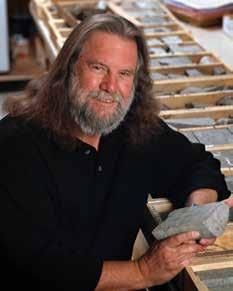
The R. J. W. Douglas Medal is awarded annually by the Canadian Society of Petroleum Geologists for outstanding contributions to the understanding of sedimentary geology in Canada, commending major contributions to regional tectonics, petroleum and structural geology. The award is open to all geologists who follow the example of Bob Douglas in contributing to the development of Canadian sedimentary, petroleum and structural geology. The 2014 recipient is Dr. George Pemberton, as chosen by the R. J. W. Douglas Medal Award Committee.
George Pemberton was born in Preston, United Kingdom, immigrating to Canada in 1950 and raised in Dundas, Ontario, where he attended elementary and secondary school. George’s postsecondary education began when he graduated from Queen’s University with an Honours B. Sc. degree in geology. He received his M.Sc. in 1976 and a Ph.D. in 1979 from McMaster University.
Dr. Pemberton began his academic career taking the position of Assistant Professor at the University of Georgia in Athens, Georgia from 1978 to 1981. He returned to Canada in 1981 to join the Alberta Research Council where he rose to the position of Associate Research Officer. In 1984, Dr. Pemberton joined the University of Alberta, rising from the position of Professor through a Tier 1 Canada Research Chair in petroleum
geology, becoming a University of Alberta Distinguished University Professor and finally assumed the C. R. Stelck Chair in Petroleum Geology in 2013. During his tenure at the University of Alberta, he has served as a Visiting Professor at four other universities and a Visiting Scientist at four major, global petroleum companies.
Dr. Pemberton is a member of 16 professional and technical organizations. He is a Fellow, Distinguished Fellow and Honorary Member of five of them. Dr. Pemberton has served as an instructor, field trip leader, chairman, organizer, convenor, delegate, evaluator, reviewer, committee member, board examiner, secretary, vice president, president, editor, business manager and short course coauthor with these groups.
During his career, Dr. Pemberton has focused his research interests on animal-sediment relationships, clastic sedimentology, genetic stratigraphy, petroleum geology and carbonate bioerosion.
Dr. Pemberton has used the science of ichnology, the study of trace fossils to infer the behaviour and anatomy of organisms, to integrate these essential elements into clastic sedimentology and genetic stratigraphy and then applied this knowledge to petroleum geology around the world. Through his numerous publications he has successfully integrated ichnological concepts and observations into the principles of sedimentology and stratigraphy including the recognition of important sedimentological surfaces and their integration into sequence stratigraphic analysis.
While the scientific merits of Dr. Pemberton’s work are outstanding, it is the transfer of this knowledge to the petroleum industry that has created much economic value. Dr. Pemberton has gone beyond integrating ichnology into sedimentology and stratigraphy, to extending the science into reservoir characterization, exploration and petroleum geology. His research into the effects of geochemical alteration, permeability anisotropy and bioturbation
on the production and recovery of oil and gas reserves has been instrumental in the economic development of many oil and gas pools. Dr. Pemberton has been directly involved in 104 projects for 80 companies working in 35 geological provinces. He has used ichnology to describe regional geological, sedimentological and stratigraphic settings, identifying exploration trends through facies analysis and proximity indicators. He has been successful in identifying high-grade producing areas and enhanced recovery opportunities, and integrating ichnological rock types with petrophysical attributes, allowing regional mapping from well logs. Dr. Pemberton has conducted 130 petroleum industry short courses which is a testament to the value he brings to the petroleum industry. This transferred knowledge is used by industry practitioners to explore, optimize development plans, and assess enhanced recovery opportunities. Due largely to his work, ichnological analysis is now an integral part of geological project work.
During his career, Dr. Pemberton has received numerous awards including the SEPM RC Moore Medal, the AAPG Grover Murray Award and the Geological Association of Canada’s prestigious Logan Medal. The testimonials from the respected organizations that bestow these awards speak volumes to the impact he has had on the science of ichnology globally, his contributions as an educator and the significance of his work to the petroleum industry.
In taking ichnology from taxonomy to integration with sedimentology and genetic stratigraphy and applying this to the petroleum industry, Dr. Pemberton has demonstrated an outstanding scientific contribution to sedimentary and petroleum geology in Canada. Dr. Pemberton’s significant contributions to science, education and industrial applications make him a very worthy recipient of the R. J. W. Douglas Medal.
22 RESERVOIR ISSUE 03 • MARCH 2015


Abstracts: Deadline for Abstracts: March 15th, 2015 March 15th, 2015

Sessions & Session Chairs
The Nature of Unconventional Carbonate Reservoirs
Jay Gregg & Mike Grammer | Oklahoma State University
Carbonate Reservoirs in Structurally Complex Regions
Rudy Swennen | Division of Geology, KU Leuven
The Nature of Intensely Fractured, Vuggy Carbonates
Ron Nelson | Broken N Consulting, Texas
Alex J. MacNeil | Osum Oil Sands, Calgary
Advances in Modeling Carbonate Systems and Reservoirs
Part 1, Methods:
Georg Warrlich | Shell, Malaysia
Rachel Wood | School of Geosciences, University of Edinburgh
Part 2, Flow in Carbonates:
Xiomara Marquez | Maersk, Doha, Qatar
Fiona Whitaker | School of Earth Sciences, University of Bristol
Advances in Diagenesis
Eva Drivet | Drivet Consulting, Calgary
Conxita Taberner | Shell, Netherlands
Dolostones – The Nature of Dolostones in the Geologic Record
Hans Machel | University of Alberta, Edmonton
Jeff Lonnee | Shell, Qatar


2015 CSPG/SEPM Mountjoy Conference 2015 CSPG/SEPM Mountjoy Conference ABSTRACT SUBMISSION NOW OPEN ABSTRACT SUBMISSION NOW OPEN For more information visit: For more information visit: www.cspg.org/Conferences www.cspg.org/Conferences
Conference Sponsors:
Deadline for
HONORARY MEMBER –
Colin Yeo

Colin Yeo earned his B.Sc. in Geology and Geography from McMaster University in 1974, after writing a thesis on the paleoecology of the Thorold Sandstone. He joined CSPG the same year, and became Chairman of the Public Relations Committee in 1977, a role he held for 4 years. He was a Committee Member for an art event to raise money for the Educational Trust Fund in 1986, and then became Chairman of the Archive and History Committee from 1988 to 1992. Colin was Chairman of the Core Conference in 1994 to 1995, and then the Services Director in 1999 to 2000. The next year, he became a member of Volunteer Management Committee, a position he held for four years, where he helped recruit committee chairs
and helped rejuvenate the Education Committee. He served a three year term on the Executive, centered on his 2007 Presidential year, where he helped restructure the office and brought in a new Executive Director. He helped establish the precursor to GeoConvention, and placed the Society on a solid business and financial footing. Since then, he has been the Assistant Editor of the Reservoir, and has written two multipart series for the magazine, one on understanding reserves and resources and the other on petroleum economics for geologists.
Mr. Yeo started his career at Amoco Canada in 1974 as a geologist. Over the next 25 years, he filled many roles, including Strategic Planner, Chief Geoscientist and Team Leader. In 1999, he moved to Petrorep Resources as an Evaluations Geologist, where he helped develop and implement a technical and financial screening process to identify acquisition targets. In 2000, he moved to PanCanadian as a Resource Development Manager, where he oversaw exploration and development of south western Alberta properties. After PanCanadian merged and became Encana, Colin became a Business Development Advisor, a role he held until his retirement in 2014. During that time, he worked on an innovative joint venture to develop coal bed methane resources, increased retention value on heavy oil properties

and contributed to substantial property divestitures throughout western Canada. As well as CSPG, Colin is a member of AAPG, CWLS, CSEG and APEGA. He has been an APEGA Council Member since 2009, and has served as the Vice President, President-Elect, President and currently Past President. He presented on the southern Alberta floods during APEGA’s President’s Tour and in 2013 was made a Fellow of Geoscientists Canada and an Honorary Fellow of Engineers Canada in recognition of his contributions. He’s also led multiple field trips, primarily from 1988 through 1995. As well as his professional involvement, he was active in Boy Scouts from 1981 through 1988, as a Beaver Leader, a Cub leader and as the Group Committee Finance Chair. Mr. Yeo also has been a judge at the Calgary Youth Science Fair from 2004 through 2006.
Colin Yeo has had an outstanding career as both a geologist and a leader. His attention to detail, professional conduct, excellent communication skills, indubitable sense of humour, and persistent dedication are the hallmarks of a true professional. No matter the challenge in his career, Colin has consistently met and exceeded all goals. Combined with his very significant and ongoing contributions to CSPG, he is the epitome of a consummate professional. CSPG is pleased to welcome Colin Yeo in to the ranks of Honorary Members.
Reach more than 3000 petroleum professionals who are empowered to purchase your product or service. ADVERTISE IN THE RESERVOIR Please call: Emma MacPherson Tel: 403.513.1230 Email: emma.macpherson@cspg.org RESERVOIR ISSUE 03 • MARCH 2015 25
Rock Shop
2014 CSPG HONORARY ADDRESS
Dr. François Therrien, Dr. Scott Tinker
| By Keith Millis, Honorary Address Chairman
The 2014 CSPG Honorary Address, held on Monday, November 17th, was a smashingly good time! CSPG has been holding the Honorary Address annually since the 1960s as a way to share earth science passions from the past, present and future, and to honour those who have contributed to our knowledge base. The Honorary Address not only reaches out to youth and post-secondary students, but also attempts to bridge the gap between the geoscience community and the general public. By partnering with engaging speakers and focusing on visually stimulating presentations, this year’s event was inspiring, educational, and fun. The Jack Singer Concert Hall in downtown Calgary saw hundreds of attendees enjoy appetizers, a string quartet,
CBC’s Doug Dirks as emcee, and of course, the presentations of both Dr. François Therrien from the Royal Tyrrell Museum and Dr. Scott Tinker from the Bureau of Economic Geology at the University of Texas.
If the title of François’ talk, “Alberta: Land of Dinosaurs and Other Paleontological Wonders” had given goose bumps, his talk gave even more! He highlighted the fortuitous combination of Alberta’s geological past and modern climate as a link to the vast amount of dinosaur fossils recovered, and even cited discoveries made through the endeavours of energy companies. Scott provided refreshing and novel insight into the global mix of energy sources, market functions, and production
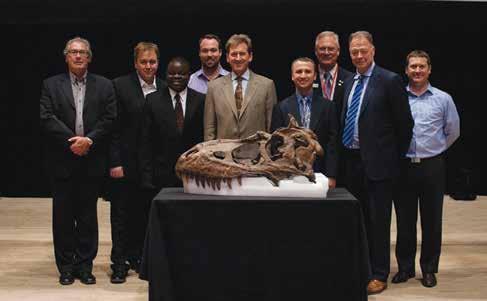
drivers such as affordability, availability, reliability, environmental sustainability, and energy security. The latter of these being a key focus for the world’s governments. By communicating that “every energy source has pros and cons, benefits and challenges,” he fairly portrayed what roles the different resources play and how they fit together in today’s economies. Current market conditions notwithstanding, he also provided insightful glimpses into the future. The question and answer period following the talk was a clear indication of the importance of the issues he raised and their relevance to the audience.
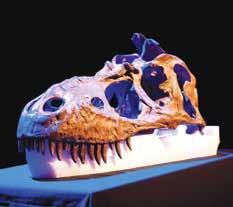
With the tremendously positive feedback we’ve received from attendees, the committee is well underway in our planning of the 2015 Honorary Address. With the tentative theme of Planetary Geology, we are continuing our emphasis on the event being engaging and an exciting opportunity to share our geoscience passion with each other. We would like to thank our 2014 Honorary Address sponsors – whose contribution made the event such a success – the CSPG Educational Trust Fund, CSEG Foundation, APEGA, Crescent Point Energy, Suncor Energy, ConocoPhillips Canada, Painted Pony Petroleum, Explor, DATA Group, and the Calgary Marriott.
26 RESERVOIR ISSUE 03 • MARCH 2015

CONTINUING EDUCATION
Upcoming CSPG Short Courses
Applied Hydrogeology and the Petroleum Industry in Alberta
Industry in Alberta
Groundwater is everywhere beneath our feet, but most of us think very little of its significance, either as a resource to be managed or an agent of geologic change. Nevertheless, groundwater can have an important role across a broad spectrum of activities, especia lly in the hydrocarbons industry in Alberta. Shallow groundwater flow from legacy or operational sites can deliver dissolved contaminants to human or natural receptors. Deeper groundwater can be a source of non -saline or brackish water for use by industry, but the possible effects of groundwater extraction on other users or natural systems must be understood. Over long periods of time and across large distances, regional groundwater flow can result in significant accumulations of hydrocarbon resources. More recent events of hydrogeologic signifi cance include brine and bitumen discharge to the land surface associated with hydrocarbons development, the controversy around hydraulic fracturing, and the effects of oil sands development on groundwater resources. A solid understanding of the groundwater system is becomin g increasingly important to obtaining social license to develop and operate. This course will provide you with an understanding of:
• the fundamentals of hydrogeology,
environmental site assessment and remediation,
regional hydrogeology and groundwater management,
petroleum hydrogeology, and
current issues in Alberta such as hydraulic fracturing, geohazards, and oil sands hydrogeology.
This course is designed for environmental advisors, regulatory professionals, and technical environmental specialists in the hydrocarbon industry in Alberta.
Mannville Stratigraphy, Sedimentology and Petroleum Geology
Topic(s): Overview of Mannville basin, structure and sedimentation; Review of individual units/plays
Type of Play(s): This clastic unit is a reservoir for unconventional oil (heavy oil, bitumen), unconventional gas (tight, sands, coals), liquids-rich gas, as well as conventional hydrocarbons.
Who Should Attend: Geologists and geophysicists who work local areas in the Mannville.
Why Should You Attend: Previous attendees have cited the regional perspective of their areas, gaining knowledge of other related plays, and frequent unpredictable shifts of exploration areas in the Mannville.
Objectives:
1. To familiarize attendees with the vast amount of Mannville research already published.
2. To put small exploration areas in regional and stratigraphy context.
3. To review details of presently active and inactive plays.
Course Content:
1. Introduction - Mannville, Stratigraphic and Basin Setting
2. Basal Cretaceous Unconformity
3. Lower Mannville Units and Plays - Cadomin, Gething, Bluesky, Ostracode, McMurray, Dina, Wabiskaw, Cummings -Sunburst, Cutbank, Basal Quartz - Ellerslie, Ostracode.
4. Upper Mannville Units and Plays - Glauconite, Wilrich, Falher, Notikewin - Colongy to Lloydminster Fms - Clearwater, Grand Rapids, non-marine Upper Mannville, Pense Fm
the
DATE 23 - Apr - 15 LENGTH 2 day INSTRUCTOR Rick Sarg PDH Credits 8 Hours
Petroleum
Register online today at www.cspg.org
START DATE 23 -Apr- 15 LENGTH 2 days INSTRUCTOR Morris D. Maccagno & Tannis Sharp PDH Credits 16 Hrs
START DATE 27 -Apr- 15 LENGTH 3 days INSTRUCTOR Doug Cant PDH Credits 24 Hrs
RESERVOIR ISSUE 03 • MARCH 2015 27
CONTINUING EDUCATION
Upcoming CSPG Short Courses
Introduction Energy Geoscience Workshop (IEG)
DATE 01 - May - 15
This course will provide learners with a basic understanding of geologic concepts and their underlying principles. They will become familiar with terminology and industry inner workings that are valuable to anyone working within the energy geoscience industry.
Targeted audience:
1. Petroleum industry employees who could benefit from basic geologic understanding
2. New graduate geoscientists
3. Geophysicists with limited geologic background
4. Energy personnel providing technical support
5. Petroleum engineers working with geologic data
6. Summer students and interns
Two day workshop is designed for oil and gas employees who have little to no technical training and who wish to l earn more about the geoscience.The modules, covered in this workshop, are authored and instructed by experienced (25yrs.+) Canadian Geoscientists who are CSPG members*.
Evaluation and Exploitation of Low Permeability Carbonate Reservoirs in Western Canada
Learning Objectives:
By the end of this workshop participants will:
1. Understand fundamentals of geologic definitions, key principles and important processes—to assist in the breakdown of the technical language barrier
2. Understand the formation, migration and entrapment of petroleum products—excitement of petroleum geology
3. Realize the work team effort required to produce Energy
4. Awareness to the risks associated with the production of energy and the need to comply with safety procedures
5. Be aware of the types of energy being produced in Canada
6. Observe a type locality of oil and gas production in Alberta, Canada, discuss outcrops, identify formations
7. An understanding of where the energy industry is exploring currently
START DATE 01 - May - 15
Who Should Attend: Geologists, geophysicists, managers and engineers who are exploiting and developing low permeability carbonate reservoirs in the WCSB. Some experience with carbonate rocks is useful, but not required.
Course Agenda: This course will review the characteristics of several low permeability (or tight) carbonate reservoirs through a lecture /core display format. Low permeability carbonate reservoirs in the Wabamun, Muskeg, Zama, Debolt/Elkton, Nisku, Souris River, Torquay, and Midale Formations will be reviewed.
The objective of the course is to develop an understanding of low permeability carbonate reservoirs, through their:
1.) depositional setting, 2.) subsequent diagenesis, 3.) pore system development
4.) spatial distribution of productive flow units
5.) production profile;
The course will be practical in terms of integrating petrophysical logs, core analysis, petrography, and reviewing of selected cores in recent developing pools as case studies. This full day course will review all aspects of tight reservoirs from their inception (in the primordial ooze) to their production. The review of the core of these ow permeability reservoirs will be the central teaching tool. This overview will allow one to strategically, horizontally exploit this type of reservoir, economically.
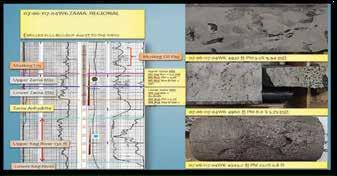
LENGTH 2 days INSTRUCTOR Art Irwin Credits 16 Hrs
LENGTH
days INSTRUCTOR Graeme Bloy PDH Credits 8 Hours Register online today at www.cspg.org
1
28 RESERVOIR ISSUE 03 • MARCH 2015
CONTINUING EDUCATION
Upcoming CSPG Short Courses
Facies Architecture and Sequence
Stratigraphy of Delta System: From
Exploration to Reservoir Performance
29 -Apr- 15
This 3 day short course will provide both a theoretical framework for understanding how deltas originate as well as be a prac tical guide for interpreting and mapping ancient delta systems in subsurface. The course will cover basic definitions, theory of delta forming process and the significance for recognizing these processes in ancient systems, a description of the essential facies components of a delta and the implications for subsurface facies architecture, and finally a survey of the different types of delta systems. Emphasis will be on recognizing river-, tide-, wave- and mixed -influence delta systems.
Several case histories, emphasizing both exploration and production scale characteristics will be covered including; The Dunvegan Delta (Alberta) and Prudhoe Bay Field (Alaska). In addition, several outcrop examples will be discussed to give participants an ide a of the lateral heterogeneity in delta systems and its effect on reservoir flow behaviour.
The course will include a series of powerpoint lectures, followed by several well -log correlation and core interpretation exercises. Core examples will be from the Dunvegan Formation in Alberta. The course is designed as an up -to-date review of the last 20 years of new ideas in deltaic sedimentology and will appeal to geologists needing a review and update as well as to reservoir engineers and geoscientists working on reservoir modeling and production in deltaic reservoirs.
List of Topics:
• Basic definitions and classification.
• Theory of delta forming process.
• Delta Environments.
• Facies components of a delta.
• Facies architecture.
• Sequence stratigraphic concepts.
• Case studies of different ancient and modern deltas.
• Application to subsurface problems.
• Reservoir Characterization
• Thin-bedded reservoirs and halo plays Exercises:
• Core description and interpretation
• Outcrop correlation
• Well Log correlation
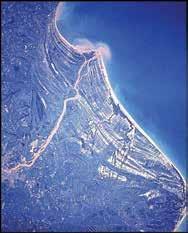
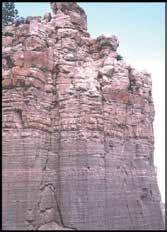
START DATE
LENGTH 3 days INSTRUCTOR Janok
PDH Credits 24 Hours
P. Bhattacharya
Register online today at www.cspg.org
More Short courses and Field Seminars coming For more info visit cspg.org RESERVOIR ISSUE 03 • MARCH 2015 29
GEOMODELING: A TEAM EFFORT
Part 2: The Geomodeling Workflow
| By Thomas Jerome, Jun Yang and Suzanne Gentile, RPS
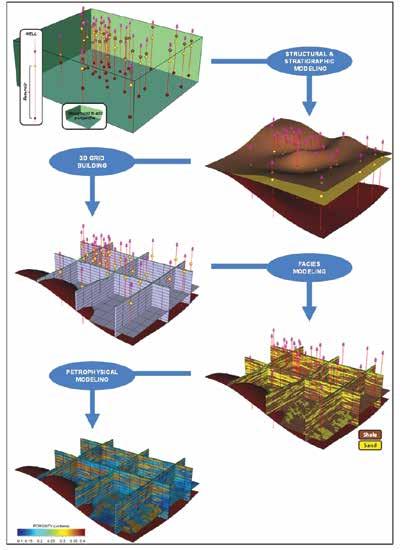
INTRODUCTION
Simagni volore reprovi digent ut ullam eosa The core of any reservoir modeling workflow includes five steps: gathering the data, structural and stratigraphic modeling, threedimensional (3D) grid building, facies modeling and petrophysical modeling (Figure 1). This paper gives an overview of each step and an idea of how the team members contribute to such work, either in providing input data or in defining what the model is needed for. The team members’ contributions will be detailed in the remaining articles of this series, starting with the May issue of the Reservoir.
One key element of reservoir modeling will be left aside at this time: geostatistics. Geostatistics provide a powerful set of mathematical tools to interpolate any type of properties, using diverse constraints. These
tools will be described in the third part of this series, published in the April issue of the Reservoir.
RESERVOIR STUDY = DATA AND KNOWLEDGE INTEGRATION
The goal of an exploration or development asset team is to characterize the dimension, the rock properties and the fluid distribution of the reservoir they are studying. This knowledge is a key factor for a company to decide what to do next with its asset. The company might push the exploration further or start its development. If the resource is determined to be uneconomical to produce the company might drop the area.
To define the dimension of the reservoir, the team must understand the geometry of the horizons and the faults (if any) delimiting the
play as well as the depth of the different fluid contacts (oil-water contact, gas-oil contact…). The rock properties of interest will be those controlling the amount of hydrocarbons in the reservoir (facies, porosity, fluid saturations…) as well as those controlling how the rock and the fluids will behave once engineers start production (permeability, geomechanical properties…).
Due to the underground depth of reservoirs they are difficult to describe. To characterize its asset, the team has to integrate all the possible data available. Well data will provide a lot of details near the wellbores (logs, core, cuttings, image logs, well testing…). Seismic data will complete this by giving a general image of the full reservoir, but with a limited level of resolution. The team’s knowledge about geological concepts (depositional environment, basin evolution…) and engineering concepts (fluid mechanics, geomechanics…) help to organize all of the different data so they can characterize the reservoir as best as possible.
Data and knowledge integration has been at the core of reservoir characterization long before reservoir modeling started to be developed in the 1980s.The concept is explained in domains such as geological mapping (Tearpock and Bischke, 2003) or geophysical interpretation (Lines and Newrick, 2004). Geomodeling didn’t “invent” data and knowledge integration, but it provides a new set of tools to push it beyond what was done previously.
PLACE OF RESERVOIR MODELING IN A RESERVOIR STUDY
Geomodeling is also called “reservoir modeling” or “static modeling”. This latest expression emphasizes the fact that geomodeling focuses on quantifying the current state (rocks + fluid distribution) of the reservoir. “Dynamic modeling”, run by engineers, focuses on how fluids (injected/ produced) will move and how the rocks will react during production. Dynamic modeling can be thought of as modeling the reservoir “through time”.
Research on reservoir modeling started in the late 1970s to the beginning of the 1980s and it has continued to grow ever since as computers became more popular, powerful and affordable. Reservoir modeling algorithms rely on visualization techniques that are also used in 3D computer games, 3D animated
30 RESERVOIR ISSUE 03 • MARCH 2015
Figure 1. Geomodeling workflow. Example of a clastic reservoir.
movies and CAD (Computer-Aided Design) tools that are used in the manufacturing industry to model goods (cars, buildings, planes, etc.). Reservoir modeling has one essential difference though: while other industries build their 3D models by drawing (movies, video games…) or through the application of mathematical equations (geometry of the wing of an airplane for example), geomodeling has to define the geometry of complex objects (horizons, geobodies) from a limited amount of data points (well tops, seismic interpretation…). Interpolation and extrapolation techniques are keys in this process (see the next article for more information on geostatistics).
The development of computers lead also to the development of complex 3D models in the domains of geophysics and flow simulation among others (Figure 2). These tools are very complementary to those found in reservoir modeling packages. Many studies first involve a stage of 3D seismic interpretation and seismic inversion, these results are used as input to the reservoir modeling workflow, which itself feeds complex flow simulation computations. The tools from those different domains are increasingly integrated. It began with the definition of standardized file formats to transfer data and results from one domain to the next. Nowadays, many software providers are linking, if not merging, their different proprietary solutions into a single platform to further facilitate the integration between the different disciplines.
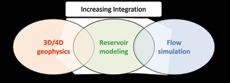
As mentioned in the introduction, the core of any reservoir modeling study is made of five steps, described in the remaining of this paper: gathering the data, structural and stratigraphic modeling, three-dimensional (3D) grid building, facies modeling and petrophysical modeling (Figure 1).
INPUT DATA
Every reservoir modeling project starts with defining the extent of the model and what data should be included. This task seems straightforward and yet many modeling projects do not meet their deadlines because this phase did not involve enough the whole team. Figure 3 gives an example of the type of problem any team might face.
A company’s lease covers three sections (Figure 3A and C, orange squares). Two horizontal wells are to be drilled soon (H1 and H2) and management asked for a flow
simulation model to be run around those future wells. To do so, the engineers ask their geologist to build a reservoir model around the two horizontal wells. Engineers need the model to be ready in one month.The geologist agrees on their deadline and gets started. Data is available on all of the vertical wells (blue triangles) and there is no seismic.The geologist decides to model the reservoir within the red polygon (Figure 3 A). Her choice is motivated by two things. Firstly, there is no need to include the whole lease as only the zone around the future horizontal wells is of interest. Secondly, the polygon includes the well W1, even if it is outside the company’s lease, to get a better control during the interpolation of the facies and the petrophysics on the North-West of the well H1. On the contrary, the vertical wells W2 and W3 located South of the lease are excluded. W2 is considered too far to be relevant while the South-East corner of the chosen polygon already contains a vertical well, making W3 redundant.
The reservoir modeling moves forward and the geologist delivers the model to the engineers on time. To her surprise, the engineers reject it: it does not include the horizontal well H3 located East of the lease. While not needed to model the rocks around H1 and H2, and so rightfully ignored for the geomodeling, this well is producing and to the engineers it was obvious that they needed this well in the model for their flow simulation. As it was obvious to them, they did not see the point at saying it aloud at the beginning of the project.
Our geologist goes back to her office, adjusts the extent of the geomodel as needed (Figure 3 C, green polygon) and she delivers an updated geomodel a month later, completely missing the engineers’ deadline.
Years of consulting has shown that this type of problem happens often: a misunderstanding in the scope of work is spotted only at the end of the project when the model is reviewed. It is then necessary to redo everything. The issue is a lack of communication in the team at the beginning of the project. In my example (Figure 3B), engineers did not spend time – or were not asked to spend time –in defining which data was needed. Had they been (Figure 3D), engineers would have had a chance to mention the well H3 and the misunderstanding would have been lifted before causing any damage.
horizons (stratigraphic modeling) and potential faults (structural modeling). If each surface is only defined by well tops, the interpolation will likely be poorly constrained and the model will be highly uncertain far from the wells. If those surfaces were also interpreted on seismic, the interpolation will respect both the well tops and the seismic interpretation making the result will be more reliable: not certain, but at least “less” uncertain.
Structural and stratigraphic modeling involves more than just interpolating data.The modeler must choose an interpolation technique that properly mimics the geological context of the reservoir. Figure 4 illustrates this – this simple reservoir will also be used in the next sections of this paper.
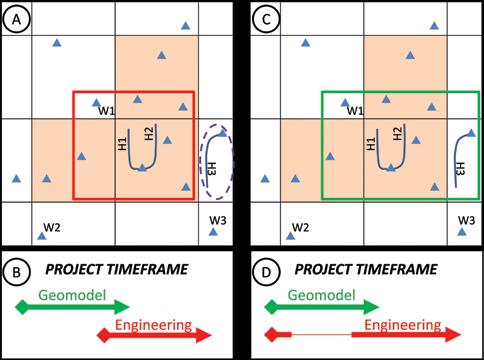 Figure 2. Integration between geophysics, geomodeling and engineering.cv.
RESERVOIR ISSUE 03 • MARCH 2015 31
Figure 3. Defining the lateral extent of a model A) based on reservoir modeling criteria only, or C) taking also into account engineers’ requests. Project timeframe: B) leading to the initial decision (A) and D) leading to the needed modeled area (C).
The reservoir is made of a single geological unit delimited by two horizons A and B. Three wells have been drilled and picked (W1, W2 and W3). W2 is not deep enough and it doesn’t reach the horizon B. The top horizon A is easily built by interpolating the TVDSS values of the three well picks. How shall the horizon B now be modeled?
Two mathematical approaches are possible. With approach 1, the TVDSS of the two well picks B are interpolated, in the same way the horizon A was modeled. With approach 2, the thickness of the unit is interpolated and then the TVDSS of the horizon B is defined as being equal to the TVDSS of horizon A minus the local thickness of the unit. As shown on Figure 4, the resulting geometry of the horizon B varies a lot depending on the technique being applied. Furthermore, the well picks alone (the data) can’t help us decide which approach should be used. Only a geologist could answer this. Based on his/her understanding of the geological context and on his/her work on the logs, the cores and the surrounding area, he/she might conclude that:
• Unit A was deposited above an unconformity (Unit B).The two horizons should be modeled separately (approach 1). Or…
• Unit A and Unit B are conformable one to the other.The two horizons should be modeled together (approach 2).
In case the data is inconclusive, then two models might be needed to capture this uncertainty: one is following the approach 1 and one following the approach 2.
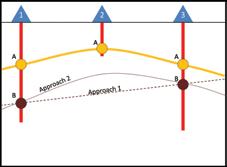
4. Stratigraphic modeling. How shall we model the horizon B based on the well picks? As illustrated with the modeling of the Teapot Dome (Figure 5), faults are also modeled as surfaces.
3D GRID BUILDING
Once the stratigraphic and the structural modeling is done, the 3D grid can be built. The 3D grid is representing the volume of rocks inside each geological unit. The 3D grid is divided into cells, each cell representing a small piece of the reservoir. Typically, a cell is between 25m*25m and 100m*100m horizontally and 0.1m to 1m vertically. Each cell will contain a specific value for the different properties (facies + petrophysics).
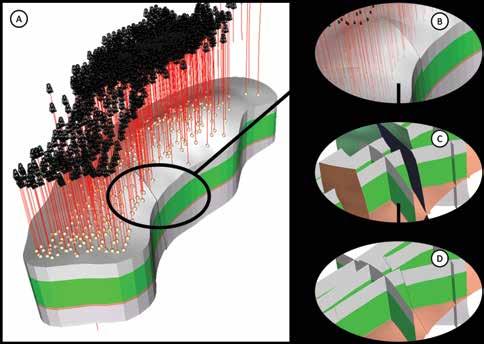
Defining the orientation of the mesh of the 3D grid is an essential step of the modeling process. Most interpolation techniques will tend to populate the properties following the main directions of the mesh. Figure 6 illustrates this point with the vertical layering of the 3D grid.
Based on his interpretation of the data, the geologist decides that horizon B is an unconformity. This leads the geomodeler to build the surface representing horizon B following the first approach (Figure 4).
Analysis of the core data shows that the reservoir is made of a massive fluvial sand channel surrounded by shale (Figure 6A). The sand is only visible on well 1. Regional data shows that it should extend further toward wells 2 and 3. How shall we interpolate the sand? If the vertical layering of the 3D grid is made horizontal (Figure 6B), the sand channel will be interpolated horizontally. If the vertical layering is made parallel to horizon B (Figure 6C), the sand channel will dip like horizon B does. If the vertical layering is made parallel to horizon A (Figure 6D), the channel will have a more complex, curved geometry.
The choice again lies in the hands of the geologist. Similarly to the problem of the construction of the horizons, the answer isn’t found in the data alone (the core data here). The geomodeler also needs the involvement of the geologist. In case the geologist has no way to be sure of which geometry should be built for the horizon building, the reservoir modeler might have to carry forward several models, one for each possible internal geometry of the 3D grid.
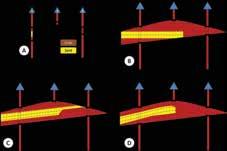
Over the last few years a new set of techniques, coupling the structural modeling, the stratigraphic modeling and the 3D grid building, have gained popularity. Such integrated techniques simplify and improve the construction of the structural model, which has always been difficult for complex fault networks. These techniques also allow the ability to align the mesh of the 3D grid to complex trends. For example, (Thenin and Larson, 2013) used these techniques to integrate the complex geometry of Inclined Heterolithic Strata (IHS) found in oil sand reservoirs into the mesh of the 3D grid. Such workflow can be extended to any reservoir in which seismic stratigraphy has been interpreted (Veeken and van Moerkerken, 2013).The details of the solutions implemented by the different software vendors are not yet all known. Implicit modeling seems to be at the core of at least some of those new tools. At this time, readers interested in the some of the mathematical details should refer to (Mallet, 2014) which has recently been published.
Figure
Figure 6. A simple reservoir (A). Three possible geometries for the vertical layers of the 3D grid (B, C, D).
32 RESERVOIR ISSUE 03 • MARCH 2015
Figure 5. Teapot Dome model. A) Global view of the structural and stratigraphic model. B) Zoom to the model. C) Focus on the fault network. D) Focus on sections of the resulted faulted 3D grid.
FACIES AND PETROPHYSICAL MODELING
Facies modeling and petrophysical modeling will be detailed in the April issue focusing on geostatistics.
Geostatistics allow the creation of multiple possible spatial distributions of the facies (and the petrophysics). Each respects the input data. It’s an efficient way to study the uncertainty associated to rock properties distributions. Figure 7 gives an example of two such spatial distributions given facies data at well locations along with information about the global facies proportions and the general orientation of the facies geobodies.
reflects the depositional space (Figure 6), the internal geometry of the 3D simulation grid is made to optimize fluid flow computations. Simulation grids (Figure 8) have often a “sugar box” mesh. The facies and petrophysical properties, populated in the 3D geological grid (Figure 8A), are transferred into the cells of the 3D simulation grid (Figure 8B) mostly with upscaling techniques.
Engineers sometimes ask why reservoir modelers don’t model directly the properties into the 3D simulation grid. Why do we need a specific grid for reservoir modeling? Comparing Figure 6A and Figure 8B illustrates why: there is no easy way of getting a dipping
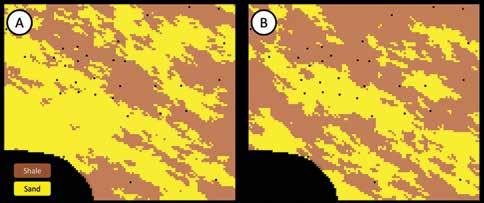
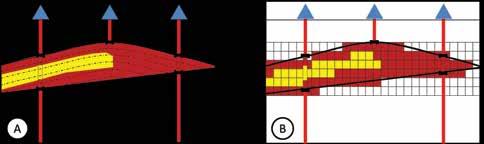
OUTPUT
A geomodel is built for multiple reasons. As such, the output provided back to the team can be varied.
The geomodel is a 3D visualization tool that helps the entire team see the different hypotheses made by them translated into 3D. Seeing the model in 3D sometimes leads to a revision of the interpretation, which leads to a revision of the model. The loop continues until the interpretation of the reservoir is validated by the team and the model properly captures what the team had in mind regarding the reservoir.
If the model is meant to feed a dynamic modeling study, the output will often be a 3D simulation grid. While the internal geometry of a 3D grid made for reservoir modeling
channel body if sugar grid geometry is used. Similarly, geologists sometimes ask why engineers can’t use the 3D geological grid for the flow simulation. Such complex grids would slow down the flow simulation and would create numerical instabilities. Engineers need a grid optimized for their needs too.
More details about the different outputs needed by engineers will be given in the three issues on engineering (reservoir engineering in September, reserves in October and production engineering in November).
CONCLUSION
Reservoir modeling did not invent data and knowledge integration, but it can be seen as one of its modern implementations. As illustrated in this paper, and further investigated in the next issues, a reservoir
model cannot be good if the modeler does not collaborate with his/her team.
Uncertainty management is the second important notion. With limited data available, a lot of unknowns remain about our reservoirs. Reservoir modeling is tailored to capture those uncertainties. Uncertainty will be also discussed in each remaining paper of this series.
Before the contribution of each team member is further investigated, the next issue will focus on geostatistics, an essential set of techniques for every reservoir modeler.
TO GO BEYOND…
We highly recommend (Ringrose and Bentley, 2015) which was published a few weeks ago. It gives an excellent overview of the reservoir modeling workflow, without being heavy on the mathematics.
ACKNOWLEDGMENTS
The authors would like to thank the RMOTC and the U.S. Department of Energy for providing access to the Teapot Dome dataset (www.rmotc.doe.gov/datasets.html).
REFERENCES
Lines, L.R. and Newrick R.T., 2004. Fundamentals of Geophysical Interpretation. SEG, Geophysical monograph series number 13. 274 pages.
Mallet J.-L., 2014. Elements of Mathematical Sedimentary Geology: the GeoChron Model. EAGE. 374 pages.
Ringrose, P. and Bentley, M., 2015. Reservoir Model Design – a Practitioner’s Guide. Springer. 260 pages.
Tearpock D. J. and Bischke R.E., 2003. Applied Subsurface Geological Mapping. 2nd edition. Prentice Hall. 822 pages.
Thenin D. and Larson, R., 2013. Quantitative seismic interpretation – an earth modeling perspective. CSEG Recorder. Vol. 38, Number 9, Nov 2013. Pages 30-35.
Veeken, P.C.H. and van Moerkerken, B., 2013. Seismic Stratigraphy and Depositional Facies Models. EAGE. 494 pages.
TO CONTACT THE AUTHORS
Feel free to contact us if you have questions about this paper or about the series.
Thomas Jerome Thomas.Jerome@rpsgroup.com
Jun Yang Jun.Yang@rpsgroup.com
Suzanne Gentile, Suzanne.Gentile@rpsgroup.com
Figure 7. Two possible distributions of the sand and shale between wells (black dots)..
RESERVOIR ISSUE 03 • MARCH 2015 33
Figure 8. Upscalling a facies model from the 3D grid made for the reservoir modeling (A) into the 3D grid optimized for flow simulation (B).
2 km P 2 km P
2 km
Highline Trail. After a short gain in elevation the trail re-emerges in the Emerald Valley. To your left are “the Eldon Cliffs” which show rhythmic bedding, cleavage and fracturing. Far above these cliffs the Eldon Formation is repeated again in the hanging wall of the Wapta Thrust.
Centre Right: View of Wapta Mountain from Wapta Highline Trail. From here begin picking your way up to the base of the cliffs. Note the contrast between the brown dolomite and black limestone and the expansion of the dolomite upwards. Bottom: View of Emerald Valley from Wapta Highline Trail. Note Emerald Basin, Emerald Alluvial Fan and Emerald Lake.

From Hwy 1 in Yoho National Park drive 1.6 km south of Field and turn west on the Emerald Lake Road. Drive 9 km to Emerald Lake parking lot. Proceed clockwise around the lake. At the North end of the lake there are two trail junctions. At the second junction (1.75km) proceed northeast towards Yoho Lake and Pass. As you leave the lake the trail gently ascends the Emerald Alluvial fan. The trail meets the Wapta Highline trail at 6km. Turn a sharp right towards Burgess Pass. At about the 8km mark (about 15 minutes after a brief switchback) look to the left and pick a rough scrambling route up to the base of the Wapta Mountain cliffs. Snow lingers late so consider doing this hike between mid July and
20 km for entire trail, or just 5.4 km if you circle the lake only. The trail around lake is well maintained, the leg to Wapta Mountain is rough and long. On hot days bring plenty of water. Beware of storms approaching from the west. Elevation Gain: 1100m to base of Wapta Mountain, but negligible around lake.
See the Emerald Basin hike for a description of Emerald Lake.The sediments of the Emerald Alluvial Fan are sourced from glacial debris and rock flows in Emerald Basin. The sediments are carried through a slot canyon and emerge at the top of the Alluvial Fan. During late June and early July the creeks that you cross may be raging torrents filled with sediment. You may find the creeks impassible and the trail closed. The trail has been elevated and simple bridges placed over the creeks. However, alluvial fans are notoriously fickle as the route the
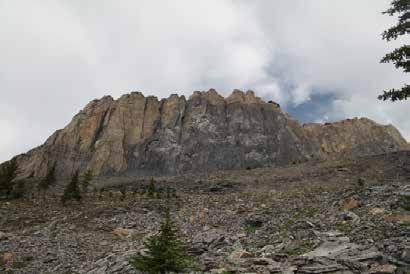
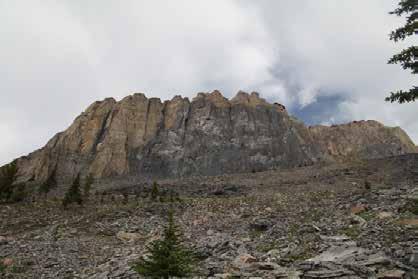
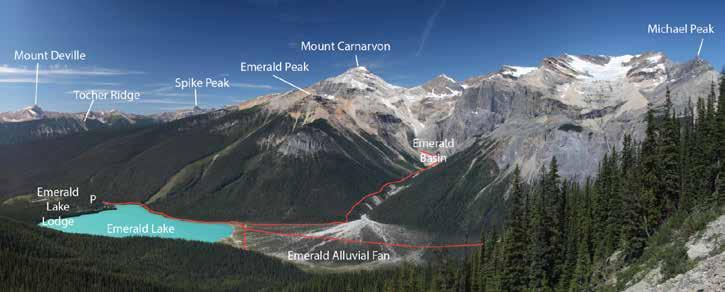

P
34 RESERVOIR ISSUE 03 • MARCH 2015
Wapta Mountain
Eldon Cliffs
Mount Wapta
Eldon Cliffs
Eldon Cliffs
Eldon Cliffs
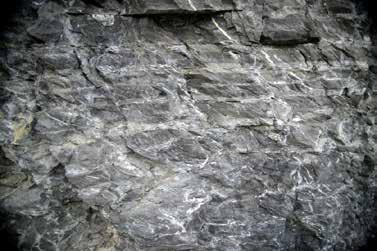
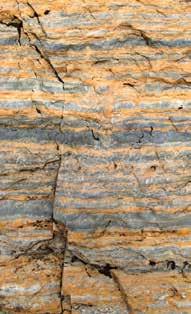
Mount Wapta
Mount Wapta
Top Left: The view of Cambrian Eldon Formation carbonates at the “Eldon Cliffs”. Rhythmic beds are cut obliquely by calcite filled fractures and cleavage. Top Right: Vertically oriented dolomite “pipes” or “cones” (brown) cut through the lower portion of the Eldon Formation limestone (grey); upward, dolomite spreads out and becomes stratiform. This dolomite pipe is visible immediately above Walcott’s Quarry – roughly perpendicular to view from Emerald Lake. Geochemical analysis of the dolomites suggest they formed at temperatures in excess of 100ºC (Spencer, 2006). Centre Left; Ribbon bedding; alternating layers of grey lime mudstone and orange argillite.
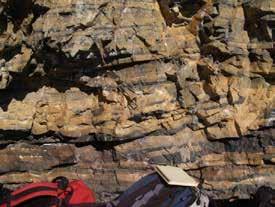
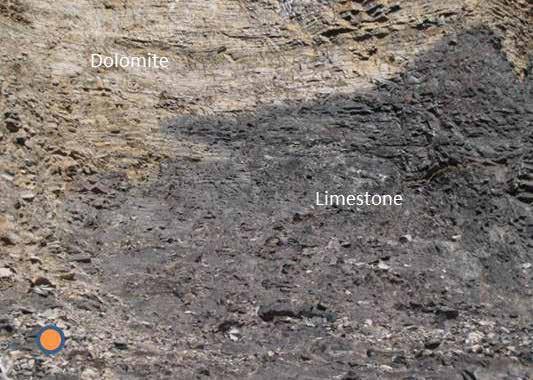
Centre: view is upwards, beneath an overhang at core of dolomite pipe; relatively thin (a few cm) vertical fractures (indicated by arrows) filled with sparry dolomite appear to have fed the dolomitizing fluids upward. The intensity of dolomitization is bed dependant with some beds dolomitized and others not (Centre right), but generally decreases away from these fractures. Distinct beds such as the conglomerate (lower left) can be followed laterally to see the change in dolomite (and chert) intensity in a given bed. The dolomite feathers out into the limestone at the edge (lower right).
References
• Balkwill, H.R., Price, R.A., Cook, D.G., and Mountjoy, E.W.,1980. GSC Map 1496A; Golden, East Half.
• Price, R.A., Cook, D.G., Aitken, J.D., and Mountjoy, E.W.,1980. GSC Map 1483A; Lake Louise West Half.
• Spencer, R., 2006. Constraints on the Origin of dolomite in the Middle Cambrian Eldon Formation at Mt. Wapta from Fluid Inclusion and Stable Isotope Data. CSPGCSEG-CWLS Convention abstract.
RESERVOIR ISSUE 03 • MARCH 2015 35
GeoConvention 2015


GeoConvention is a geoscience-focused annual convention with over 4000 delegates, 100 exhibitors, 300 technical talks, networking events and the Core Conference. The theme this year is Geoscience: New Horizons. Please join us as an exhibitor, sponsor or attendee to learn from, and network with a premier community of geoscientists.


GeoConvention 2015 is taking place May 4-8, 2015. Our technical program and exhibition floor are at the Telus Convention Centre from May 4-6 with the Core Conference being held May 7-8 at the Core Research Centre.
Our technical chairs have assembled a strong technical program based on our theme Geoscience: New Horizons. With posters and oral presentations discussing the latest technology, business trends and financial impacts of the market, GeoConvention is tremendous opportunity to learn what is new and important in the industry while networking with exiting colleagues and new ones to exchange ideas and experiences.
Sponsorship and Advertising opportunities are availablecontact Elwin Reichert at sponsorship@geoconvention.com to ensure that you get the sponsorship opportunity you want.
As well, our exhibit floor is nearly full - contact Vic Urban at exhibits@geoconvention.com to reserve your spot!
Monday Lunch: Dr. Scott Tinker
Tuesday Lunch: Alex Epstein
Wednesday Lunch: Jay Ingram
www.geoconvention.com/registration
Mark your calendar! www.geoconvention.com
REGISTRATION NOW OPEN Early Registration Ends March 31st! 36 RESERVOIR ISSUE 03 • MARCH 2015


Thursday, February 5, 2015 TELUS Convention Centre Exhibition Hall D, North Building Calgary, Alberta
Please note: The cut-off date for ticket sales is 1:00 pm, three business days before event. (Monday, Feb. 2nd, 2015). CSPG Member Ticket Price: $45.00 + GST. Non-Member Ticket Price: $47.50 + GST.
Each CSPG Technical Luncheon is 1 APEGA PDH credit. Tickets may be purchased online at https://www.cspg.org/eSeries/source/Events/ index.cfm.
better understand geomechanical approach is then considered various petroleum related include:
• predicting permeable fractures;
• discriminating natural fractures drilling induced fractures; hydraulic fracture placement containment, and;

• explaining variable fracture

• Domestic and International wellsite supervision
• Conventional and Unconventional wells
• Extensive Hz experience
• Customized corporate solutions available (403) 250-3982 sales@clconsultants.ca

www.clconsultants.ca


elizabeth macey, B.A., cartographer . . 403 993 0055 emacey@telus.net www3.telus.net/elizabethmacey .
presentations posters graphics .
Rock Shop
.
maps technical illustrations
1602 – 5th St N.E. Calgary, AB. T2E 7W3 Phone: 403-233-7729 www.tihconsulting.com e-mail: tih@shaw.ca T.I.H. Consulting Ltd. Geologic Well-Site
Supervision
CORPORATE SUPPORTERS
Enviro-Tech Surveys Ltd
CL Consultants
Exova Canada Inc
Pulse Seismic Inc
Canada Brokerlink Inc.
Energy Navigator
Golder Associates
Nalcor Energy
Paramount Resources
Belloy Petroleum Consulting
EDGE Technologies
Compass Directional Services
EV Cam Canada Inc.
Sigma Explorations
Canacol Energy Ltd.
Earth Signal Processing Ltd
Explor
Japan Canada Oil Sands Ltd.
McDaniel & Associates Consultants Ltd.
Sproule International Limited
Target Data Ltd.
Petrocraft Products Ltd.
RIGSAT Communications
Spectrum
Birchcliff Energy Ltd.
Cabra Enterprises Ltd.
Cougar Consultants, Inc.
SAExploration
Serpa Petroleum Consulting Ltd.
National Oilwell Varco
Signature Seismic Processing Inc.
Sensor Geophysical Ltd.
Cossack Land Services Ltd.
Deloitte Petroleum Services Group
EPI Group
FMQ Southern Exploration
GeoChemTech Inc.
Geotir
Hurry Hydrocarbons
NExT- A Schlumberger Company
Petrel Robertson Consulting Ltd.
Roke Technologies Ltd.
Mcleay Geological Consultants Ltd.
HEF Petrophysical Consulting Inc.
Caracal Energy Inc.
Regent Resources
Bankers Petroleum Ltd.
BJV Exploration Partnership
SOCO International
3e Royalties
Bengal Energy
Bounty Developments Ltd.
Brasoil Corp.
Bukit Energy
Central European Petroleum Ltd
DualEx Energy International
Franconia Geoscience
Gran Tierra Energy Inc.
International Petroleum Consulting
Jenner Geoconsulting Inc.
Korean National Oil Company
Long Reach Resources Ltd.
Lorne LeClerc & Associates
Madison Petrogas Ltd.
Petroamerica
Serinus Energy
Sherritt International Corporation
Skyhawk Exploration
Tretio Exploration Ltd.
Valeura Energy
AS OF JANUARY 31, 2015
CSPG University Outreach 2014 Fall Lecture Tour

In late October and early November 2014, Dr. Tom Moslow toured five Universities in Western Canada in conjunction with the CSPG University Outreach Program. Dr. Moslow, President of Moslow Geoscience Consulting and Adjunct Professor in the Department of Geosciences at the University of Calgary, was hosted by the geoscience departments at the University of Regina, University of Saskatchewan, University of Calgary, University of Alberta and Simon Fraser University. A generous number of undergraduate students, graduate students and faculty all attended his lecture – Reservoir Geology of the Montney Formation, NEBC: A World Class Hydrocarbon Resource Play. Not only were the attendees exposed to Dr. Moslow’s extensive expertise on the subject, they were further acquainted with one of Canada’s pre-eminent hydrocarbon plays and its economic impact on Canada’s present and future. The technical presentation was designed to offer students aspiring to work in the Oil and Gas Industry with the opportunity to appreciate the application of geoscience on a multidisciplinary level to the attainment of economic success within an industry setting. The Outreach Lecture Tour also provided the opportunity for geoscience students to learn about the numerous benefits and privileges of membership in the CSPG.
A successful University Lecture Tour – with many thanks to Dr. Tom Moslow for the benevolent gift of his time and instruction!

University Outreach Corner
Upcoming Events
Student Event Grant Award Deadline
March 6
AESRC, Queen’s University
March 27 - 29
GeoConvention (Visit the University Outreach booth!)
May 4 - 8
Andrew Baillie Awards (Best student poster and oral presentations) @ GeoConvention
May 4 - 8
University Pub Night
May 6
Summer Student Field Trip
July (TBA)
Graduate Thesis Award Deadline September 15
Remember CSPG Student Membership is FREE!
www.cspg.org (click on Students tab)
Dr. Tom Moslow, Lecture Tour Speaker
38 RESERVOIR ISSUE 03 • MARCH 2015
Welcome to your Professional Career Home

Go where the passionate geoscientists are
Discuss the science
Socialize within a like -minded community
Grow your specialty by attending our conferences
Engage in qualified professional development (PDH accredited)
Meet industry
Volunteer and be on a team
Develop leadership skills
Get introduced to geoscience software tools
Access to technical journals on AAPGDatapages and GeoScienceWorld
Leave your legacy where you are most passionate
Join us and be part of the team that advances the professions of the energy geosciences – as it applies to geology

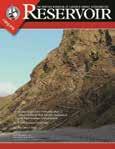


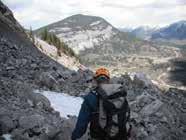
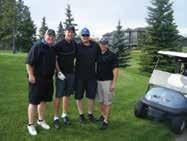

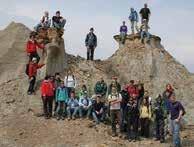

Distinguished Lecturer Series Go Take a Hike Mixed Golf Tournament Student Industry Field Trip
Membership has its Advantages!
JOIN TODAY VISIT WWW.CSPG.ORG TO BECOME A MEMBER TODAY RESERVOIR ISSUE 03 • MARCH 2015 39

April 23–24, 2015 Register before April 15 at www.apegasummit.ca ANNUAL Ge N e RAL Meeti NG AN d Co N fe R e NC e Calgary TELUS Convention Centre Info: 780-426-3990 | 800-661-7020 | #apegasummit
