
17 Drilling Plan Basics – Building a Landing Section with Deep EM LWD 21 The Value of Borehole Image Logs – Part 2: Analysis of Structure and Fractures in Image Logs 29 Go Take a Hike 32 Geomodeling: A Team Effort to Better Understand Our Reservoirs $10.00 FEBRUARY 2015 VOLUME 42, ISSUE 02 Canadian Publication Mail Contract – 40070050

CSPG OFFICE
#110, 333 – 5th Avenue SW
Calgary, Alberta, Canada T2P 3B6
Tel: 403-264-5610
Web: www.cspg.org
Please visit our website for all tickets sales and event/course registrations
Office hours: Monday to Friday, 8:00am to 4:30pm
The CSPG Office is Closed the 1st and 3rd Friday of every month.
OFFICE CONTACTS
Membership Inquiries
Tel: 403-264-5610
Email: membership@cspg.org
Technical/Educational Events: Biljana Popovic
Tel: 403-513-1225 Email: biljana.popovic@cspg.org
Advertising Inquiries: Emma MacPherson
Tel: 403-513-1230 Email: emma.macpherson@cspg.org
Sponsorship Opportunities: Candace Seepersad
Tel: 403-513-1227 Email: candace.seepersad@cspg.org
Conference Inquiries: Candace Seepersad
Tel: 403-513-1233 Email: candace.seepersad@cspg.org
CSPG Educational Trust Fund: Kasandra Amaro
Tel: 403-513-1234 Email: kasandra.amaro@cspg.org
Accounting Inquiries: Eric Tang
Tel: 403-513-1232 Email: eric.tang@cspg.org
Executive Director: Lis Bjeld
Tel: 403-513-1235, Email: lis.bjeld@cspg.org
EDITORS/AUTHORS
Please submit RESERVOIR articles to the CSPG office. Submission deadline is the 23rd day of the month, two months prior to issue date. (e.g., January 23 for the March issue).
To publish an article, the CSPG requires digital copies of the document. Text should be in Microsoft Word format and illustrations should be in TIFF format at 300 dpi., at final size.
Technical Editor
Hugh S. Mosher
Nunaga Resources Ltd.
M.: 403-809-9997
Email: hsmosher@telus.net
CSPG Coordinating Editor
Emma MacPherson, Communications Coordinator, CSPG
Tel: 403-513-1230, emma.macpherson@cspg.org
The RESERVOIR is published 11 times per year by the Canadian Society of Petroleum Geologists. This includes a combined issue for the months of July and August. The purpose of the RESERVOIR is to publicize the Society’s many activities and to promote the geosciences. We look for both technical and non-technical material to publish. The contents of this publication may not be reproduced either in part or in full without the consent of the publisher. Additional copies of the RESERVOIR are available at the CSPG office. No official endorsement or sponsorship by the CSPG is implied for any advertisement, insert, or article that appears in the Reservoir unless otherwise noted. All submitted materials are reviewed by the editor. We reserve the right to edit all submissions, including letters to the Editor. Submissions must include your name, address, and membership number (if applicable). The material contained in this publication is intended for informational use only. While reasonable care has been taken, authors and the CSPG make no
or
RESERVOIR ISSUE 02 • FEBRUARY 2015 3 FEBRUARY 2015 – VOLUME 42, ISSUE 02
liability for the acts, omissions, or conduct of any third-party user of information contained in this publication.
no circumstances shall the CSPG
its officers, directors, employees, and agents be liable for any injury, loss, damage, or expense arising in any manner whatsoever from the acts, omissions, or conduct of any third-party user. Designed and Printed by The Data Group of Companies, Calgary, Alberta. ARTICLES Drilling Plan Basics – Building a Landing Section with Deep EM LWD 17 Photo of the Month ...................................................................................................................... 20 The Value of Borehole Image Logs – Part 2: Analysis of Structure and Fractures in Image Logs 21 Honorary Member – James D. (Jim) Reimer, P.Geol. ......................................................... 26 Go Take a Hike 29 Geomodeling: A Team Effort to Better Understand Our Reservoirs ......................... 32 The 5th Annual – Young Geoscientists .................................................................................. 34 DEPARTMENTS Message from the Board 5 Technical Luncheons ................................................................................................................. 9 Division Talks 12 Rock Shop 9, 16
stratigraphy and diagenisis
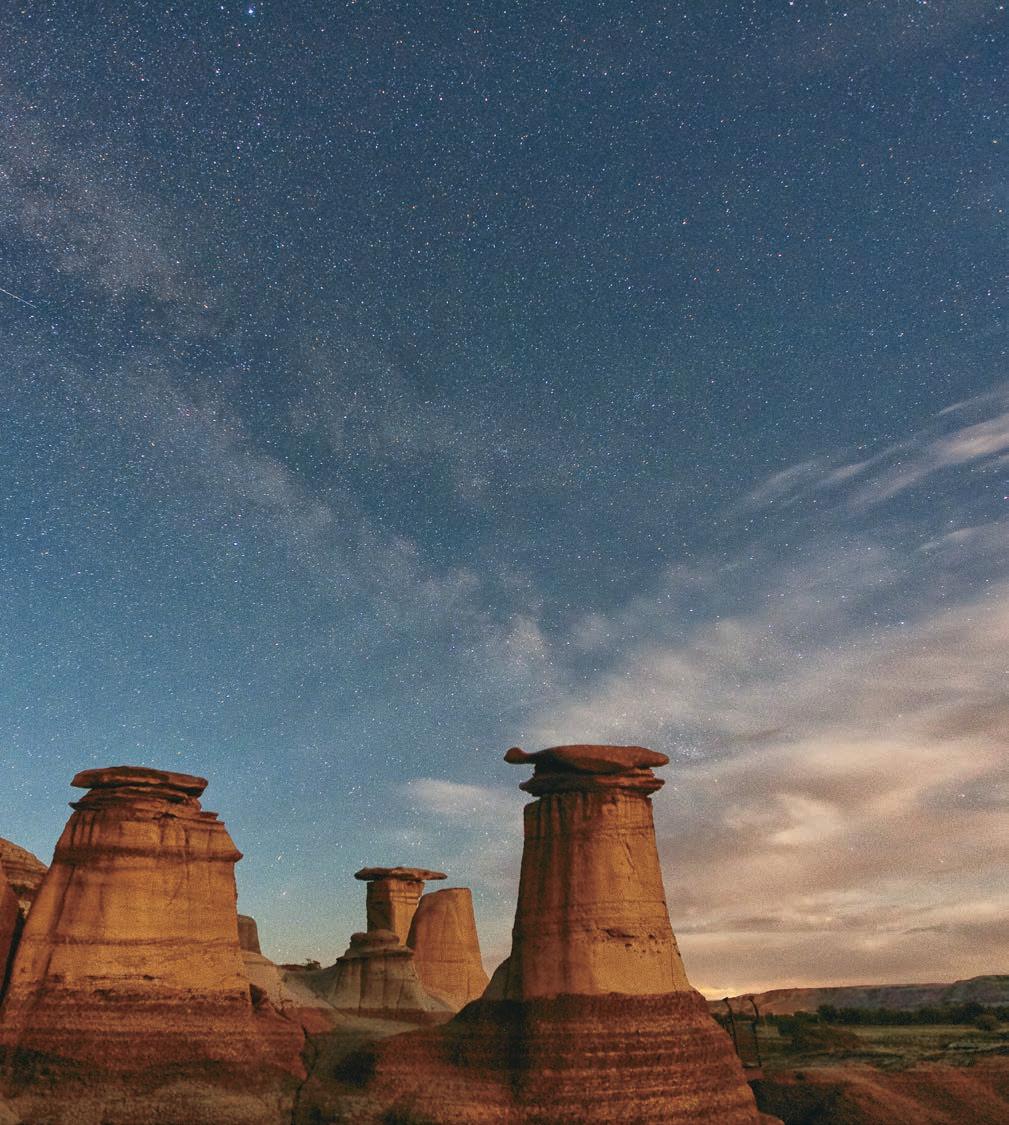
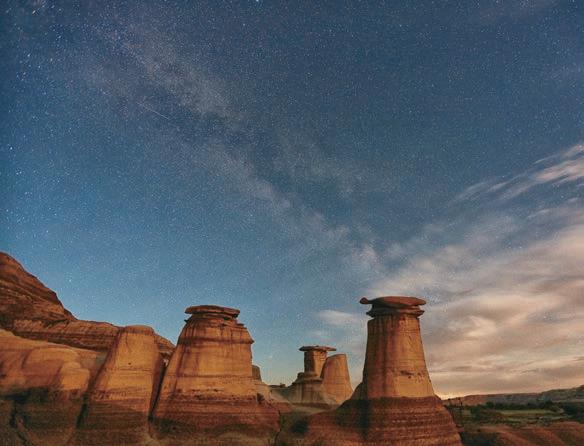
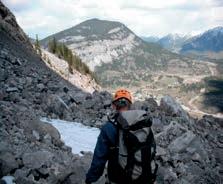
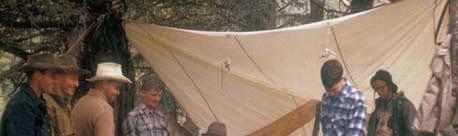
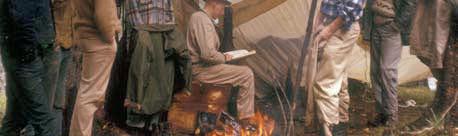
The structures are formed by a clean siderite cemented Cretaceous Horseshoe Canyon sandstone capping layer providing a roof over the softer non cemented sands and mudstones. Natural fractures provide the start of the caprock erosion as the Red Deer river cuts through the valley. Photo by John P. Andersen.
guarantees that any of the equations, schematics,
devices discussed will perform as expected or that they will give the desired results. Some information contained herein may be inaccurate or may vary from standard measurements. The CSPG expressly disclaims any and all
Under
and
FRONT COVER The famous Hoodoos near East Coulee Alberta. A classic case where
meets erosion.


CSPG BOARD
PRESIDENT
Tony Cadrin • Journey Energy Inc. president@cspg.org Tel: 403.303.3493
PRESIDENT ELECT
Greg Lynch • Shell Canada Ltd. presidentelect@cspg.org Tel: 403.384.7704
PAST PRESIDENT
Dale Leckie pastpresident@cspg.org
FINANCE DIRECTOR
Astrid Arts • Cenovus Energy directorfinance@cspg.org Tel: 403.766.5862
FINANCE DIRECTOR ELECT
Scott Leroux • Long Run Exploration directorfinanceelect@cspg.org 403.716.3205
DIRECTOR
Mark Caplan • Athabasca Oil Corp. mcaplan@atha.com Tel: 403.975.7701
DIRECTOR
Milovan Fustic • Statoil Canada Ltd. publications@cspg.org Tel: 403.724.3307
DIRECTOR
Michael LaBerge • Channel Energy Inc. Memberservices@cspg.org Tel: 403.301.3739
DIRECTOR
Ryan Lemiski • Nexen Energy ULC youngprofessionals@cspg.org Tel: 403.699.4413
DIRECTOR
Robert Mummery • Almandine Resources Inc. affiliates@cspg.org Tel: 403.651.4917
DIRECTOR
Darren Roblin • Kelt Exploration corprelations@cspg.org Tel: 587.233.0784
DIRECTOR
Jen Russel-Houston • Osum Oil Sands Corp. jrussel-houston@osumcorp.com Tel: 403.270.4768
DIRECTOR
Eric Street • Jupiter Resources estreet@jupiterresources.com Tel: 587.747.2631
EXECUTIVE DIRECTOR
Lis Bjeld • CSPG lis.bjeld@cspg.org Tel: 403.513.1235
Message from the Board
A message from 2015 President, Tony Cadrin

Happy New Year CSPG Members
What will 2015 bring the petroleum sector and the Canadian Society of Petroleum Geologists members? This is an impactful question on everyone’s mind with no shortage of pundits willing to give their opinions. As President of the CSPG, and an employee of the petroleum sector, I am not going to wade in with my predictions for the future. The members of the CSPG executive committee are more interested with the germane question of what services do we need to provide to our members for them to make the most of their careers during this time of uncertainty.
Our committee feels that the theme for how our members manage this coming year is through an attitude of PERSPECTIVE. Looking to the past for answers is a long, time honored tradition in our field made famous by James Hutton, the father of geology and Charles Lyell through his Principles of Geology in the 1830’s. His principle of Uniformitarianism states: the Present is the key to the Past in understanding that Geological processes have been shaping our earth since the beginning. Another way put: The past is the key to the present and the saviour of the future.
The petroleum sector has gone through many commodity cycles in the past, will continue to in the future, and to be certain, we are experiencing one now. Since the CSPG has been in existence (1927), it has survived 6 such cycles to date. Our society currently has 3,332 Full, Associate, Emeritus, Honourary, and Student members ranging from 18-95 years old. As a society, we have a wealth of knowledge regarding technical, career development, and past sector cycles available to pass on within our membership. This collective knowledge is our strength that will guide us through this, and future cycles.
The 2015 Board of Directors is committed to delivering services to our membership
that are valuable regardless of where you are in your career. The CSPG services and programs are a reflection of the society’s goals and vision which is “to advance the professions of the energy geosciences – as it applies to geology; foster the scientific, technical learning and professional development of its members; and promote the awareness of the profession to industry and the public”.
To accomplish this we provide and promote a wide range of technical learning events as well as a focal point for networking and social activities. This year our three initiatives are:
1. Strengthen our partnerships through participation in the annual GeoConvention. This started two years ago with the signing of the GeoConvention partnership with our affiliate societies, CSEG and CWLS, as well as with guest organizations. We continue to build this annual event into the pre-eminent geoscience meeting in North America. Our goal is to provide a learning and networking experience for the benefit of our members.
2. Enhance outreach to industry, government, and academia through our newly expanded Ambassador program via representatives who will deliver our message across Canada. This initiative will expand our national presence across Canada, and encourage younger members from vibrant centers across the country to join. This endeavor will strengthen the broader Canadian geologic community. It is imperative that we outline the benefits of being a CSPG member. We anticipate that this program will inspire or renew interest amongst existing CSPG members outside of Calgary, government institutions, university faculty, and students from undergraduate and
(Continued on page 7...)
RESERVOIR ISSUE 02 • FEBRUARY 2015 5

Welcome to your Professional Career Home
Membership has its Advantages!
Go where the passionate geoscientists are
Discuss the science
Socialize within a like -minded community
Grow your specialty by attending our conferences
Engage in qualified professional development (PDH accredited)
Meet industry
Volunteer and be on a team
Develop leadership skills
Get introduced to geoscience software tools
Access to technical journals on AAPGDatapages and GeoScienceWorld
Leave your legacy where you are most passionate
Join us and be part of the team that advances the professions of the energy geosciences – as it applies to geology


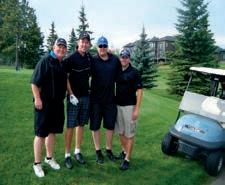


Distinguished Lecturer Series Go Take a Hike Mixed Golf Tournament Student Industry Field Trip
JOIN TODAY VISIT WWW.CSPG.ORG TO BECOME A MEMBER TODAY
CORPORATE
SPONSORS
SAMARIUM
geoLOGIC systems ltd.
DIAMOND
AGAT Laboratories
The CSPG Educational Trust Fund
TITANIUM
Tourmaline Oil Corp.
ConocoPhillips Canada Limited
APEGA
Nexen ULC
Cenovus Energy
Imperial Oil Resources
PLATINUM
Devon Canada Corporation
Schlumberger Canada Limited
IHS Global Canada Limited
Baker Hughes Shell Canada Limited
GOLD
Canadian Natural Resources Ltd
MEG Energy Corp.
Suncor Energy
Seitel Canada Ltd.
Husky Energy Inc.
SILVER
Chinook Consulting
MJ Systems
Cabra Consulting Inc.
CSEG
Arcis Seismic Solutions
Emerson Process Management
Enerplus
EOG Resources Canada Inc.
BRONZE
SeisWare
Halliburton
Osum Oil Sands Corp.
AAPG - Canada region
Pro Geo Consultants
Qatar Shell GTL Limited
Roke Technologies Ltd.
Ikon Science Ltd.
Pengrowth Corporation
Crescent Point Energy Trust
Geovariances
Paradigm
Talisman Energy
Geomodeling Technology Corp.
Canadian Discovery Ltd.
Painted Pony Petroleum Ltd.
RPS Energy Canada Ltd.
Encana Corporation
GLJ Petroleum Consultants Ltd.
Sproule Associates Limited
Streamsim Technologies, Inc.
Tucker Energy Services Canada
As of January 7, 2015
A Special Thanks to Geologic Systems Ltd., CSPG ’s Top
Sponsor of the Month.
(...Continued from page 5)
graduate programs. To accomplish this goal we have recruited Ian Hutcheon - Pacific Region; Brad Hayes and Ian McIlreath - Prairies; Darren Singleton - Northern Ontario and Ottawa region; and Colin Yeo - Southern Ontario. Dale Leckie is confirmed as an Ambassador at large. The candidates for the Atlantic and Quebec regions are yet to be filled. We also have two new CSPG members, Ryan Brenner and Katherine Romansky who are assisting Ian McIlreath (Chairman) and Colin Yeo (Vice Chairman) on the Ambassador Program Committee.
3. Develop mentorship platforms utilizing the wisdom of the past presidents of the CSPG. This is a defining initiative for providing PERSPECTIVE to the CSPG members. I would like to take the time to honor the contributions of the Past Presidents, who continue to contribute in meaningful ways, to the CSPG. In order, from most recent is:
• Dale Leckie: Ambassador at large
• Paul MaKay: Board member on CSPG Educational Trust Fund and standing for CSPG Chair of ACE 2016
• Kirk Osadetz: Board member on CSPG Educational Trust Fund
• John Varsek: Past Presidents advisory council
• Graham Bloy: Hunter Award Committee
• Colin Yeo: Ambassador Vice Chair and active Ambassador, CSPG Awards review Task Force
• John Hogg: (AAPG President 201516)-Past Presidents advisory council
• Brad Hayes: Ambassador
• Ian Hutcheon: Ambassador
• Ed Klovan: Bob McCrossan/Perry Glaister (Original Editors of the first Atlas of the Western Canada Sedimentary Basin, 1964) Presidents Special Award Committee
• Ian McIlreath: Medal of Merit, Hunter, and Douglas medal award committees, Awards review Task Force Chair, Ambassador Chair and Ambassador
• Gordon Williams: Awards review Task Force (young members assisting David Chunn and Denise Yee)
As you can see we are well underway into our 2015 initiatives.
In conclusion I would like to leave you with our over-arching goal. We want you to feel that the CSPG is your source for continuing education, networking, and career development. We are near the bottom of another petroleum sector commodity cycle and we want you to be prepared for the next wave up. Now is the time to prepare you for the next growth phase. Ask yourself, what can the CSPG do for you and what can you do for the CSPG?
I personally have volunteered for the CSPG in many capacities over the past 23 years. My history of volunteerism expands involvement as a committee member; committee chair; CSPG Board, as a director; Chair of GeoConvention Partnership; Present-Elect; and now as 2015 CSPG President. Some of the highlights for me over the past years include; the formation of the GeoConvention Limited partnership and serving on the first Board; fulfilling the role as the first CSPG Ambassador in our initial foray to the Atlantic Universities, Petroleum companies, and Government bodies.; and as President Elect participating in our initial young professionals networking events.
Over the next year I look forward to hearing your ideas and stories of how this community has made a difference in your career. Volunteer and help build a stronger society for your peer group and the one coming after you. As an active member, CSPG is one of your best career development resources! Plan to attend our upcoming conferences: Playmaker Forum (March 31st), GeoConvention 2015- GEOSCIENCE: New Horizons (May 4-6th), and the Eric Mountjoy Carbonates Conference (August 23-28th) to hear and see the top minds in the Canadian Petroleum sector give talks, posters, field trips, and courses on topics that matter to you right here in Calgary.
Please join us, your 2015 executive, in making our society better for you and the membership as a whole.
RESERVOIR ISSUE 02 • FEBRUARY 2015 7
Sessions & Session Chairs
The Nature of Unconventional Carbonate Reservoirs
Jay Gregg & Mike Grammer | Oklahoma State University
Carbonate Reservoirs in Structurally Complex Regions
Rudy Swennen | Division of Geology, KU Leuven
The Nature of Intensely Fractured, Vuggy Carbonates
Ron Nelson | Broken N Consulting, Texas
Alex J. MacNeil | Osum Oil Sands, Calgary
Advances in Modeling Carbonate Systems and Reservoirs
Part 1, Methods:
Georg Warrlich | Shell , Malaysia
Rachel Wood | School of Geosciences, University of Edinburgh
Part 2, Flow in Carbonates:
Xiomara Marquez | Maersk, Doha, Qatar
Fiona Whitaker | School of Earth Sciences, University of Bristol
Advances in Diagenesis
Eva Drivet | Drivet Consulting, Calgary
Conxita Taberner | Shell, Netherlands
Dolostones – The Nature of Dolostones in the Geologic Record
Hans Machel | University of Alberta, Edmonton
Jeff Lonnee | Shell, Qatar
Deadline for Abstracts: Deadline for Abstracts: March 15th, 2015 March 15th, 2015 Conference Sponsors:


2015 CSPG/SEPM Mountjoy Conference 2015 CSPG/SEPM Mountjoy Conference ABSTRACT SUBMISSION NOW OPEN ABSTRACT SUBMISSION NOW OPEN For more information visit: For more information visit: www.cspg.org/Conferences www.cspg.org/Conferences
TECHNICAL LUNCHEONS FEBRUARY LUNCHEON
Geomechanical Controls on Fault and Fracture
Distribution with Application to Structural Permeability and Hydraulic Stimulation
SPEAKER
Scott Mildren Ikon GeoMechanics
11:30 am
Thursday, February 5, 2015
TELUS Convention Centre Exhibition Hall D, North Building Calgary, Alberta
Please note: The cut-off date for ticket sales is 1:00 pm, three business days before event. (Monday, Feb. 2nd, 2015). CSPG Member Ticket Price: $45.00 + GST. Non-Member Ticket Price: $47.50 + GST.
Each CSPG Technical Luncheon is 1 APEGA PDH credit. Tickets may be purchased online at https://www.cspg.org/eSeries/source/Events/ index.cfm.
Abstract
Fracture and fault observations at different scales reveal dramatic changes in density and orientation over small relative distances. This variation has previously been explained by variable rock properties or variation in the applied stress. The poroelastic strain relationship describes the coupling of the elastic properties with the way stresses are distributed and when this is combined with an understanding of the material strength we can also better predict failure which manifests itself as the creation of structural elements (faults and fractures).
When considering permeability of fractures or placement of hydraulic fractures to stimulate production, we are effectively evaluating failure of the medium. This presentation looks at the relationship between elastic properties, rock strength and stress distribution with the aid of real world examples, and demonstrates the parameters that we need to consider to better understand geomechanical failure. This approach is then considered in the context of various petroleum related applications that include:
• predicting permeable fractures;
• discriminating natural fractures from drilling induced fractures;
• hydraulic fracture placement and containment, and;
• explaining variable fracture gradients.

Webcasts sponsored by


BIOGRAPHY
Scott is a geoscientist with 15 years of consulting experience in petroleum geomechanics and image log services. On completion of his PhD he spent time with Z&S (Asia) Ltd performing stress, structural and sedimentological interpretation of image log data. Subsequently, he was among the academic staff at the Australian School of Petroleum researching various geomechanical issues such as fault and cap rock seal integrity, fractured reservoirs, wellbore stability and trap risk before founding his own geomechanics and image log service company, JRS Petroleum Research. JRS was merged with Ikon Science in 2012 and Scott is now a Senior Vice President of Ikon Geomechanics at Ikon Science based in London.


Wellsite Geologists Inc. the Rock Solid Choice
Wellsite Supervision
Project Management
Graphic Well Profiles
Verticals / Horizontals
EUB Sample / Core Studies
Conventional / Un-conventional 1350, 734 - 7th Ave SW Calgary, AB T2P 3P8
B 403.234.7625, www.WellsiteGeologists.com
C 403.660.9883, info@WellsiteGeologists.com
RESERVOIR ISSUE 02 • FEBRUARY 2015 9
• Domestic and International wellsite supervision • Conventional and Unconventional wells • Extensive Hz experience • Customized corporate solutions available (403) 250-3982 sales@clconsultants.ca www.clconsultants.ca
TECHNICAL LUNCHEONS FEBRUARY LUNCHEON
Model the Rock! Using Diagenesis Simulation for Rock Property Prediction
SPEAKER
Robert Lander Geocosm, LLC
11:30 am
Wednesday, February 18th, 2015
TELUS Convention Exhibition Hall D North Building Calgary, Alberta
Please note: The cut-off date for ticket sales is 1:00 pm, three business days before event. (Friday, Feb 13th, 2015). CSPG Member Ticket Price: $45.00 + GST. Non-Member Ticket Price: $47.50 + GST.
Each CSPG Technical Luncheon is 1 APEGA PDH credit. Tickets may be purchased online at https://www.cspg.org/eSeries/source/Events/ index.cfm.
ABSTRACT
We have an unprecedented ability to realistically depict the spatial distributions of lithofacies in the subsurface thanks to developments in sequence stratigraphy, sedimentology, structural geology, geostatistics, and geophysics. As important as these developments have been, however, they in themselves have a limited ability to accurately predict rock properties–particularly in regions with high thermal exposures and restricted well control. This limitation arises because the geomechanical, petrophysical, and fluid-flow properties of clastic rocks are strongly affected by diagenetic processes (i.e., biological, physical, and chemical processes that occur after burial). For instance, the mechanical nature of a sand deposit may change with diagenetic alteration from a quasi-liquid (think quicksand) to a rigid material suitable for building gothic cathedrals. Likewise, permeability may decline by as much six orders of magnitude as the sediment compacts and is subject to geochemical alteration.
Recent breakthroughs in sedimentary
petrology have led to improved understanding of compaction and quartz cementation in sandstones. Our group has built process models that build on these advances and developed additional models for grain-coating chlorite formation from volcanic rock fragment alteration, illite formation from the reaction of kaolinite and K-feldspar, and mechanical compaction, among others. Additionally, we use an a posteriori procedure that relies on analog sandstones to consider the effects of diagenetic processes for which accurate process models have yet to be developed. We combine these diagenetic models to predict the composition, texture, and porosity of sandstones through geologic time given the depositional composition and texture of a sand and its burial history. These results, in turn, serve as input for models that predict permeability and seismic velocities.
Accurate subsurface rock property models can be developed when this diagenetic modeling system is integrated with methods that describe the spatial distributions and depositional characteristics of lithofacies and petroleum system models that reconstruct sediment thermal and stress histories. This integrated approach has proven to be useful for reservoir quality risk assessment in a broad range of geologic settings, including some with considerable complexity. For instance, it has been used for accurate pre-drill prediction of reservoir quality in regions affected by thermal anomalies associated with salt structures.
To take this methodology a step farther and to better constrain rock physics, geomechanics, and fluid-flow properties of rocks in undrilled areas, we are developing a next-generation modeling platform that rigorously simulates processes in 3D at the grain scale. This 3D approach has the potential to provide unique predictive models of pore network geometries and grain contact properties for rocks in undrilled areas. The system considers thousands of grains with realistic shape and size variations and simulates deposition and rearrangement with Newtonian physics and brittle and ductile deformation of solid components with continuum mechanics. It also considers geochemical processes including quartz cementation and contact dissolution (“pressure solution”).
Webcasts sponsored by
BIOGRAPHY
Rob Lander’s primary interest is in understanding the controls on diagenetic processes in clastic rocks and using this understanding to develop accurate models of rock properties away from well control and through geologic time. He is the inventor or co-inventor of several simulation systems for diagenesis and reservoir quality prediction including Touchstone © , T>Map ©, T>Earth©, Prism2D ©, Exemplar ©, and Cyberstone © .
Rob co-founded Geocosm LLC and co-directs the company’s Consortium for the Quantitative Prediction of Sandstone Reservoir Quality (RQC), which was established in 2001 and currently has 23 members. He also is a Research Fellow with the Bureau of Economic Geology and collaborates with the Fracture Research and Applications Consortium at The University of Texas at Austin. Rob established Geocosm in 2000 after a stint as Technical Director of Geologica AS in Stavanger, Norway. Prior to his time in Norway he was a Senior Research Geologist at Exxon Production Research in Houston, Texas.
Rob has published a number of papers on topics involving diagenesis and reservoir quality prediction (including several Notable Papers in the AAPG Bulletin) and received the Wallace E. Pratt Memorial Award for best paper published in the AAPG Bulletin in 2010. He has a Ph.D. in Geology from the University of Illinois at Urbana-Champaign and a B.A. in Geology from Knox College.
10 RESERVOIR ISSUE 02 • FEBRUARY 2015
TECHNICAL LUNCHEONS MARCH LUNCHEON
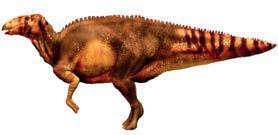
Dinosaurs, Mummies and Space-shuttles?
SPEAKER
Phillip Manning
Professor of Natural History & Director of the Interdisciplinary Centre for Ancient Life, University of Manchester
11:30 am
Tuesday, March 24h, 2015
TELUS Convention Exhibition Hall D North Building, Calgary, Alberta
Please note: The cut-off date for ticket sales is 1:00 pm, three business days before event. (Thursday, March 19th, 2015). CSPG Member Ticket Price: $45.00 + GST. Non-Member Ticket Price: $47.50 + GST.
Each CSPG Technical Luncheon is 1 APEGA PDH credit. Tickets may be purchased online at https:// www.cspg.org/eSeries/source/Events/index.cfm.
ABSTRACT
The word “mummy” has been used to mean many different things, but is synonymous with excellent preservation in the realms of archaeology and palaeontology. The term signifies the preservation of soft tissue, such as hair, muscle, tendon, but especially skin. The most familiar examples to us are human, usually of the Egyptian variety, but many such remains include both human and animal remains from all over the world. While some mummies are artificially created by human effort, many are the natural product of accidents or specific environmental conditions. There are multiple preservation types that are unique to each environment in which the physical remains of organisms come to rest. The processes that impact upon a body post-deposition introduce the splendidly macabre science of taphonomy, literally ‘burial-laws’.
The fossilized impressions/remains of dinosaur skin occur in various contexts. Post-mortem factors can move both bones and soft-tissue elements from a body after death, often generating frustratingly isolated samples. The fossil skin impressions attributable to dinosaurs may also be found as isolated patches not associated with a dinosaur skeleton. In other cases, fragmentary skin impressions are found associated with a skeleton. It is curious to note that for some reason, patches of skin on hadrosaur tails are the most common. Only a select few palaeontologists and fossil hunters
have ever known the experience of discovering, excavating, preparing and studying the fossil remains of a dinosaur mummy. Such stories illustrate the changing nature of palaeontological science as new ideas and techniques can be applied to the most special of dinosaur fossils. While it is possible to deploy 21st Century science on such ancient remains, the recovery of such animals has changed little since the first dinosaur mummy was discovered a little over 100 years ago.
Charles H. Sternberg and his sons, possibly the most successful palaeontological dynasty, were the first to discover the mummified remains of a dinosaur in 1908. This was a find that surpassed anything that Sternberg had ever seen in his forty years of fieldwork. This must have been not unlike the feelings of Howard Carter upon opening the intact tomb of the Egyptian pharaoh Tutankhamen in 1922, resulting in equally unprecedented insight to another world.
In 1999 a prehistoric burial site scene was discovered by a young fossil hunter, Tyler Lyson, now a successful scientist working at the Smithsonian in Washington D.C. This is the discovery that would lead to an international interdisciplinary alliance centred around a beautiful fossil. Tyler had discovered the mummified remains of a hadrosaur dinosaur in the Hell Creek Formation of North Dakota (USA). Through a series of very fortunate events, I got to work with Tyler and was able to help build the team of scientists who gained access to this remarkable fossil. The dinosaur was nicknamed ‘Dakota’ and is possibly the first dinosaur to properly wear the ‘mummy’ badge, based upon the information harvested from these fossil remains.
The study of this remarkable fossil took our team from NASA facilities where we probed Dakota’s innermost secrets with high-powered tomography to particle accelerators where the chemical ghosts of past biology were still present in the fossilized soft-tissues. Even the diagnostic chemistry that typifies melanin skin pigment has now been mapped and its coordination chemistry constrained within the prehistoric hide of this very special fossil. This lecture will take you on a whistle stop tour of the people, places, science and discoveries associated with a very special fossil dinosaur
Webcasts sponsored by
called Dakota! See more at: http://www.aapg. org/career/training/in-person/distinguishedlecturer/abstract/articleid/11553/dinosaursmummies-space-shuttles#sthash.ll3xEYUg.dpuf
BIOGRAPHY
Phil Manning is Professor of Natural History and Director of the cross-faculty Interdisciplinary Centre for Ancient Life (ICAL) at the University of Manchester (UK). Phil is also a Fellow (International) of the Explorer’s Club (New York). He has a BSc from Leicester University in Earth Sciences, an MSc from the University of Manchester in Geology and a PhD from the University of Sheffield in Paleontology.
Phil has worked as a paleontologist for over 25 years, including positions in museums and universities, working in both the laboratory and the field. A pivotal theme of his research is the study the multiple contemporary problems of natural-resource conservation and environmental quality and how they relate to the history of life on Earth. His work explores both the past and present interactions of processes that integrate the four terrestrial spheres: lithosphere, hydrosphere, atmosphere and biosphere. Phil’s research is both broad and interdisciplinary with active research topics including: biomechanics, geobiology, taphonomy and soft tissue preservation, synchrotron-based imaging and spectroscopy, de novo applications of LiDAR-based imaging (including landscape and skeletal modeling), x-ray microtomography, as well as the application of numerical modeling techniques to biomaterials. Phil and his team have worked extensively in the Hell Creek Formation of South Dakota and Montana, but his field program also includes sites in South America, Europe, Asia, Africa and Australia.
Phil has presented several documentaries including a recent series for National Geographic Channel (‘Jurassic CSI’) that showcased the application of new technologies in paleontology and he has also contributed to many BBC, Discovery Channel, Channel 4 and History Channel TV documentaries. Phil plays an active role in the University of Manchester’s public programs, contributing to opendays, public lectures, workshops and fieldwork. He has authored both children and popular science books and is a regular contributor to public speaking programs around the world, promoting the public engagement of science. Phil has been appointed as the Science and Technology Research Council (STFC) Science in Society Fellow (2013-2017), so as to further promote science and technology to as wide an audience as possible.
The ‘Dinosaur CSI’ blog is authored and regularly updated by Phil and includes information on recent publications from ICAL as well as their extensive field programs around the globe. You can follow Phil on Twitter @DrPhilManning.
RESERVOIR ISSUE 02 • FEBRUARY 2015 11
DIVISION TALKS PALAEONTOLOGY DIVISION
The Littlest Brontosaurus:
Two New Recumbirostrans (Lepospondyli) and a Redescription of Rhynchonkos Stovalli, Based on HRXCT
SPEAKER
Matt Szostakiwskyj, M. Sc. Candidate University of Calgary
7:30 PM
Friday, February 20, 2015 Room B108, Mount Royal University Calgary, Alberta
ABSTRACT
Rhynchonkos stovalli (Lepospondyli: Recumbirostra) is a small ‘microsaur’ from the Permian of Oklahoma that, based on a number of shared features has been hypothesized to be one of the potential ancestors of caecilians. However, due to the varying nature of preservation of the available materials, the original description of Rhynchonkos was done as a composite of multiple specimens. We used micro-CT to digitally dissect and reconstruct the specimens attributed to Rhynchonkos. We will present new braincase data that varies between specimens, and has led to the description of two new taxa (Aletrimyti gaskilli and Dvellecanus carrolli), as well as a redescription of the holotype specimen. With the splitting of these taxa, the host of shared features between Rhynchonkos and caecilians is greatly diminished. Furthermore, the interlocking nature of the elements of the skull roof, braincase, and palate imply a fossorial lifestyle for recumbirostrans, suggesting that any similarities with caecilians may be due to burrowing. Variation of the endocranial features both within and between these specimens, and

Sponsored by
others previously analyzed, has prompted a large-scale review of recumbirostran endocranial morphology. These new detailed descriptions have led us to reevaluate the current understanding of ‘microsaur’ phylogeny.
BIOGRAPHY


From Calgary, Alberta, Matt Szostakiwskyj completed his BSc in Zoology at the University of Calgary in 2013. He spent the following year as a research assistant in the Anderson lab, using micro-CT to digitally reconstruct microsaur skulls. Through this process, he was able to show that Rhynchonkos stovalli, a microsaur hypothesized to be a potential ancestor of caecilians, was a composite of three different animals. Matt is currently a Master’s student with Jason Anderson at the University of Calgary, studying the evolution and diversification of salamanders. He is interested in the origin of lissamphibians, and how the extant frogs, salamanders, and caecilians relate to the multitude of extinct amphibians. His current research aims to document the variation in cranial anatomy of salamanders, and to explore its implications in their phylogeny. His other research projects include the re-descriptions of various microsaurs, the phylogeny of lepospondyls, and exploring new visualization techniques for comparative anatomy. In his spare time Matt enjoys riding bicycles and snowboards, and brewing his own beer.
INFORMATION
This event is presented jointly by the Alberta Palaeontological Society, the Earth Science Department of Mount Royal University, and the Palaeontology Division of the Canadian Society of Petroleum Geologists. For details or to present a talk in the future, please contact CSPG Palaeontology Division Chair Jon Noad at jonnoad@hotmail.com or APS Coordinator Harold Whittaker at 403-2860349 or contact programs1@albertapaleo. org. Visit the APS website for confirmation of event times and upcoming speakers: http:// www.albertapaleo.org/
12 RESERVOIR ISSUE 02 • FEBRUARY 2015
DIVISION TALKS GEOMODELING DIVISION
Geomodeling in Challenging Oilsands Reservoirs
SPEAKER
David Garner
david@terra-mod.com
12:00 Noon
Wednesday, February 25, 2015
Husky Conference Room A +30 level, South Tower 3rd Floor – 707, 8th Ave SW Calgary, Alberta
ABSTRACT
The current focus of hydrocarbon developments is on efficiently producing the marginal economic barrel from challenging reservoirs. Technical innovation is a key focus of the extraction strategy. The standard approaches to developments are being compared to emerging technologies and hybrids with existing technologies. The Geomodeling role is to enable the integrated subsurface characterization and evaluation of the expected reservoir responses to extraction technologies. An excerpt from a Statoil case study presented at the World Heavy Oil Congress in 2014 (WHOC14 – 139) is the basis of this Geomodeling focused talk. In that study, custom Geomodeling workflows were critical to unlock business case successes after screening technologies with the potential to create steam pathways into complex oilsands reservoirs.
The McMurray Formation in Alberta, Canada has extensive bitumen resources trapped in large-scale tidal-fluvial point bar sequences of interbedded siltstones and sands, called Inclined Heterolithic Stratification (I.H.S.). I.H.S. dominated reservoirs are not economically producible using Steam Assisted Gravity Drainage (SAGD). Thick intervals of interbedded sands and silts present vertical permeability layering which responds as baffles and barriers. Recovery of I.H.S.-prone bitumen resource is both an upside prize and a challenge.
Thick pay sands are accessible by ordinary SAGD and are a commercial success. Geological resource mapping over the example leases identified pools with thin pay sands overlain by I.H.S.-types of reservoir
Sponsored by
architectures. The study scope addressed challenges of producing these reservoirs. Improved reservoir characterization focused on data integration and mapping point bar architecture, paying attention to key internal heterogeneities and their 3D geometry. Effective and efficient geomodeling was customized for the thin pay pools based on anticipated technical requirements for the extraction technologies under evaluation. For example, the inclined structure of the dominant I.H.S. lithofacies was captured within geobodies. Fluid architecture was modeled as lithology dependent water saturation height trends, i.e. transition zones and capillarity. Permeability distributions were derived from empirically based micro-models scaled to the grid cell volumes and introduced into the geomodels as by-facies cloud transforms (Manchuk, Garner and Deutsch, in press). Stochastic modeling with a ranking strategy was fundamental. Ranking required working definitions of net pay and connectivity for bitumen reservoirs. Grid scaling issues from well blocking to reservoir simulation models were adequately handled to maintain model fidelity. Geological mapping was used to transfer performance forecasts to other pools through proxies.
BIOGRAPHY
David Garner is a Specialist in Applied Geostatistics and Geomodeling. He has held positions in R&D for Statoil, was a Geomodeling Advisor with Chevron Canada Resources and Characterization Specialist for ConocoPhillips Canada. Through TerraMod Consulting, he worked on integrated field studies in North and South America, North and West Africa, and the Middle East.
Mr. Garner holds two geophysics degrees, a B.S from Washington and Lee University and an M.S. from Cornell University. In 2006 he received a Citation in Geostatistics from the University of Alberta. He currently serves as a co-chair for the Geomodeling Technical Division of the CSPG. He previously served on the board of directors and was general chair for the Gussow 2011 and 2014 conferences, “Advances in Applied Geomodeling for Hydrocarbon Reservoirs: Closing the Gap I and II”.
INFORMATION
There is no charge for the division talk and we welcome non-members of the CSPG. Please bring your lunch. For details or to present a talk in the future, please contact Weishan Ren at Weishan. Ren@pennwest.com.
RESERVOIR ISSUE 02 • FEBRUARY 2015 13
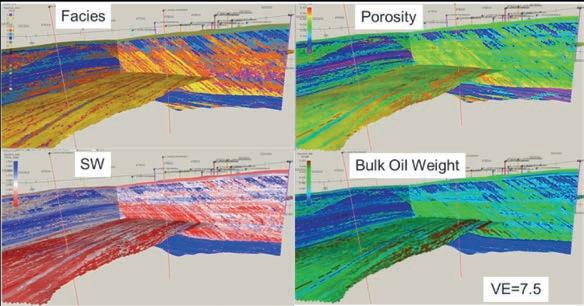
A simulated result for facies with dips imposed and subsequent petrophyscial properties.
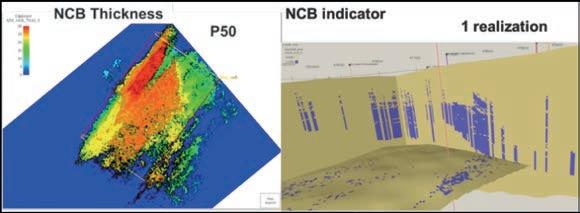
Resource screening and pad reservoir model layout using columnar Net Continuous Bitumen (NCB) calculations.
DIVISION TALKS BASS DIVISION
Interpreting Bioturbated Inclined
Heterolithic
Stratification
SPEAKER
Dr. Murray Gingras University of Alberta
12:00 Noon
Friday, February 27th, 2015
ConocoPhillips Auditorium Gulf Canada Square 401 – 9th Ave. S.W. Calgary, Alberta
Inclined Heterolithic Stratification (IHS) is commonly associated with paralic reservoirs. Within such reservoirs, the primary modes of IHS are as laterally accreted point- and channel-bars, and as vertically accreted channel fills.
Some examples of IHS are rarely observed in fluvially dominated settings that display no evidence of tidal influence, an example of this is the Cretaceous Dinosaur Park Formation in Alberta, Canada, wherein IHS is most commonly expressed as unburrowed sandstone-siltstone couplets. These likely represent seasonal variability in river flux with the two lithosomes representing different energy flow conditions. This presentation, however, focuses on the nature and character of IHS in tidally influenced settings, particularly in estuaries, for which, IHS tends to have widely variable sedimentological expressions.
Examples of IHS in tidally influenced settings are presented from the Cretaceous McMurray and Bluesky formations, in Alberta, Miocene strata in Upper Amazonia, Pleistocene strata at Willapa Bay, Washington, USA, and from modern settings including the Bay of Fundy, Canada, the Ogeechee River estuary, Georgia, USA and Willapa Bay. Using a range of techniques, including routine sedimentological and ichnological characterization, X-RAY analysis, analysis of sedimentary rhythmicity via Fast-Fourier Transform Analysis and Frequency Analysis, and mapping spatial distributions of IHS, a range of observations pertinent to IHS
interpretation and occurrence have been arrived at:
1. Rhythmicity in tidally influenced IHS: although evidence of tidal influence can be observed in IHS, the dominant mode of sedimentation results from seasonal variations in sediment distribution. Unlike in fluvial settings, estuary-IHS does not necessarily indicate substantial differences in hydraulic energy, and IHS may simply result from changes in sediment flux into the estuary. For example, if fluvial discharge into an estuary is increased, the overall increase in the tidal prism volume may be fractional, but mud-plume associated with the river may expand substantially. As such, in the inner estuary, sandstone is associated with high-river flux and mudstone with low-river flux. This relationship is reversed in middle estuary locales, where sandstone is tidally transported during low fluvial flux and the mudstone is deposited during high riverine discharge. These two scenarios, inner versus middle estuary, can in some cases be determined, in the rock record, on the basis of trace-fossil distributions.
2. Distribution of IHS: the nature of tidal and fluvial sediment sources, the volume of the tidal prism and the volume of fluvial flow each strongly influence the distribution of IHS in estuaries. The distribution of IHS in estuaries is therefore predictable, as IHS-prone belts start at the tidal limit and extend into the middle-, and in rare cases outer-estuary. Proximaldistal relationships within IHS can be, to a degree, resolved using trace-fossil distributions, ichnofossils size-diversity trends, and through ethological analyses.
3. Bed thickness of IHS: in estuaries IHS bed thickness is in part a sedimentological response to channel size, proximity to the fluvial system, and fluvial sediment flux. In general, thickly bedded (i.e. dm scale) IHS is an indicator of greater fluvial influence, whereas smaller tide-dominated channels characteristically display cm-scale IHS. Notably, even in the tide-dominated scenarios, IHS tends to be an indicator of annual sedimentary cyclicity.
The above observations help to formulate interpretations from IHS that contribute
Sponsored by
to better understanding the sedimentary environment for paralic reservoirs, help to predict the distribution of heterolithic belts in strata dominated by estuary sedimentation, and to better understand reservoir heterogeneity ascribed to channel-associated IHS.
BIOGRAPHY
Murray Gingras received his diploma in mechanical engineering technology from the Northern Alberta Institute of Technology in 1987, his B.Sc. degree from the University of Alberta in 1995, and his Ph.D. from the University of Alberta in 1999. Gingras has worked professionally in the hydrocarbon industry at the Northern Alberta Institute of Technology and as an assistant professor at the University of New Brunswick. He is presently tenured at the University of Alberta. Gingras’ research focuses on applying sedimentology and ichnology to sedimentary rock successions, as a paleoecological tool, a reservoir-development tool, and in process sedimentology.
INFORMATION
BASS Division talks are free. Light refreshments are provided. For further information about the division, joining our mailing list, a list of upcoming talks, or if you wish to present a talk or lead a field trip, please contact either Steve Donaldson at 403-766-5534, email: Steve.Donaldson@ cenovus.com or Mark Caplan at 403-975-7701, email: mcaplan@atha.com or visit our web page on the CSPG website at http://www.cspg.org./
14 RESERVOIR ISSUE 02 • FEBRUARY 2015


16 RESERVOIR ISSUE 02 • FEBRUARY 2015
SHOP petrographical & sedimentological descriptions for samples (thin section - fluid inclusion studies) conventional vertical/horizontal wells operations geology SPECIALIZED IN GEOLOGICAL WELLSITE SUPERVISION AND CORE ANALYSIS RockWell Consulting our best friend and most valuable partner is our client Stephan C. Dragomir president www .g e ok2. c om - phon e : 403.831.9941 - s dr a gomir @ g e ok2. c o m elizabeth macey, B.A., cartographer .. 4039930055 emacey@telus.net www3.telus.net/elizabethmacey .. presentations posters graphics . maps technical illustrations 1602 – 5th St N.E. Calgary, AB T2E 7W3 Phone: 403-233-7729 www.tihconsulting.com e-mail: tih@shaw.ca T.I.H. Consulting Ltd. Geologic Well -Site Supervision Reach more than 3000 petroleum professionals who are empowered to purchase your product or ser vice. AD VER TISE IN TH E R ESERVOIR Please call: Emma MacPherson Tel: 403.513.1230 Email: emma.macpherson@cspg.org
ROCK
DRILLING PLAN BASICS –Building a Landing Section with Deep EM LWD
| By Malcolm Alexander, Jean Seydoux, and Daniel Bourgeois, Schlumberger
INTRODUCTION
Planning a landing section to intersect your target reservoir is one of the most important steps to ensure a successful horizontal well. The most basic drill plans consist of two points: the kickoff point (point where the inclination build begins) and the target true vertical depth (TVD) (projected target TVD within your reservoir). At minimum, the distance traveled over the two points must accommodate four requirements:
• drillstring dogleg restrictions;
• completion string dogleg restrictions;
• steering limitations;
• reservoir uncertainty.
The first three requirements are hardwaredependent and are estimated in the hardware specifications. The last requirement, reservoir uncertainty, is managed by the addition of a drill plan control point called the tangent angle.
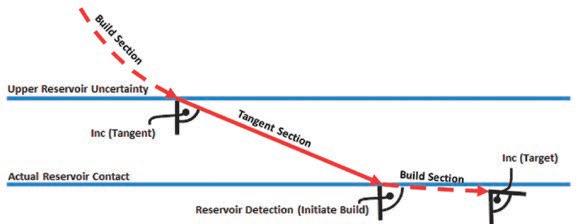
The tangent angle is a specified bit inclination that is low enough for the motor to hit the planned target inclination once the reservoir is detected. As shown in Figure 1, a wellthought-out drilling plan will reach the tangent angle at the uncertainty range of the reservoir surface—this ensures that the bit position can be adjusted to the desired inclination once the reservoir is detected and can be optimized for the subsequent horizontal section.
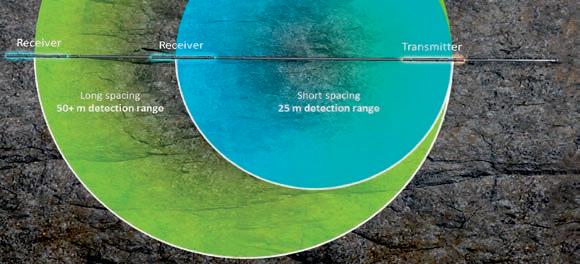
The reservoir uncertainty range can be constrained by seismic or by local offset wells. However, even with many offset wells and/or high-resolution seismic, reservoir uncertainty is always present because uncertainties accumulate with each survey while drilling, otherwise known as the “cone of uncertainty.” To help deal with reservoir/ trajectory uncertainty, many operators have started using deep electromagnetic logging while drilling (deep EM LWD) when drilling the landing section. Deep EM LWD uses a wide electromagnetic frequency range to delineate resistive/conductive boundaries away from the tool. Today’s newest deep EM LWD tools, such as the Schlumberger GeoSphere* service (Figure 2), can detect resistive/conductive boundaries in excess of 50 m from the wellbore and calculate individual bed resistivities, anisotropy, and
(Continued on page 18 ...)
RESERVOIR ISSUE 02 • FEBRUARY 2015 17
Figure 2. Schlumberger GeoSphere* service. The deep EM LWD tool propagates a wide range of electromagnetic frequencies deep into the formation. The interaction of the electromagnetic signal with the formation is used to calculate the individual bed resistivities, anisotropy, and formation dip.
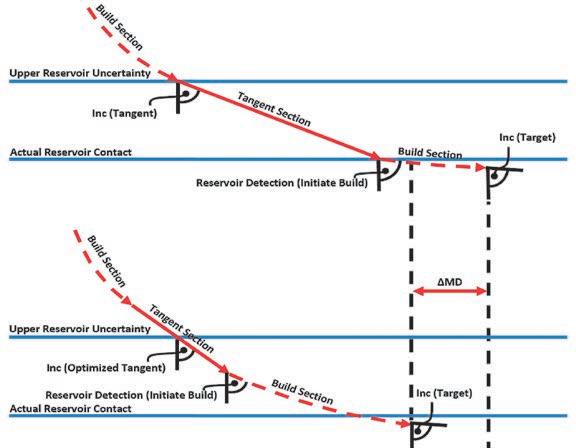
Figure 3. Drilling plan without (top) and with (bottom) deep EM LWD. The main benefit of drilling with deep EM LWD is earlier detection of the reservoir. Early reservoir detection allows for a more aggressive tangent angle, resulting in a reduced total measured depth ( MD).
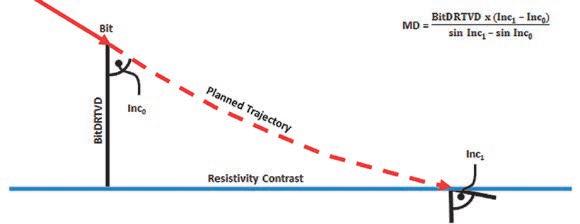
Figure 1. Components of a landing section.
(...Continued from page 17)
formation dip. Being able to sense the reservoir before intersection enables the well planner to incorporate the deep EM LWD detection range limit into the plan and set a more aggressive tangent angle. Tangent angle optimization via deep EM LWD detection range reduces the true horizontal distance in the curve section (Figure 3), leaving more horizontal length where it counts – in the production leg.
DRILLING PLAN CALCULATIONS
Before any calculations can be made, it is important to determine the deep EM LWD detection range. Deep EM LWD detection range is not a set distance, and there are a few factors that must be provided to the service-company well placement engineers:
• borehole assembly;
• formation thickness;
• formation true resistivity values;
• structural dip.
The detection range of deep EM LWD is directly related to transmitter-receiver spacing; a short transmitter-receiver spacing will give high resolution but limited detection range, while a longer transmitter-receiver spacing will have limited resolution but an extended detection range. Having both short- and long-spaced receiver-transmitter configurations in the borehole assembly will ensure high resolution and deep detection range are provided. For landing sections, a short- and long-spaced transmitter-receiver pair is recommended.
Both reservoir thickness and resistive contrast can affect the deep EM LWD detection range, but can be resolved by forward-modeling nearby offset data or with sensitivity plots. Once modeled or plotted, the deep EM LWD detection range can be integrated into the drilling plan.
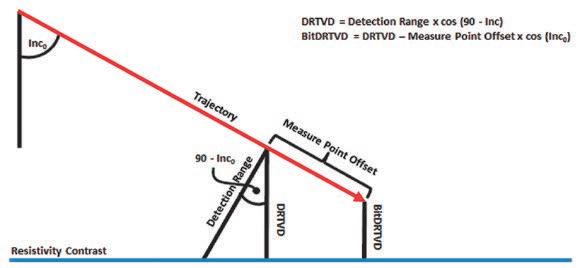
When approaching a resistive contrast with any incident angle other than 0° (as in Figure 4), the simulated/estimated detection range must be modified to the following:
DRTVD = Detection Range × cos(90 – Inc0 ),
where:
Detection Range = deep EM LWD detection range; Inc0 = initial bit angle.
This calculation can be modified to include the structural dip (horizontal dip = 90°):
DRTVD = Detection Range × cos (Dip – Inc0 ),
where:
Dip = structural dip.
All above calculations are taken from the boundary calculation measure point (transmitter-receiver midpoint). To make the calculations more relevant, we calculate the DRTVD for the drill-bit position (Figure 3) by using the following:
BitDRTVD = DRTVD – Measure Point Offset × cos (Inc0 ),
where:
BitDRTVD = deep EM LWD detection range for drill-bit position.
For a set target angle and BitDRTVD, the distance can be calculated for any given initial angle. Figure 5 shows a simple 2D schematic with the initial bit angle (Inc 0), BitDRTVD, and target angle (Inc1) relationship. From the Inc 0 -BitDRTVD -Inc1 relationship, we can calculate the distance along the trajectory
18 RESERVOIR ISSUE 02 • FEBRUARY 2015
Figure 5. Radius of Curvature method for determining the MD along a planned 2D path.
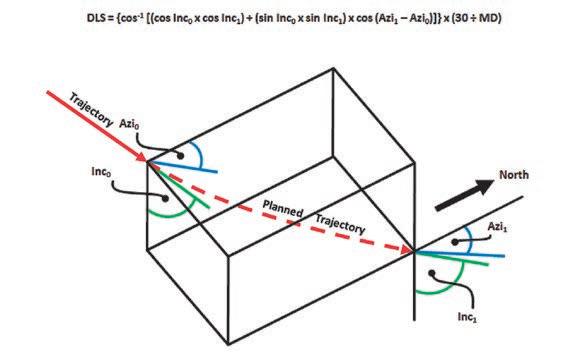
Figure 6. Radius of Curvature schematic showing the required inputs needed for a basic DLS calculation.
Figure 4. DRTVD and BitDRTVD schematic showing the relationship between deep EM LWD detection range, inclination, DRTVD, and BitDRTVD.
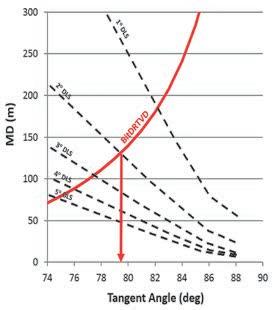
Figure 7. Excel ® spreadsheet output when using the formulas above. In this particular case, the tangent angle of 78.8 deg can be held until the reservoir is detected, after which the inclination can be increased using a 2 deg DLS to intersect the reservoir top at 88 deg.
(MD) to target intersection using the Radius of Curvature method:
MD = BitDRTVD x (Inc1-Inc 0) sin Inc1 - sin Inc 0
Once the inclination and MD are determined, we can calculate the dogleg severity (DLS). The DLS is the azimuth and inclination degree change every 30 m. As mentioned in the introduction, DLS calculations are important because the drillstring, completion string, and steering all have dogleg restrictions. The calculation of DLS using the Radius of Curvature method (Figure 6) is as follows:
DLS = {cos –1 [(cos Inc0 × cos Inc1 ) + (sin Inc0 × sin Inc1 ) × cos (Azi1 – Azi 0 )]} × (30 ÷ MD)
where:
Azi1 and Azi 0 = planned azimuthal changes.
As outlined in Figure 6, there are a few things to determine before calculating the DLS:
• target inclination at reservoir boundary – previously the tangent angle when not using deep EM LWD (Inc1 in Figure 6);
• planned azimuthal changes (Azi 0 and Azi1 in Figure 6);
• drillstring, completion string, or steering DLS limitations (whichever is the lowest).
The drilling plan calculations show how to use deep EM LWD detection range, expected formation dip, planned target inclination at reservoir contact, planned azimuth changes, and DLS restrictions to calculate BitDRTVD, MD, and DLS. With these calculations, we can create a simple spreadsheet to determine the most aggressive tangent angle possible.
In the Figure 7 example, Microsoft ® Excel ® software is used to plot the DLS and BitDRTVD on the tangent angle versus the MD plot. The optimum tangent angle can be determined for any DLS by simply looking for the intersection of the DLS along the BitDRTVD curve.
DRILLING PLAN EXECUTION
A more aggressive tangent angle can be used when drilling a landing section with deep EM LWD. Once the tangent angle is determined we must consider one final risk—reservoir
discontinuity. There are many situations where stratigraphic or structural breaks can occur. The drilling plan must accommodate for the risk of an absent reservoir. For an absent reservoir case, a lower limit based on reservoir uncertainty should be included in the drilling plan. A drilling plan that accommodates reservoir uncertainty and discontinuity consists of three control points: the kickoff point, the tangent hold calculated with deep EM LWD detection range, and the lower uncertainty reservoir limit (Figure 8). It is important to note that the lower limit build can be initiated at any time along the tangent section (if the reservoir is detected).
CONCLUSIONS
Deep EM LWD can be used to reduce uncertainty risks involved when landing a well within a specific target. A detailed drilling plan that incorporates electromagnetic technology allows for a more aggressive tangent angle. A more aggressive tangent angle means that less time and meters will be spent drilling the landing section, reducing drilling costs and maximizing the producing horizontal section.
* Mark of Schlumberger
RESERVOIR ISSUE 02 • FEBRUARY 2015 19
PHOTO OF THE MONTH
20 RESERVOIR ISSUE 02 • FEBRUARY 2015
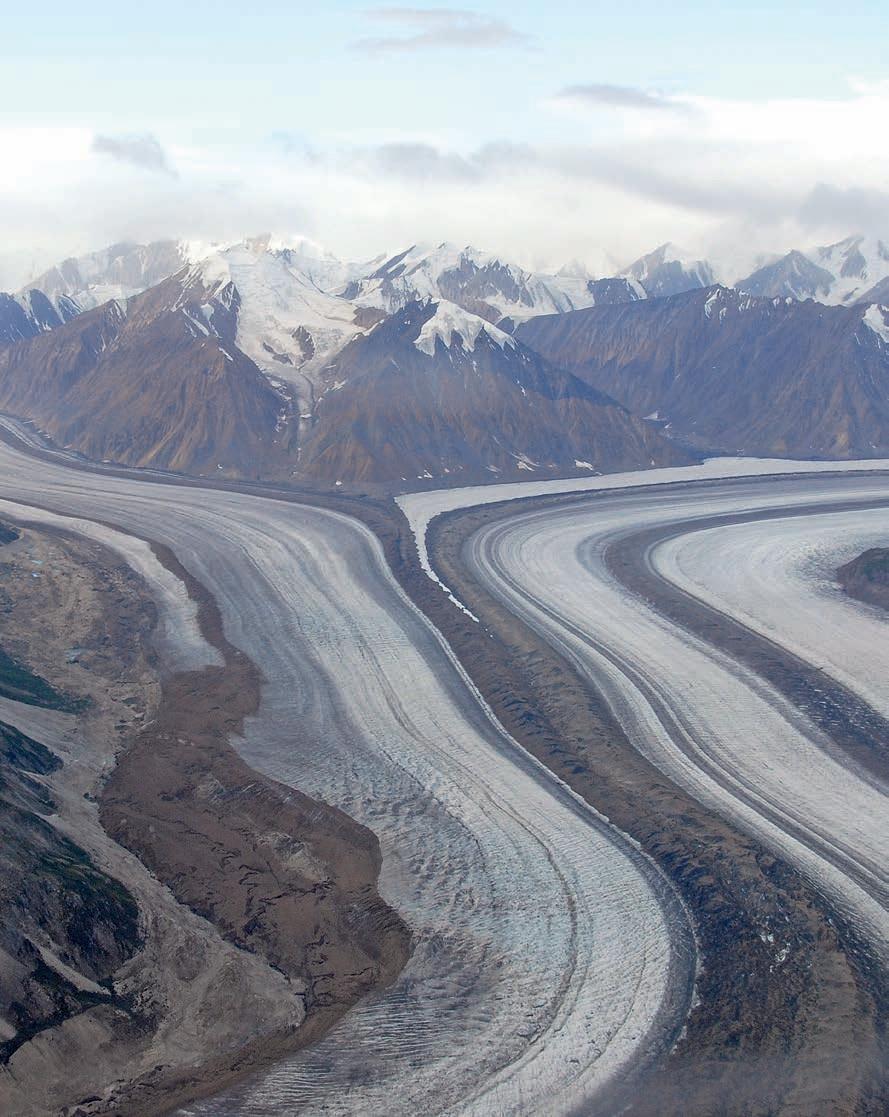
Multiple medial moraines on the Kaskawulsh Glacier, St. Elias Mountains, Canada formed by the coalescing of lateral moraines on several smaller glaciers. Photo by Margot McMechan.
THE VALUE OF BOREHOLE IMAGE LOGS
Part 2: Analysis of Structure and Fractures in Image Logs
| By Kris Vickerman, HEF Petrophysical Consulting Inc.
INTRODUCTION
As discussed in part one of this series, borehole image logs have been in use for many decades but gained prominence in the late 1990’s. Their applications are wide-ranging but their main use is firstly, to determine bedding orientation in a particular wellbore to interpret fault and fold geometries and secondly, to determine the degree and nature of natural fracturing present to interpret the effect that fracturing will have on reservoir and caprock permeability.
STRUCTURAL ANALYSIS
Structural analysis from direct borehole measurements has been possible since the 1930’s when Schlumberger recorded its first three-button resistivity dipmeter log. Confidence in the measurement has increased through the transition from single resistivity buttons on each of 3, 4 or 6 pad dipmeters to arrays of more than a hundred such measurements arranged around the borehole, with the position of each trace tracked carefully via caliper, magnetometer and accelerometer measurements, typically recorded at sample frequencies measured in the millimetres.
This increase in resolution has vastly improved confidence in the dip values, no longer hand-calculated on a trace log or automatically correlated by computer, marred by the presence of poor correlations
due to fractures, the effect of borehole conditions (breakout, washout, mud-cake effects such as bit marks) and stratigraphic data such as cross-bedding and slump features among the final structural data. Modern wellbore structural data sets are the truest measurement of bedding orientation possible, often providing the only measurement of such data in areas with poor seismic resolution.
Interpreting structural data
Once the structural bedding is isolated from the other possible correlations it can be interpreted using stereonets, scat curvature analysis and projection in an appropriatelyaligned cross-section.
The first step is to look at the overall structural axis through stereographic projection and, usually, through statistical analysis of the population of poles to bedding. Data is projected onto a stereonet and Eigenvector populations of that data are computed to aid in understanding the fold axis and other orientations (Woodcock, 1977). A simple, automatic approach to analyzing dip data is valid only for areas with a single structural domain, and care should be taken in systems with multiple fault orientations (normal and strike-slip regimes), with each structural discontinuity investigated and considered on its own merits, and on its own isolated crosssection.
(Continued on page 22...)
RESERVOIR ISSUE 02 • FEBRUARY 2015 21
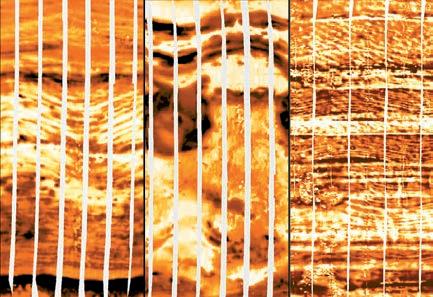
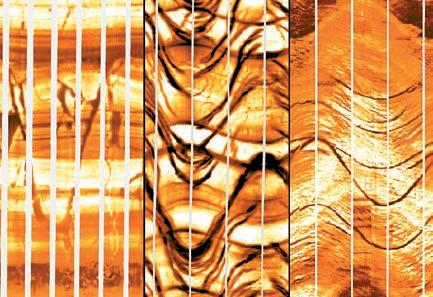
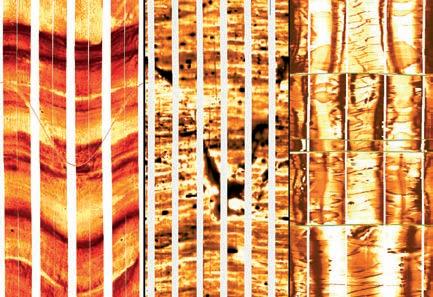
Figure 2: The effect of cross-bedding, truncations and other stratigraphic textures is shown in these three images. Obviously cross-bedding (left and right images) and sedimentary textures like the breccia shown in the central image should not be included in any structural data set.
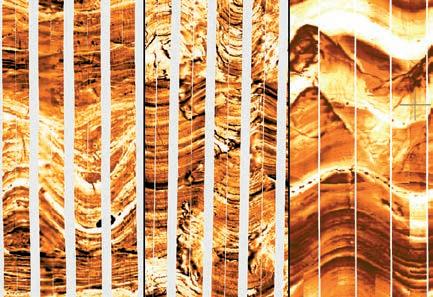
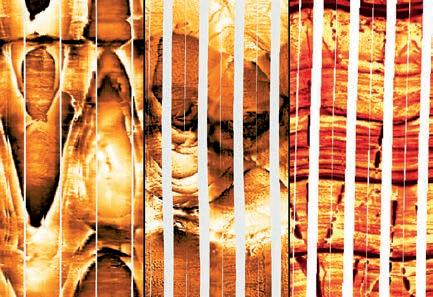
Figure 3: Bedding structures in the borehole can be extremely complex, changing rapidly with depth, and are frequently cut by faults that can be imaged clearly (such as the pair of minor faults bounding a brecciated and rotated block shown in the image on the right).
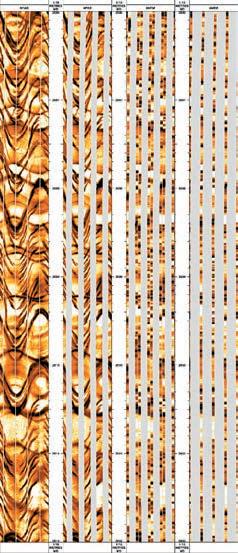
Figure 1: A comparison of modern 4 and 8-pad borehole images (on the left) to older 8 button and 4 button dipmeter images on the right, showing the increased resolution and confidence in both fracture and structural interpretations possible in the modern tools.
Stereographic analysis (including investigation of tangent diagrams to test for fold cylindricity) leads to an understanding of the fold axis, its dip and strike directions (important for SCAT and cross-section analysis as well as in determining the plunge magnitude and direction observed in the dip data).
SCAT (short for Statistical Curvature Analysis Techniques, after Bengston, 1981) presents dip data in terms of dip azimuth, dip magnitude, Transverse apparent dip (in the true dip direction), and Longitudinal apparent dip (in the “strike” direction). Other useful scatter-type displays can include dip ratio, the ratio of true dip/ transverse apparent dip which gives a value of 1 when the data is projected in the correct true-dip section and approaches 0 as the dip magnitude gets more significant in the out-of plane, strike direction.
Once a proper transverse section is chosen (remembering that there may be more than one section required for multiple structural domains), the curvature of dip anomalies are investigated to look for events such as faults, folds and unconformities, always using the image data as a reference for any interpreted feature (i.e. one should not interpret a fault in the middle of uninterrupted bedding on the image). The rule of thumb is that dip cusps verge toward the down-fault direction for normal faults (i.e. bedding dip increases in a direction parallel to the fault dip) and toward the up-throw direction for reverse (thrust) faults (i.e. bedding dip increases in the opposite direction as the fault dip).
These dip cusps and other patterns in the dip magnitudes are used to determine the boundaries for structural domains, while the fault inclination magnitudes are usually inferred from structural styles in the area or from direct observations in the image logs.
FRACTURE INTERPRETATION
Borehole image logs are the best tool for analyzing the orientation, intensity and nature of natural fracturing in a borehole. In electrical image logs drilled with conductive (water-based) drilling mud, fractures are typically appear as conductive, resistive or mixed resistivity traces that are usually planar, and crosscut or terminate on bedding. In acoustic image logs, open fractures appear as low reflection amplitude events, and healed fractures are usually not visible.
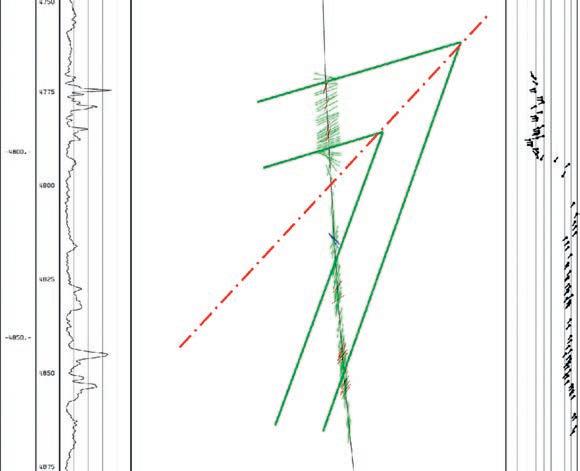
Figure 4: Once bedding plotted in an appropriate cross-section and fault analysis has been conducted, the bedding can be projected away from the borehole to give an accurate representation and prediction of structures that may be too steep to be imaged by seismic surveys.
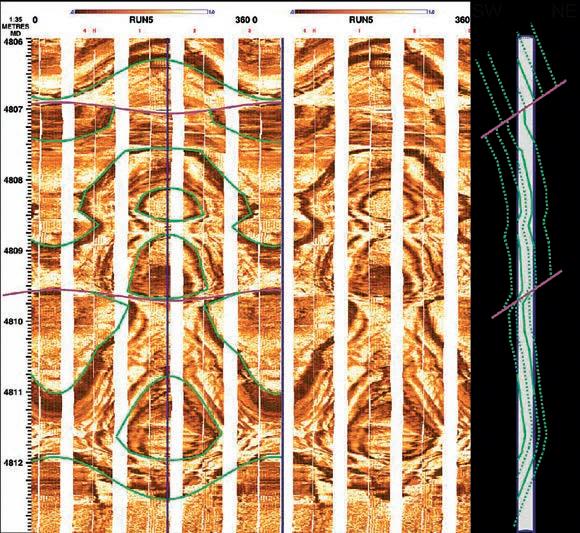
Figure 5: Complexly folded and faulted bedding can also be projected away from the borehole on a more mesoscopic scale to better understand the geometry and structural vergence shown in these smaller-scale structures.
Open Fractures
The drilling process mixes and injects relatively saline (conductive) drilling fluids
into the formation which displace and replace original fluids or gasses that were present in the fractures. This results in a
22 RESERVOIR ISSUE 02 • FEBRUARY 2015
(...Continued from page 21)
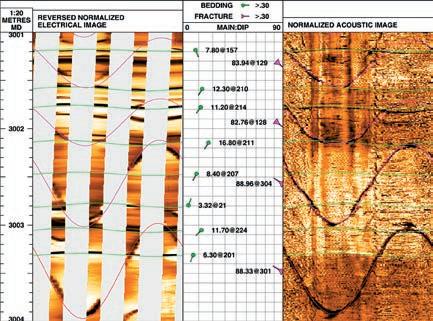
9: Some acoustic and electrical oil-based images show good repetition between the two measurement types. Fractures are seen as low amplitude reflections (dark) on the image on the right and as dark traces (representing high resistivity) in the reverse-scaled oil-based image on the left.
dark (conductive) sinusoidal trace that is typically oriented at a high angle to bedding.
Healed Fractures
Healed fractures are formerly open fractures that have been filled by some cementation or mineral precipitation, typically calcite or silica cements, with less common filling materials including anhydrite, pyrobitumen, and even some conductive materials such as pyrite or clay minerals. The typical cements, calcite and silica, are electrically resistive and can be imaged by electrical image logs. They usually appear as “halo” events where the electric flux in the formation produces a crescent of excess conductivity on the inside of the peak or trough of the sinusoid with a matching crescent of lowered conductivity on the outside.
Fault-offset fractures
Borehole image logs reveal fractures that
cut and offset bedding and thus are faults of some scale. These features are seen with fault-offsets on the sub-borehole scale (mm’s to cm’s) through the sub-seismic scale (dm’s to several metres) and up to more significant, seismic-scale faults in the scale of tens to hundreds of metres of faultoffset. Similar to discrete healed and open fractures, theses fault-offset fractures can be open (filled with drilling fluid), sealed (either mineralized or filled with fault gouge), or brecciated (seen as a network of fractures or broken and altered material within a zone of deformation). Indeed, most large faults are usually not imaged well on borehole image logs because the fault-damaged zones tend to wash out during drilling. This leads to poor pad contact or wider brecciated zones without clear planes that can be identified directly. In these cases, the fault zone should be noted and its orientation and presence inferred from bedding flexure, and missing
or repeated section around the features.
Oil-based and acoustic images
Oil-based electrical image logs and acoustic (televiewer) image logs are less reliable than conductive mud borehole images for fracture identification. Electrical resistivity images are “conductivity seeking”, that is, the current flow seeks the most conductive path from the source to the receiver buttons, so the presence of nonconductive fluid filled fractures serves as an impediment to that current flow, making those fractures naturally harder to image. That said, if there is significant resistivity contrast between the formation resistivity and the injected drilling fluid, the features can be visible (just as with healed fractures).
Acoustic (ultrasonic) image logs are often coupled with oil-based electrical images (Continued on page 24...)
RESERVOIR ISSUE 02 • FEBRUARY 2015 23
Figure 6: Open fractures produce dark (conductive) traces that cross and terminate on bedding. Fractures often do not cross the entire borehole as most fracture radii are similar in scale to the borehole itself.
Figure 7: Healed fractures range from obvious, high contrast resistive events (on the left), to subtler features seen mostly as halos of over and under conductance (middle). Fractures can be partially cemented, simultaneously filling part of the fracture while the cements keep the aperture propped open (the spotted and intermittently healed sub-vertical fractures on the right).
Figure 8: Faults exist on different scales, from the cm-offset features shown above to fault zones with transport magnitudes measured in kilometres. The image on the left shows a small reverse fault filled with resistive fault gouge. The image in the middle shows a small normal fault with open aperture which drops a conductive bed down a few centimetres. The image on the right shows a horizontal shale reservoir cut by four healed or gouge filled normal faults in rapid succession, each with throws of less than a metre.
Figure
and can be helpful in fracture identification, but suffer their own limitations. Being a measurement of the reflection of acoustic energy through the drilling mud, against the borehole wall and back to the tool, th e measurement is affected by anything that would interfere with that reflection. This means that acoustic image quality is reduced by dense drilling mud (reducing the energy that is returned to the receiver), by rough or washed out borehole (scattering the energy), by the presence of even moderate thickness of mud filter cake (providing a barrier between the fluid and the borehole wall), and by the tool being off-centered or too small for the borehole in question (increasing the distance the signal must travel). Despite these overlapping image quality impediments, acoustic image logs can respond well to open fractures (by locally reducing the reflection amplitude measured by the tool), but any fracture interpretation taken from these tools must be assumed to be a positive-indicator of fracturing. Hence, if fractures are not seen in a particular interval, we can’t know that there aren’t fractures present, due to the factors outlined above.
Fracture analysis – Trace length, Density and Aperture
Picking fractures produces several primary measurements – Depth, Dip, Azimuth and Fracture Type, but these are not all of the observations possible if fractures are interpreted properly. Fractures (and all other sinusoidal events) should be picked only where they are present in the borehole (i.e. for fractures that terminate on bedding or on other fractures, only a partial sinusoid should be picked). This act of picking partial intersections produces other significant primary measurements –Trace Length (the linear length of borehole crossed by the feature), Minimum Radius (the smallest circular fracture that could have produced such a feature intersection), and Height (the borehole-parallel extent of the feature).
Further analysis is possible, specifically calculating fracture density (as an approximation of connectivity), and in calculating fracture aperture (usually with the goal of providing an estimate for fracture permeability modelling or perhaps determining fracture porosity – more on this later).
Fracture Density
In its simplest terms, fracture density can be expressed in a linear sense as the number of fractures encountered per unit
of length, similar to counting the fractures on an outcrop transect. This kind of count density is inappropriate as it does not account for the geometric bias between the intersection line (the borehole) and the fractures (which may be oriented steeply relative to the borehole). The first attempt to account for this is a simple geometric correction commonly called the Terzaghi correction:
Dens = Counted Fractures * 1 / sin(intersection angle)
This kind of linear correction is generally too large and inappropriate for borehole data as the borehole is a three-dimensional volume (not a linear sample. Fractures should be counted in terms of trace length in the borehole per unit of surface area, or up-scaled to account for geometric bias to a volume density where each fracture’s
surface area is counted relative to an imaginary volume of reservoir rock around the borehole (Jamison et. al, 2004).
Fracture Aperture and Porosity
The trace of a fracture as it appears on a resistivity-based image log results from the contrast in conductivity between the material in the fracture and the surrounding rock. A dark fracture trace generally results from the invasion of high-conductivity drilling mud into the fracture aperture. On the images, we see this fracture trace as a dark band, generally much wider than the actual fracture aperture. The image log tool is actually measuring the variations of conductivity along and around the wellbore. This conductivity information can, theoretically, be used to calculate the physical fracture aperture, provided a number of variables are known.
24 RESERVOIR ISSUE 02 • FEBRUARY 2015
(...Continued from page 23 )
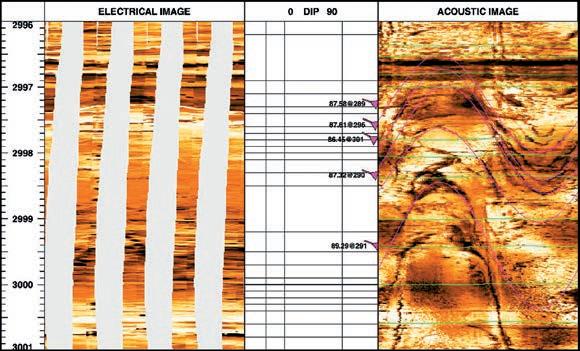
Figure 10: Some acoustic and electrical oil-based images do not repeat well. In this case, the open fracture set that is so clear in the acoustic image on the right is barely seen at all in the electrical image on the left. For this reason, fracture detection in oil-based image logs carries some uncertainty.
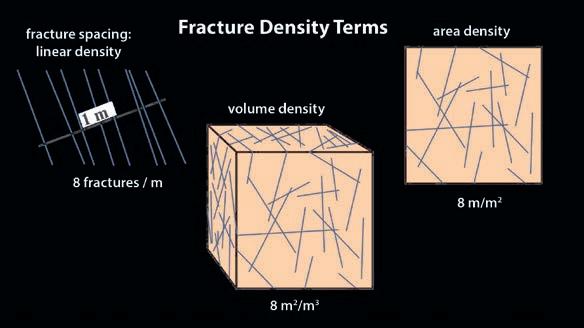
Figure 11: Density can be linear such as a line count on an outcrop (left), two-dimensional such as a length summation within a defined surface area (right), or ideally represents a summation of all fractures in an idealized and well-estimated volume (middle).
The determination of the fracture aperture begins by fitting a sinusoidal curve to the borehole fracture trace, and forming a “gather window” around this sinusoid. The excess conductance (K) associated directly with the fracture is derived as shown in the diagrams at right.
There are several implicit assumptions embedded in this procedure, such as:
1) The fracture is planar and extends entirely through the wellbore.
2) The fracture dip is less than ~45° to the wellbore.
3) The fracture is situated in a homogeneous medium with a known mud-invaded zone resistivity (R xo).
4) The fracture aperture is invaded by drilling mud of known resistivity (R m), and all of the excess conductance in the gather window is due to the mud-invaded fracture.
If these assumptions hold (and they rarely do), fracture aperture can be calculated from the Luthi and Souhaite (1990) equation:
W = c * K * R m b * R xo (1-b)
Where:
W is the Physical aperture of the Fracture K is the excess conductance associated with the fracture trace R m is the drilling mud resistivity R xo is the invaded zone formation resistivity c and b are constants that depend on tool type and aperture units (c=0.004801 and b=0.863)
There are several aspects of this fracture aperture analysis that can result in large errors in the aperture determination, even assuming that the equation shown is accurate. These error sources fall into two general categories: uncertainty in the appropriate values for the drilling mud resistivity R m and the mud-invaded zone resistivity R xo , and discord between the model fracture geometry and the natural fracture geometry in the wellbore. For this reason fracture aperture calculations are very mixed in terms of their results.
Assuming fracture aperture can be calculated correctly (or alternatively if it is assumed based on core measurements or other reservoir studies), fracture porosity can be calculated as the sum of discrete fracture aperture times discrete fracture
area. Since most fractures are relatively hairline (on the order tens to hundreds of microns), even in very high fracture densities of say 20 m/m2 , with large (0.1mm fractures), calculated fracture porosities are very small:
Ф f = Af * Df
Ф f = 20 m/m2 * 10 -4 m
Ф f = 0.002 m2/m3, or 0.2%, or 0.2 p.u.
CONCLUSION
It is important to understand the source of dip measurements as there is a wealth of information available on the structural style and on imaging and understanding sub-seismic accommodation structures, provided structural data is properly isolated from stratigraphic bedding. If fractures are carefully traced and properly classified, borehole image logs provide invaluable insight into their orientation, density and other properties that cannot be replicated with other measurements.
The next article in this series, Part 3: Image Logs in Unconventional Plays
and Horizontal Wells, will explore the particular challenges in using and logging borehole images in these environments, focusing on the interplay of natural and induced fractures in fissile rocks.
REFERENCES
C. A. Bengtson, 1981, Statistical curvature analysis techniques for structural interpretation of dipmeter data, AAPG Bulletin, February 1981, v. 65, p. 312-332
Woodcock, N.H., 1977, The specification of fabric shapes using an eigenvalue method, Bulletin of the Geological Society of America, v. 88, p. 1231-1236
Jamison, W., Vickerman, K., Heffernan, P., Fracture Quantification from Image Logs, 2004 Poster presentation for the ICE2004 Geoconvention
Luthi, S.M. & Souhaite, 1990. Fracture apertures from borehole scans. Geophysics, v. 55, no. 7
RESERVOIR ISSUE 02 • FEBRUARY 2015 25
HONORARY MEMBER –
James D. (Jim) Reimer, P.Geol.

Jim Reimer graduated from the University of Waterloo in 1978 with an Honors B.Sc. in Earth Sciences. Two years later, he earned his M.Sc., also from UW, specializing in hydrogeology. In 1997, he rounded out his
education with an Honors Certificate in the Canadian Securities Course.
Jim joined the CSPG in 1977, the same year that he won the CSPG Undergraduate Award. In 1991 he was awarded Best Convention Paper, then a Link Award for best technical luncheon paper followed in 1994. Jim was a co-founder of the CSPG Hydrogeology Di vision (now the Geofluids Division), which earned him a Tracks Award in 1996. He also served as a general co-chairman for the 1998 J oint Annual Convention (GeoTri ad ’98). This convention was the first three-society joint conference and these seminal efforts earned him a President’s Award.
Jim began his tenure on the CSPG Executive in 2005, and he served as Society President in 2006. His executive efforts included implementing the 2005 CSPG strategic plan, highlighting on technical information distribution and communication between
GEOEDGES INC.
Texas & Midcontinent US Geological Edge Set
Mexico Geological Edge Set
disciplines, with a special emphasis on the public perception of science. He played a pivotal role in the establishing the Earth Sciences For Society (ESFS) initiative and he was a strong supporter for the creation of the Canadian Federation of Earth Sciences. Jim subsequently earned two more Society awards in 2008 and 2010: a Volunteer Award for participating as a Convention Session Chair at the 2008 Convention, and a Service Award for his guidance on the ESFS committee.
Jim started his career with Home Oil in 1980. During his 14 years there, he advanced from prospecting geologist to the position of Chief Ge ologist –International Business Development. He also completed a specialization in petroleum hydrodynamics and petrophysics. Jim is credited with the d iscovery of the Ring-B order Montney gas trend for Home Oil, plus the creation of a new exploration model for hydrothermal
Western Canada: Slave Point, Swan Hills, Leduc, Grosmont, Jean Marie, Horn River Shales, Elkton, Shunda, Pekisko, Banff, Mississippian subcrops and anhydrite barriers in SE Sask., Bakken, Three Forks, Montney, Halfway, Charlie Lake, Rock Creek, Shaunavon, BQ/Gething, Bluesky, Glauconitic, Lloyd, Sparky, Colony, Viking, Cardium, CBM, Oilsands Areas, Outcrops
US Rockies & Williston: Red River, Mississippian subcrops & anhydrite barriers (Bluell, Sherwood, Rival, etc), Bakken, Three Forks, Cutbank, Sunburst, Tyler, Heath, Muddy, Dakota, Sussex, Shannon, Parkman, Almond, Lewis, Frontier, Niobrara, Mesaverde shorelines, Minnelusa, Gothic, Hovenweep, Ismay, Desert Creek, Field Outlines, Outcrops
Texas & Midcontinent: Granite Wash, Permian Basin paleogeography (Wolfcampian, Leonardian, Guadalupian), Mississippian Horizontal Play, Red Fork, Morrow, Cleveland, Sligo/Edwards Reefs, Salt Basins, Frio, Wilcox, Eagleford, Tuscaloosa, Haynesville, Fayeteville-Caney, Woodford, Field Outlines, Outcrops, Structures
North American Shales: Shale plays characterized by O&G fields, formation limit, outcrop, subcrop, structure, isopach, maturity, stratigraphic crosssections. Includes: Marcellus, Rhinestreet, Huron, New Albany, Antrim, UticaCollingwood, Barnett, Eagleford, Niobrara, Gothic, Hovenweep, Mowry, Bakken, Three Forks, Monterey, Montney, Horn River, Colorado
Eastern US / Appalachia: PreCambrian, Trenton, Utica-Collingwood, MedinaClinton, Tuscarora, Marcellus, Onondaga Structure, Geneseo, Huron, Antrim, New Albny, Rhinestreet, Sonyea, Cleveland, Venango, Bradford, Elk, Berea, Weir, Big Injun, Formation limits, Outcrops, Allegheny Thrust, Cincinatti Arch, Field outlines
Mexico: Eagle Ford-Agua Nueva, Pimienta, Oil-Gas-Condensate Windows, Cupido-Sligo and Edwards Reefs, Tuxpan Platform, El Abra-Tamabra facies, Salt structures, Basins, Uplifts, Structural features, Sierra Madre Front, Outcrops, Field Outlines
Deliverables include:
-Shapefiles and AccuMap map features
-hard copy maps, manual, pdf cross-sections
-Petra Thematic Map projects, GeoGraphix projects, ArcView map and layers files
-bi-annual updates and additions to mapping
-technical support
26 RESERVOIR ISSUE 02 • FEBRUARY 2015
Western Canada Geological Edge Set Northern US Rockies & Williston Basin Geological Edge Set Eastern US / Appalachian Basin Geological Edge Set North American Shales Geological Edge Set (all colors) Detailed and accurate geology at your fingertips in Petra, GeoGraphix, ArcGIS, AccuMap, GeoScout and other applications for information contact: Joel Harding at 403
email joelharding@geoedges.com
870 8122
www.geoedges.com
dolostone reservoirs. In 1995, Jim moved to Sta mpeder Exploration, where he assisted with several major corporate transactions and takeovers before becoming the Vice President of Exploration. He then moved to Encal Energy with the same title, but with a larger staff and a substantially larger drilling program. In 2000, he became Vic e President and Operati ng Officer of Encal’s West Business Unit, with full responsibil ity for all company oper ations in northeastern B ritish Columbia and the Peace River Arch di strict. Jim’s next step was to become the founder and President of Race Rocks Resources, focusing on shallow gas drilling in Alberta. He then joined Result Energy as Vice President Exploration, later becoming Executive Vice President. Jim was quick to spot the shale gas potential of the Horn River Basin, and he lead Result Energy to a ccumulate the largest l and position on this p lay within the junior sec tor. Jim took 2010 as a sabbatical year, providing executive level consu lting services throug h his personal E&P ad visory business. In 2011, he was lured to his current role at Painted Pony Petroleum as Vice Presi dent of Exploration. The company’s exclusive focus on horizontal drilling in shale gas and light-tight oil plays has provided Jim with deep experience in the resource play arena.
Jim is a veteran explorer, with experience across western Canada, the Beaufort Sea, Canada’s east coast and Latin America. He is an accomplished speaker and he has presented extensively on topics ranging from hydrothermal dolomite, to shale gas plays, to industry updates concerning oil and gas supply trends and economics. His 1991 paper to the CSPG technical conference is considered revolutionary, as he identified key relationships between hydrothermal reservoir dolomitization and collapse features, while proposing a novel burial diagenetic model to explain the process (TSR-HTD). Industry quickly adopted Jim’s ideas, resulting in a rush to explore for HTD collapse features in carbonate platforms worldwide.
Jim and his wife Peggy are the principal benefactors of s everal new mineral collections featured at the Earth Sciences Museum of the University of Wat erloo. Key displays include the Reimer Family Collection of fine mineral specim ens,
plus the interactive Groundwat er-Driven Mineralization exhibit. Jim has been named a Science-Alumnus-of-Honor by UW in recognition of his career achievements and support of university programs.
Jim is widely respected as a strategic thinker and an accomplished petroleum geoscientist. He is well-known for his creative thought leadership and he is recognized as an industry expert on the petroleum geology of northeastern British Columbia. He consistently offers an unconventional and innovative
approach to exploration and development plays. Jim’s belief in open, technical sharing of ideas, combined with his active volunteering, has advanced our industry and our Society. Accordingly the CSPG is proud to award Jim Reimer Honorary Membership status.
AVO COMPLIANT STRUCTURE AND STRATIGRAPHIC 5D INTERPOLATION 4D TIME LAPSE 3D PRESTACK TIME MIGRATION 3D MERGE 2D PRESTACK DEPTH 2D MARINE MULTICOMPONENT WORKSTATION RENTALS

The On-Shore Seismic Specialists
RESERVOIR ISSUE 02 • FEBRUARY 2015 27
EDGE TECHNOLOGIES INC. Direct:
edge-tech.ca
+1.403.770.0440 •


Graduate Master’s Thesis Award

Did you know there is over $26,000 available in CSPG awards and scholarships?! STUDENTS! Scholarship/Award Amount available Application Deadline
5
Student Event Grants
x $1000 March 6, 2015
$4000
2
GeoConvention
September 15, 2015 Graduate Doctoral thesis Award $5000 September 15, 2015 Andrew Baillie Award
x $2000
2015
GO TAKE A HIKE
Headwall Lakes, Kananaskis, Alberta
| By Philip Benham and David Miller
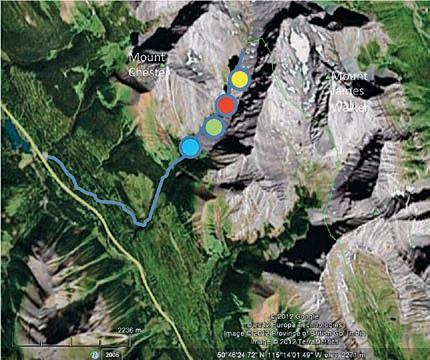
Headwall is the term for the highest and steepest cliff in a cirque, the point at which a glacier has initiated. It is here that the two lakes rest in the bowl gouged by the ice. The steepest cliff in a cirque is the generally the point at which the glacier has initiated. It is here that the two Headwall Lakes are located and thereby take their name. The over-steepened slopes have been subject to much rockfall since the retreat of the glacial ice, resulting in broad talus aprons that reach the margin of the valley floor.
The Headwall Lake trail is less well known than the popular route to Chester Lake on the northwest side of Mount Chester; however, it is just as worth the effort to reach. Beside spectacular views, a full succession of Devonian through Triassic strata is exposed along the trail. The strata dip to the SW, carried in the hanging-wall of the Sulphur

Trailhead: Drive north 18 km on Hwy 842 from Kananaskis Lakes Trail or 45 km south on Hwy 842 from Canmore to Chester Lake parking lot.
Distance: 15 km and about 445 m elevation gain. This is a moderate to challenging hike that requires some careful route finding and includes steep and rough trail sections with ascent of muddy, boulder-covered and rooted intervals. The trailhead is near Chester Lake trailhead toilets and the first portion is along a series well-defined cross-country ski trails. A trail map is strongly advised. Proceed SE on the blue-signed trail above the parking lot. At 1.4 km turn left at a T-intersection with a logging road (trail with yellow and blue markers). Another 900 m along, stay to the right on the trail marked by yellow signs. You will pass an intersection with the orange-signed trail at 500m but keep straight. This trail will cross a bridge and proceed upstream before swinging right and ascending a steep hill. Near the top of the hill is a cairn on the left near a “caution downhill sign.” The cairn (and orange flagging) marks the trail to Headwall Lakes. Sections of the trail are narrow but it is easy to stay on track from here and make your way up the valley.
Mountain Thrust, a major fault that can be traced about 300 km in a NNW-SSE direction from Jasper to Kananaskis Country. The Sulphur Mountain Thrust is exposed east of the trail end, on the northeastern side of The Fortress (a popular climbing destination). The parking lot trailhead starts just east of the Bourgeau Thrust, which runs parallel to and a few hundred metres west of Hwy 842. Underfoot at the start of the trail, and largely undercover, is tightly folded Triassic in footwall of the Bourgeau Thrust. When the Headwall Lakes trail first emerges from the forest at the foot of a vast talus slope (on your right) you will have a good view of the normally recessive reddish brown weathering (but dark grey when fresh) siltstone and shale of the Sulphur Mountain Formation (Triassic Spray River Group) on Mount Chester to your left. You can
(Continued on page 31...)

RESERVOIR ISSUE 02 • FEBRUARY 2015 29
As you exit from the forest, you have a view southeast to an unnamed peak attached to Mount James Walker. There the Etherington, Spray Lakes, Ishbel, and Spray River groups are exposed in varying degrees. Inset left: horn coral with septa (thin walls radiating towards centre. Inset right: view eastwards of ascent to lower Headwall Lake.
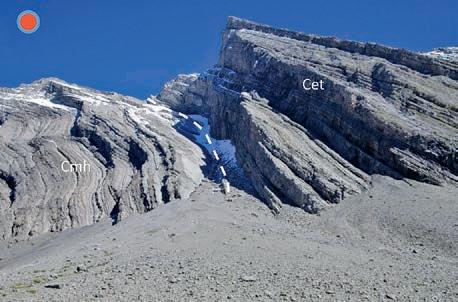
The well-bedded strata on the SE side of talus-filled ravine represent the Opal and overlying Carnarvon members of the Mount Head Formation. These are capped by the darker, and mainly cliff forming Etherington Formation (lower recessive Daisy Creek, and overlying cliff-forming Cyclamen and Ewin Creek members).
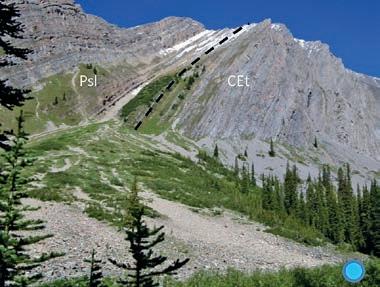
Karsted landscape on approach to Upper Headwall Lake. Fractures created as the strata were carried in the hanging-wall of the Sulphur Mountain Thrust have been enhanced by preferential dissolution upon surface exposure. The upper lake drains into the lower through this network.
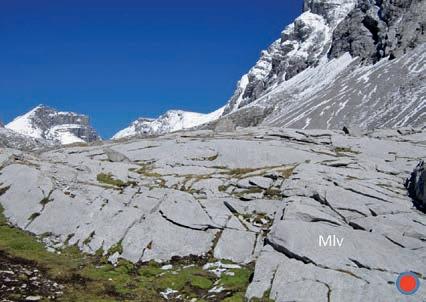
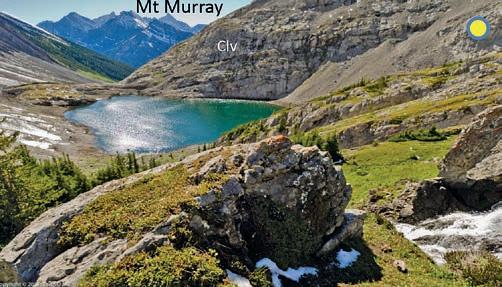
Above Left: Carbonates of the Middle and Late Mississippian Etherington Formation (Cet) and overlying sandstone dominated Lower and Middle Pennsylvanian Spray Lakes Group (Psl) on Mount Chester.
Above right: view down towards Lower Headwall Lake with Mt Murray across the valley in the distance.
Right: broadly folded carbonates of the Livingstone, Mount Head and Etherington formations above a large talus slope on the south side of the valley. The steeply dipping beds in concert with glacially scoured, steep valley walls have resulting in large talus slopes.
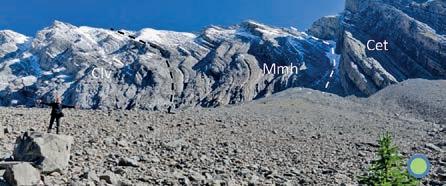
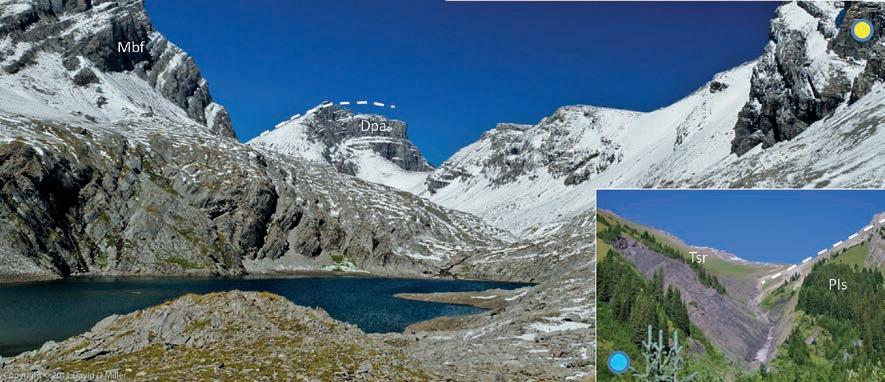 Upper Headwall Lake, view of folded strata in the hanging-wall of the Sulphur Mountain Thrust. Devonian Palliser (Dpa) to Banff (Mbf) are exposed in the vicinity of the lake. Inset shows recessive shales and siltstones of the Triassic Spray River Group resting on the Permian Ishbel Group on SW side of Mount Chester.
30 RESERVOIR ISSUE 02 • FEBRUARY 2015
scramble up Mount Chester to examine these deepwater deposits.
Along the southeast side of the valley, you will see beautiful exposures of Triassic to Devonian strata (their locations are best illustrated in the accompanying photographs). As it makes best sense to discuss the stratigraphy from the stratigraphic bottom to top, we will start with the view at the end of the trail and with the oldest rocks – the limestone of the Devonian Palliser Formation which rolls over in view of the Upper Headwall Lake. It is overlain by the black organic-rich shale of the latest Devonian to earliest Mississippian Exshaw Formation (best seen in the pass connecting the valley of Headwall Lakes with that of Chester Lake) and the overlying bedded chert, black shale, and carbonate beds of the much thicker Early Mississippian Banff Formation. The abundant chert in the lower Banff was derived from opal in the numerous siliceous sponge spicules in the formation, which were dissolved and re-precipitated as chert. Sponges were very common in the late Paleozoic but in the fossil record are often known only from their needlelike spicules, which provided structural support to the living sponges.
In the valley of Chester Lake, the Banff contains a steep-sided erosional truncation surface interpreted to be a submarine paleo-canyon (Richards et al., 1999). The truncation surface is overlain by a thick succession of coarse, metre-
scale debris-flow blocks capped by cherty thinbedded, mudstone and grainstone. The rest of the upper Banff (easily accessed at the eastern margin of the upper Headwall) consists of sharp-based fining upwards cycles of grainstone to cherty siltstone, possibly channels in a submarine-slope sediment transport system (Richards et al.,1999). Between the upper and lower Headwall lakes, the strata underfoot is the Mississippian Livingstone Formation. Beds in this interval include chert-rich dolostone and cross-stratified grainstone composed of crinoid, bryozoan, brachiopod, and coral debris. The overlying Middle Mississippian Mount Head Formation consists of the Opal and Carnarvon members comprised of thin to medium-bedded, recessive cherty lime packstone to wackestone, platy marlstone and limestone containing numerous solitary and colonial corals.
The Middle and Late Mississippian Etherington Formation overlies the Carnarvon Member of the Mount Head. In ascending order, the Etherington comprises four members: 1) the thin, recessive Daisy Creek member (green to gray shales, nodular pedogenic mudstones, and siltstone, 2) the thicker cliff-forming limestone of the Cyclamen member (skeletal lime packstone, wackestone, and grainstone), 3) Ewin Creek member (sandy to silty dolostone and limestone, sandstone, and greenish paleosols), and 4) the Todhunter Member (lower trough cross-bedded shoreface sandstones overlain by sandy limestone and dolostone with abundant

silicified brachiopods and siltstone). A subtle unconformity separates the Todhunter from the overlying Pennsylvanian Spray Lakes Group (Psl). In ascending order, the Spray Lakes Group comprises the Tyrwhitt, Storelk, Tobermory, and Kananaskis formations. The lower three formations are dominated by sandstone deposited in neritic to shoreline and coastal dune settings, whereas the Kananaskis is mainly cherty dolostone. Marine portions often exhibit bioturbation or contain silicified brachiopods. The Permian Ishbel Group (PIsdolostone of Johnston Canyon Formation and overlying bedded chert of Ranger Canyon Formation) unconformably overlie the Spray Lakes Group. Recessive black shale and buffweathering siltstone and sandstone of the Triassic Spray River Group unconformably overlie the Permian strata.
References:
McMechan, M.E., 1995. GSC Map 1965A, Rocky Mountain Foothills and Front Ranges in Kananaskis Country.
Richards, B.C., Mamet, B.L., and Bamber, E.W., 1999. Uppermost Devonian and Carboniferous Sequence Stratigraphy. Biostratigraphy and Basin Development, Banff Region, Southwestern Alberta, Field Trips 4-7 and 17 of XIV International Congress on the Carboniferous and Permian, August 1999, Calgary, Alberta.
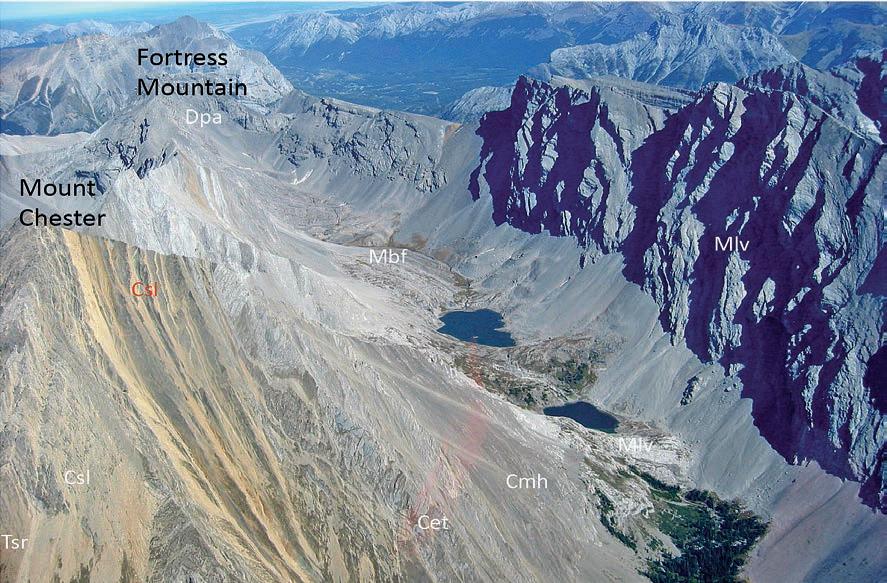 Aerial view of Headwall Lake (photo source WikiCommons, courtesy of Kevin Lenz. Buff and Black strata in foreground belong to the Triassic Spray River Group.
RESERVOIR ISSUE 02 • FEBRUARY 2015 31 (...Continued from page 29 )
GEOMODELING: A Team Effort to Better Understand Our Reservoirs
| By Thomas Jerome, Reservoir Modeling Manager, RPS, Calgary, AB
INTRODUCTION
I’m a geologist by background and a reservoir modeling fanatic at heart.
My university in France is a center of excellence for reservoir modeling. It gave me the opportunity to specialize in this domain early in my career. It was about 15 years ago. Since 2008, and for the last seven years, I’ve practiced my art as a consultant in Calgary.
The first important lesson I’ve learned is that the models were better when everyone in the team understood what we wanted to achieve and how they could help. The second important lesson I’ve learned is that, unfortunately, many of my co-workers didn’t know enough about reservoir modeling. To be fair, I probably didn’t know as much about their work either and I should have!.
The series I’m starting today aims at providing solutions to these problems.
I’ll describe, month after month, what reservoir modeling is all about. My goal is to give some practical ideas on what the role of every type of expert (geoscientist and engineer) is in a modeling project.
And again to be fair, I solemnly promise to the people I’ll work with in the future that I will continue learning more about their own specialities and about how I can help them better. Coffee is on me if you catch me not caring about your work!
LEARNING ABOUT RESERVOIR MODELING
Calgary has a lot to offer for reservoir modeling beginners and experts alike, and I believe this will continue to grow in the coming years.
I had an opportunity to attend the two Gussow Conferences on geomodeling, organized by the CSPG, in 2011 and in 2014. Both were great successes! Many experts from Calgary, from other parts of Canada and from other countries, gathered to listen to highquality presentations. I can’t thank enough the organizers of these two events.
These conferences were great places to promote geomodeling. They were perfectly in line with what the Geomodeling Division of the CSPG has been doing in Calgary for years now: organizing free monthly talks, as well as annual sessions at the GeoConvention, to give a place for reservoir modeling experts to gather and learn. I also thank deeply everyone who ever got, or will get, involved in this Division. Thank you for your efforts. I know that your work is very much appreciated by our community.
All these presentations allow experts like me to increase their skills. Each talk tells me something more about how other geomodelers are integrating the numerous types of data available to them and how their models help their team make better decisions about their reservoir.
Those who want to become experts in reservoir modeling have also many resources available in Calgary. They can/should learn how to use the diverse geomodeling packages available to us. They can/should also take modeling courses such as those organized by the CSPG.
REACHING OUT TO NON-SPECIALISTS
CSPG events and conferences are most often attended only by people already interested in reservoir modeling. It is unfortunate, but quite normal: engineers are the main audience of engineering talks, as are petrophysicists to presentations about petrophysics.
Also, while courses such as “Geophysics for Non-Geophysicists” or “Engineering for Geoscientists” exist, I’m not aware of anything equivalent for geomodeling.
I came to think that a series on “reservoir modeling for non-reservoir modelers” in the Reservoir magazine might be an additional way to reach out to geoscientists and engineers who are currently not drawn to attend to geomodeling presentations.
Of course, I can only reach out to people reading the magazine Reservoir… and, while I know that I don’t open magazines about engineering or petrophysics as often as I should, chances are that many in your teams don’t open the Reservoir as much as they should either.
For that reason, I will require your help. If you like this series and if you think it could benefit your whole team, share it with your colleagues and let’s Reach Out To Non-Specialists together!
FORMAT OF THE SERIES
I will publish one article monthly until the end of 2015. Some of my colleagues in RPS and/or some of my contacts will co-author the papers with me.
This series is meant for every geoscientist and engineer working in the oil and gas industry. Reservoir modelers will probably find the content too general for them but I encourage them to read it nevertheless. It might give them some ideas on how non-specialists perceive what we do.
While being published in the magazine of the CSPG, this series is not meant exclusively for geologists. The link between reservoir modeling and geology will be described, but the articles will also include topics related to petrophysics, geophysics and diverse aspects of engineering.
The fundamentals of reservoir modeling are, more or less, the same for every type of reservoir. I believe that a significant part of what I will present in this series can be applied everywhere. My goal is to introduce some practical concepts, with as little theory as possible. Each paper will suggest where the reader can read more about each topic.
SERIES OVERVIEW
The series is structured in four parts.
Firstly, I’ll explain what reservoir modelers are doing.
In March, I’ll build a model of the Teapot dome oil field in the U.S. I’ll give an overview of a typical reservoir modeling workflow, from gathering data to building the threedimensional grid. This dataset being public, anyone interested will be able to redo some this work himself.
32 RESERVOIR ISSUE 02 • FEBRUARY 2015
In April, I’ll cover the fundamentals of statistics and geostatistics as applied to reservoir modeling. I’ll explain those mathematicallycomplex topics with as few equations as possible. I’ll focus on practical issues such as bias in the data and the impact of trends in modeling. I’ll also insist on the importance of taking uncertainty into account, something for which both statistics and geostatistics are very strong at. Moving forward in this series, uncertainty management will be a transversal aspect of every article.
In the second part, I’ll focus on what geoscientists can bring to a reservoir modeling project.
In May, the article will focus on how geologists and reservoir modelers can work together. Often, the reservoir modeler is the geologist, but not always. Among other things, the article will insist on how geologists must make sure that their understanding of the geological environment is incorporated into the model. Using geological hypotheses to make sense of the data is crucial. Diverse aspects of uncertainty will be discussed as well.
In June, we’ll talk about petrophysics. Petrophysicists are providing the logs we need as input for our models (v-shale, porosity, water saturation…). Recently, reservoir modelers have started asking more of their petrophysicists. We want to understand what uncertainties the petrophysicists faced when creating their logs and we want to incorporate these uncertainties in our reservoir models.
In the double issue of July/August, we’ll have a look at geophysics. Geophysical data is essential to give some insight about what is happening between the wells. Geophysicists must make sure that their data is properly used in the geomodel. This paper will discuss aspects such as time-depth conversion and the associated uncertainties in velocity modeling. It will also discuss how seismic inversion can be used as an input to geostatistical algorithms.
In the third part, I’ll explain how engineers can be involved in reservoir modeling.
In September, I’ll start with reservoir engineers. Reservoir engineers are often those for whom the reservoir model is created in the first place. They need it for tasks such as flow simulation and history matching. Traditionally, they don’t get involved in the modeling though, they just receive the model once completed. Experience has shown that much better results can be achieved if engineers ask to get involved in the modeling process itself. Among other things, it will allow them to better understand the uncertainty embedded in the reservoir
model they receive, and how they can take this uncertainty into account in their studies.
In October, I’ll have a look at how reservoir modeling can be used as input for reserve computations. Companies are not reporting a single number for their reserves anymore. They report a range of volumes (P10P50-P90). The range captures the uncertainty they have about everything from future taxes to production costs. Reservoir models can be of great help, as good models capture the uncertainty about the reservoir that the team has identified.
In November, I’ll discuss about production engineering. I’ll explain how using a good presentation of the reservoir can lead to better results in the modeling of natural fractures and hydraulic fractures, two aspects of our reservoirs on which production engineers work more and more.
At last, I’ll discuss about the role of asset team managers.
In December, it will be time to conclude this series by discussing how asset managers influence modeling projects. I’m convinced that better communication leads to better models...and good communication within a team starts with its manager. I’ll review some aspects of team and project management that I found useful through the years. This last paper will be also the occasion to summarize the main points developed in the series.
WHILE WAITING FOR THE NEXT ISSUE…
Feel free to email me if you have questions about what has been presented so far or what will be presented next. As the series will run for a year, I might have time to include some of your comments and/or some of my answers into a future article.
I’m looking forward to have you as a reader next month.
BIOGRAPHY
Thomas Jerome (jeromet@rpsgroup.com) graduated from the Nancy School of Geology in France in 1999 with a Master degree in Engineering and Earth Sciences. A Geologist by background, Thomas specialized early on in geomodeling. He first worked 5 years in the GOCAD Research Group located in Nancy. As an employee of Earth Decision and Paradigm, Thomas continued, for the next three years, with onsite geomodeling consulting at Saudi Aramco. In 2008, Thomas moved to Calgary and to RPS in 2011. Now, as Manager of the Reservoir Modeling team in RPS, he is working on various projects with Petrel, SKUA and GOCAD. Thomas has close to 15 years of geomodeling experience with conventional and unconventional reservoirs, the last 7 years focusing largely on Western Canadian reservoirs. His current interests are in improving the integration of geomodeling in waterflood and fracking studies and in improving workflows applied to oil sands reservoirs.
Every April and October in Calgary
Details / Registration at www.spec2000.net/00-coursedates.htm
NARRATED MULTI-MEDIA SELF STUDYCOURSES
Slide Shows, Reference Manuals, and Exercises Included AV-01 Practical Quantitative Log Analysis
AV-02 Advanced Quantitative Log Analysis
AV-03 Analysis of Unconventional Reservoirs
Details / Order Online at: www.spec2000.net/00-av-training.htm
Single-User, Corporate, and Academic Licenses Available Individual Reference Manuals and Slide Shows Available Separately
CRAIN’S PETROPHYSICAL HANDBOOK ONLINE
Shareware Petrophysical Encyclopedia at www.spec2000.net
50+ Years Of Experience At Your Fingertips
=== E. R. (Ross) Crain. P.Eng. 1-403-845-2527 ross@spec2000.net
RESERVOIR ISSUE 02 • FEBRUARY 2015 33
CRAIN’S LOG ANALYSIS COURSES
PRACTICALQUANTITATIVE LOG ANALYSIS
For Engineers, Geologists, Geophysicists, and Technologists
===
CORPORATE SUPPORTERS
CL Consultants
Exova Canada Inc
Enviro-Tech Surveys Ltd
Pulse Seismic Inc
Canada Brokerlink Inc.
Energy Navigator
Golder Associates
Nalcor Energy
Paramount Resources
EDGE Technologies
Belloy Petroleum Consulting
GeoSpace Technologies
Sigma Explorations
Canacol Energy Ltd.
Earth Signal Processing Ltd
Explor
Japan Canada Oil Sands Ltd.
McDaniel & Associates Consultants Ltd.
Sproule International Limited
Target Data Ltd.
Petrocraft Products Ltd.
Spectrum
RIGSAT Communications
Birchcliff Energy Ltd.
Cabra Enterprises Ltd.
Cougar Consultants, Inc.
SAExploration
Serpa Petroleum Consulting Ltd.
Glacier Exploration Surveys
Matrix Solutions Inc.
Sensor Geophysical Ltd.
Cossack Land Services Ltd.
Deloitte Petroleum Services Group
EPI Group
FMQ Southern Exploration
GeoChemTech Inc.
Geotir
Hurry Hydrocarbons
Maxam Seismic Explosives
NExT- A Schlumberger Company
Petrel Robertson Consulting Ltd.
Statcom Ltd.
HEF Petrophysical Consulting Inc.
Caracal Energy Inc.
Regent Resources
Bankers Petroleum Ltd.
BJV Exploration Partnership
SOCO International
3e Royalties
Bengal Energy
Bounty Developments Ltd.
Brasoil Corp.
Bukit Energy
Central European Petroleum Ltd
DualEx Energy International
Franconia Geoscience
Gran Tierra Energy Inc.
International Petroleum Consulting
Jenner Geoconsulting Inc.
Korean National Oil Company
Long Reach Resources Ltd.
Lorne LeClerc & Associates
Madison Petrogas Ltd.
Petroamerica
Serinus Energy
Sherritt International Corporation
Skyhawk Exploration
Tretio Exploration Ltd.
Valeura Energy
As of January 7, 2015
THE 5TH ANNUAL –Young Geoscientists
Networking Reception took place October 30th, 2014 at The Garage Sports Pub in Eau Claire. With over 200 guests stopping in to network and share a drink or two, the event was a huge success!
The annual event is held in an effort to increase networking opportunities and provide an informal introduction between experienced and new-to-the industry geoscientists. The exposure to mentorship opportunities and CSPG involvement
CSPG
options are two major reasons for attendance. CSPG has recently brought on a new Director (Ryan Lemiski) who is overseeing Young Professional activities. Along with joint society events, we hope to have more events for our younger members. If you have any ideas for such events or would like to volunteer for a position on the newly formed Young Professionals Committee, please contact Ryan at youngprofessionals@cspg.org.
Thanks the Committee and our Generous Sponsors for the Event:
EVENT SPONSOR


34 RESERVOIR ISSUE 02 • FEBRUARY 2015
PREMIER
BOOTH SPONSOR
GOLD SPONSOR
BRONZE SPONSORS

NEW ISSUE OF THE BULLETIN
NEW ISSUE OF THE BULLETIN ISSUE
ISSUE CONTENTS
New contributions in Baffin Bay/Labrador Sea petroleum exploration and development geoscience
- J.W. HaggartForeword
The shallow stratigraphy and geohazards of the Northeast Baffin
Shelf and Lancaster Sound
- R. Bennett, D.C. Campbell and M.F.A. Furze
Saglek Basin in the Labrador Sea, east coast Canada; stratigraphy, structure and petroleum systems
- C.D. Jauer, G.N. Oakey, G. Williams and J.B.W.H. Wielens
Sedimentary successions and palynoevent stratigraphy from the non-marine Lower Cretaceous to the marine Upper Cretaceous of the Nuussuaq Basin, West Greenland.
- G.K. Pedersen and H. Nøhr-Hansen
New insights into the stratigraphy and petroleum potential of the Baffin shelf’s Cretaceous rocks
- B. MacLean, G. Williams and S. Zhang
Basin evolution in the Davis Strait area (West Greenland and conjugate East Baffin/Labrador passive margins) from thermostratigraphic and subsidence modelling of well data: Implications for tectonic evolution and petroleum systems
- E.D. McGregor, S.B. Nielsen and R.A. Stephenson
Provenance study of Paleocene and Cretaceous clastic sedimentary rocks from the Davis Strait and the Labrador Sea, based on U-Pb dating of detrital zircons
- K. Thrane
Check out the newest issue online by logging in via the Members Only link at www.cspg.org
OF
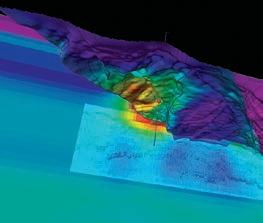
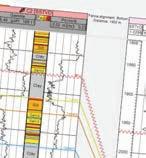
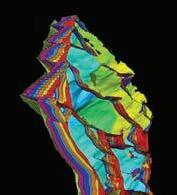
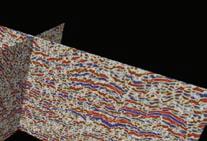
Blueback Reservoir the preferred and chosen GeoScience Solutions Partner Try something new. Find something better. Blueback Rock Physics plug-in for Petrel* Bridging the gap between geology and geophysics The complete suite of rock physics tools for quantitative interpretation across multiple domains within Petrel. Blueback Reservoir blueback-reservoir.com E sales@blueback-reservoir.com | T +1 403 538 4821 blueback-reservoir.com/rockphysics *Mark of Schlumberger 4000 5000 6000 8000 9000 10000 11000 12000 7000 13000 14000 15000 16000 Acoustic impedance (kP a.s/m) 17000 1.4 1.5 1.7 1.6 P/S velocity ratio 1.8 1.9 2.0 2.1 2.2 2.3 2.4 2.5 2.6 2.7 2.8 Por=0.4 Por=0.35 Por=0.3 Por=0.25 Por=0.2 Por=0.15 Por=0.1 Vol shl=0.6 Vol shl=0.4 Vol shl=0.2 Reservoir Properties
Wells Petrel
