
14 ChromaStratigraphy® Quantitative Analysis of Geologic Samples Using Colour 23 Go Take a Hike 28 CSPG Student Industry Field Trip (SIFT) 2014 $10.00 DECEMBER 2014 VOLUME 41, ISSUE 11 Canadian Publication Mail Contract – 40070050
#110, 333 – 5th Avenue SW Calgary, Alberta, Canada T2P 3B6
Tel: 403-264-5610
Web: www.cspg.org
Please visit our website for all tickets sales and event/course registrations
Office hours: Monday to Friday, 8:00am to 4:30pm
The CSPG Office is Closed the 1st and 3rd Friday of every month.
OFFICE CONTACTS
Membership Inquiries
Tel: 403-264-5610
Email: membership@cspg.org
Technical/Educational Events: Biljana Popovic
Tel: 403-513-1225 Email: biljana.popovic@cspg.org
Advertising Inquiries: Emma MacPherson
Tel: 403-513-1230 Email: emma.macpherson@cspg.org
Sponsorship Opportunities: Candace Seepersad
Tel: 403-513-1227 Email: candace.seepersad@cspg.org
Conference Inquiries: Kelsey Thompson
Tel: 403-513-1233 Email: kelsey.thompson@cspg.org
CSPG Educational Trust Fund: Kasandra Amaro
Tel: 403-513-1234 Email: kasandra.amaro@cspg.org
Accounting Inquiries: Eric Tang
Tel: 403-513-1232 Email: eric.tang@cspg.org
Executive Director: Lis Bjeld
Tel: 403-513-1235, Email: lis.bjeld@cspg.org
EDITORS/AUTHORS
Please submit RESERVOIR articles to the CSPG office. Submission deadline is the 23rd day of the month, two months prior to issue date. (e.g., January 23 for the March issue).
To publish an article, the CSPG requires digital copies of the document. Text should be in Microsoft Word format and illustrations should be in TIFF format at 300 dpi., at final size.
Technical Editor
Hugh S. Mosher
Nunaga Resources Ltd.
M.: 403-809-9997
Email: hsmosher@telus.net
CSPG Coordinating Editor
Emma MacPherson, Communications Coordinator, CSPG Tel: 403-513-1230, emma.macpherson@cspg.org
The RESERVOIR is published 11 times per year by the Canadian Society of Petroleum Geologists. This includes a combined issue for the months of July and August. The purpose of the RESERVOIR is to publicize the Society’s many activities and to promote the geosciences. We look for both technical and non-technical material to publish. The contents of this publication may not be reproduced either in part or in full without the consent of the publisher. Additional copies of the RESERVOIR are available at the CSPG office. No official endorsement or sponsorship by the CSPG is implied for any advertisement, insert, or article that appears in the Reservoir unless otherwise noted. All submitted materials are reviewed by the editor. We reserve the right to edit all submissions, including letters to the Editor. Submissions must include your name, address, and membership number (if applicable). The material contained in this publication is intended for informational use only. While reasonable care has been taken, authors and the CSPG make no guarantees that any of the equations, schematics, or devices discussed will perform as expected or that they will give the desired results. Some information contained herein may be inaccurate or may vary from standard measurements. The CSPG expressly disclaims any and all liability for the acts, omissions, or conduct of any third-party user of information contained in this publication. Under no circumstances shall the CSPG and its officers, directors, employees, and agents be liable for any injury, loss, damage, or expense arising in any manner whatsoever from the acts, omissions, or conduct of any third-party user.
Designed and Printed by The Data Group of Companies, Calgary, Alberta.
FRONT COVER
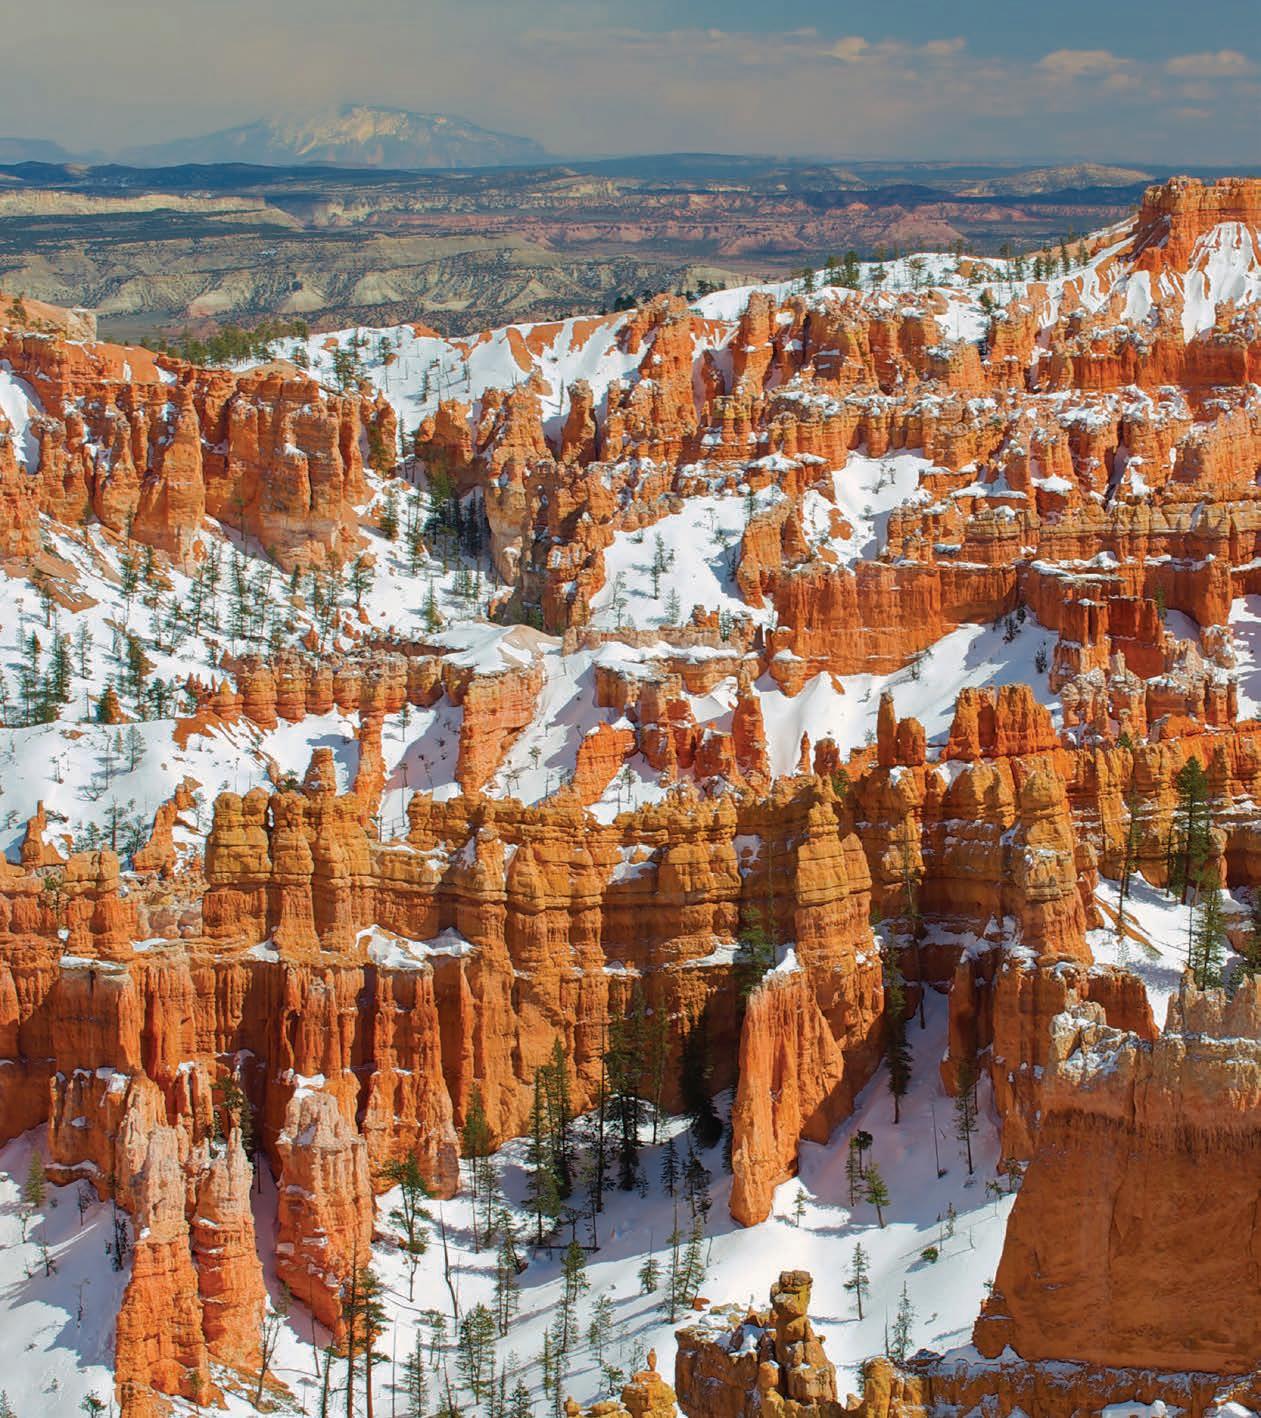
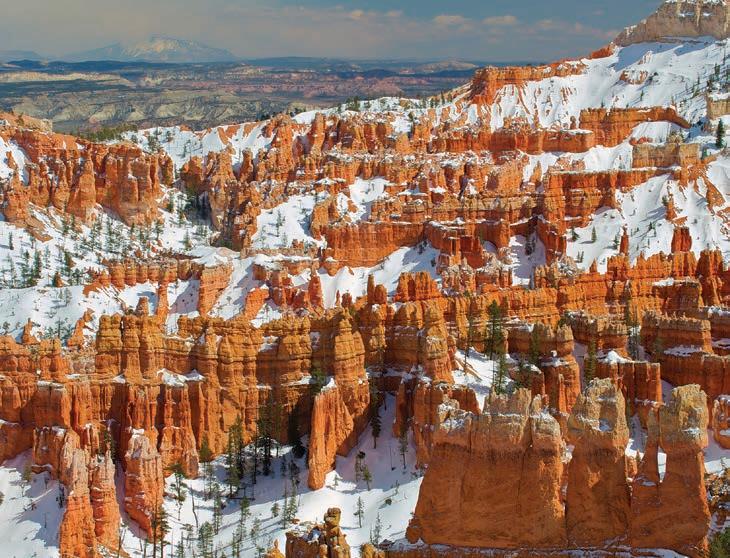
Eocene-aged limestones of the Claron Formation in Bryce National Park, Utah. Chemical weathering and frost-wedging are responsible for the characteristic weathering patterns of the fins, windows and hoodoos at Bryce. Resistant interbedded layers of mudstones, conglomerates and siltstones provide protective capstones for these features. Bryce Canyon forms the upper-most, youngest, part of the Grand Staircase which begins in the Grand Canyon. Photo by Gerard Thompson.
RESERVOIR ISSUE 11 • DECEMBER 2014 3 DECEMBER 2014 – VOLUME 41, ISSUE 11 ARTICLES ChromaStratigraphy® Quantitative Analysis of Geologic Samples Using Colour 14 The Book that Changed the CSPG 21 Go Take a Hike .............................................................................................................................. 23 Oils Sands and Heavy Oil Symposium, A Great Success! 26 CSPG Student Industry Field Trip (SIFT) 2014 28 Honorary Member – Craig Lamb ............................................................................................ 30 DEPARTMENTS Message from the Board .......................................................................................................... 5 Technical Luncheons 9 Division Talks ............................................................................................................................ 11 Rock Shop 13
CSPG OFFICE


CSPG BOARD
PAST PRESIDENT
Paul MacKay • Shale Petroleum Ltd. pastpresident@cspg.org Tel: 403.457.3930
PRESIDENT Dale Leckie president@cspg.org
PRESIDENT ELECT
Tony Cadrin • Journey Energy Inc. presidentelect@cspg.org Tel: 403.303.3493
FINANCE DIRECTOR
Gord Stabb • Durando Resources Corp. directorfinance@cspg.org Tel: 403.819.8778
FINANCE DIRECTOR ELECT
Astrid Arts • Cenovus Energy directorfinanceelect@cspg.org Tel: 403.766.5862
DIRECTOR
Alexis Anastas • Nexen Energy ULC education@cspg.org Tel: 403.699.4965
DIRECTOR
Andrew Fox • MEG Energy Corp. outreach@cspg.org Tel: 403.770.5345
DIRECTOR
Milovan Fustic • Statoil Canada Ltd. publications@cspg.org Tel: 403.724.3307
DIRECTOR
Michael LaBerge • Channel Energy Inc. memberservices@cspg.org Tel: 403.301.3739
DIRECTOR
Robert Mummery • Almandine Resources Inc. affiliates@cspg.org Tel: 403.651.4917
DIRECTOR
Weishan Ren • Statoil Canada Ltd. conferences@cspg.org Tel: 403.724.0325
DIRECTOR
Darren Roblin • Kelt Exploration corprelations@cspg.org Tel: 587.233.0784
DIRECTOR
Ryan Lemiski • Nexen ULC youngprofessionals@cspg.org
EXECUTIVE DIRECTOR
Lis Bjeld • CSPG lis.bjeld@cspg.org Tel: 403.513.1235
Message from the Board
A message from Gordon Stabb, Finance Director Executive Comment
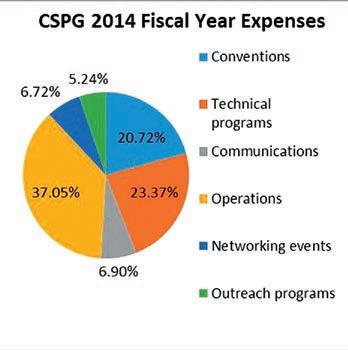
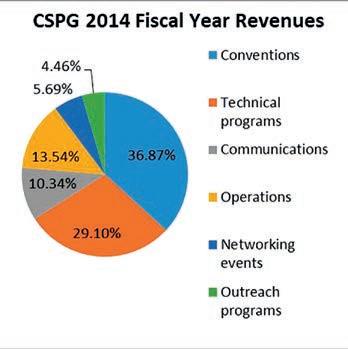
Financial Overview of the CSPG 2014 Fiscal Year
The CSPG 2014 fiscal year was September 1, 2013 through August 31, 2014. Estimated net income was $121,617 which is $85,312 more than budget. The net profit increase above budget was a result of some CSPG events and operational efficiencies out performing budgeted expectations. These included:
1. GeoConvention 2014 – $434,000 net profit to CSPG, $15,340 above budget expectation.
2. Gussow 2013 – $72,542 net profit to CSPG, $40,670 above budget expectation.
3. Continuing Education – $76,404 net profit to CSPG, $44,604 above budget expectation.
4. Royalties from CSPG publications – $44,000 net profit above budget expectation.
5. CSPG Staff – $28,500 less than budget cost.
6. CSPG Exploration Trust Fund grants to CSPG University Outreach were increased to $30,000 from $10,000.
Increased net profit was offset by incurring some unexpected expenses to create the GeoConvention Partnership (45% CSPG, 45% CSEG, 10% CWLS). These included:
1. Legal fees to form the GeoConvention Partnership, $18,020.
2. GeoConvention Partnership estimated first fiscal year loss, $50,000 (preliminary estimate from limited information).
Highlights of the CSPG 2014 financial position included:
1. The August 31, 2014 cash balance was increased by $441,000 compared to the August 31, 2013 cash balance. The increase was primarily due to receipt of GeoConvention 2014 net profit prior to the 2014 fiscal year end and due to deferred revenue from future event registrations.
2. Total net assets of the society were $2.42 million at the 2014 fiscal year end, compared to $2.30 million at the 2013 fiscal year end.
(Continued on page 7...)
RESERVOIR ISSUE 11 • DECEMBER 2014 5

Present the
Annual Holiday Social & Technical Luncheon
Tuesday December 9th, 2014
Wine & Appetizers: 10:30 - 11:30 am
Technical Luncheon: 11:30 - 1:00 pm

Technical Luncheon :
Title: The Marble Canyon fossil deposit, a new “Burgess Shale” treasure-trove from Kootenay National Park
Speaker: Jean-Bernard Caron, Department of Natural History, Royal Ontario Museum

Tickets are available at www.cspg.org
CSPG & geoLogic Systems Ltd.
CORPORATE
SAMARIUM
The
Energy Corp.
Devon Canada Corporation
Tourmaline
Suncor Energy
Seitel Canada Ltd.
SILVER
CGG
Canadian Natural Resources Ltd
Loring Tarcore
MJ Systems
Chinook Consulting
Cabra Consulting Inc.
Arcis Seismic Solutions
CSEG Foundation
Bellatrix Exploration Ltd.
Emerson Process Management
Enerplus
EOG Resources Canada Inc.
Husky Petrosys
BRONZE
Crescent Point Energy
SeisWare
Halliburton
Pro Geo Consultants
ION Geophysical
Roke Technologies Ltd.
Ikon Science Ltd.
Paradigm
Tucker Energy Services Canada
Geovariances
Belloy Petroleum Consulting
Canadian Discovery Ltd.
Talisman Energy
Divestco
Geomodeling Technology Corp
PGS
Telsa
CL Consultants
Pason System
Painted Pony Petroleum Ltd.
AAPG
Earth Signal Processing Ltd
RPS Energy Canada Ltd.
Total Gas Detection Ltd.
Encana Corporation
GLJ Petroleum Consultants Ltd
PLS Inc
RIGSAT Communicationse
Sproule Associates Limited
Streamsim Technologies, Inc.
3. As of its 2014 fiscal year end, the CSPG had invested $90,000 in the GeoConvention Partnership as a 45% owner.
4. An objective of the CSPG Finance Committee was to reduce outstanding debt owed to the CSPG. As of the August 31, 2014 fiscal year end, the CSPG accounts receivable balance had been decreased by $29,300 compared to 2013 fiscal year end accounts
accounts receivable balance was decreased by $16,300 compared to the fiscal mid-year accounts receivable over 90 day balance.
In conclusion, the financial condition of the CSPG at end of the 2014 fiscal year is sound and is in alignment with continuance of the our society mission to advance the professions of the energy geosciences. The robust financial results of the 2014 fiscal year are due in whole to the resolute volunteerism of our society members and to the steadfast dedication of the society’s permanent staff in getting the job done.

When time is money, Wellsite Geoscience is money well spent.
Whether you’re exploring a basin, producing a well or completing a shale play, time is money. That’s why Weatherford Laboratories brings a suite of formation evaluation technologies right to the wellsite. Utilizing mud gas and cuttings, these technologies provide detailed data on gas composition, organic richness, mineralogy and chemostratigraphy in near real time. As a result, operators now have an invaluable tool to assist with sweet spot identification, wellbore positioning, completion design and hydraulic fracturing. We call it Science At the Wellsite. You’ll call it money well spent.
SCIENCE AT THE WELLSITE ™
RESERVOIR ISSUE 11 • DECEMBER 2014 7
SPONSORS
geoLOGIC systems ltd. DIAMOND
Limited APEGA Nexen ULC Cenovus Energy PLATINUM Baker Hughes Schlumberger Canada Limited IHS Global Canada Limited Imperial Oil Resources AGAT Laboratories Shell Canada Limiteds GOLD MEG
CSPG Educational Trust Fund TITANIUM ConocoPhillips Canada
of November 3, 2014 A Special Thanks to Geologic Systems Ltd., CSPG ’s Top Sponsor of the Month.
As
(...Continued from page 5)
www.weatherfordlabs.com ©2013 Weatherford. All rights reserved Formation Evaluation ┃Well Construction ┃Completion ┃Production
WELLSITE
GEOSCIENCE SERVICES

Start your year off right with the 2015 CSPG Geological Calendar Available NOW for 10 dollars! Office: 110-333, 5th Ave SW Phone: 403.264.5610
TECHNICAL LUNCHEONS DECEMBER LUNCHEON
The Marble Canyon fossil deposit, a new “Burgess Shale” treasure-trove from Kootenay National Park
SPEAKER
Jean-Bernard Caron
Department of Natural History Royal Ontario Museum
11:30 am
Tuesday, December 9th, 2014
TELUS Convention Centre MacLeod Hall ABC Calgary, Alberta
Please note: The cut-off date for ticket sales is 1:00 pm, three business days before event (Thursday, Dec. 4, 2014). CSPG Member Ticket Price: $45.00 + GST. Non-Member Ticket Price: $47.50 + GST.
Each CSPG Technical Luncheon is 1 APEGA PDH credit. Tickets may be purchased online at https://www.cspg.org/eSeries/source/Events/ index.cfm.
ABSTRACT
The Burgess Shale is of particular significance to our understanding of the origin and early diversification of marine animals and the establishment of modern ecosystems.
A new 505 million-year old fossil assemblage, about the same age as the famous Burgess Shale deposit in Yoho National Park, near Marble Canyon in Kootenay National Park was recently announced. The new site was discovered by a ROM-led field party during the summer of 2012 and is broadly comparable to the Walcott Quarry in its exceptional diversity and abundance of fossils, and especially for the quality of preservation of soft-bodied animals –animals usually too fragile to fossilize well or at all. It contains many new fossil species not known to science.
Despite its proximity (ca. 40 km) to Walcott’s original locality, the Marble Canyon fossil assemblage is distinct,
and offers new insights into the initial diversification of metazoans, their early morphological disparity, and the geographic ranges and longevity of many Cambrian taxa. The arthropod-dominated assemblage is remarkable for its high density and diversity of soft-bodied fossils, as well as for its large proportion of new species (22% of total diversity). This site is also particularly significant because of its extraordinary wellpreserved and relatively abundant specimens of Metaspriggina, a previously rare and enigmatic taxon known only from Walcott’s Quarry, now reinterpreted as one of the most primitive fossil fishes in the world.
A ROM-led expedition conducted extensive fieldwork activities around Marble Canyon during the summer of 2014. We discovered several additional outcrops suggesting that the fossiliferous beds containing Burgess Shale-type fossils are much more extensive geographically than previously thought. In addition a quarrying operation recovered close to 10.000 specimens and many new species at our 2012-discovery site. This new material will not only help further our understanding of the diversity and composition of marine animal communities that existed during the Cambrian period but also potentially contribute to further our understanding of early animal evolution in fundamental ways.
BIOGRAPHY
In his native France, a ten-year old Jean-Bernard Caron already knew he wanted to become a professional palaeontologist. With experience gained by volunteering his summers with various professional field crews across Europe, he was invited by Desmond Collins, then Curator of Invertebrate Palaeontology at the ROM, to join his 1998 field season at the Burgess Shale. His Master’s thesis dealt with Banffia constricta, one of the most bizarre animals known from the Burgess Shale. This study was followed by a PhD on the taphonomy and paleoecology of the Burgess Shale community. By the end of his PhD project, Jean-Bernard had examined about half the Burgess Shale specimens (more than 70,000 fossils) stored at the ROM. After an NSERC post-doctoral fellowship, he joined the ROM as Associate Curator of Invertebrate Paleontology in early 2006, thus finally fulfilling his long-standing childhood dream.
Jean-Bernard was the recipient of the 2010 Pikaia award from the Canadian Geological Association in recognition of his contribution to the profile of Canadian paleontology through his research. Jean-Bernard received
Webcasts sponsored by

the Paleontological Association Golden Trilobite Award and the Ontario Museum Association Award for Excellence in Publications awards for the Virtual Museum of Canada website on the Burgess Shale (http://burgess-shale. rom.on.ca/en/index.php) that he launched in 2011. He has authored and co-authored many articles in a variety of journals including Nature, Science, Paleobiology and Geology. At present, his main responsibilities are to curate and interpret fossils from the very large ROM Burgess Shale collection as well as to continue fieldwork activities. The ROM collection represents a real Pandora’s Box for science, with many new organisms still to be described. He also studies fossils from other Burgess Shale-type deposits, particularly in China. In addition to his duties at the ROM, Jean-Bernard is an associate professor at the University of Toronto in both the Earth Sciences and the Ecology and Evolutionary Biology departments.
RESERVOIR ISSUE 11 • DECEMBER 2014 9
John Allan: the Founding of Alberta’s Energy Industries
SPEAKER
C. Willem Langenberg
Long Mountain Research Inc.
University of Alberta
11:30 am, Thursday, January 8th, 2014
TELUS Convention Centre
Exhibition Hall D, North Building Calgary, Alberta
Please note: The cut-off date for ticket sales is 1:00 pm, three business days before event. (Monday, Jan 5, 2015). CSPG Member Ticket Price: $45.00 + GST. Non-Member Ticket Price: $47.50 + GST.
Each CSPG Technical Luncheon is 1 APEGA PDH credit. Tickets may be purchased online at https:// www.cspg.org/eSeries/source/Events/index.cfm.
Abstract
This talk is about the recently published book entitled: John Allan and the founding of Alberta’s energy industries. This book of photographs shows us the beginning of Alberta’s energy industries through the eyes of Dr. John Andrew Allan, first Chairman of the Department of Geology at the University of Alberta and first Director of the Alberta Geological Survey. John Allan played a founding role in the development of the mineral resources of Alberta. The pictures tell this story, which will be told again.
The views presented in the book follow John Allan’s fieldwork throughout the province and beyond. They show us what he and his contemporaries saw with their own eyes in times past. They document how he saw the development potential of Alberta’s mineral resources, as do his numerous reports and papers. In a talk on CKUA radio in 1927, he predicted the oil boom which began in 1947 with the discovery of the Leduc oil field. John Allan’s leadership and foresight greatly contributed to the success of the energy industries in Alberta, which changed the fortunes of the Province of Alberta and its citizens.
John Andrew Allan was born in Aubrey, Quebec, in 1884. He studied at McGill University in Montreal and at the Massachusetts Institute of Technology in Boston, where he obtained his Ph.D. in geology in 1912. In this year, four years after the founding of the University of Alberta, Henry Marshall Tory appointed John Allan as the first Professor of Geology at the University. He developed courses in geology and founded the Departments of Geology and Mining Engineering. As Tory envisioned, this appointment helped to define and expand the role of geology in the development of Alberta’s natural resources.
In addition to his work as a Professor of the University of Alberta for thirty-seven years and Chairman of the Geology Department, John Allan was a founding member of the Scientific and Industrial Research Council of Alberta in 1921. He was Director of the Research Council’s Alberta Geological Survey from 1921 until his retirement in 1949. He was also a founding member of the
Canadian Society of Petroleum Geologists (CSPG) in 1927 and the Association of Professional Engineers and Geoscientists of Alberta (APEGA) in 1920; and APEGA’s President in 1930. He continued consulting and advising until his death from heart failure in 1955.
BIOGRAPHY
Willem Langenberg is presently the principal researcher of Long Mountain Research Inc. and an Adjunct Professor at the University of Alberta. Before that, he worked for the Alberta Geological Survey for almost 35 years. He obtained a Ph.D. in structural geology from the University of Amsterdam in the Netherlands in 1972. He was previously employed by the University of Amsterdam, the University of Alberta, Alberta Research Council, Alberta Department of Energy and the Energy Resources Conservation Board.
He has had a longstanding career in structural geology, with emphasis during the last thirty years on economic geology (including energy and mineral resources). He performed the function of Project Control Officer on the inter-governmental Turtle Mountain Monitoring Project from 20032005. He is presently conducting investigations on the geology of Turtle Mountain (Crowsnest Pass), dating of Cretaceous and Tertiary bentonites, Coal-bed methane (CBM) and CO2 Capture and Storage (CCS). He authored or co-authored 35 refereed articles in scientific journals, 4 AGS Bulletins and many AGS reports/maps.
He is a member of APEGA, the Geological Association of Canada, the Canadian Society of Petroleum Geology and the Geological Society of America. He was Publication Manager of the Edmonton Geological Society from 1993-2003.
10 RESERVOIR ISSUE 11 • DECEMBER 2014
JANUARY LUNCHEON Webcasts sponsored by BYPASSED HYDROCARBONS IN CONVENTIONAL AND UNCONVENTIONAL RESERVOIRS Taras Dziuba Integrated Petrophysics Instruction in Log Analysis Combined with Rock Typing 36 years’ experience in finding and evaluating hydrocarbons Course Date: Jan. 14-15, 2015 Course Info: www.tdintegratedpetrophysics.com Phone: 587-581-0126 e-mail: tdziuba@telus.net
TECHNICAL LUNCHEONS
DIVISION TALKS BASS DIVISION
Stratigraphic Insight into Formative DeepSea Channel Processes with Emphasis on Sand Distribution
SPEAKER
Stephen M. Hubbard Department of Geoscience University of Calgary
12:00 Noon
Wednesday, December 3rd, 2014 ConocoPhillips Auditorium, Gulf Canada Square, 401 – 9th Ave. S.W. Calgary, AB
The stratigraphic record of sinuous rivers and submarine channels contains a wealth of information about formative sedimentary processes. For decades fluvial deposits have been considered in the context of processes observed in rivers – the point bar facies model represents a well-established linkage between process and product, for example. This type of direct link has yet to be achieved in the deep-sea as coarse-grained sediment transport cannot be readily monitored due to the challenging physical environment (e.g., water depth, destructive currents). The difficulty in monitoring and measuring sediment transport events in submarine channels, such as turbidity currents, is exacerbated by their sporadic and infrequent nature. Until such time that regular direct observation of turbidity currents is achievable, the stratigraphic record of sediment transfer in the deepsea provides critical and unique insight into processes that shape not only ancient basin margin slopes, but also the present day seascape. Furthermore, the stratigraphic record of individual slope channel systems contain the fingerprint of protracted processes of sediment transfer, on the scale of centuries to millennia, providing insight beyond what can be expected from modern systems.
Sponsored by
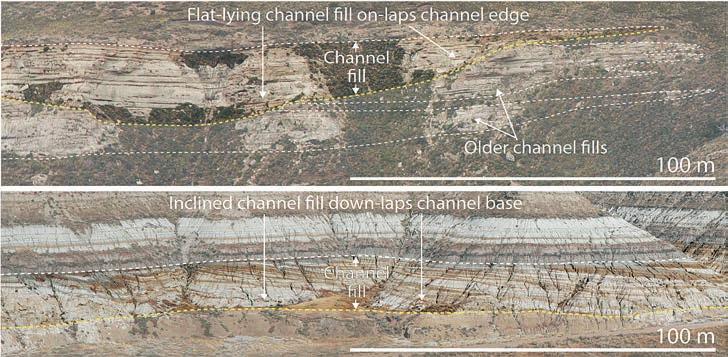
The similarity in sinuous planforms of open, single thread fluvial and deep-sea channels is widely appreciated, however, outcrop characteristics indicate different formative processes. Meandering fluvial systems are most commonly represented by deposits that reflect point bar migration, whereby processes of bank erosion and bar growth are genetically linked. At the bed scale, crossstratification reflects bedload sediment transport and deposition by traction sedimentation. At the reservoir scale, the stratigraphic record is dominated by widespread sandstone-prone sedimentary packages that reflect sustained channel migration and punctuated avulsion across a meanderbelt (Fig. 1). In contrast, the deposits of single thread deep-sea channels are commonly characterized by sandstone-filled channelform bodies, which are characterized by evidence for both traction and suspension sedimentation. Heterolithic thin beds and cross-stratification can be locally preserved above channel bases and against channel margins, but the majority of channel fill comprises tabular sandstone turbidites that bi-directionally lap onto channel edges (Fig. 1). Thick and stratified flows result in elevated aggradation in submarine systems, and a result is vertically stacked channelform bodies that are commonly amalgamated (Fig. 1). The stratal record of submarine channels indicates a distinction between phases of channel maintenance (i.e., erosion, sediment bypass) and phases of substantial infilling with coarse-grained sediment –they are not contemporaneous.
ACKNOWLEDGEMENTS
Funding for this research is provided by sponsoring companies of the Chile Slope Systems industrial consortium (www. chileslopesystems.com), including Anadarko, BG Group, BHP Billiton, BP, Chevron, ConocoPhillips, Hess, Marathon, Maersk, Nexen, Shell, and Statoil.
BIOGRAPHY
Steve Hubbard is an Associate Professor in the Department of Geoscience at the University of Calgary. He is a clastic sedimentologist with recent research emphasizing sediment transfer through channels in both deep-marine and fluvial settings.
INFORMATION
BASS Division talks are free. Please bring your lunch. For further information about the division, joining our mailing list, a list of upcoming talks, or if you wish to present a talk or lead a field trip, please contact either Steve Donaldson at 403-766-5534, email: Steve. Donaldson@cenovus.com or Mark Caplan at 403-975-7701, email: mcaplan@atha.com or visit our web page on the CSPG website at http://www.cspg.org.
RESERVOIR ISSUE 11 • DECEMBER 2014 11
Figure 1. Deep-sea channel deposits from the Magallanes Basin of Chile (Campanian, Tres Pasos Formation) and tidal-fluvial channel deposits from the Alberta Basin (Campanian, Horseshoe Canyon Formation).
DIVISION TALKS STRUCTURAL DIVISION
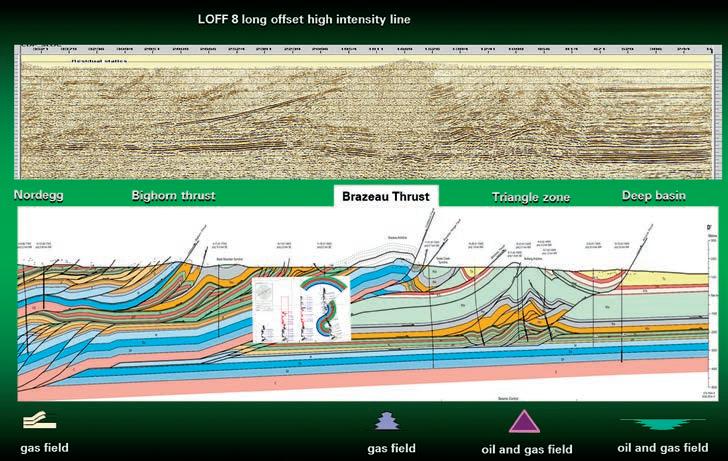
Imaging the Overturned Limb of a Footwall Syncline and its Impact on Exploration in Fold and Thrust Belts
SPEAKER
Andrew C Newson, B.Sc, P.Geol Moose Oils 2014 Ltd.
12:00 Noon
Wednesday, December 4th, 2014
Schlumberger
Second Floor Lecture Theatre
Palliser One Building, 125 – 9 Ave. S.E., Calgary, Alberta
ABSTRACT
LOFF8 is part of a unique experimental seismic program that was shot across the Laramide Structures of the Western Canadian Fold and Thrust Belt expressly to evaluate long offset, high intensity acquisition parameters. It is 52 kilometres long and runs NE to SW across the un deformed sediments of the Western Canadian Sedimentary Basin, the triangle zone, the fold and thrust belt up to the front ranges of the Rocky Mountains themselves.
The interpretation presented is integrated with numerous wells with samples, wireline logs and dipmeter data. It is currently in an active area for conventional and unconventional exploration and crosses numerous oil and gas pools.
In this interpretation we will show an example of a steep and overturned fold limbs imaged in the seismic section. The results of the interpretation clearly validates the use of the acquisition parameters and shows a way forward for imaging steep limbs in fold and thrust belts around the world.
BIOGRAPHY
Andrew Newson has 35 years of experience in the geological and geophysical evaluations of overthrust belts. He is a Professional Geological Consultant registered in the province of Alberta and is currently living in Calgary.
Andrew graduated in 1972 with a B.Sc. (Hon) in geology from London University, England. Since then he has worked as a structural geologist specializing in the exploration and exploitation of hydrocarbon prospects in overthrust belts around the world.
In 1972 he started work in New Zealand working on the overthrust belt of the Taranaki basin. Later, he moved to Canada to work on seismic crews and field mapping projects in the Foothills of Alberta and British Columbia, Yukon and NWT. Since then he has worked domestically and internationally, to develop his expertise in evaluating these complex deformation styles.
Andrew demonstrates the ability to combine a wide range of data and a broad range of experience in determining analogue structures. This he sees as key to the realistic appraisal of these structures. This approach has led to numerous successes working for a variety of oil
and gas companies. These include discoveries in the overthrust belts of the Taranaki basin of New Zealand in 1983 (McKee/ToeToe structure), the Alberta Foothills in 1993 (Moose Mountain) and the BC Foothills in 1991 and 1999 (Sikanni/ Pocketknife).
As a consultant for 20 years, Andrew has been involved with numerous projects for clients among the major, independent and junior oil and gas companies. To facilitate this he incorporated Moose Oils Ltd. in 1993. Through Moose Oils Ltd he teaches in-house workshops on fold and thrust play evaluation techniques and regularly leads field trips for industry to the Canadian Rocky Mountains. He is closely involved in developing balanced cross section and dipmeter analysis software packages to assist in the structural interpretation of fold and thrust plays.
Andrew has been a recipient of numerous awards. Among them was the Canadian Association of Petroleum Geologists’ Link Award in 2000 for his talk “Foothills, The Future for Exploration.” His company Moose Oils Ltd has also received an award from NSERC and the Conference board of Canada for its contribution to the Fold-Fault Research Project.
In addition to his consulting, Andrew has contributed to the industry in several professional associations including the CSPG, CSEG, CIM, SEG, AAPG and PESGB. He is a regular speaker at conferences both domestically and internationally and has undertaken numerous roles such as technical editor, and chairperson for the CSPG structural geology group and conference session chairs. Andrew is also a past chairperson for the Douglas Medal Awards Committee.
12 RESERVOIR ISSUE 11 • DECEMBER 2014
Sponsored by


RockWell Consulting


B
RESERVOIR ISSUE 11 • DECEMBER 2014 13
Data Magnetic & Gravity data for the Western Canadian Basin John W. Peirce, P. Geo. Chief Geophysicist www.chad-data.com 250.616.6914 Wellsite Geologists Inc. the Rock Solid Choice Wellsite Supervision Project Management Graphic Well Profiles Verticals / Horizontals
Sample / Core Studies
/ Un-conventional 1350,
SW
AB
ROCK SHOP CHAD
EUB
Conventional
734 - 7th Ave
Calgary,
T2P 3P8
403.234.7625, www.WellsiteGeologists.com
petrographical & sedimentological descriptions for samples (thin section - fluid inclusion studies) conventional vertical/horizontal wells operations geology SPECIALIZED IN GEOLOGICAL WELLSITE SUPERVISION AND CORE ANALYSIS
C 403.660.9883, info@WellsiteGeologists.com
our best friend and most valuable partner is our client Stephan C. Dragomir president www .g e ok2. c om - phon e : 403.831.9941 - s dr a gomir @ g e ok2. c o m • Domestic and International wellsite supervision • Conventional and Unconventional wells • Extensive Hz experience • Customized corporate solutions available (403) 250-3982 sales@clconsultants.ca www.clconsultants.ca
CHROMASTRATIGRAPHY® Quantitative Analysis of Geologic Samples Using Colour
(Photo: Peschier & Lock, SIPES 2010)
ABSTRACT
The use of colour as a descriptive tool for geologic samples has traditionally relied upon qualifying modifiers such as “light” or “dark” to describe the varied range of rock values and hues. Attempts at more systematic methods have introduced complex descriptive systems, such as Munsell Soil Colour Charts. While these efforts represent improvements, they remain highly qualitative and fail to remove the primary source of poor accuracy and precision: human error. Moreover, these descriptors are not readily converted into a useful tool for visual interpretation and analysis (e.g., well logs). Here we present ChromaStratigraphy®, a quantitative technique for the rapid, reproducible characterization, and correlation of chromatic data in well log format and demonstrate its application to conventional and unconventional resource plays.
Using proper protocols, quantitative chromatic data can be rapidly and reproducibly gathered from rock cuttings (interval samples), core, or outcrop (spot) samples from any region and age. Saturated slurries of pulverized sample and distilled water are photographed under tightly controlled conditions. Raw colour data is extracted from each sample via software and used to calculate an average colour for that depth or interval, and can be equally collected in the laboratory setting or at the rig site for near real-time results. Here we focus on the RGB and HSV colour systems, though others remain suitable. Colour data can be displayed in colour-component form (e.g., Red, Value) to identify absolute deviations, or relative changes through component ratios [e.g., Red/Blue, Red/ (Red + Green + Blue)]. When plotted in well log format, these curves form systematic and predictable changes that can be interpreted and correlated, as with wireline data. A key component of the ChromaLog ® is a graphical display of the reconstructed colour from the measured samples, similar to viewing a core
or outcrop. This powerful image allows for the immediate recognition of facies and formation changes, especially in well studied settings. When integrated with a suite of independent data, a robust Chromastratigraphic framework can be developed allowing the ChromaLog ® profile to be confidently utilized as an interpretative tool. For example, by combining chromatic data with stratigraphic markers (e.g., biostratigraphy), ChromaStratigraphy ® can be used to confirm lithostratigraphic correlations and, under certain circumstances, create chronostratigraphic tie-lines.
BACKGROUND, PROCEDURES, AND OBJECTIVES
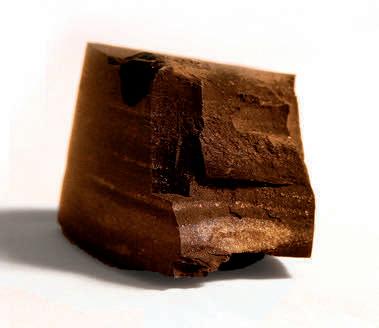
Colour is one of the first observed physical traits of any geologic sample, but has always been described subjectively. At first glance colour can relay considerable information about geologic significance ranging from the inherently intrinsic (e.g., mineralogy) to the inferred (e.g., stratigraphic succession).
Factors that influence the colour of a geologic sample include – but are not limited to:
• Mineralogy
• Lithology – including:
– Grain size
– Cementation
• Geochemistry – including:
– Inorganic (e.g., iron oxides)
– Organic compounds (e.g., TOC),
– Chemical alteration (e.g., redox conditions)
• Thermal history
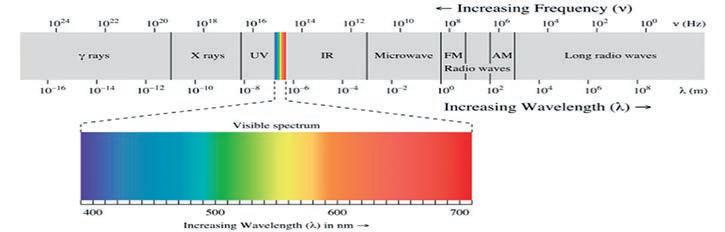
Variations in human perception require a new rigorous approach before the application of colour analysis to geologic samples. Physiologically, the colour is a merging of the spectral sensitivities of the eye’s three cone cells types. These signals constitute perceived visible light (over the short range of near-infrared to near-ultraviolet, 390-750nm) (Figure 2).
Graphical display of colour has traditionally focused on additive models, such as the RGB (Red-Green-Blue) model common in consumer electronics. Other colour systems, including the HSV (Hue-SaturationValue) and CIELAB 1976, are mathematical transformations, and are fully reversible. Here, we apply scientific rigour using the RGB and HSV colour systems, with emphasis on ratios
14 RESERVOIR ISSUE 11 • DECEMBER 2014
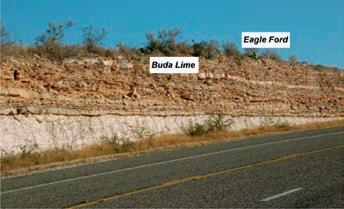
Figure 1. Photograph of an outcrop road cut in Texas featuring the contact between the Eagle Ford and Buda formations. The contact is readily identifiable.
Figure 2. Position of visible light within the electromagnetic spectrum.
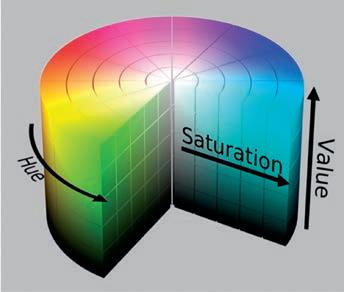
Figure 3. The HSV color system illustrated in cylindrical form. Hue (0-360) is radial, and analogous to the color wheel; Saturation (0-100) is color purity, and Value (0-100) is color intensity. (Wikipedia).
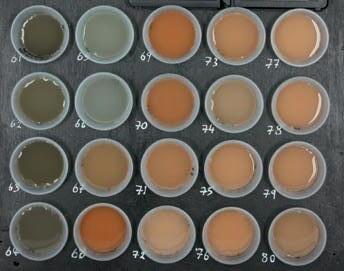
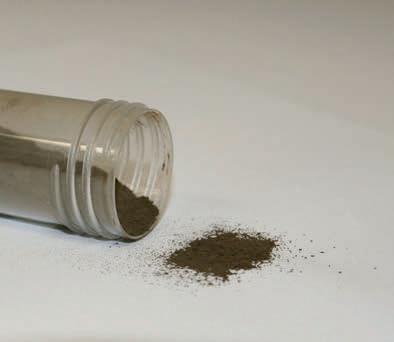
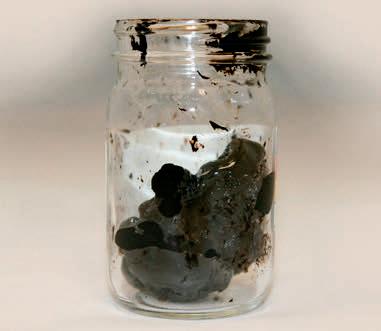
Figure 4. Example of saturated sample slurries illustrating the readily observable changes captured by our sampling methodology. Even in a seemingly homogenous section of black and neutral colored samples, significant changes and gradations are evident. Here, downhole depths increase top to bottom and left to right.
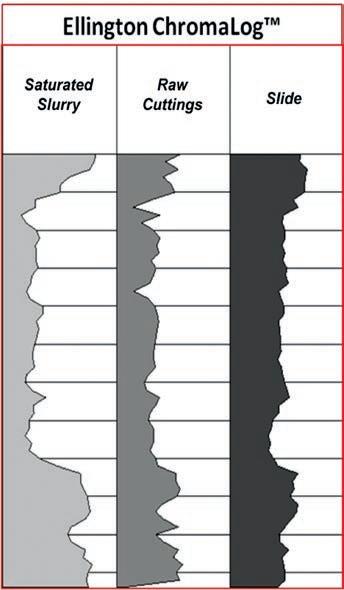
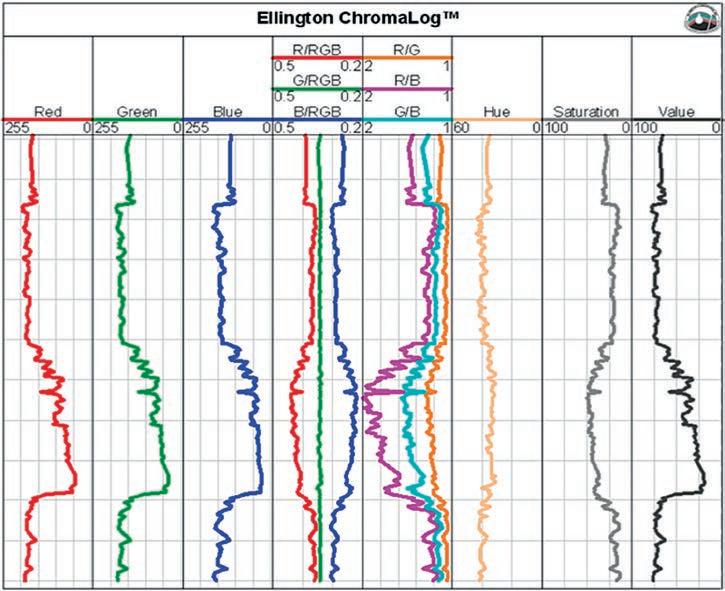
Figure 6. Well log of chromatic components and ratios from the RGB and HSV colour systems. Individual Red, Green, and Blue components from the RGB system are strongly coherent, with intensity related to overall sample darkness. Ratios of the components (where the ‘RGB’ represents the summation of the R, G, and B components) isolate relative differences between the components. In contrast to the similarity of each component in the RGB system, the Hue, Saturation, and Value components each respond differently. The shape of Value mirrors those of the RGB components.
of the RGB components, and Value.
Through extensive experimentation, we have refined our methodology for capturing chromatic data from a geologic sample into a simple, rapid and consistent technique.
A representative sample (1g) is mixed with distilled water (20ml) and pulverized to create a saturated slurry. This slurry is photographed with a digital camera mounted in a custombuilt photo cabinet under tightly controlled
conditions. Using proprietary software, the average colour for each sample is calculated and extracted for post-processing analysis and interpretation. This data is then transformed into well logs, and other advanced metrics for quantifying colour changes.
Our research demonstrates that while the preparation method for the measured sample (i.e., raw cuttings, saturated slurry, or slide) can significantly alter the magnitude of the chromatic response, each preparation
shows consistent shifts. For most samples, the saturated slurry demonstrates a more dynamic response to the range of observed colours (Figure 4).
Our objectives for this technique are twofold:
• Use of digital technology to capture the inherent spectral information in geologic samples.
• Use quantitative techniques to display and correlate this information in an
(Continued on page 16 ...)
RESERVOIR ISSUE 11 • DECEMBER 2014 15
Figure 5. Value data for (L to R) saturated slurry, raw cuttings, and slide preparations. Slurries are preferred for their dynamic range across the observed colors and saturations.
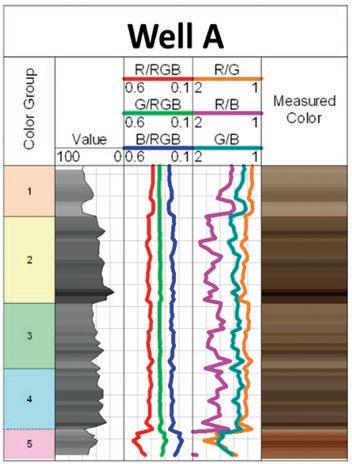
Figure 7. ChromaLog ® with chromatic changes.
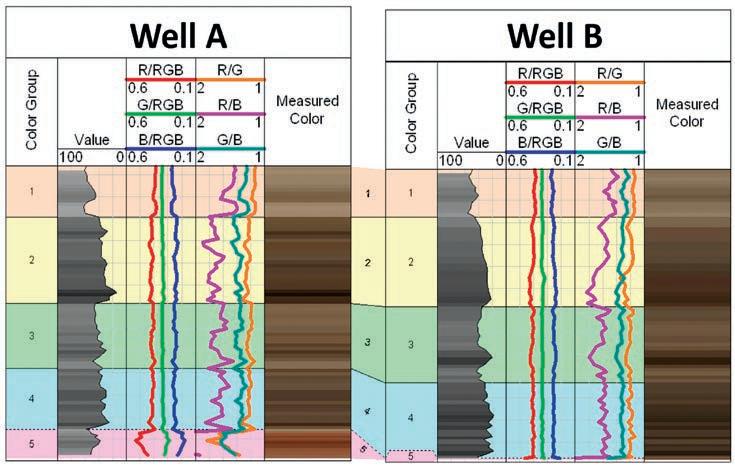
Figure 8. ChromaStratigraphy ® correlation of two ChromaLog ® plots.
(...Continued from page 15)
effective and useful manner (i.e., well logs, multidimensional plots) to aid in geologic exploration, production and understanding.
FROM ROCK SAMPLE TO WELL LOG
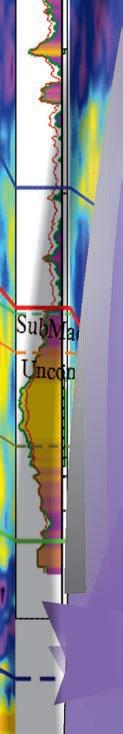
ChromaLog ® well logs are constructed from individual chromatic components and component ratios. Chromatic logs are read similar to other logs from downhole tools, where shifts correspond to changes in geologic properties and significance.
ChromaLog ® analysis allows for the rapid identification and assessment of changing geologic conditions using a visual recreation of the sampled rock section.
Multiple wells allow for detailed ChromaStratigraphy ® correlation on a local to regional basis using quantitative data. Superior results are attained when integrated with supplementary data streams.
FORMATION IDENTIFICATION IN UNCONVENTIONAL PLAYS
Unconventional resource plays (i.e., shale gas and shale oil) are highly productive and have demonstrated the effectiveness of new technologies to optimize efficiency, especially in the placement and steering of the wellbore
16 RESERVOIR ISSUE 11 • DECEMBER 2014
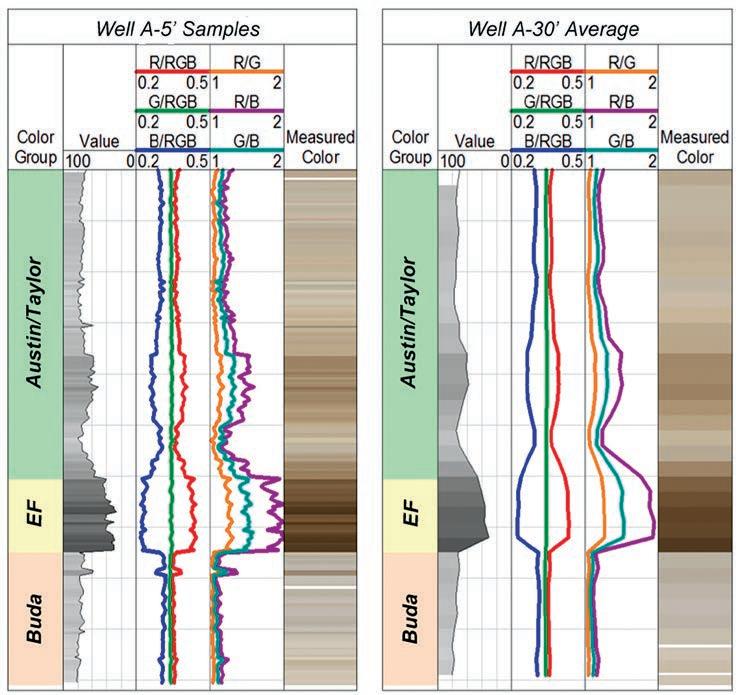
Figure 9. (L) High-resolution 5-foot interval ChromaLog ®. (R) High-res data averaged to 30-foot interval representative of typical cuttings sampling. Very little vertical “smearing” is evident in the samples averaged to 30-feet. Formation tops appear to be largely independent of sampling density, though some detail is lost.
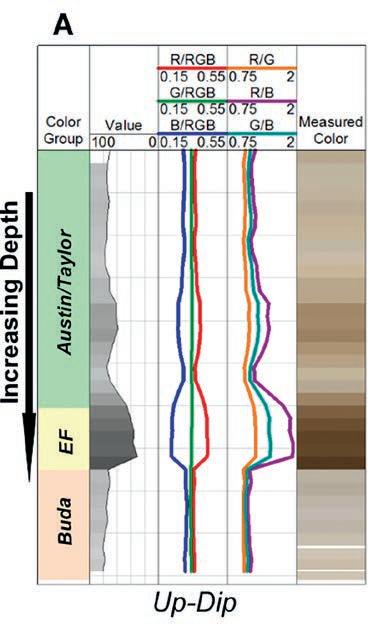
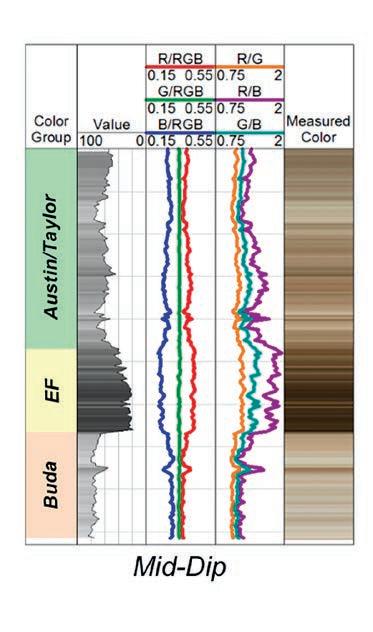
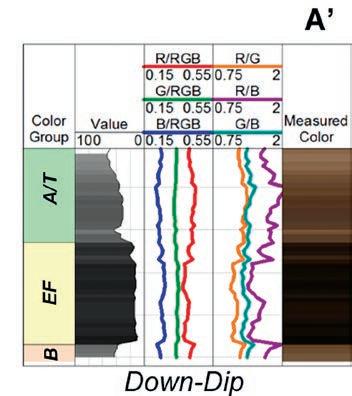
Figure 10. Chromastratigraphy ® dip-section in the Eagle Ford play through Live Oak and Atascosa counties, Texas. Logs are hung on depth, and illustrate the ease of downdip correlation of the Buda, Eagle Ford, Austin and Taylor formations.
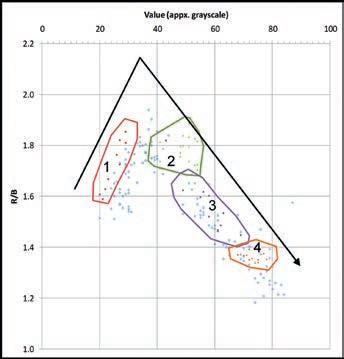
Figure 11. Chromatic data plotted as R/B vs Value. Colored fields (and points) illustrate the relative position of chromatic data from each formation member as determined by biostratigraphy. Numbers correspond to those in Figure 12. Black arrow represents the direction of drilling along lateral leg. Blue points depict data from pilot hole. The kink in the R/B data separates the lower and upper Eagle Ford, fields 1 and 2 respectively.
through long horizontals. ChromaLog ® analysis has proven advantageous as a new quantitative technology for formation identification, as a predictive technique for organic content that can be readily integrated with other data sets, and is suitable for detailed correlations and interpretations using our ChromaStratigraphy ® analysis.
Colour changes are readily and consistently recorded in the chromatic data. Key formation identifiers remain distinct with little or no smearing of the formation boundaries as sample interval increases. As observed in the Eagle Ford shale, discrete markers can be identified even in seemingly homogeneous sequences.
Multiple ChromaLog ® analyses can be linked for local and/or regional interpretations through ChromaStratigraphy ®
When integrated with other data types, the interpretative ability of chromatic data expands. Above we illustrate colour coding the data, based on a number of biostratigraphic tie points. Fields of data with known lithologic identity were isolated, allowing ‘uphole’ samples with chromatic measurements to be tied to formations with increased confidence.
SURFACE MAPPING
Using only ChromaStratigraphy ®, surface maps of plays can be rapidly produced to ascertain local or regional variations in surface depth, unit thickness, etc.
PREDICTIVE TOOL
Value is a successful predictor of TOC content, generally with a non-linear relationship. Exact TOC-Value relationships are formation and lithology specific.
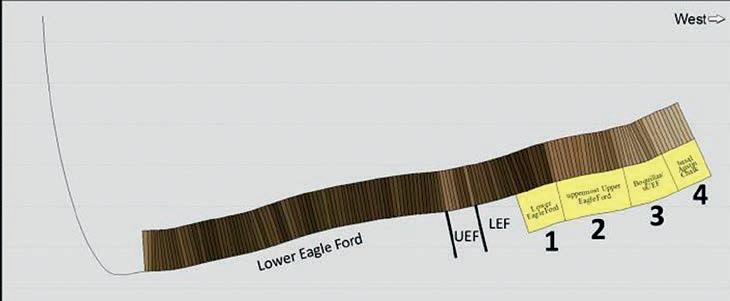
Figure 12. (Measured colour and lithostratigraphy (from nannofossil data) along the horizontal well in the Eagle Ford. Numbers correspond to those in Figure 11. Labeled fields represent interpreted formations from ChromaLog ® analysis.
13.
INTEGRATED RESULTS
Chromatic data and ChromaLog© analysis can easily be integrated with any type of well log data, measured down-hole or taken from cuttings and/or core samples.
CHROMASTRATIGRAPHY® IN CONVENTIONAL PLAYS
Conventional plays are also appropriate for ChromaLog ® analysis. Even in structurally complex and highly localized basins, ChromaStratigraphy ® proves to be a successful correlation technique.
ChromaStratigraphy ® analysis conducted in 2011 of the above wells effectively resolved a conflict in biostratigraphic interpretations between nannofossil and foraminifera data (foram data not shown). Original samples collected c. 1990.
CONCLUSIONS
This document demonstrates the numerous applications of ChromaLog ® analysis and ChromaStratigraphy ® in both conventional and unconventional plays, and illustrates some of the capabilities of the techniques.
Based on the analysis and interpretation of
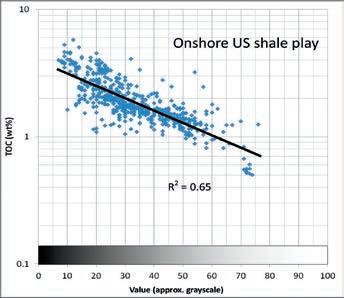
Figure 14. Semi-log cross-plot illustrating non-linear relationship between Value and TOC content. Here, an exponential relationship provides the highest degree of correlation for this onshore shale play.
the more than 100 wells, the authors have confidence in the identification and correlation ability of ChromaLog ® analysis. Precision testing has confirmed the repeatability of the technique, ensuring client confidence in correlations and measurements made across multiple projects.
Integrating data from the ChromaLog ® and ChromaStratigraphy ® techniques with conventional wireline and other analytical
(Continued on page 19...)
RESERVOIR ISSUE 11 • DECEMBER 2014 17
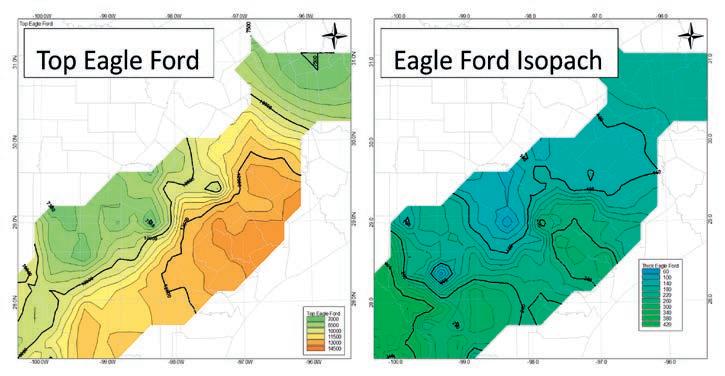
Figure
(L) Top surface of the Eagle Ford shale, as interpreted by ChromaLog ® analysis. (R) Isopach (thickness) map of the Eagle Ford shale, as interpreted by ChromaLog ® analysis. Both maps are constructed from chromatic data of 41 wells. Texas counties shown for geographic reference.
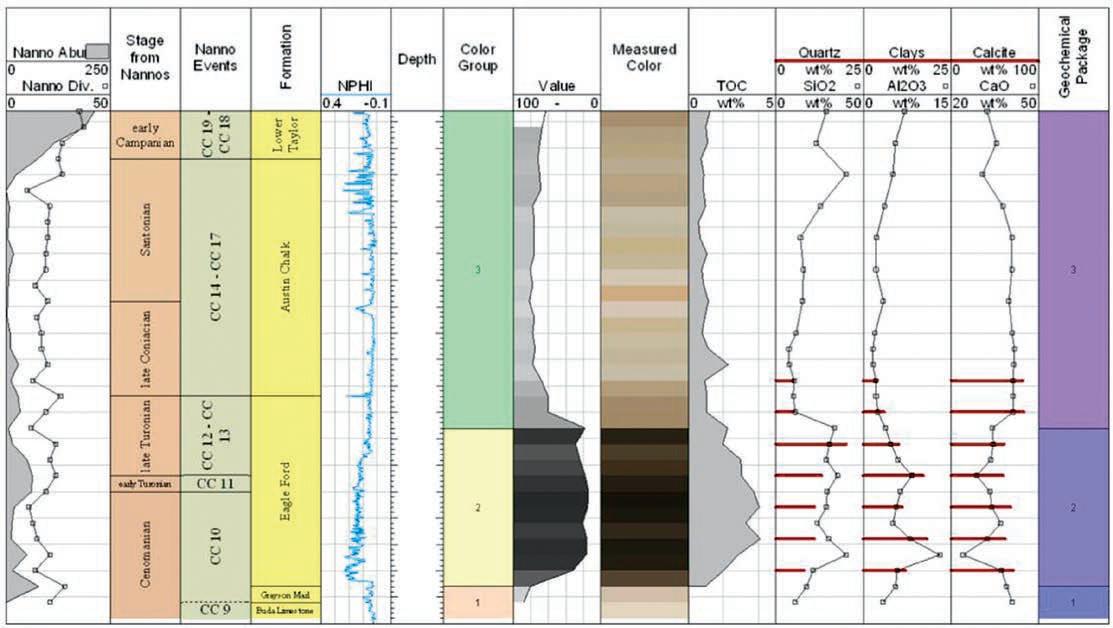
Figure 15. Example of an integrated Eagle Ford report, illustrating relationships between chromatic, electronic log, biostratigraphic, organic, mineral and elemental data. Note the distinct darkening with TOC and mineralogical shifts at the top of the Eagle Ford formation. The highest TOC values are in the lower Eagle Ford, denoted by the darkest values consistent with the Cenomanian-Turonian boundary (global extinction event and Oceanic Anoxia Event2 [OAE 2]).
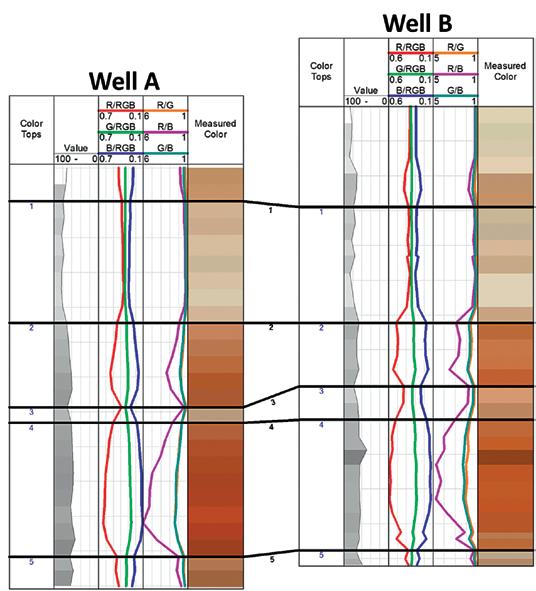
Figure 16. ChromaLog ® analysis of two wells from a conventional offshore U.S. Gulf of Mexico play. The wells are located approximately 10 miles apart, and are within the same mini-basin. Five tops suitable for ChromaStratigraphy ® were readily identified within the two wells. ChromaLog ® analysis was conducted on large interval (500 ft.) cuttings samples. Original cuttings samples from these wells date to circa 1990, illustrating the practicality of applying ChromaLog ® analysis to old wells and/or wells without available logs or other data. Wells are approximately 10 miles apart.
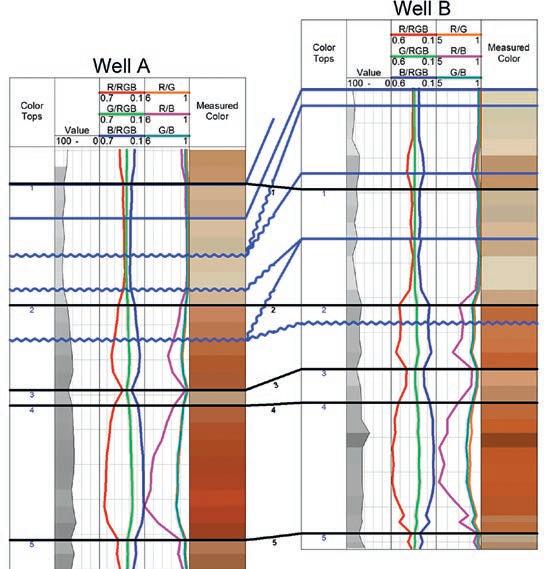
Figure 17. ChromaLog ® analysis with integrated biostratigraphic tops (shown in blue) for the two wells above. Nannofossil analysis was conducted on the same cuttings. Correlation tie lines between chromatic and biostratigraphic analysis cross, indicating conflicting correlations and interpretations. ChromaLog ® tie lines (shown in black) were later demonstrated to be correct from foraminifera data analyzed at more frequent intervals (data not shown). Wells are approximately 10 miles apart.
18 RESERVOIR ISSUE 11 • DECEMBER 2014
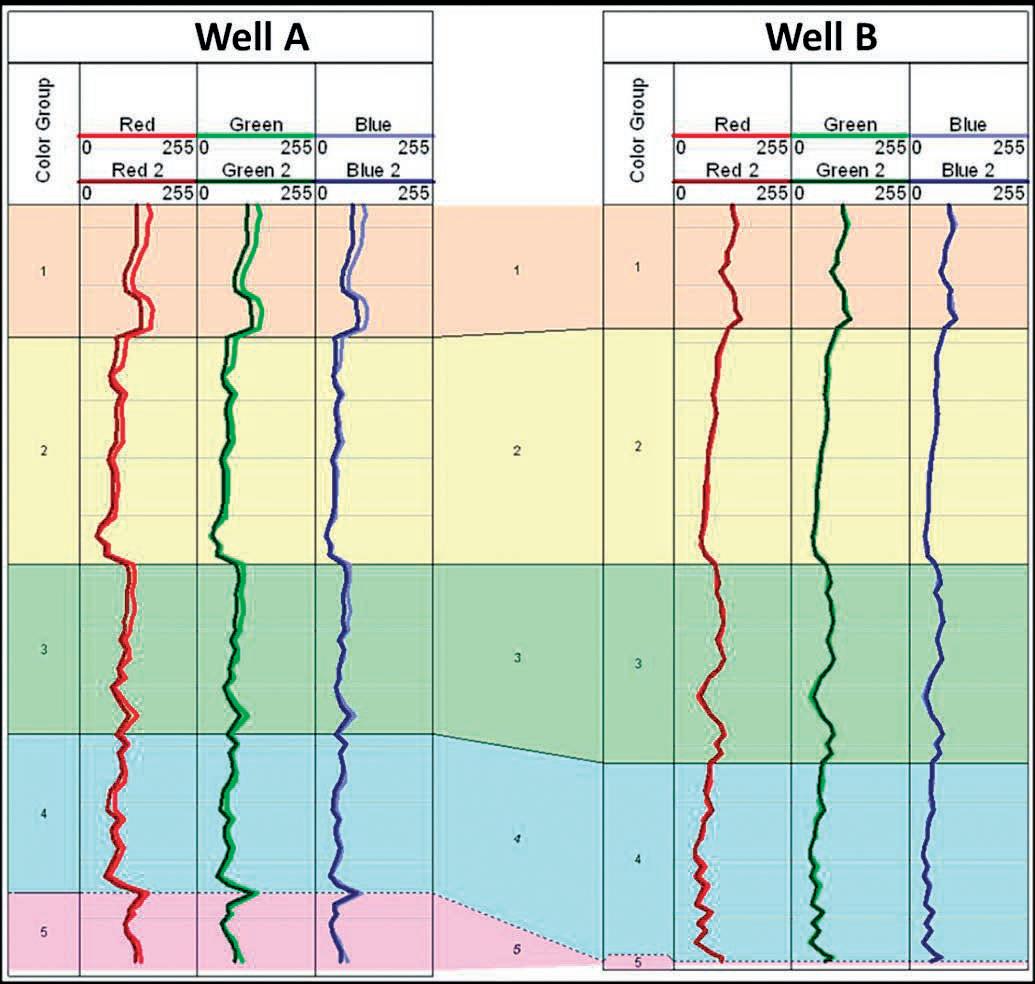
Figure 18. Results of repeatability testing for the methodology and measurements of ChromaLog ® analysis. Repeat measurements were conducted on saturated slurries from wells A and B. New slurries were prepared from the same set of washed cuttings samples on different days, by different technicians. Minor differences are observed in the upper reaches of well A, though all patterns remain consistent and correlatable between the two wells. Observed variations in well B are insignificant.
GEOEDGES INC.
Detailed and accurate geology at your fingertips in Petra, GeoGraphix, ArcGIS, AccuMap, GeoScout and other applications
Northern US Rockies & Williston Basin
Geological Edge Set
North American Shales
Geological Edge Set (all colors)
Western Canada Geological Edge Set
Eastern US / Appalachian Basin Geological Edge Set
(...Continued from page 17)
techniques establishes the control points necessary to extrapolate chromatic data into areas with limited or nonexistent data.
Ellington is currently testing integrated well site applications of near real-time ChromaLog ® , TOC, XRF (elemental), and XRD (mineral) analysis in a joint venture with ALS Empirica.
ChromaLog ® analysis and ChromaStratigraphy ® are revolutionary techniques that:
• Bring scientific rigor to traditionally subjective lithologic descriptions.
• Present results in a standard well log form.
• Apply to all geologic settings.
• Quantify variations and colour changes in cuttings, cores (whole & sidewall), and outcrop samples.
• Produce highly repeatable measurements in the lab or at the well site.
REFERENCES
Moore, J.C., Engelhardt-Moore, N.L., Dubinsky G.L., and Ellington, W.E., Jr. 2012
Quantitative Analysis of Geologic Samples with ChromaStratigraphy: Applications to Conventional and Unconventional Resources; AAPG 2012 Annual Convention & Exhibition Poster – EMDAAPG; President’s Certificate for Excellence in Presentation Award.
for information contact: Joel Harding at 403 870 8122 email joelharding@geoedges.com www.geoedges.com
Western Canada: Slave Point, Swan Hills, Leduc, Grosmont, Jean Marie, Horn River Shales, Elkton, Shunda, Pekisko, Banff, Mississippian subcrops and anhydrite barriers in SE Sask., Bakken, Three Forks, Montney, Halfway, Charlie Lake, Rock Creek, Shaunavon, BQ/Gething, Bluesky, Glauconitic, Lloyd, Sparky, Colony, Viking, Cardium, CBM, Oilsands Areas, Outcrops
US Rockies & Williston: Red River, Mississippian subcrops & anhydrite barriers (Bluell, Sherwood, Rival, etc), Bakken, Three Forks, Cutbank, Sunburst, Tyler, Heath, Muddy, Dakota, Sussex, Shannon, Parkman, Almond, Lewis, Frontier, Niobrara, Mesaverde shorelines, Minnelusa, Gothic, Hovenweep, Ismay, Desert Creek, Field Outlines, Outcrops
Texas & Midcontinent: Granite Wash, Permian Basin paleogeography (Wolfcampian, Leonardian, Guadalupian), Mississippian Horizontal Play, Red Fork, Morrow, Cleveland, Sligo/Edwards Reefs, Salt Basins, Frio, Wilcox, Eagleford, Tuscaloosa, Haynesville, Fayeteville-Caney, Woodford, Field Outlines, Outcrops, Structures
North American Shales: Shale plays characterized by O&G fields, formation limit, outcrop, subcrop, structure, isopach, maturity, stratigraphic crosssections. Includes: Marcellus, Rhinestreet, Huron, New Albany, Antrim, UticaCollingwood, Barnett, Eagleford, Niobrara, Gothic, Hovenweep, Mowry, Bakken, Three Forks, Monterey, Montney, Horn River, Colorado
Eastern US / Appalachia: PreCambrian, Trenton, Utica-Collingwood, MedinaClinton, Tuscarora, Marcellus, Onondaga Structure, Geneseo, Huron, Antrim, New Albny, Rhinestreet, Sonyea, Cleveland, Venango, Bradford, Elk, Berea, Weir, Big Injun, Formation limits, Outcrops, Allegheny Thrust, Cincinatti Arch, Field outlines
Mexico: Eagle Ford-Agua Nueva, Pimienta, Oil-Gas-Condensate Windows, Cupido-Sligo and Edwards Reefs, Tuxpan Platform, El Abra-Tamabra facies, Salt structures, Basins, Uplifts, Structural features, Sierra Madre Front, Outcrops, Field Outlines
Deliverables include:
-Shapefiles and AccuMap map features
-hard copy maps, manual, pdf cross-sections
-Petra Thematic Map projects, GeoGraphix projects, ArcView map and layers files
-bi-annual updates and additions to mapping
-technical support
RESERVOIR ISSUE 11 • DECEMBER 2014 19
& Midcontinent US Geological Edge Set
Texas
Mexico Geological Edge Set


SPONSORED BY: Hyatt Regency Calgary Hyatt Regency Calgary Regency March 31, 2015 31, 2015 2015 Produced by Geoscientists for Geoscientist's, the Playmaker Forum brings wellknown, successful and distinguished Canadian speakers together for a day of unparalleled discussion. Register now at www.cspg.org or by calling 403-513-1233 Speakers include: David Gardner Michael McDonough Lee Krystinik (AAPG Past-President) Dale Leckie (CSPG President) Your ticket includes: Complimentary networking lunch at the Hyatt Regency with a Q&A forum with Dr. Clay Riddell (OC, CEO Paramount Resources) White Hat Round-Up Reception; appetizers and refreshments will be served Join AAPG President-Elect John Hogg as the Playmaker Forum makes its Canadian debut!
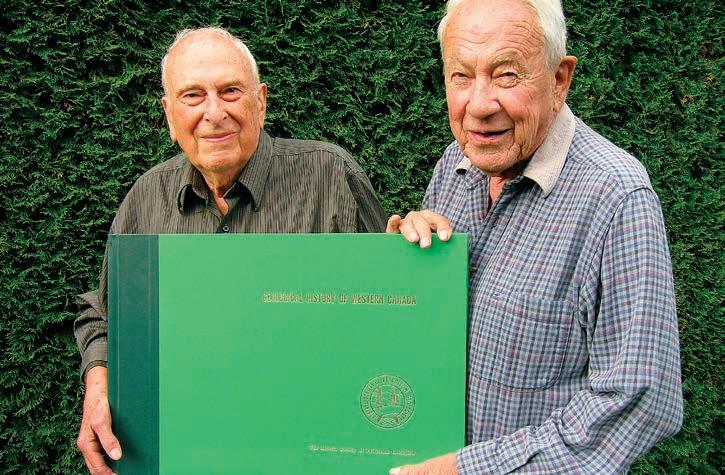
THE BOOK THAT CHANGED THE CSPG
| By Ashton Embry and Edward Klovan
Fifty years ago this month, CSPG, under its former name of the Alberta Society of Petroleum Geologists (ASPG), published a remarkable book entitled “Geological History of Western Canada.” The book was edited by two Imperial Oil geologists, Dr. R. G. (Bob) McCrossan and Dr. R. P. (Perry) Glaister. Notably, Bob was the ASPG president at the time of publication.
The book soon became known as “The Atlas” and its publication was a watershed moment in CSPG history. Just as the Battle of Vimy Ridge in WWI transformed Canada’s national identity and nationhood, the arrival of the Atlas transformed ASPG from a regional geological society into a widely respected, major scientific organization.
The need for a regional synthesis of the geology of western Canada was recognized by the 1960 ASPG executive. In 1961, a symposium was held with authors giving talks on the regional geology of all the geological systems as well as the Precambrian. The book was an outgrowth of those oral presentations but far exceeded the expectations of everyone. Bob and Perry did an outstanding job of creating a book like no other and one that was scientifically robust and visually captivating. Importantly, the book was
financed by various government organizations and depended on the geological and drafting resources of numerous oil companies.
The Atlas was the most comprehensive, integrated basin analysis the world had ever seen. It consisted of 16 chapters dealing, system by system, with the geological development of western Canada, an area
of about 3 million square kilometres. Notably, the editors ensured that there was a consistency in treatment for each of the chapters with an emphasis on the correlation of the defined geological units and the depositional history and paleogeographic evolution of each system. The 42 authors, to their credit, complied with the editor’s
(Continued on page 22...)

AGM - 11:30am - 12:00pm Technical Luncheon - 12:00pm - 1:00pm
RESERVOIR ISSUE 11 • DECEMBER 2014 21
CSPG Annual General Meeting Please
Perry Glaister (left) and Bob McCrossan (right) proudly display a 50 year-old copy of their wonderful publication.
join us on January 8th, 2014 for the CSPG AGM and first Technical Luncheon of 2014!
For more information
please visit www.cspg.org
and to register online
guidelines and each chapter expertly synthesized all the available data for the given system. Each chapter was beautifully illustrated by a variety of maps (lithofacies, isopach, paleogeography, tectonic), cross sections and correlation charts.
Some of the features of the Atlas that made it unique are:
• It represented an unprecedented and effective collaboration of many industrial, government and academic geologists and the organizations they worked for.
• It was produced through the efforts of numerous oil companies which provided time for their scientific staff to work on it, allowed the release of confidential data and interpretations, and had their drafting departments prepare the nearly 500 figures in the book.
• Each mapped interval in the Atlas would be recognized today as a large magnitude sequence. Such a subdivision allowed the entire Phanerozoic column to be subdivided into quasi- time stratigraphic units, ideal for interpretations of depositional history.

• An oversized format (38 cm X 55 cm) was adopted to allow the clear presentation of the70 maps that covered all of western Canada and provided a readily-seen, “big picture” view of each geological interval.
• The colours used on the maps and cross sections were bold and well-chosen and 32 different hues were consistently used throughout the book for the 32 different facies distinguished in the Phanerozoic column.
The 232 page book immediately became a huge success being worth every penny of its $25 price tag ($20 pre-publication). It soon occupied a key place in almost every geologist’s office and provided the starting point for any project or land sale evaluation. A 1965 review in the prestigious journal Science captures how the book was perceived outside of Canada. “The work is an outstanding contribution …. and will be quoted for many years. Few geological societies have the capacity to carry through so complex and ambitious a program. The Alberta Society of Petroleum Geologists … has placed the entire geological profession in their debt.”
AVO COMPLIANT STRUCTURE AND STRATIGRAPHIC
5D INTERPOLATION
4D TIME LAPSE
3D PRESTACK TIME MIGRATION
3D MERGE
2D PRESTACK DEPTH
2D MARINE MULTICOMPONENT WORKSTATION RENTALS
In summary, The Atlas catapulted the CSPG into the big leagues of technical societies and this book is likely responsible for the discovery for more petroleum than any other published work. On this 50th anniversary of its publication, CSPG acknowledges the magnificent contribution of Drs McCrossan and Glaister.
The Atlas Editors – Bob McCrossan is a native Vancouverite and obtained his PhD from the University of Chicago. He was a petroleum explorationist and researcher with Seaboard and Imperial Oil, followed by being the head of the energy subdivision of the Geological Survey of Canada. Perry Glaister, a native Calgarian, obtained his PhD at Northwestern under the guidance of Larry Sloss and Bill Krumbein. He was employed by Imperial Oil for 30 years, mainly in their exploration research group. Bob and Perry worked diligently for three years making the Atlas happen, working on it mainly after putting in a full day at Imperial and on many weekends. Bob and Perry have both retired to Vancouver Island and remain the best of friends.
Bob and Perry will be recognized for their contributions at the December 9th CSPG Technical Luncheon. Please visit www.cspg. org to purchase tickets.
22 RESERVOIR ISSUE 11 • DECEMBER 2014
The On-Shore Seismic Specialists EDGE TECHNOLOGIES INC. Direct: +1.403.770.0440 • edge-tech.ca (...Continued from page 21)
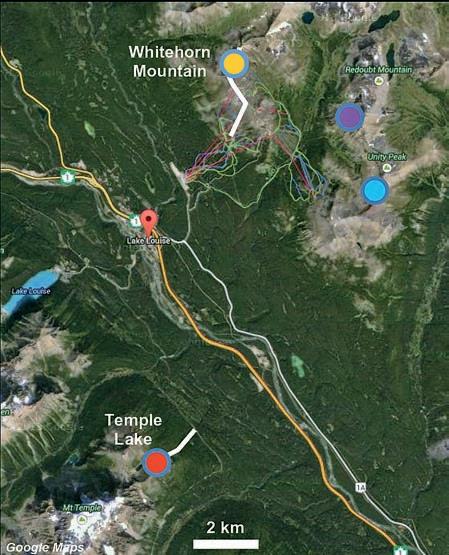
GO TAKE A HIKE
Temple Lake and Lake Louise Resort, Banff National Park, Alberta
| By Mark D. Smith, Bill Arnott and Gerry Ross
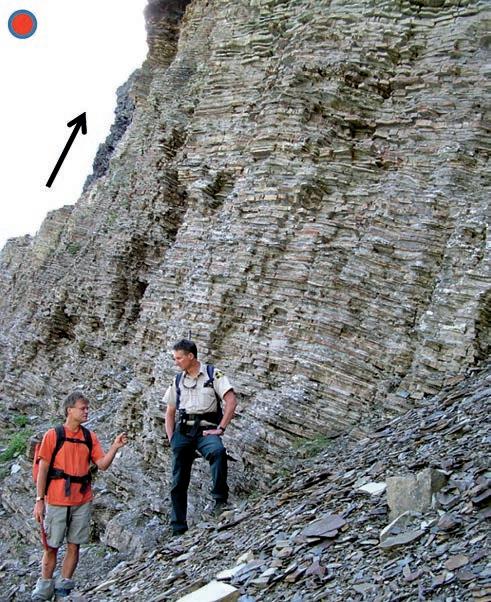
Outcrops of the Precambrian (Neoproterozoic) Miette Group in the Alberta National Parks are generally limited to road- or traincuts in the valley. However, in the vicinity of Lake Louise townsite there are a number of accessible, well-exposed outcrops at the base of thrust faults and at the Lake Louise Ski Resort. These outcrops provide an opportunity to view the Neoproterozoic (Ediacaran) Old Fort Point Formation (OFP), a key regional stratigraphic marker in the Windermere Supergroup (WSG) of the southern Canadian Cordillera that is interpreted to be a post-glacial deep-marine succession (Smith et al., 2014a,b).

Trailhead: Drive to the Lake Louise Ski Resort just east of the town off Highway #1. Park at the resort and purchase a ticket to take the gondola part way up the front face of the ski hill (south slope) to the Whitehorn Mountain Day Lodge.
Distance: A strenuous 4 km hike to the top of Whitehorn Mountain and then following the “Upper Boomerang #64” ski run along the narrow, cliff-face ridgeline. Elevation gain from the lodge to the top is approximately 600 m.
Trailhead: The Temple Lake trailhead is located along the Moraine Lake road approximately 5 km from the junction with the road to Lake Louise. There is a unmarked gravel pullout parking area on the east side of the road.
Distance: About 1.5 km west uphill along a poorly-defined trail that parallels the creek. Elevation gain is approximately 250 m.
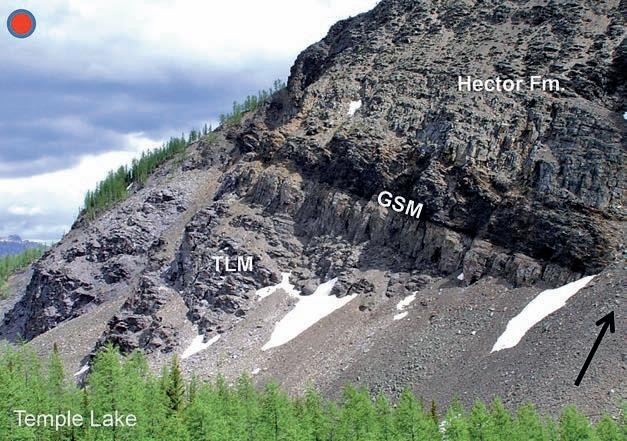
The seldom-used Temple Lake trail leads up to a quiet lake nestled into the northeast slope of Mount Temple. Here the lower two units of the OFP, the Temple Lake (TLM) and Geikie Siding (GSM) members, in addition to the overlying Hector Formation, are well exposed. The TLM consists of purple- and green-coloured siltstones that stratigraphically upward grade into rhythmic limestone-siltstone couplets capped by organic-rich mudstones of the GSM. These fine-grained units are generally uniform in thickness, regionally correlatable and are interpreted to reflect synchronous basin-wide deposition during a major post-glacial sea-level rise that terminated supply of coarse-grained sediment in the basin (Smith et al., 2014b).
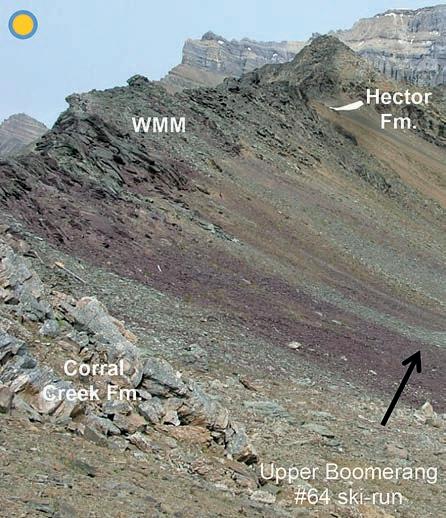
After a strenuous climb up the steep rocky slope of Whitehorn Mountain from the day lodge, turnaround and enjoy the spectacular views of Lake Louise, the chateau and the valley. The ski resort area is also popular with grizzly bears, thus bear-spray is essential and large (>4) hiking groups are recommended. Continue northward along the “Upper Boomerang #64” ski-run where near-vertical dipping beds along the ridge allow one to (carefully) walk across a complete section from the Neo-proterozoic Miette Group to the Cambrian Gog Group: coarse-grained sandstones and carbonate-clast conglomerates of the Corral Creek Formation; carbonate-clast breccias and variably-coloured mudstone-siltstones of Whitehorn Mountain Member (WMM), Old Fort Point Formation; and mudstones, coarse-grained sandstones and conglomerates of the Hector Formation (Aitken, 1969). Lithofacies of the TLM and GSM are not exposed at Whitehorn Mountain (nor on the west-face of Redoubt Mountain) because of erosion (~100 m) interpreted to be linked to an abrupt fall of relative sea-level related to regional tectonic uplift. This, in turn, caused mass wasting on the slope and locally the formation of submarine canyons that later filled with the diverse lithologies of the WMM (Smith et al., 2014b). Similar WMM lithologies are observed at Old Fort Point, just outside the town of Jasper.
RESERVOIR ISSUE 11 • DECEMBER 2014 23
Arrows indicate upward stratigraphic direction.

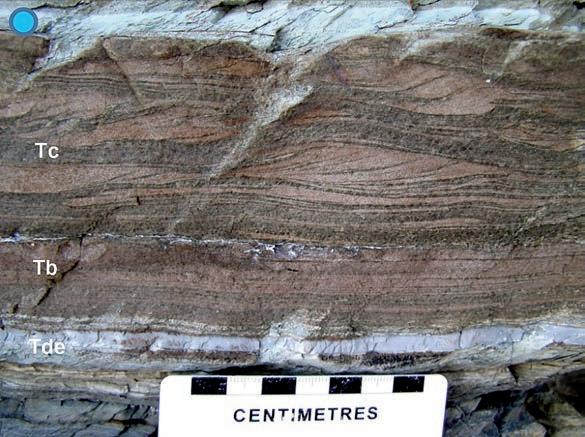
Above: Tde limestone turbidite overlain by Tbcd very fine-grained sandstone turbidite, Temple Lake Member. Although these rocks have experienced low-grade (sub-greenschist) metamorphism, the fine-scale sedimentary structures such as planar laminations and (ripple) cross-stratification are well-preserved.
Left: Purple- and green-coloured rhythmic limestone-siltstone Tbcd turbidite couplets, Temple Lake Member. This distinctive lithofacies is a key marker unit correlatable over 35,000 km2 in the southern Canadian Cordillera. Arrow indicates upward stratigraphic direction.
24 RESERVOIR ISSUE 11 • DECEMBER 2014
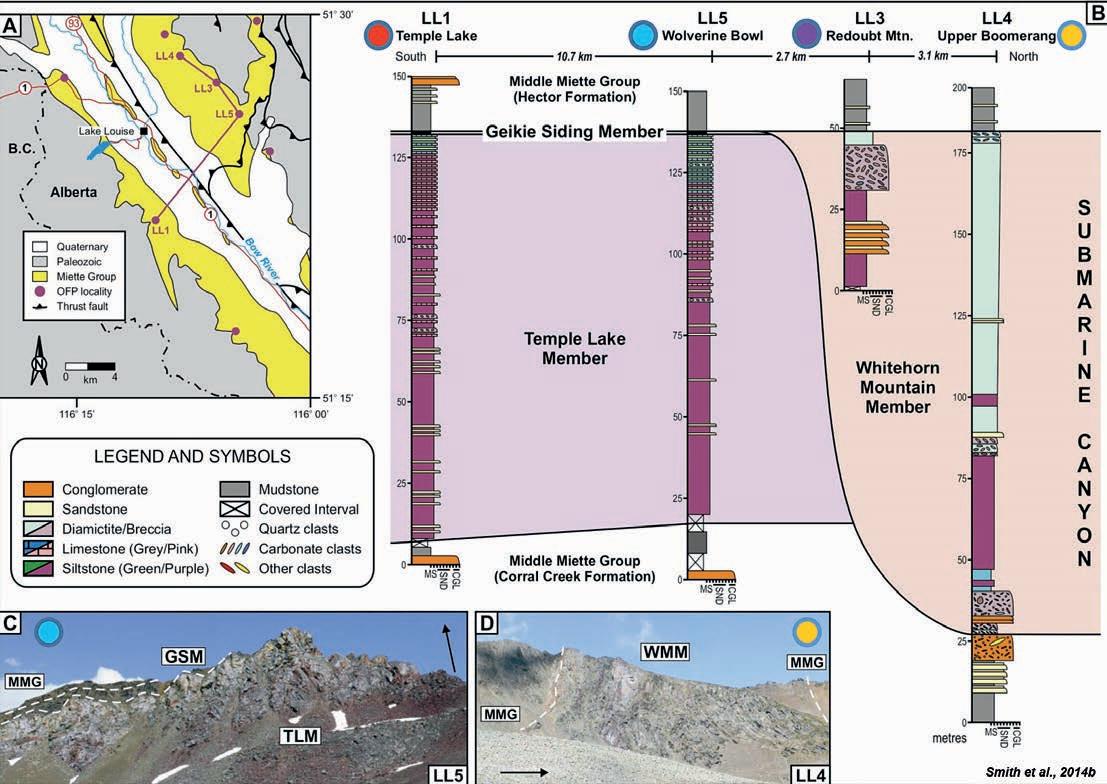
Simplified geological map of the Lake Louise area showing outcrop localities, correlated stratigraphic cross-section and outcrop photos of the Old Fort Point Formation and encompassing Middle Miette Group (modified from Price et al., 1980). The cross-section illustrates the (local and basin-wide regional) correlation of the lower two members (Temple Lake and Geikie Siding members), prominent incision event and deposition of the Whitehorn Mountain Member in a submarine canyon. Arrows indicate upward stratigraphic direction.
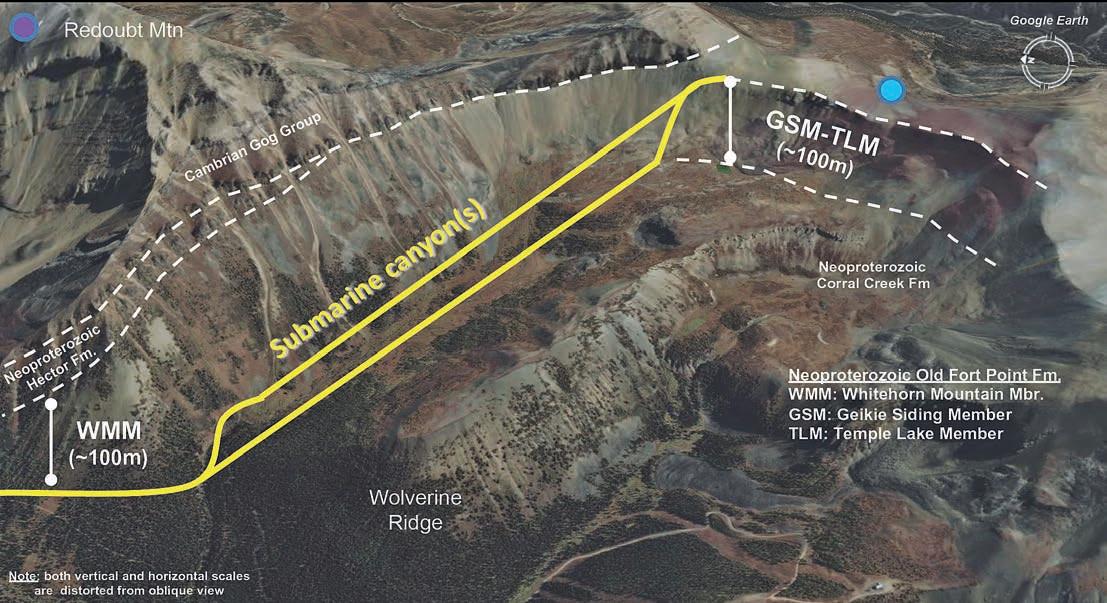
Oblique view of Redoubt Mountain and “Wolverine Bowl” area of the Lake Louise Ski Resort. At both localities the total thickness of the OFP is comparable (~100 m); however, at “Wolverine Bowl” only the TLM and GSM are exposed whereas on the western slope of Redoubt Mountain, only the WMM is exposed because of erosion at the base of an OFP submarine canyon. The narrow ridgeline downslope from the top of Whitehorn Mountain is a well-exposed section of typical lithofacies of the WMM interpreted to be part of an (incised) submarine canyon fill.
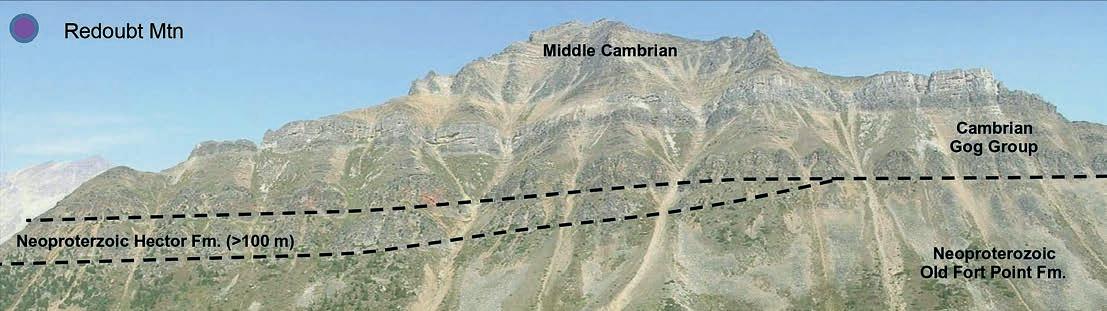
Redoubt Mountain exposure that can be viewed from Wolverine Ridge of the Lake Louise Resort area (or from an oblique view at the top of Whitehorn Mountain). The erosion surface at the base of the Hector Formation was originally mapped by Walcott (1910) to represent the Precambrian-Cambrian unconformity. Aitken (1969) then repositioned the contact stratigraphically higher and showed it to represent a regional angular unconformity (~3°) at the base of the Cambrian Gog Group. Later work by Arnott and Hein (1986) showed that the prominent “angular” unconformity at the base of the Cambrian as reported by Walcott (1910) was in fact the base of a >100 m deep Hector Formation submarine canyon. The location of this well-exposed canyon, like the older Old Fort Point Formation (Whitehorn Mountain Member) canyon, may have exploited a pre-existing topographic depression, or alternatively, may have been tectonically controlled.
REFERENCES
Aitken, J.D. 1969. Documentation of the sub-Cambrian unconformity, Rocky Mountains main ranges, Alberta. Canadian Journal of Earth Sciences, v. 6, p. 193-200.
Arnott, R.W.C. and Hein, F.J. 1986. Submarine canyon fills of the Hector Formation, Lake Louise, Alberta: late Precambrian syn-rift deposits of the protoPacific Miogeocline. Bulletin of Canadian Petroleum Geology, v. 34, p. 395-407.
Gussow, W.C. 1957. Cambrian and Precambrian geology of southern Alberta. Alberta Society of Petroleum Geologists Guidebook, Seventh Annual Field Conference, p. 7-19.
Price, R.A., Cook, D.G., Aitken, J.D., and Mountjoy, E.W. 1980. Geology, Lake Louise (east half) Map 1482A, west of fifth meridian, Alberta-BC.
Smith, M.D., Arnott, R.W.C. and Ross, G.M. 2014a. The Old Fort Point Formation: Redefinition and formal subdivision of a distinctive stratigraphic
marker in the Neoproterozoic Windermere Supergtoup, southern Canadian Cordillera. Bulletin of Canadian Petroleum Geology, v. 62, p. 1-13.
Smith, M.D., Arnott, R.W.C. and Ross, G.M. 2014b. Physical and geochemical controls on sedimentation along an ancient continental margin: The deep-marine Old Fort Point Formation (Ediacaran), southern Canadian Cordillera. Bulletin of Canadian Petroleum Geology, v. 62, p. 14-36.
Walcott, J.F. 1910. Pre-Cambrian Rocks of the Bow River Valley, Alberta, Canada. Smithsonian Miscellaneous Collections, v. 53, p. 423-431. www.gemtrek.com. Banff and Mount Assiniboine Hiking Guide and Map, Gem Trek Publishing.
RESERVOIR ISSUE 11 • DECEMBER 2014 25
OILS SANDS AND HEAVY OIL SYMPOSIUM A Great Success!
| By Fran Hein & Chris Seibel
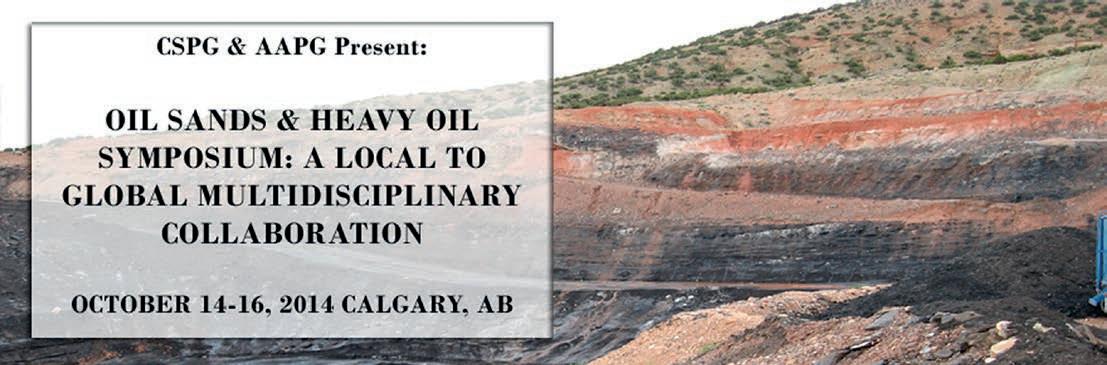
The planning committee would like to thank all those who attended the “Oils Sands and Heavy Oil, a Local to Global Multidisciplinary Collaboration Symposium” from October 14 to 16, 2014, sponsored by the CSPG and AAPG. It was a great success and the planning committee is hoping this will be the first of a reoccurring event every 3 to 4 years. We would also like to thank the session co-chairs for finding fantastic leading-edge presenters and organizing a first class program. And thanks to the presenters, who provide superb content that was second to none. Two of the sessions were standing room only. And finally thanks to all of our financial sponsors, so important to the success of this event.
Here is a short recap of the three days. The first day began with a session discussing global bitumen and heavy oil resources, demand outlooks and supplies. Deposits from California, Utah, China, and Russia were examined and the importance of these bitumen and heavy oil deposits to meet global energy needs were outlined.
The next session examined large-scale geology of the McMurray Formation. Global-, continental-, and regional- scale controls on sedimentation patterns of the McMurray were reviewed. Modern analogues presented included the meandering Chehalis River, West Coast US; Fraser River, west coast Canada; and the Severn Estuary, United Kingdom. Oil sands prospects beyond the McMurray Fm. in the Athabasca Basin were also presented.
Day 2 began with a focus on mediumto micro-scale geology and reservoir characterization. Presentations examined syn-depositional trends related to underlying karst collapse, facies architecture within fluvial channel belts and controls on reservoir heterogeneity distribution. Discussions focused on methods to characterize micro- to intermediate-scale heterogeneities in the reservoir and how to model them. The final talks integrated geology and engineering to understand the combined effect on oil recovery and what this tells us about SAGD production mechanisms.
During the second half of day two a wide range of topics were examined from planning for the challenges of the postheavy oil world to integrating geology and engineering to solve upcoming reservoir challenges. Topics included microbiology of bitumen-rich oil sands; impact of geology on SAGD well design, integrity and in-well control devices; new methodologies to improve static and dynamic characterization of SAGD projects; and re-locatable facilities.
The last day began with a focused session on caprock integrity and reservoir containment. This session was well attended with those there sharing in an exciting session with participation from both the Alberta Energy Regulator and industry. Presentations examined mapping, geoscience characterization, observation methods to manage caprock integrity, and geomechanical simulations supporting SAGD cap rock integrity assessment.
The symposium ended with a session on land and water use, carbon management and social perceptions of risk. The symposium wrapped up with a discussion chaired by Terry Abel, Director, Oil Sands at Canadian Association of Petroleum Producers (CAPP).
Once again thank-you to everyone who attended and shared. It made this a memorable and successful event and hopefully this is the beginning of something special.
Thank-you.
26 RESERVOIR ISSUE 11 • DECEMBER 2014
Understanding Oil-Source systems
- a novel multifaceted approach
Understanding the spatial and temporal relationships of the hydrocarbon-generating source rocks and the associated hydrocarbons within a petroleum system, is key for maximising production.
Chemostrat combines rhenium-osmium (Re-Os) geochronology and inorganic compositional data to optimise basin modelling through providing:
Absolute temporal constraints on the depositional age of the source rock and timing of oil generation.
Oil-source fingerprinting.
Oil-oil correlation and identification of oil populations.
An assessment of charge events from single or multiple source units.
An evaluation of reservoir connectivity.
CHEMOSTRAT

Canada Ltd.
SW, Suite 1600, Sun Life Plaza,
Tower,
t 403-463-8188 e CAoffice@chemostrat.com www.chemostrat.com OIL SOURCE MIGRATION RESERVOIR OIL SOURCE MIGRATION RESERVOIR
Chemostrat
144-4 Avenue
West
Calgary, Alberta, T2P 3N4
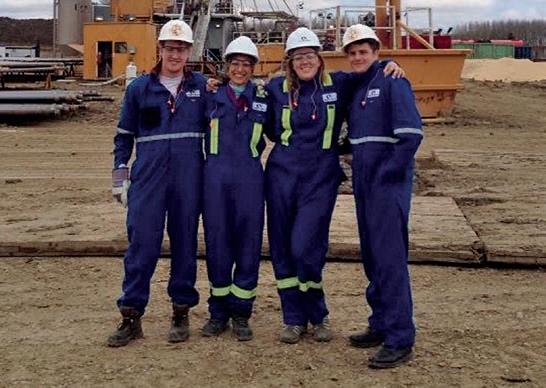
CSPG STUDENT INDUSTRY FIELD TRIP (SIFT) 2014
| By Taylor Olson, 2014 SIFT Committee Co-Chair
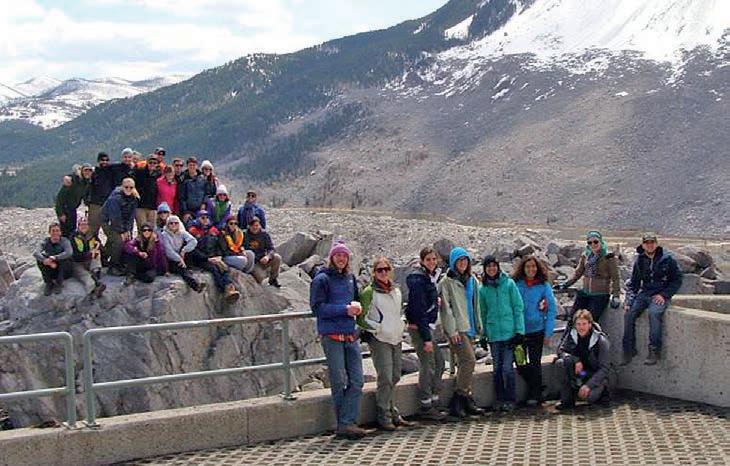
The 2014 edition of the CSPG SIFT had phenomenal volunteer and industry
as many industry professionals providing lectures and field trips. In addition to an outstanding volunteer base, financial support from our industry sponsors allows the CSPG to continue to offer this flagship program every year. Our major industry sponsors for 2014 were: ConocoPhillips Canada, Shell Canada, Imperial Oil, Devon Energy, APEGA, Cenovus Energy, MEG Energy, Canadian Natural Resources, the CSPG Educational Trust Fund, Nexen, Encana and Suncor Energy. SIFT was also fortunate to receive in kind donations by geoLOGIC systems, Pengrowth Energy, Crescent Point Energy, Golder Associates, University of Calgary Earth Science Department, SAIT, RigSat Communications, AER Core Research Centre and FormationFinder.com. On behalf of the entire SIFT committee and the CSPG, we want to thank all the individuals and companies for their continued support of this incredible program.
The 2014 CSPG SIFT committee hosted 31 undergraduate university students nominated


www.lmkr.com/geographix

Ÿ Sealed earth modeling while correlating surfaces and faults
Ÿ Robust velocity modeling for dynamic depth conversion
Ÿ Geomodel while geosteering

Ÿ Sophisticated petrophysics for reservoir characterization


Geology Discover Your Potential GeoGraphix® is a registered trademark of Landmark Graphics Corporation. The LMKR Logo is a trademark of LMKR Holdings. LMKR Holdings is the exclusive world-wide licensor and distributor of GeoGraphix® software. Make this well better than your last through integrated multi-dimensional geological interpretation
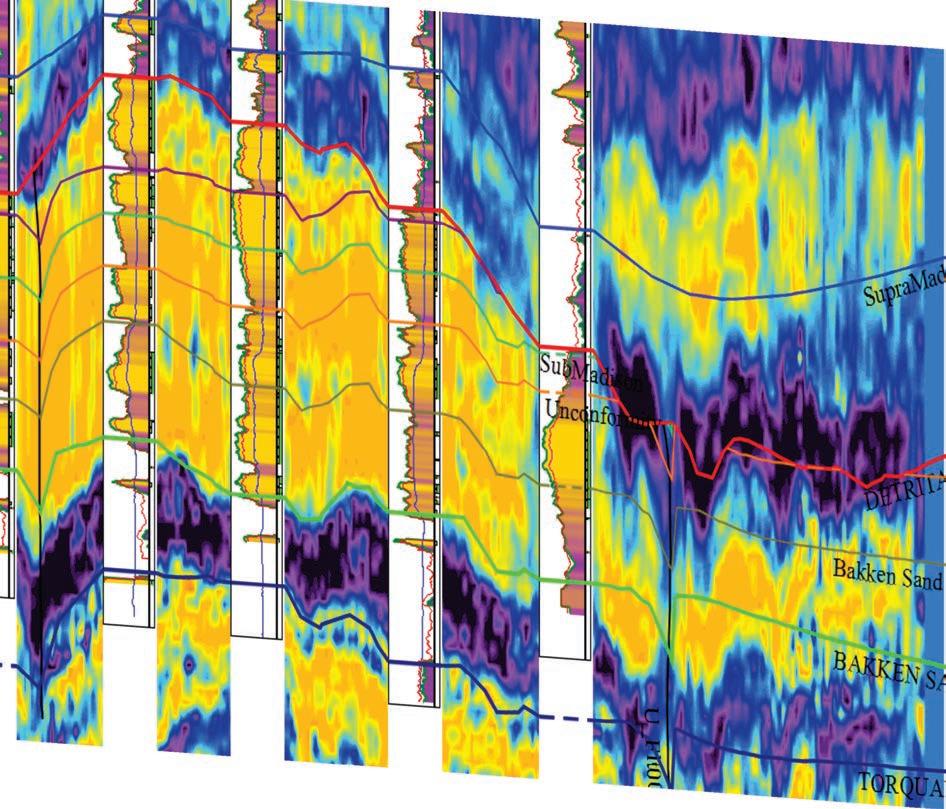
Frank Slide.
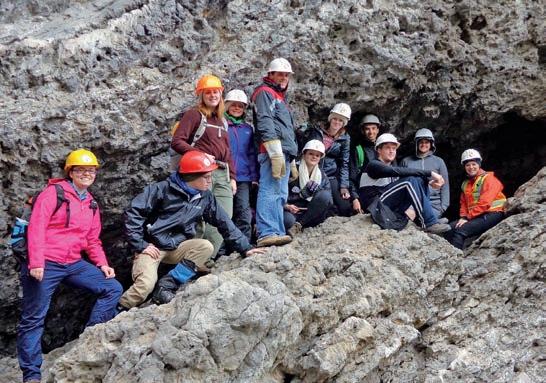
from geoscience programs across Canada. These 31 budding geoscientists came to Calgary for a two-week introduction to the Canadian petroleum industry through classroom lectures, core workshops, an exploration game, field trips and many opportunities to talk to professionals working in our industry. Throughout the two weeks students attended lectures presented by industry experts with topics including: well logging and log interpretation, carbonate and clastic reservoirs, sequence stratigraphy, geophysics, wellsite operations, heavy oil and more. To keep up with current activity in the industry we also held an Environmental and Unconventional Resources talk. In addition to the lectures and core sessions, students were able to visit a live drilling rig in Cochrane, fossil-hunt in Dinosaur Provincial Park and partake in the legendary 4-day field trip through the Rockies. A large component of SIFT is having the students apply concepts learned on the trip to an intense, hands-on exploration game, which
was completely re-vamped by Geoff Speers in 2013. The game teaches students some of the realities of the oil and gas business. Eight teams form a company and are given a small land base and seed capital to start exploring and building their company. They use real well log data to make interpretations of the geology and identify “sweet spots” which they use to bid on additional land, drill wells and structure business partnerships. At the end of the program an experienced industry panel judges the interpretations and success of the individual companies and awards two prizes: the Bill Ayrton Technical Award for best geologic interpretation and the Larry Strong Financial Award for best economic evaluation.
Each year the two-week SIFT program is complemented with a Summer Job Program. The goal of this component is to place newly trained SIFT graduates with oil and gas companies in Calgary so that they can continue the learning experience. This
year four students found summer positions through our Summer Job program. Each year we continue to look for companies willing to hire our SIFT graduates (Keith Yaxley is SIFT’s company liaison). If your company is considering one of these exceptional students, please contact the CSPG office for more information.
Meghan Speers and I have had the privilege of leading the SIFT program over the past two years and have greatly enjoyed the opportunity. The 2015 Chair positions will continue under the leadership of Carson Brown and Noel Devere-Bennett. Planning for the upcoming year has already begun. Many thanks are owed to all the SIFT members and volunteers that have worked on the committee over the past 35 years. The organizing committee puts in a huge effort every year, and it is a result of their hard work that SIFT is a continued success.
RESERVOIR ISSUE 11 • DECEMBER 2014 29
Grassi Lakes, Canmore.
Pengrowth-sponsored live drilling rig tour.
CORPORATE SUPPORTERS
Cougar Consultants, Inc.
Sensor Geophysical Ltd.
Exova Canada Inc
Advanced Flow Technologies
Enviro-Tech Surveys Ltd
EV Cam Canada Inc.
McDaniel & Associates Consultants Ltd.
Serpa Petroleum Consulting Ltd.
Pulse Seismic Inc
Canada Brokerlink Inc.
Energy Navigator
Golder Associates
Sigma Explorations
Apache Carbon Management Canada
Saudi Aramco
EDGE Technologies
Target Data Ltd.
GeoSpace Technologies
Compass Directional Services
Canacol Energy Ltd.
Explor
Japan Canada Oil Sands Ltd.
Sproule International Limited
Petrocraft Products Ltd.
Spectrum
Datalog Technology Inc.
Birchcliff Energy Ltd.
Cabra Enterprises Ltd.
SAExploration
Glacier Exploration Surveys
Matrix Solutions Inc.
National Oilwell Varco
Cossack Land Services Ltd.
Deloitte Petroleum Services Group
EPI Group
FMQ Southern Exploration
GeoChemTech Inc.
Geotir
Hurry Hydrocarbons
Matrix Geoservices Ltd.
Maxam Seismic Explosives
Osum Oil Sands Corp.
Petrel Robertson Consulting Ltd.
Statcom Ltd.
Trident Exploration
HEF Petrophysical Consulting Inc.
Sourcex
Caracal Energy Inc.
Regent Resources
Bankers Petroleum Ltd.
BJV Exploration Partnership
SOCO International
Roxar Little Rock Document Services
3e Royalties
Bengal Energy
Bounty Developments Ltd.
Brasoil Corp.
Bukit Energy
Central European Petroleum Ltd
DualEx Energy International
Franconia Geoscience
Gran Tierra Energy Inc.
International Petroleum Consulting
Jenner Geoconsulting Inc.
Korean National Oil Company
Long Reach Resources Ltd.
Lorne LeClerc & Associates
Madison Petrogas Ltd.
Petroamerica
Serinus Energy
Sherritt International Corporation
Skyhawk Exploration
Tretio Exploration Ltd.
Valeura Energy
HONORARY MEMBER –CRAIG LAMB
Craig Lamb graduated from the University of Manitoba with a B.Sc. in Geology in 1968 and an M.Sc. in 1974. He later earned an M.B.A. from the University of Calgary in 1985. Craig joined CSPG in 1981 and has been an active volunteer even since. He worked on the Education Committee in 1986 and has served on several Convention Committees: AAPG Annual Convention Committee (1993-1995), the inaugural GeoCanada Convention Committee (19992000), 75th Anniversary CSPG Convention as the Logistics Chair (2001-2000), and the JACC/Annual Convention Committee (2009-2010). He earned a Volunteer Award in 1994 and has received two service awards (2000, 2002) for his Convention Committee work. Mr. Lamb has served on the Board of the Educational Trust Fund (2003) and as Chair of the H. M. Hunter Award Committee (2006-2009). He was on the Executive from 2003 to 2005, serving as President in 2004, where the possibly the most significant effect of his term on the Executive was the leadership and focus he brought to the society. In his role as Past President, he led a strategic planning process which was used for several years by the Society. Craig’s passion for serving and volunteer work is clear.
His passion for geology is also evident. He started his career in 1970 with the Mineral Resources Division, Manitoba Department of Energy and Mines as a Precambrian Geologist, progressing to Head of the Geoscience Data Section in 1979. In 1980 Craig moved to Calgary and worked for several companies, working on oilsands, regional mapping in Western Canada, and detailed reservoir studies. He managed
large drilling programs, conducted extensive core and sedimentological studies, and was a leader in developing and implementing new technology for fractured reservoir evaluation in Canada. He also worked on the design and implementation of a new graduate geological training program.
Craig founded Lonach Consulting in 1991, applying his geological expertise on diverse geological reservoirs around the world, including fractured carbonates in Libya and Iran, structurally complex clastics in Libya, and fractured granites in Vietnam and Egypt. He also taught a course on Exploration Methodology in China. In 1998, he joined Schlumberger, where as a Principal Geologist, and then Geological Advisor, he helped develop and implement standard reservoir characterization workflow processes, a methodology still utilized by Schlumberger personnel worldwide. After four years with Schlumberger, Craig moved to Husky Energy in 2002 as their Chief Geoscientist. He currently provides technical support for Husky’s major exploration and development projects including Western Canada, offshore Newfoundland, deepwater China, offshore Indonesia and Alberta’s oilsands. He is responsible for the Geological Services Group, which provides petrophysical and geological support corporately, and manages the development of Husky’s geoscience career development programs, including one for new graduates.
During his career, Craig has written more than 25 publications and major conference presentations, on topics covering reservoir characterization, naturally fractured reservoir evaluation, core analysis, regional geology, and training.
Mr. Lamb is an excellent technical geoscientist, always able to grasp the bigger picture. His strategic planning ability, both at work and with the CSPG, is outstanding. His career achievements clearly demonstrate his superior technical knowledge and leadership skills. His interest in people and his calm, caring and friendly personality are well known. The CSPG is proud to welcome Mr. Craig Lamb into the ranks of Honorary Members.
AS OF NOVEMBER 3, 2014 30 RESERVOIR ISSUE 11 • DECEMBER 2014
www.apega.ca
Did You Know?
Anyone engaged in the practice of geoscience or engineering in Alberta must be registered with The Association of Professional Engineers and Geoscientists of Alberta.
This includes individuals, partnerships, corporations and consultants practicing the professions in Alberta. It’s the law.
APEGA’s Compliance Department will answer any questions you have about reserved titles or practice and look into all suspected violations you report.
compliance@apega.ca or call us toll free at 1-800-661-7020

Professionals in Geoscience
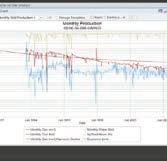
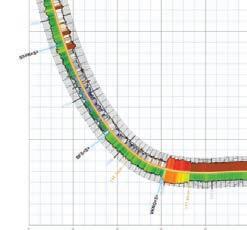
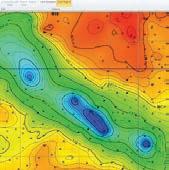

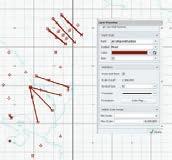
IHS Energy
IHS ENERGY
From reservoir characterization to production optimization, IHS continues to be your trusted partner in making the right decision for your investments.
Geoscience
Surface to subsurface, IHS is the world’s leading provider of information, insight and analytics supporting technical and strategic decisions throughout the energy asset value chain.
From big picture to critical detail, proven capabilities to superior results, IHS geoscience software does it all—backed by the world’s most respected forecasting, analysis and play-specific geological and geophysical data.
IHS is the only company that effectively combines high quality critical information with powerful analytical tools to enable you to make accurate technical and business decisions throughout the energy value asset chain. Whether you are investing in conventional or unconventional sources, leverage your partnership with IHS to maximize your investment, accelerate your time to market, and reduce risks. Get to the right decision faster with IHS.
TO LEARN MORE, PLEASE VISIT WWW.IHS.COM/GEOSCIENCE
To learn more, please visit IHS.com/energy
6154-0614TS
