Q2 2023 Market Report


Carmel-by-the-Sea & Carmel Point ■ Greater Carmel ■ Carmel Valley ■ Pebble Beach ■ Carmel Highlands Big Sur & South Coast ■ Pacifi c Grove ■ Monterey


02 Market Overview 03 Carmel-by-the-Sea & Carmel Point 05 Greater Carmel 07 Carmel Valley 09 Pebble Beach 11 Carmel Highlands, Big Sur & South Coast 13 Pacific Grove 15 Monterey Table of Contents Market Reports Q2 2023


 13 Pacific Grove
03 Carmel-by-the-Sea & Carmel Point
07 Carmel Valley
09 Pebble Beach
11 Carmel Highlands, Big Sur & South Coast
15 Monterey
13 Pacific Grove
03 Carmel-by-the-Sea & Carmel Point
07 Carmel Valley
09 Pebble Beach
11 Carmel Highlands, Big Sur & South Coast
15 Monterey
Get in-depth market updates for key areas across the Monterey Peninsula.
05 Greater Carmel
Q2 2023 Market Report
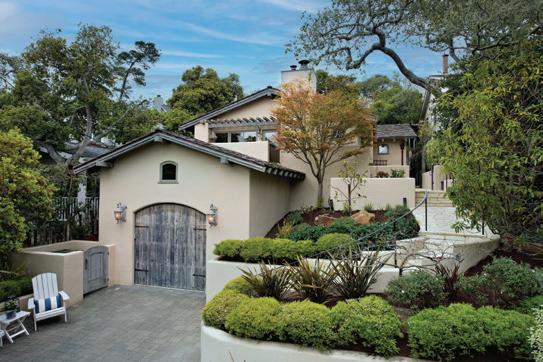
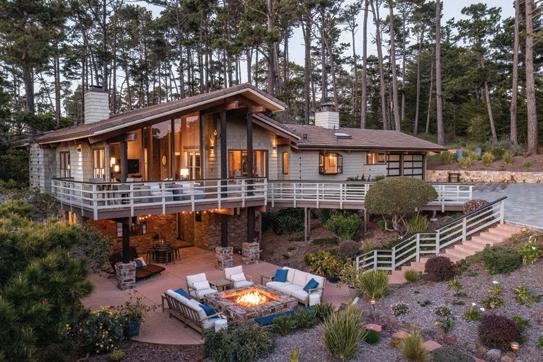
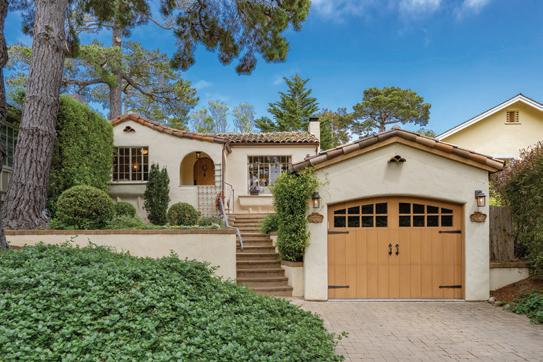
Company’s Q2 2023 Significant Sales


01 Market Reports Q2 2023
Dramatic Ocean Views in Pebble Beach
Exceptional Pebble Beach Estate
Carmel Cottage in the Golden Rectangle
Walk to Carmel’s Pristine Beaches
Ocean & Forest Views in Pebble Beach
Quintessential Carmel-by-the-Sea Cottage
3225 17 Mile Drive ■ SP: $10,000,000 ■ Rep. Buyer & Seller
2817 17 Mile Drive ■ SP: $5,500,000 ■ Rep. Buyer & Seller
Lincoln 3 SE of 10th ■ SP: $3,965,000 ■ Rep. Buyer & Seller
SW Corner of Carmelo & 7th ■ SP: $6,550,000 ■ Rep. Seller
3893 Ronda Road ■ SP: $5,398,000 ■ Rep. Seller
Casanova 3 SE of 4th ■ SP: $3,825,000 ■ Rep. Buyer & Seller
Carmel Realty
Q2 2023 Market Overview


e Monterey Peninsula experienced a strong rebound in the second quarter of 2023 a er almost nine months of slow activity. Beginning in Q4 of last year, transaction and dollar volumes in most markets across the Peninsula were down over 50% year over year. However, in this second quarter of 2023 we saw the amount of sales increase by 25.7% and the total sales volume was up 29.3% in comparison to the rst quarter of this year. While volume levels are still down year over year, we are beginning to experience a much healthier market. is market is beginning to perform like it did in 2019 prior to the Covid initiated spikes. e fear over the banking crisis and other macro-economic concerns appears to be tapering. e impact our market experienced from months of heavy rain and inclement weather is behind us and the demand for living on the Monterey Peninsula remains high.

As you might expect the gradual rebound from a slow market varies by area. is quarter, Carmel-by-the-Sea experienced an increase of 58% in units sold and 71% in total dollar volume over the last quarter. Carmel-by-the-Sea is now only down 15% year over year in total dollar volume, while the greater Carmel area is down 72% and Paci c Grove is down 26% year over year. Pebble Beach also remains down 35% year over year, however, our company alone has experienced a meaningful improvement in homes going into escrow in June and we expect a much healthier Q3.


We expect the momentum to continue through summer and hopefully into next year. Many of the conditions are in line for a healthy market, however, inventory is still down 50% from pre-Covid periods. While this negatively impacts the number of transactions it is good for retaining home values. In our key markets we only experienced high single digit decreases in home values in the last year, and that is a er those same markets experienced 30-40% increased between 2020-2022.
e current market conditions are improving but remain very dynamic. It is essential to have a strong command for exactly what is happening in each market and price point. Our inhouse analytics team tracks dozens of variables in real time and reviews them regularly with our team of professional agents. ere has never been a more important time to ensure you are being represented by the very best. We hope you will reach out to our team with real estate activity you, your friends or family may be considering.
e following report breaks out the nine markets we track with additional performance detail. We hope you will nd this report informative.
Market Update
Carmel-by-the-Sea & Carmel Point
Usanditia ne endem. Es ellictor sitat andendam et quae omnimendamus il ium sapieni mustenis rerat pera et utes corerem nimus et, testrum faccusandus.
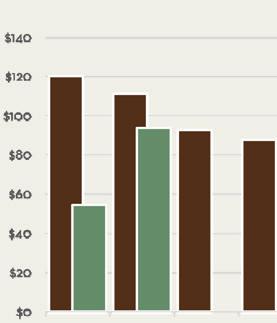
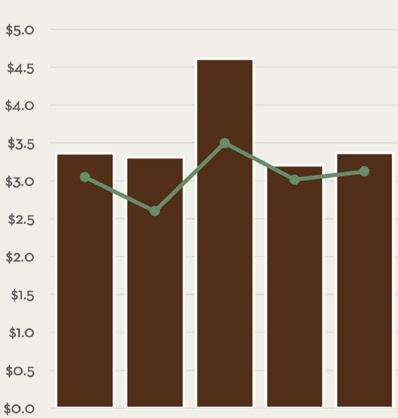
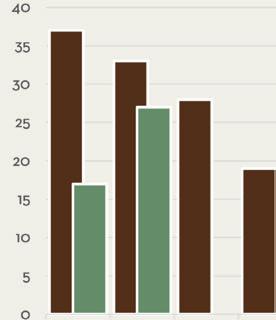
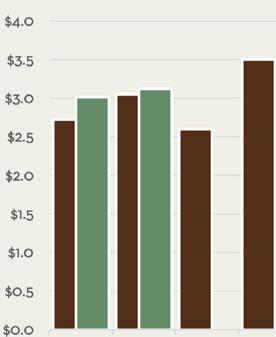
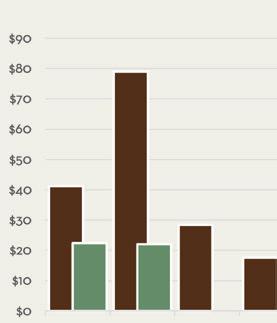
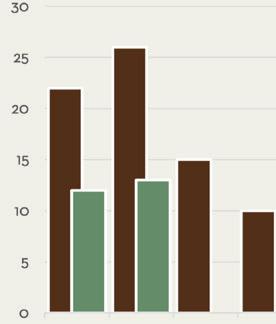
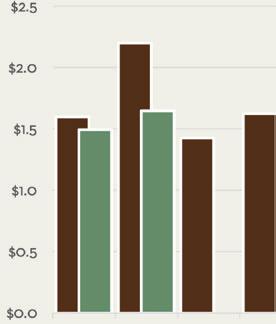
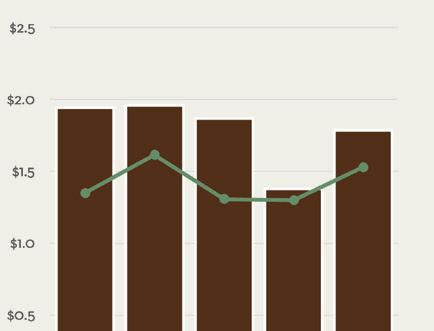
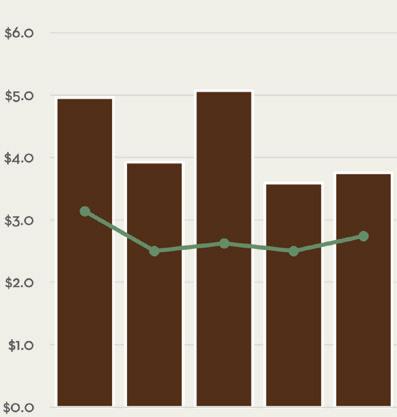
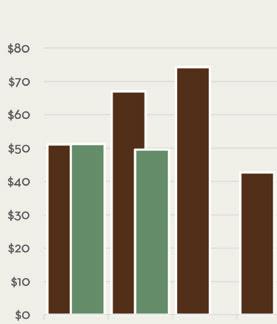
Carmel-by-the-Sea rebounded in Q2 a er an extremely slow rst quarter of the year. e total number of sales crept back to 27, up from 17 and 19 in the two previous quarters, but still well below the typical average in the mid-30s to low 40s. Average sale price was strong in Q2 2023 at $3.47M. is marks the second highest out of the last six quarters. Five sales over $5M was back to the typical level of high-end sales a er we saw just one such sale in Q1 2023.


Tate nonsequi doloris sus natem debis mos earcipsapid quia volum que si acestem unt quos volor mo ma veliquam harum re ne laut accus alic tentis eos a simpos apiet eum fuga. Ut quiae simincit aut omniantiis dem rerehenem ipit quat il ipsum re ni optatur, con necabore magnatur, niae. Omnim debit et occum quidel ius ma diorepeliat vendio enest, con core voloratiam qui o ciis dolupiet lignate nisquas quam, corendae magniet o cimos mi, que occat minus, ommo cone omnitem volorest eictian destem. At o cie nditiore quassita idelit quiam, cuptatati dolorestio volorrovide sitiur as as expeles ratiasperis eaquo
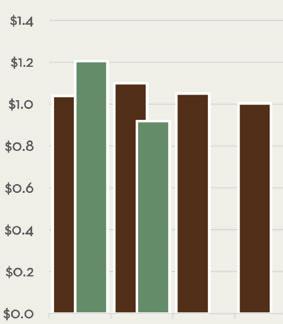
Average Selling Price
$3,468,153


8.1% 3.1% versus Q1 2023 versus Q2 2022
Days on Market
37 23.3% 362.5% versus Q1 2023 versus Q2 2022

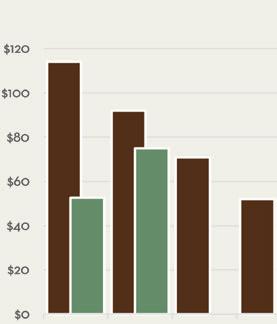
Sales Volume
$93,640,131
71.7% 15.7% versus Q1 2023 versus Q2 2022
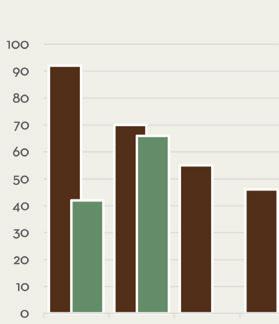
Units Sold
27
58.8% 18.2% versus Q1 2023 versus Q2 2022
Market Reports Q2 2023 03
Did You Know?


Carmel-by-the-Sea’s one-square mile village is as unique in charm as it is in fun facts. No high heels law, no street addresses, Clint Eastwood was once mayor, and Doris Day helped make Carmel dog heaven on Earth.

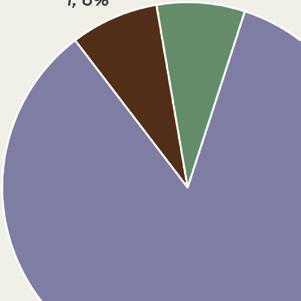
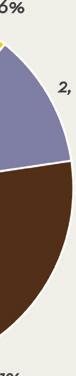
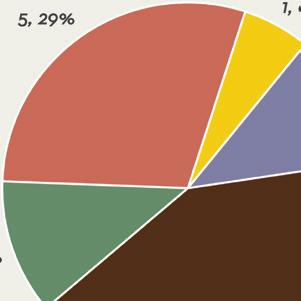
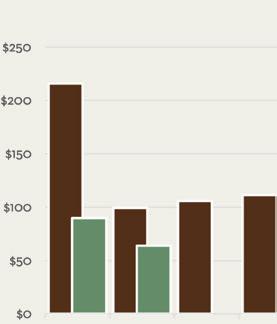
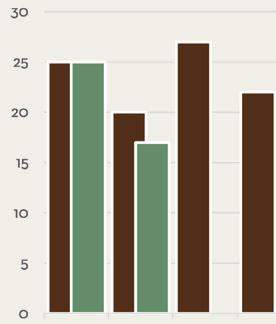
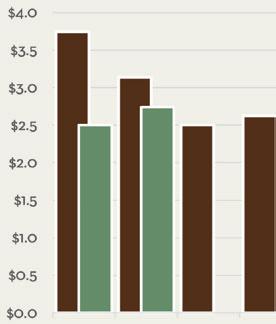
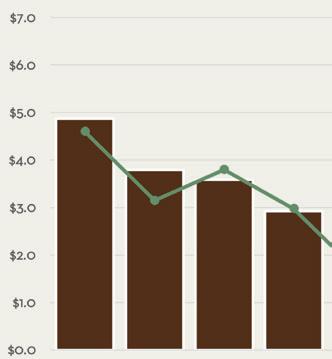
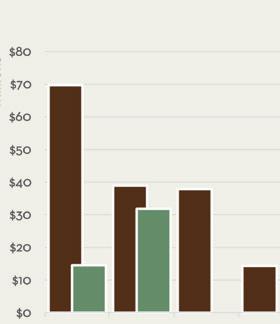
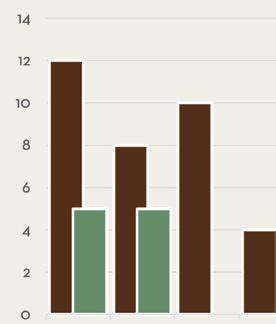
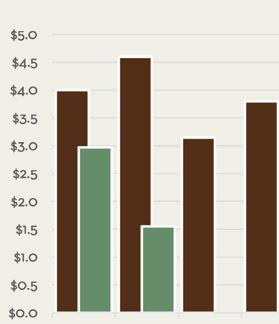
Q2 2023 Breakdown Q3 Q3 Q4 Q4 Q2 Q2 Q1 Q1 2023 2023 2023 2022 2022 2022 Median Sales Price in millions Total Sales Volume By Quarter in millions Average vs. Median Sales Price Q2 2023 Q1 2023 Q4 2022 Q3 2022 Q2 2022 Median Average
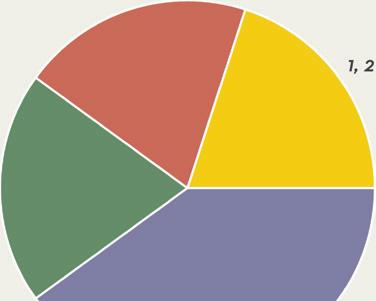
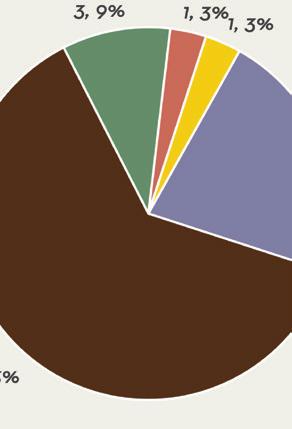
$5m+ $3m–$5m $2m–$3m $1m–$2m < $1m
“Monterey County Fun Facts”, Monterey County Convention & Visitors Bureau, 2020
Number of Closed Sales By Quarter Sales by Segment homes homes homes homes Q4 Q3 Q2 Q1
Greater Carmel
e areas outside of Carmel-by-the-Sea & Carmel Point

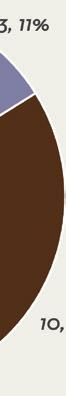
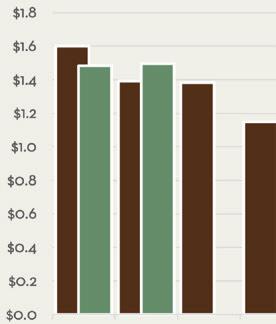
e greater Carmel area experienced yet another tough quarter, tallying just 13 sales. is marks four consecutive quarters below typical sales levels. Eleven of the 13 sales fell in the $1M-2M range with just one sale above $3M for the quarter. With $44.4M in total sales volume thus far in 2023, the greater Carmel area is on track for its lowest level in this category since 2012.
Average Selling Price
$1,692,258
9.4% 44.3% versus Q1 2023 versus Q2 2022
Days on Market
31 42.6% 24% versus Q1 2023 versus Q2 2022
Sales Volume
$21,999,355
1.8% 72.1% versus Q1 2023 versus Q2 2022
Units Sold
13 8.3% 50% versus Q1 2023 versus Q2 2022
Market Reports Q2 2023
Market Update
05
Did You Know?


Point Lobos State Reserve near Carmel hosts a geologic wonder: rocks of four “ages” can be found there, including the unusual Carmel formation dating back to the Paleocene age (over 60 million years old).
Segment Number of Closed Sales By Quarter Q3 Q3 Q3 Q4 Q4 Q4 Q2 Q2 Q2 Q1 Q1 Q1 2023 2023 2023 2022 2022 2022 Median Sales Price in millions Total Sales Volume By Quarter in millions Average vs. Median Sales Price Q2 2023 Q1 2023 Q4 2022 Q3 2022 Q2 2022 Median Average
Q2 2023 Breakdown Sales by
$5m+ $3m–$5m $2m–$3m $1m–$2m < $1m
“Monterey County Fun Facts”, Monterey County Convention & Visitors Bureau, 2020
home home homes
Carmel Valley

Including e Santa Lucia Preserve
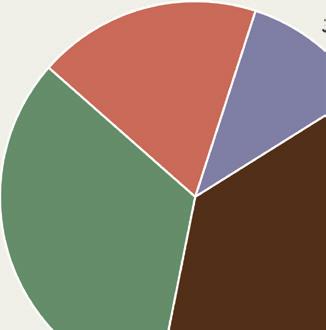
A er six months of slow sales, Q2 bounced back to healthy levels in Carmel Valley. Fi y-three total sales mark the most since Q2 of 2022, up from 39 and 34 in the two previous quarters. While average sale price ($1.785M for the quarter) was down 8.2% year over year, it was up 29.6% from Q1 2023. A er zero home sales over $3M in Q1, we saw 10 such sales in Q2, showing high priced buyers are coming back to the area. Carmel Realty Company had a hand in four of the top seven sales in the area for the quarter, two of which were double ended.
Average Selling Price
$1,785,639 29.6% 8.2% versus Q1 2023 versus Q2 2022
Days on Market
49
7.5% 63.3% versus Q1 2023 versus Q2 2022
Sales Volume
$94,638,850
76.1% 21.5% versus Q1 2023 versus Q2 2022
Units Sold
53 35.9% 14.5% versus Q1 2023 versus Q2 2022
Market Reports Q2 2023 Market Update
07
Did You Know?
Monterey County is the largest grower of Chardonnay in the United States and the largest grower of Pinot Noir in California. Monterey County has 349 vineyards, 82 bonded wineries and 65 tasting rooms.


Segment Number of Closed Sales By Quarter Q3 Q3 Q3 Q4 Q4 Q4 Q2 Q2 Q2 Q1 Q1 Q1 2023 2023 2023 2022 2022 2022 Median Sales Price in millions Total Sales Volume By Quarter in millions Average vs. Median Sales Price in millions Q2 2023 Q1 2023 Q4 2022 Q3 2022 Q2 2022 Median Average
Q2 2023 Breakdown Sales by
$5m+ $3m–$5m $2m–$3m $1m–$2m < $1m
“Monterey County Fun Facts”, Monterey County Convention & Visitors Bureau, 2020
homes homes homes homes homes
Pebble Beach

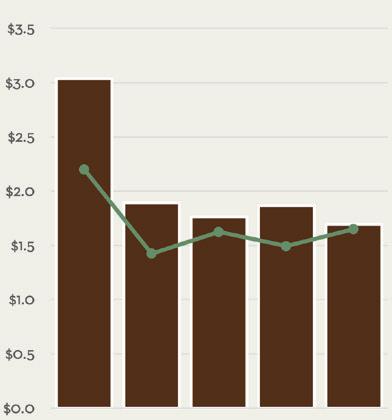
High-priced sales remained hard to come by in Pebble Beach during Q2 2023. Just one sale over $10M occurred in Q2, closing on the last day of the quarter, with Carmel Realty Company representing both seller and buyer. Just 17 sales and $63.8M in total sales volume closed in the quarter, each result being the lowest in the area over the last three years. irty homes remain on the market heading into Q3, the most over the last nine months. is includes 15 homes over $5M, four of which are over $10M. ere are a few healthy sales currently in escrow and expected to close in Q3, indicating a much stronger quarter ahead in Pebble Beach.
Average Selling Price
$3,751,294
4.4% 24.3% versus Q1 2023 versus Q2 2022
Days on Market
48
41.2% 17.1% versus Q1 2023 versus Q2 2022
Sales Volume
$63,772,000
29% 35.7% versus Q1 2023 versus Q2 2022
Units Sold
17 32% 15% versus Q1 2023 versus Q2 2022
Market Reports Q2 2023 09 Market
Update
Did You Know?


e Lone Cypress tree, located on 17-Mile Drive in Pebble Beach, is a scenic landmark for the Peninsula and is nearly 300 years old. Monterey Cypress trees are a species native only to this region and can live up to 4,000 years.
Q2 2023 Breakdown
Number of Closed Sales By Quarter Q3 Q3 Q3 Q4 Q4 Q4 Q2 Q2 Q2 Q1 Q1 Q1 2023 2023 2023 2022 2022 2022 Median Sales Price in millions Total Sales Volume By Quarter in millions Average vs. Median Sales Price Q2 2023 Q1 2023 Q4 2022 Q3 2022 Q2 2022 Median Average
Sales by Segment
$5m+ $3m–$5m $2m–$3m $1m–$2m < $1m
“Monterey County Fun Facts”, Monterey County Convention & Visitors Bureau, 2020
homes homes homes homes home
Carmel Highlands, Big Sur & South Coast
Five closed sales during Q2 matched the previous quarter and was down from eight in Q2 2022. $24.5M of the $31.9M in total sales volume for the quarter came from a single sale in Big Sur. With the remaining four sales making up just $7.4M, the median sale price dropped to $1.55M for the quarter. Eleven of the 15 active listings on the market are above $3M in list price.

Average Selling Price
$6,380,000
118.5% 30.9% versus Q1 2023 versus Q2 2022
Days on Market
78
27.1% 8.2% versus Q1 2023 versus Q2 2022
Sales Volume
$31,900,000
118.5%
18.2% versus Q1 2023 versus Q2 2022
Units Sold
5 no change 37.5% versus Q1 2023 versus Q2 2022
Market Reports Q2 2023 11 Market Update
Did You Know?

e Bixby Bridge in Big Sur was built by prisoners eager to earn “good time” o their prison sentences. It is one of the world’s highest single-span bridges at 714 feet long by 260 feet high.
Number of Closed Sales By Quarter Q3 Q3 Q3 Q4 Q4 Q4 Q2 Q2 Q2 Q1 Q1 Q1 2023 2023 2023 2022 2022 2022 Median Sales Price in millions Total Sales Volume By Quarter in millions Average vs. Median Sales Price in millions Q2 2023 Q1 2023 Q4 2022 Q3 2022 Q2 2022 Median Average
Q2 2023 Breakdown Sales by Segment
$5m+ $3m–$5m $2m–$3m $1m–$2m < $1m
“Monterey County Fun Facts”, Monterey County Convention & Visitors Bureau, 2020
home home home homes
Pacific Grove

Quarter 2 in Paci c Grove was consistent with its previous two quarters. e number of sales (32) was just two above the slow quarters of Q4 2022 and Q1 2023. Average sale price ($1.55M), while down 9.4% versus Q1, was up 1.6% compared to Q2 2022. is strong average sale price paired with average days on the market coming in at 30 days, shows a strong demand when new homes come on the market. One of the main drivers in the Paci c Grove market continues to be low inventory, with just 18 active listings moving into Q3.
Average Selling Price
$1,547,380 9.4% 1.6% versus Q1 2023 versus Q2 2022
Days on Market
30
44.4% 233.3% versus Q1 2023 versus Q2 2022
Sales Volume
$49,516,155
3.4% 26.1% versus Q1 2023 versus Q2 2022
Units Sold
32 6.7% 27.3% versus Q1 2023 versus Q2 2022
Market Reports
13 Market
Q2 2023
Update
Did You Know?
e Monarch Butter y Sanctuary in Paci c Grove is one of the largest monarch overwintering sites in America. e monarchs arrive in October a er a 2,000-mile migration and overwinter until February.


Number of Closed Sales By Quarter Q3 Q3 Q3 Q4 Q4 Q4 Q2 Q2 Q2 Q1 Q1 Q1 2023 2023 2023 2022 2022 2022 Median Sales Price in millions Total Sales Volume By Quarter in millions Average vs. Median Sales Price in millions Q2 2023 Q1 2023 Q4 2022 Q3 2022 Q2 2022 Median Average
Q2 2023 Breakdown
“Monterey County Fun Facts”, Monterey County Convention & Visitors Bureau, 2020
homes homes homes home home < $800k $800k–$1.2m $1.2m–$2m $3m+ $2m–$3m
Monterey & Del Rey Oaks
Monterey experienced 66 total sales during Q2, the most since Q2 2022. Zero sales over $3M, limited the average sale price to $1.13M, down 13.6% year over year, and 9.5% quarter over quarter. Median sale price also dipped to $918K, the lowest since Q1 of 2021. Forty active listings at the end of the quarter are the most since last October, showing promise for a high number of sales in the quarter ahead.

Average Selling Price
$1,134,770
9.5% 13.6% versus Q1 2023 versus Q2 2022
Days on Market
25
4.2% 10.7% versus Q1 2023 versus Q2 2022
Sales Volume
$74,894,816
42.2% 18.6% versus Q1 2023 versus Q2 2022
Units Sold
66
57.1% 5.7% versus Q1 2023 versus Q2 2022
Market Reports Q2 2023 15 Market Update
Did You Know?
e Monterey Bay National Marine Sanctuary covers 5,312 square miles. is is one and a half times the size of the largest national park in the continental U.S. At its center is a submarine canyon twice as deep as the Grand Canyon.
“Monterey County Fun Facts”, Monterey County Convention & Visitors Bureau, 2020
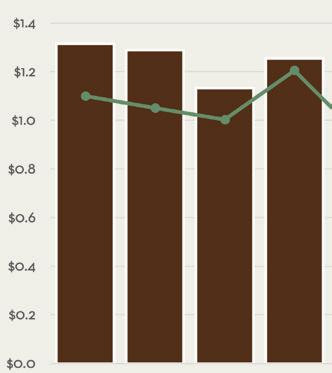


Segment Number of Closed Sales By Quarter Q3 Q3 Q3 Q4 Q4 Q4 Q2 Q2 Q2 Q1 Q1 Q1 2023 2023 2023 2022 2022 2022 Median Sales Price in millions Total Sales Volume By Quarter in millions Average vs. Median Sales Price in millions Q2 2023 Q1 2023 Q4 2022 Q3 2022 Q2 2022 Median Average
Q2 2023 Breakdown Sales by
homes homes homes homes < $800k $800k–$1.2m $1.2m–$2m $3m+ $2m–$3m


Market Reports Q2 2023 17 One-of-a-Kind Gem in Carmel Monterey Bay Views in Monterra Ranch Total Privacy in Carmel Valley Modern, Inviting Pebble Beach Estate Sweeping Ocean Views in Pebble Beach Carmel Point Perfection Monte Verde 2 NE of 6th ■ 5 beds, 5.5 baths ■ $14,997,000 7860 Monterra Oaks Road ■ 4 beds, 4.5 baths ■ $4,995,000 31660 Via La Estrella ■ 5 beds, 4.5 baths ■ $3,575,000 1516 Riata Road ■ 4 beds, 4.5 baths ■ $7,900,000 1445 Riata Road ■ 4 beds, 5+ baths ■ $7,450,000 26387 Isabella Avenue ■ 4 beds, 3 baths ■ $15,000,000
Our Featured Listings
A Cornerstone in Luxury Real Estate for Over 100 Years


Carmel Realty Company was founded in 1913, predating the incorporation of the City of Carmel. For four generations since then, e Mitchell Family has been a leader in the Real Estate market in Carmel and Pebble Beach. When the Mitchell Family sold their billion-dollar real estate company, e Mitchell Group, to Sotheby’s International Realty in August 2005, Dan and Shelly Mitchell Lynch purchased Carmel Realty Company in order to continue its century of quality and rich tradition as local, luxury real estate experts. e goal was to remain local business owners and to maintain the family’s impeccable position in the local real estate market. Carmel Realty Company is the oldest real estate company in Carmel with a rich history and heritage of being family-owned and a reputation for integrity, longevity and excellence. Our longevity is no accident. It is an incredible brand and brand name. Carmel Realty Company has been in business since 1913, and we operate upon the principles of integrity, work ethic, teamwork, collaboration, communication and customer service. We are very excited and proud of the company, the vision and our team of professionals who have been hand-picked, proven and benchmarked as the best in the business.

831.622.1000 ■ info@CarmelRealtyCompany.com ■ Dolores Street between 7th & 8th, Carmel-by-the-Sea Carmel Realty Company DRE#01871627
Authentic Market Leaders & True Industry Experts

As the market leading luxury brokerage, for over 100 years we have consistently delivered outstanding quality and service to our clients. Our handpicked team of agents share our commitment to quality, integrity, and the community. Unmatched experience, local knowledge, and collaboration has allowed our team to achieve the highest average agent production in the market year a er year.
Best Real Estate Company Scan the Code to Learn More About Our Agents & Team Members Herald Readers’ Choice 2018-2022, Monterey Weekly 2019-2022, Golden Pine Cone 2011-2015, & 2017-2022 Best Company for Giving Back Herald Readers’ Choice 2020-2022 CarmelRealtyCompany.com ■ 831.622.1000 ■ info@CarmelRealtyCompany.com ■ Dolores Street between 7th & 8th, Carmel-by-the-Sea Since 1913 | A Cornerstone in Luxury Real Estate for Over One Hundred Years Best Place to Work Golden Pine Cone, Carmel Pine Cone 2018-2020, 2022 When you work with Carmel Realty Company,
can
in
you
working with an authentic expert in
Peninsula real estate.
you
take comfort
knowing
are
Monterey
