The second quarter traditionally brings renewed energy to the market, and this year was no exception Activity was fueled by a wave of new inventory, strong buyer interest, and the enduring appeal of life here on The Monterey Peninsula However, that momentum was briefly interrupted by global economic uncertainty, triggered by newly announced tariffs which led to a short-lived slowdown in home sales
Even so, the market’s resilience quickly came into focus By June, activity had regained its pace, closing out the quarter with renewed strength and a sense of confidence heading into the height of the summer season
Compared to Q1, the market saw across-the-board gains: home sales, average sales price, and total sales volume all increased, while days on market declined a trend expected as seasonal activity ramps up The average sales price rose by 10%, while 60 additional sales pushed total volume up by approximately $153M a 39% increase Meanwhile, average days on market dropped to about 1 5 months, a notable improvement from the 2+ months seen in Q1
Versus Q2 2024, the market held relatively steady. The number of homes sold remained unchanged, and both the average sales price and total volume showed less than a 5% change However, days on market improved slightly, with properties spending an average of four fewer days on the market compared to the same period last year
We’re busier than ever, but always here to help with any questions or real estate needs!
All our best,
TABLE OF CONTENTS
Carmel by the Sea
Greater Carmel
Carmel Valley
Pebble Beach
Monterey
Pacific Grove
Seaside
Marina
Corral & San Benancio
2 4 6 8 10 12 14 16 18
Carmel - by - the - Sea
Carmel-by-the-Sea posted a strong Q2, with increases in units sold, total volume, and average sales price. The average sales price reached $4.1M, a nearly 25% increase, largely due to a $17.5M sale that skewed the average upward. Excluding this sale, the average price was $3 45M, representing a 4% gain from Q1.
When compared to the same period in 2024, figures appear down at first glance. However, it's important to note that Q2 of last year included a $28M sale, which inflated the metrics. Adjusting for that outlier, the average sales price this quarter would show only a 6% decrease, while total sales volume would reflect a 2% increase a positive indicator of underlying market resilience. Meanwhile, days on market remained steady at 47, suggesting continued buyer engagement and pricing stability.
Greater Carmel
Carmel experienced a strong second quarter, with total sales volume jumping over $41 million a ~45% increase from Q1 driven by a notable rise in the number of transactions. However, homes took longer to sell, with average days on market increasing to 78, up 30% from the previous quarter. Average sales prices held steady, rising 3% quarterover-quarter
S A L E S B Y S E G M E N T
Compared to Q2 2024, overall sales volume remained virtually flat, with just a 1% increase. While average prices rose year-over-year, fewer units were sold. Days on market saw a sharp year-over-year increase of 35 days an 83% jump. Notably, two sales over $10 million in the 93923 ZIP code helped push the average sales price higher marking the return of ultra-luxury activity not seen since Q3 2023.
Carmel Valley
Sales prices continued their upward trend, as homes under $1M made up just 5% of all Q2 transactions down sharply from 25% in Q1 and a trailing fourmonth average of 16%. A standout $7.8M sale helped elevate the average sales price to $2.24M an increase of $540K, or 32%, quarter-over-quarter.
Sales activity also picked up, with 19 homes sold a 58% increase from Q1 and the highest number of quarterly sales since Q2 2023. These gains propelled total sales volume to more than double the previous quarter, marking a 109% jump. Homes spent an average of 75 days on market, indicating steady demand
Year-over-year comparisons show similarly strong performance: the average sales price rose by $518K (30%), while the number of homes sold increased 27%, pushing total volume up 65% from Q2 2024.
Pebble Beach
Pebble Beach recorded its first $10M+ sale of 2025, an off-market sale where our team represented the Seller. This milestone, alongside a healthy mix of additional home sales, contributed to an average quarterly sales price of $3.6M the highest since Q2 2024. With 20 closings, this was the most active second quarter since 2021. Market velocity also improved meaningfully, with days on market dropping to just 26 days, a 46% improvement over Q1
Compared to Q2 2024, the average sales price declined by roughly $625K, or 15%. Even so, total transaction volume rose year-over-year, though overall dollar volume dipped by 6%. Notably, homes also sold 12 days faster on average than they did in Q2 of last year highlighting a continued demand for well-positioned properties.
Monterey
The second quarter is typically Monterey’s most active period for home sales, and this year followed suit with 40 sales, a 74% increase over Q1 and 17 more transactions However, while activity was up quarter-over-quarter, this still marked the lowest Q2 sales total since 2020. The average sales price held steady at $1.5M, reflecting only a modest 1% shift from Q1. Meanwhile, days on market dropped by 11%, reaching an average of 42 days. Looking year-over-year, the average sales price was nearly unchanged, with just a 3% variation compared to Q2 2024. However, a 15% drop in the number of homes sold led to a 12% decline in total sales volume. The most striking shift came in days on market, which saw a 134% increase from Q2 of last year underscoring the more deliberate pace of today’s buyers and longer decision cycles.
Pacific Grove
Following a strong first quarter, Pacific Grove experienced a softer Q2, with key metrics trending slightly downward. The average sales price settled at $1.64 million, a modest 4% dip from Q1, while the number of sales declined by 7%, resulting in an overall 11% drop in total sales volume. Year-over-year, the average sales price was relatively unchanged down just 2% but two additional transactions boosted total sales volume by 6%. Notably, average days on market fell by 36%, suggesting quicker closings and sustained buyer interest.
Despite the overall cooling from both Q1 and the same period in 2024, sellers remained well-aligned with the market. Homes sold for an average of 101% of their list price, reflecting realistic pricing strategies and continued demand in the area.
Seaside
Seaside continued its gradual start to 2025, posting 29 home sales in the second quarter still below the mid-40s pace seen in the years leading up to 2021. While sales remain lower by historical standards, activity showed modest improvement over Q1, with two additional transactions and a $60K increase in the average sales price a 7% gain bringing total sales volume up 15%. Days on market remained steady at 40 days, showing consistency in buyer engagement.
Compared to Q2 2024, the market showed mixed results. While one more home sold year-over-year, the average sales price declined by 12%, leading to a 9% drop in total volume. Additionally, homes spent significantly longer on the market, with days on market rising 68% to 40 days.
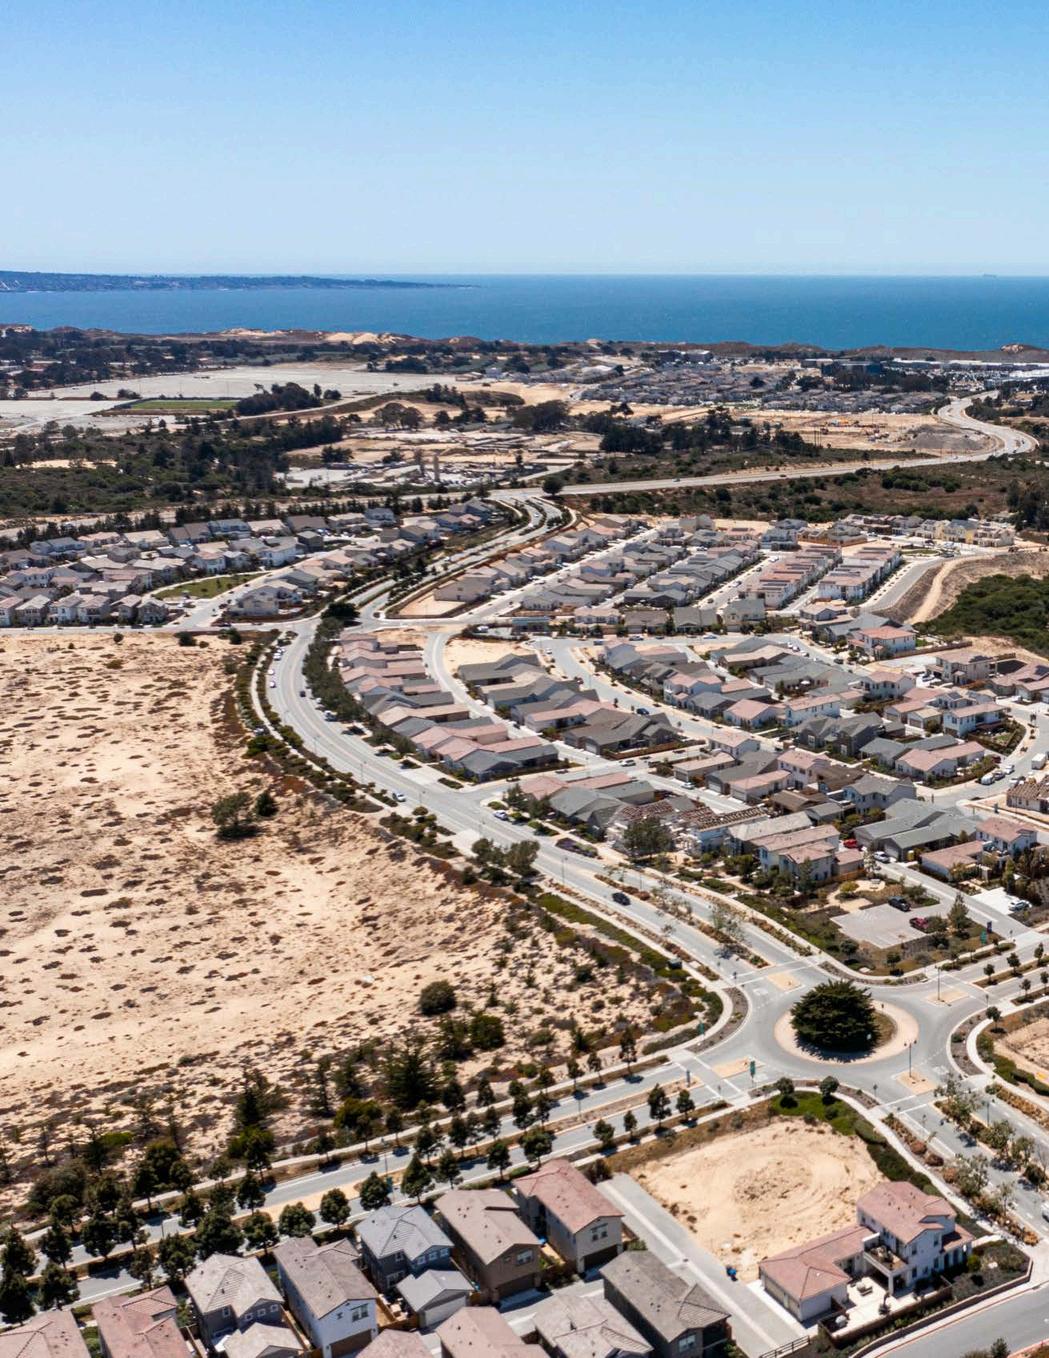
Marina
Marina’s average sales price surpassed $1M this quarter only the third time on record it has done so. Of the 34 homes sold, 16 (47%) closed above the $1M mark. These high-end sales were concentrated in Sea Haven (8 homes), East Garrison (3), and The Dunes (3), with the remainder spread throughout the city The number of homes sold rose by six compared to Q1, fueling a 27% increase in total sales volume. Days on market also improved, decreasing by three days to an average of 36 for the quarter.
Year-over-year, metrics trended lower, largely due to Q2 2024 being Marina’s strongest quarter on record in both average sales price and total volume The market remains healthy, with homes selling for an average of 102% of their list price indicating continued buyer competition and pricing strength.
Corral&San Benancio
In Q2 2025, the 93908 area code saw a mixed set of performance indicators. Compared to Q1, home sales increased by 42% (up by 11 transactions), while the average sales price dipped slightly by 5%. Despite the pricing shift, overall sales volume rose by nearly $12M a 35% gain driven by higher activity Additionally, days on market dropped by 22 days, reflecting a quicker pace of sales.
Compared to Q2 2024, the number of homes sold rose by 61%, with 14 additional transactions, and days on market improved by 22 days a 34% decrease that reflects ongoing buyer interest However, the average sales price declined by 21%, which ultimately contributed to a 26% reduction in total sales volume, despite the increased activity.