Q1 2024 Market Report
Carmel-by-the-Sea & Carmel Point ■ Greater Carmel ■ Carmel Valley Pebble Beach ■ Carmel Highlands Big Sur & South Coast


Q1 2024 Market Report A True Legacy Home in Pebble Beach Carmel Point Perfection
Ocean Views
1463 Oleada Road ■ 8 beds, 9+ baths ■ $29,000,000 26387 Isabella Avenue ■ 4 beds, 3 baths ■ $15,000,000 8 Black Mountain ■ 4 beds, 4.5 baths ■ $7,500,000 3365 17 Mile Drive ■ 5 beds, 6 baths ■ $14,500,000 24308 San Juan Road ■ 3 beds, 3.5 baths ■ $5,499,000 Our Featured Listings
Stunning Spanish-Style Estate in The Preserve Ideally Situated Pebble Beach Estate
in Carmel Woods
Viscaino Road ■ 5 beds, 5+ baths ■ $12,950,000
Luxury Coastal Living in Pebble Beach 1544
Q1 2024 Market Report


Table of Contents
in-depth market updates for
Get
key areas across the Monterey Peninsula.
02 Market Overview 03 Carmel-by-the-Sea & Carmel Point 05 Greater Carmel 07 Carmel Valley 09 Pebble Beach 11 Carmel Highlands, Big Sur & South Coast


01 Q1 2024 Market Report
Antonio 2 SE of 12th ■ LP:
■ Rep. Buyer & Seller
Isabella Avenue ■ LP: $4,950,000 ■ Rep. Buyer & Seller
Verde
SW
12th ■ LP:
■ Rep. Seller
Del Ciervo Road ■ LP: $5,250,000 ■ Rep. Buyer & Seller
Hatton Road ■ LP: $4,950,000 ■ Rep. Seller
Poplar Court ■ LP: $2,599,000 ■ Rep. Buyer & Seller Carmel Realty Company’s Q1 2024 Significant Sales
Classic Mediterranean in Carmel-by-the-Sea Stunning Carmel Point Estate Charming Carmel-by-the-Sea Cottage Timeless Mid-Century Pebble Beach Residence Ocean Views in Private Carmel Home Carmel Valley Ranch Golf House San
$6,500,000
26271
Monte
4
of
$3,595,000
3179
25820
9644


Q1 2024 Market Overview
Much like the close of 2023, the Monterey Peninsula’s real estate market had a sleepy start to 2024. e typical rainy and windy weather conditions throughout the opening months of the year paired with continued economic pressure on both the entry level and luxury ends of the market led to a slow rst two months of the year. e entry level market remained uneasy due to lingering elevated interest rates. e higher end of the market stayed slow over the winter months due to macroeconomic uncertainty, geopolitical concerns, and other distractions that kept most a uent buyers on the sidelines. Luckily, as we moved into March, we felt a surge of activity. A er 91 new listings in January and 98 more in February, March saw 152 new listings come to market. is was the highest number of new listings we have seen come on the market in one calendar month since June of 2022.


Looking back, as we have discussed in our recent quarterly updates, the market began its slowdown a er its post-pandemic outburst during the second half of 2022. e fourth quarter of 2022 was the rst post-pandemic quarter to come short of reaching 300 sales. e market has since failed to reach 300 sales for six consecutive quarters. While just 205 sales closed in Q1 of 2024, like the return of new listings, there was also an increased number of sales in March 2024. A er sales numbers of 57 and 60 during January and February, March saw a rise to 88 sales, representing 43% of all sales during the quarter.
As you dive into the speci cs of the individual areas across the Peninsula, you will see some consistent trends as well as unique di erences in the market between our communities. Sale prices in most areas remain high, with several at or near all-time highs. Conversely, in an area like Pebble Beach, the lack of high-priced sales greatly a ected all numbers in the area, as well as the average sale price for the Peninsula as a whole. Pebble Beach saw its lowest number of sales for any threemonth period this century, as well as its lowest average sale price in four years.


Good news exists moving into the Spring season for Pebble Beach, as well as many other areas across the Peninsula. For example, the March surge brought Pebble Beach eleven sales on listings that currently remain in escrow as we move into the second quarter. ese sales alone, if closed in Q2, would double the sales volume seen in the area during Q1.
Overall, demand in our market remains high, and a er many buyers decided to sit out during 2023, it seems as if new buyer activity has expanded over the last month and remains strong in April and moving forward this year. Expert local insight alongside quality service can add signi cant value when demand, product, and pricing is changing rapidly like it is right now. Please reach out to one of our full-time professional agents should you or any of your friends or family be considering a real estate transaction here on the Monterey Peninsula.
We hope you enjoy the following detailed analytic view of our market.


Market Update
Market Update
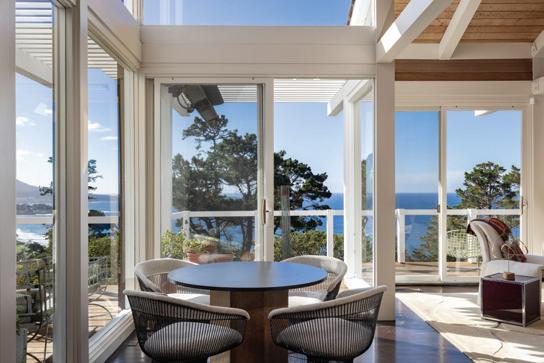
Carmel-by-the-Sea & Carmel Point
Usanditia ne endem. Es ellictor sitat andendam et quae omnimendamus il ium sapieni mustenis rerat pera et utes corerem nimus et, testrum faccusandus. Tate nonsequi doloris sus natem debis mos earcipsapid quia volum que si acestem unt quos volor mo ma veliquam harum re ne laut accus alic tentis eos a simpos apiet eum fuga. Ut quiae simincit aut omniantiis dem rerehenem ipit quat il ipsum re ni optatur, con necabore magnatur, niae. Omnim debit et occum quidel ius ma diorepeliat vendio enest, con core voloratiam qui o ciis dolupiet lignate nisquas quam, corendae magniet o cimos mi, que occat minus, ommo cone omnitem volorest eictian destem. At o cie nditiore quassita idelit quiam, cuptatati dolorestio volorrovide sitiur as as expeles ratiasperis eaquo
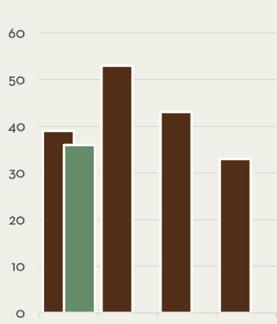
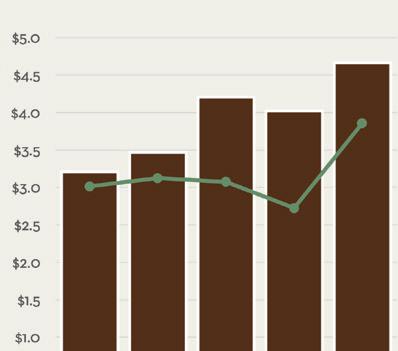
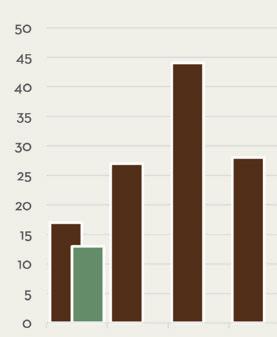
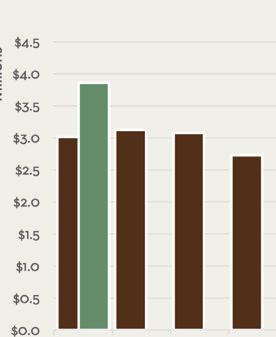
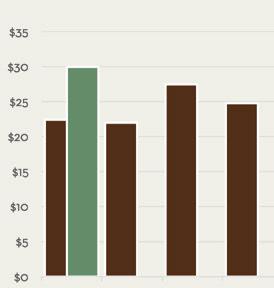
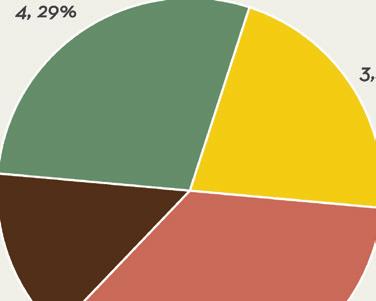
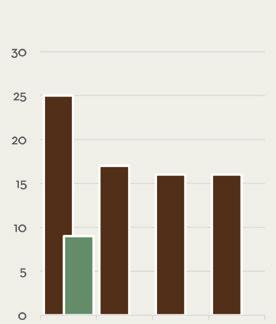
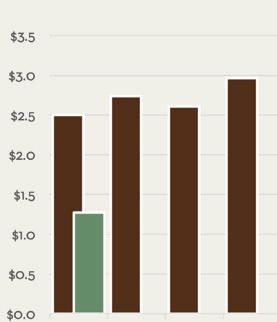
With just 13 sales in the quarter and three sales over $6M, Carmel-by-the-Sea notched a record-high quarterly average sale price, topping $4.66M. e 13 sales in Q1 2024 are the lowest of any quarter dating back to 2000. In fact, over this same period, there has never been any running three-month period with less than 16 sales in the area. A er a few years of fast paced sales, the average days to sell of 61 days is right on par with the years 2018-2020. Available inventory sits at just 17 homes on the market to end the quarter, which is down from an average of 55 in the same 2018-2020 period. Four sales topped $4.95M in Carmel-by-the-Sea in Q1 2024. Carmel Realty Company and Monterey Coast Realty teamed up to double end three of these four high-priced sales during the quarter.

Carmel-by-the-Sea & Carmel Point Units Sold
61 Average Selling Price


Sales Volume
$4,661,824
$60,603,710 Days on Market

Q1 2024 Statistics versus Q4 2023 versus Q4 2023 versus Q4 2023 versus Q4 2023 versus Q1 2023 versus Q1 2023 versus Q1 2023 versus Q1 2023
13
Q1 2024 Market Report 03
16% 1.6% 46.2% 53.6% 45.4% 103.3% 11.2% 23.5%


Know?
Carmel-by-the-Sea is known for attracting various celebrities and artists. Clint Eastwood served as mayor of the village from 1986-1988. Other notable celebrities, artists and writers who have called Carmel home include Doris Day, John Denver, Ansel Adams and Jack London.
“Monterey County Fun Facts”, Monterey County Convention & Visitors Bureau, 2020
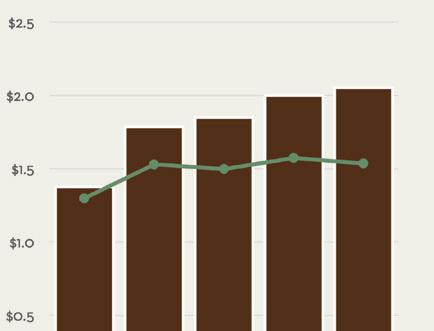
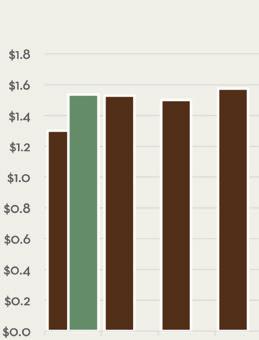
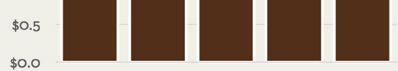
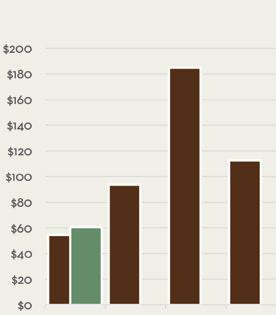
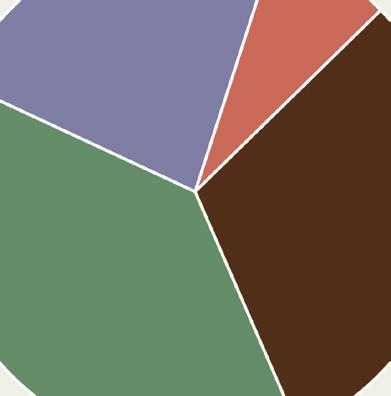
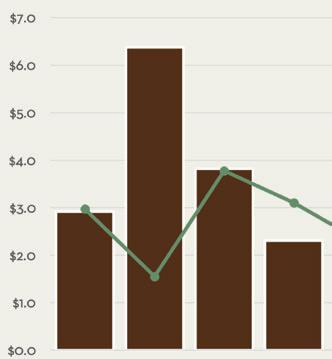
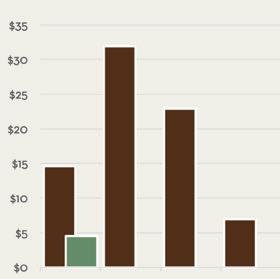
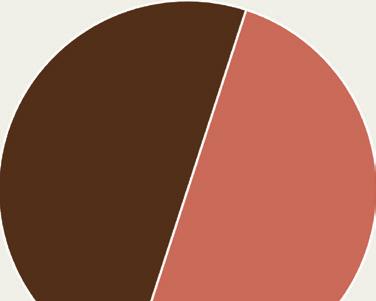
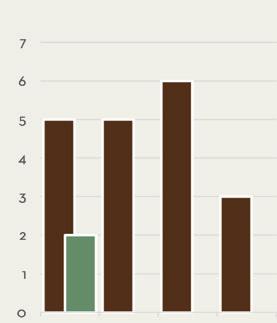
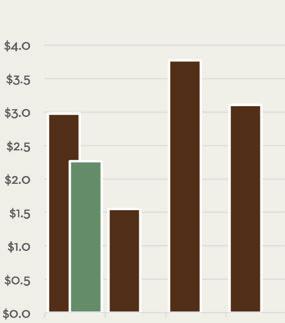
Q3 Q4 Q2 Q1 2024 2024 2024 2023 2023 2023 Median Sales Price in millions Total Sales Volume By Quarter in millions Average vs. Median Sales Price Q1 2024 Q4 2023 Q3 2023 Q2 2023 Q1 2023 Median Average $5m+ $3m–$5m $2m–$3m $1m–$2m < $1m Q1 Q2 Q3 Q4
Q1 2024 Breakdown
home homes homes Q4 Q3 Q2 Q1
Did You
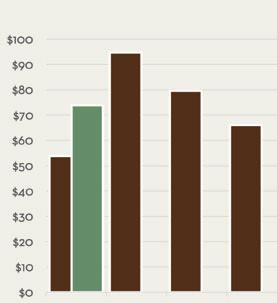
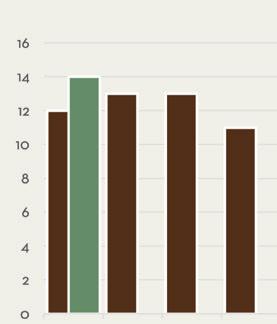
Number of Closed Sales By Quarter Sales by Segment homes
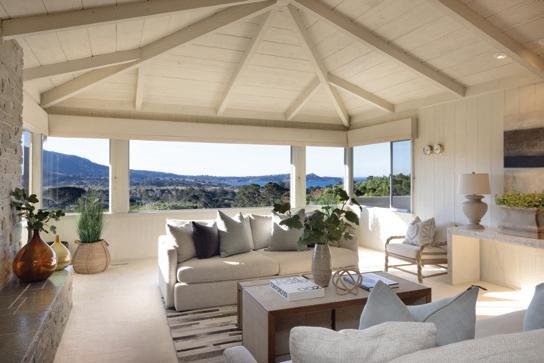
Greater Carmel
e areas outside of Carmel-by-the-Sea & Carmel Point
e Greater Carmel area’s 14 sales in Q1 2024 were the most in a quarter since Q3 2022. An average sale price topping $2.13M was strong, edging out 2023’s yearly average of $1.97M. Inventory has consistently been low in this area, not having topped 20 homes on the market since 2020, and currently standing at 12 homes on the market. e top sale in Q1 2024 was 25820 Hatton Road, listed by Carmel Realty Company.
$2,139,571
$29,954,000
14
Q1 2024 Market Report
Units Sold
Sales Volume
Days on Market
Average Selling Price
41
Market Update
05
Q1 2024 Statistics
5% 18% 20.9% 27.3% 14.6% 24.1% 33.7% 16.7%
versus Q4 2023 versus Q4 2023 versus Q4 2023 versus Q4 2023 versus Q1 2023 versus Q1 2023 versus Q1 2023 versus Q1 2023
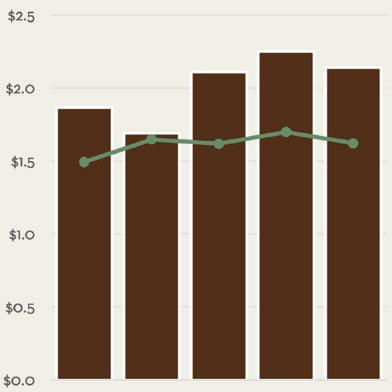

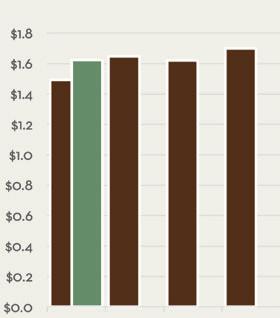
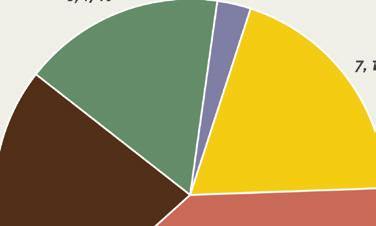
Number of Closed Sales By Quarter Q3 Q3 Q3 Q4 Q4 Q2 Q2 Q1 Q1 Median Sales Price in millions Total Sales Volume By Quarter in millions Average vs. Median Sales Price in millions Median Average $5m+ $3m–$5m $2m–$3m $1m–$2m < $1m Q4 Q2 Q1
Monterey County Convention & Visitors Bureau,
Q2 Q1 homes homes homes homes 2024 2024 2024 2023 2023 2023 Q1 2024 Q4 2023 Q3 2023 Q2 2023 Q1 2023
Q1 2024 Breakdown Sales by Segment
Did You Know? Robert Louis Stevenson modeled Treasure Island’s Spyglass Hill a er Point Lobos State Reserve near Carmel. “Monterey County Fun Facts”,
2020
Carmel Valley
Including e Santa Lucia Preserve
Carmel Valley set a record for average sale price during Q1, coming in at $2.05M. While 36 sales in the quarter was three more than the previous quarter, a healthy number would come closer to 50 sales in the area. With sale prices being high, total sales volume came in at $73.95M, topping two of the four quarters in 2023. With 51 active listings to begin Q2, there is evidence an uptick in Carmel Valley sales may return as we head into summer.

$2,054,132
$73,948,750
36
Q1 2024 Market Report
Update
Market
Units Sold
Sales Volume
Days on Market
Average Selling Price
75
07 Q1 2024 Statistics
Q4
versus Q4
versus Q1
versus
versus Q1
2.7% 87.5% 12% 9.1% 49% 41.5% 37.6% 7.7%
versus Q4 2023 versus Q4 2023 versus
2023
2023 versus Q1 2023
2023
Q1 2023
2023
Pebble Beach
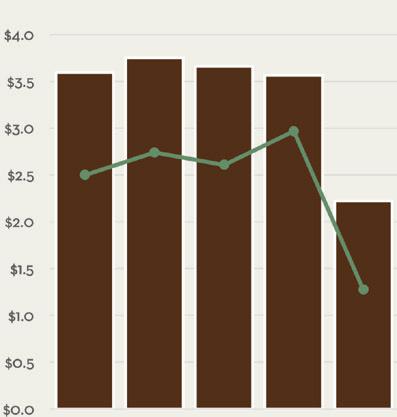
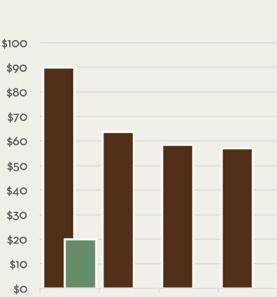
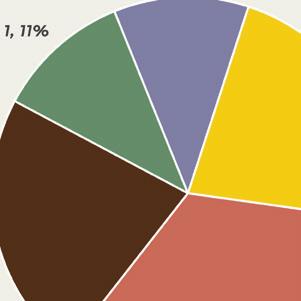
$2,222,132 Pebble Beach saw the area’s slowest sales quarter on record with just nine sales over the rst three months of the year. In addition, typically an area with 20-30% of sales coming in over $5M in price, Pebble Beach saw just one sale (11%) come in over $5M during Q1 2024. is one sale was a $5.5M property double-ended by Carmel Realty Company. Only one of the other eight closed sales sold for over $3M during the quarter. is brought the quarterly average sale price down to $2.22M, the lowest since Q1 2020. Reasons for optimism do exist in Pebble Beach, as 11 listings are currently in escrow totaling over $38M in list price. If successfully closed in Q2, these 11 listings alone would double Q1’s output. Also, an additional 29 listings remain on the market, which is nearing the most we’ve seen over the past year and a half.
$19,999,190
9
Q1 2024 Market Report 09 Market Update
Units Sold
Sales
Volume
Days on Market
Price
24 Average Selling
Q1 2024 Statistics
37.6% 65.7% 64.9% 43.8% 38.2% 29.4% 77.7% 64%
versus Q4 2023 versus Q4 2023 versus Q4 2023 versus Q4 2023 versus Q1 2023 versus Q1 2023 versus Q1 2023 versus Q1 2023


Did You Know?
17-Mile Drive through Pebble Beach is one of only nine private toll roads in the country, and the only one west of Mississippi.
“Monterey County Fun Facts”, Monterey County Convention & Visitors Bureau, 2020
of Closed Sales By Quarter Q3 Q3 Q4 Q4 Q4 Q2 Q2 Q1 Q1 Median Sales Price in millions Total Sales Volume By Quarter in millions Average vs. Median Sales Price Median Average $5m+ $3m–$5m $2m–$3m $1m–$2m < $1m Q3 Q2 Q1
Q1 2024 Breakdown Sales by Segment Number
Q1 homes homes home home homes 2024 2024 2024 2023 2023 2023 Q1 2024 Q4 2023 Q3 2023 Q2 2023 Q1 2023
Carmel Highlands, Big Sur & South Coast
Just two home sales occurred in Carmel Highlands and Big Sur during Q1 2024. e area began Q2 with 21 homes on the market, eleven of which are listed over $5M, and seven of which are over $10M. Five homes are currently in escrow in the area, showing promise for a strong summer.

$2,265,000
$4,530,000
2
Q1 2024 Market Report 11 Market Update
Sold
Units
Sales Volume
Days on Market
Average Selling Price
176
Q1 2024 Statistics versus Q4 2023 versus Q4 2023 versus Q4 2023 versus Q4 2023 versus Q1 2023 versus Q1 2023 versus Q1 2023 versus Q1 2023 1.9% 170.8% 34.6% 33.3% 22.4% 64.5% 69% 60%

Did You Know?
Local settings from around the Monterey Peninsula have provided the backdrops for more than 180 lms and television shows. You’ll recognize many scenes in HBO’s award winning mini-series Big Little Lies in Big Sur and the Carmel Highlands.
Q1 2024 Breakdown
Number of Closed Sales By Quarter Q3 Q3 Q3 Q4 Q4 Q2 Q2 Q1 Q1 Median Sales Price in millions Total Sales Volume By Quarter in millions Average vs. Median Sales Price in millions Median Average $5m+ $3m–$5m $2m–$3m $1m–$2m < $1m Q1 Q2 Q4
Sales by Segment
“Monterey County Fun Facts”, Monterey County Convention & Visitors Bureau, 2020
Q2 Q1 home home 2024 2024 2024 2023 2023 2023 Q1 2024 Q4 2023 Q3 2023 Q2 2023 Q1 2023