

BURWOOD
Resourcing Strategy 2022-2032 22
32

Acknowledgement of Country
We acknowledge the Wangal Clan of the Eora Nation, the traditional custodians of the lands on which the Burwood Local Government Area is located.
We pay our respects to their elders past, present and emerging. We acknowledge and respect their cultural heritage, beliefs and ongoing relationship with the land.
2 Back to contents

Contents Our Resourcing Strategy 4 About Burwood 6 About Council 9 Our 2036 Vision 12 Our Finances 15 Long Term Financial Plan 2024 to 2034 16 Our Assets 45 Asset Management Strategy 2024 to 2034 46 Appendix 61 Strategic Asset Management Plan 65 Our People 117 Workforce Management Plan 2022 to 2026 118 Our Digital Infrastructure 131 Digital Strategy 2022 to 2026 132 3 Burwood Resourcing Strategy Introduction
Our Resourcing Strategy
The Burwood Resourcing Strategy 2022-2032 is Council’s integrated approach to planning for and allocating the resources required to deliver the services and infrastructure our community needs at the right time over the next ten years.
It is an integral part of our Integrated Planning and Reporting Framework (IP&R) as it defines the resources we will use to deliver on the priorities and aspirations of our community, stakeholders and organisation. With this in place we are in a better position to make adequate provision for the financial, infrastructure assets, people and digital resources required to deliver on our commitments in the Delivery Program 2022-2026 and work towards achieving the Burwood2036 Vision through each year’s annual Operational Plan.
The Resourcing Strategy is made up of four key and integrated plans and strategies. The Burwood:
1. Long Term Financial Plan
2. Asset Management Strategy and Strategic Asset Management Plan
3. Workforce Management Plan
4. Digital Strategy
Implementation and Review
Each of the four components of this Strategy will be implemented, monitored and reported on as specified within each individual document.
The Resourcing Strategy will be reviewed each year and refreshed if needed to ensure it remains current and effective. Every four years we will undertake a complete review and the Strategy will be updated to ensure it supports Burwood’s Community Strategic Plan and the Delivery Program Principal Activities and priorities of each new elected Council.
4 Back to contents
Relevant State & Regional Plans
Supporting Council strategies & plans
Examples include:
Disability Inclusion
Access Plan
Local Strategic Planning Statement
Resourcing Strategy
Long-Term Financial Plan
Workforce
Management Strategy
Asset Management Strategy and Plan
Digital Strategy
Community Strategic Plan 14 years Delivery Program 4 years Operational Plan 1 year Annual Report 1 year
Ongoing monitoring and review
monitoring
review Community engagement 5 Burwood Resourcing Strategy Introduction
Ongoing
and
About Burwood
Burwood is a cultural melting pot of inclusive and diverse communities with a thriving business and retail centre surrounded by historic villages, each with their own distinct character and charm. The Local Government Area (LGA) includes Burwood, Burwood Heights, Croydon Park and Enfield and parts of Croydon and Strathfield.
The quality of life residents enjoy, the central location, local schools and excellent transport infrastructure has made the Burwood LGA an attractive destination for people to live, work and visit.
As the first strategic centre west of the Sydney CBD, Burwood will strengthen its role in Sydney over the next 10 years, attracting new business sectors, higher skilled jobs and a diverse mix of housing.
By 2036 the population of the Burwood LGA is anticipated to nearly double to 73,500.
Who we are
Current population: 42,498*
48.9% males
51.1% females
0.4% Aboriginal & Torres Strait Islander
64% Australian Citizens
Source: NSW State Government 2019 Population Projections, Australian Bureau of Statistics 2016 as complied by Profile ID. Note: 2021 census information not available at time of print. *ABS 2023
Languages & ethnicity
64% Over 23,400 residents speak a language other than English at home
50+ different languages spoken
58% of residents born overseas
32% of residents arrived from overseas since 2011

6 Back to contents
Age groups

How we live and work
Employed population
travel to work on public transport
Top 4 industry sectors
16.50% Construction
15.97% Renting, hiring and real estate services
13.44% Professional, scientific and technical services
8.81% Health care and social assistance
Employment location
14.6% live and work in the LGA
28.2% work in City of Sydney
20.5% work in surrounding LGAs of Inner West, Canada Bay, Strathfield and Canterbury-Bankstown
36.7% work outside Burwood, surrounding LGAs and City of Sydney
Our homes
Over 60% live in medium density and high density housing
Babies & pre-schoolers 0–4 1,670 4.5% Primary schoolers 5–11 2,156 5.9% Secondary schoolers 12–17 2,051 5.6% Tertiary education & independence 18–24 5,484 14.9% Young workforce 24–34 7,860 21.4% Parents & homebuilders 35–49 6,487 17.6% Older workers & pre-retirees 50–59 4,213 11.4% Seniors 70–84 2,874 7.8% Elderly aged 85+ 976 2.7%
92% employed
40%
7 Burwood Resourcing Strategy Introduction
Economic Snapshot
$2.83B
Economy Value and the Burwood Gross Regional Product (June 2023)
17,976
Local jobs with nearly 1 in 3 residents occupied as professionals
15 mins
To both Sydney and Parramatta CBD
Over $1B
Value of building approvals in the past 5 years
5,311
Businesses are located in the Burwood LGA from 20+ industries
90,000 sqm
Of current retail floorspace with 47,500m2 of expected retail floorspace coming to Burwood in the next 5-10 years based on approved DAs

8 Back to contents
About Council
Our Service Areas
• City Development – Town planning, building and development assessment services.
• City Planning – Strategic and land use planning, long term place planning, heritage advisory services, sustainability and resilience planning and programs.
• Community and Culture – Community development, community programs, social planning and research, cultural projects, public art and community events.
• Community Safety – Regulatory and compliance services, environmental health, community safety education and crime prevention initiatives.
• Customer Experience and Business Improvement – Customer service counter and call centre, community facilities and parks bookings, customer research and improvement projects.
• Enfield Aquatic Centre – Recreational facilities and programs, including learn to swim and fitness classes, aquatic events and family recreational and leisure activities.
• Infrastructure and Assets – Design and engineering services, landscape architecture, tree management, asset management, traffic, transport and road safety.
• Library and Community Hub – Collections and resources and access to learning, technology, creative experiences and programs.
• Major Capital Works & Projects – Delivery of major or complex infrastructure projects in Council’s Capital Works Program.
• Operations – Parks, waste and cleansing, civil construction and maintenance (roads, footpaths and drainage) and depot operations.
• Place Management and Communications – Coordination of place management and community engagement initiatives, media liaison, print and digital communications.
• Property – Management of Council’s property portfolio, including property projects and maintenance.
The following internal service areas assist in the delivery of frontline services:
• Finance
• Procurement
• Information Technology (Information Systems and Support, Digital Transformation and GIS)
• Governance and Risk (including Records Management and Internal Ombudsman)
• People and Performance (Human Resources, Organisational Development, Payroll, Work Health and Safety).
9 Burwood Resourcing Strategy Our Resourcing Strategy
Our Assets
Council manages and looks after a broad range of assets, such as community and recreation facilities, sportsgrounds, parks and open space, buildings, roads and other infrastructure assets which enable people to live, work and play within our LGA. This infrastructure has a total replacement value of $625.35 million.
169.8 km of footpath
89.73 km of roads
29 parks including;
10 x sports-fields
2 x outdoor multi-sports courts
2 x tennis facilities
1 civic square
1 library and community hub including;
4 x meeting rooms
2 x studios
2 x learning hubs
1 x conference room
plus additional spaces for study and creative programs
24 playgrounds
1 aquatic centre including;
1 x 50m pool
2 x indoor heated 25m pools
6 community centres / venues for hire HIRE
10 Back to contents
Guiding Principles
Our guiding principles underpin our planning, decision making and delivery of services and infrastructure to support our community’s needs and aspirations.
Sustainability now and for the future
We support and champion social, environmental, economic and civic leadership outcomes and work in a way that does not compromise the needs and ecological sustainability of present and future generations
Bound by social justice
We consider the four key components of social justice principles being:
Equity
Fairness in decision-making, prioritising and allocation of resources, particularly for those in need
Access
Fair access to services, resources and opportunities to improve quality of life
Participation
The maximum opportunity to genuinely participate in decision making
Rights
Participate in community life

11 Burwood Resourcing Strategy Our Resourcing Strategy
Our 2036 Vision

Vision
Burwood is a welcoming and inclusive community that is defined by our diversity of people, liveable places and progressive ideas. We acknowledge and celebrate our history and place, protect our heritage and environment and share a quality of life that is equitable, sustainable and supports each other to thrive and prosper.
12 Back to contents
Strategic Directions

Inclusive community and culture
A thriving community where diversity is embraced, everyone is valued, connected and has the opportunity to contribute and belong.

Places for people
Our places are built around people, protecting our heritage and are well planned and liveable with housing, transport and infrastructure that meet the diverse and changing needs of our community.

Sustainable and protected environment
We work together to protect our natural resources and assets to ensure that our impact on the environment is reduced so we and future generations can live in a clean and sustainable environment.

Vibrant city and villages
Our business and entertainment precincts are economically sustainable and prosperous where residents, workers and visitors enjoy diverse retail, dining and entertainment experiences and interesting places that are attractive, active and welcoming.

Open and collaborative leadership
A strong local democracy with an actively engaged community who are listened to, respected and who trust in our leaders.
13 Burwood Resourcing Strategy Our Resourcing Strategy

14 Back to contents

Our Finances
15 Burwood Resourcing Strategy Our Finances

Long Term Financial Plan 2024 to 2034
Quick links 1. Executive summary 17 2. Introduction 18 3. Objectives 19 4. Structure 20 5. Current financial position of Council 21 6. LTFP Assumptions 25 7. Financial results 30 8. Productivity and efficiencies 31 9. Opportunities and threats 32 10. Sensitivity analysis 34 11. Monitoring financial performance 35 12. Conclusion 35 Appendix A Base Case Scenario budget statements 36
16 Back to contents
The Last Lion by Sophi Odling and Christina Huynh, Clarendon Place
1. Executive summary
Burwood Council’s Long Term Financial Plan (LTFP) contains a set of long-range financial projections based on an informed set of assumptions. It is designed to reflect the financial implications of providing the current service levels and our programs of capital works.
The LTFP covers the 10-year time period from 2024/25 to 2033/34. This Plan focuses on delivering community needs and Council’s strategic priorities (including asset renewal).
The LTFP indicates that Council will generate sufficient funds and has adequate reserves available to implement its programs and to achieve a balanced budget in each year throughout the ten-year planning period.
The LTFP enables all asset backlogs identified
in Council’s Asset Management Strategy and Asset Management Plan to be addressed while maintaining assets class conditions to a standard that meets community expectations. Service delivery, organisational capability and financial stability will also be maintained.

17 Burwood Resourcing Strategy Our Finances
2. Introduction
The LTFP is a core element of Council’s corporate planning framework. The Plan addresses the financial resourcing capacity requirements to deliver the Vision of Burwood2036, our Community Strategic Plan. The LTFP enables the community’s aspirations and demand for services to be tested against the financial opportunities and limitations likely to be encountered within the next 10 years, it includes financial modelling and the planning assumptions that have been identified as affecting the financial capacity of Council. The LTFP enables the community and Council to set priorities to meet future needs.
The projections contained in the LTFP are subject to change due to a variety of external factors as well as major decisions made by Council. It is necessary to regularly review and monitor a variety of factors, and revising the projections contained in the LTFP where necessary. The LTFP is revised annually as part of Council’s annual budget process in keeping with the legislative requirements under the Integrated Planning and Reporting (IP&R) framework.
The Plan has been prepared in an environment of heightened uncertainty given the global and national impacts of high inflation and the Ukraine and Russian unrest.
Despite the challenges Council faces, we are committed to:
• Maintaining current service levels
• Maintaining organisational capability
• Meeting our obligations to our staff
• Prudently managing Council and community’s resources and assets
• Reprioritising resource allocations to where they are most needed
• Providing financial assistance to support our community and businesses
• Maintaining our long-term financial sustainability while at the same time building our fiscal resilience to enable Council to respond to unexpected crises.
18 Back to contents
3. Objectives
Legislated principles
Section 8B of the Local Government Act 1993 states that the following principles of sound financial management apply to councils:
a) Council spending should be responsible and sustainable, aligning general revenue and expenses
b) Councils should invest in responsible and sustainable infrastructure for the benefit of the local community
c) Councils should have effective financial and asset management, including sound policies and processes for the following:
i. Performance management and reporting
ii. Asset maintenance and enhancement
iii. Funding decisions
iv. Risk management practices
d) Councils should have regard to achieving intergenerational equity, including ensuring the following:
i. Policy decisions are made after considering their financial effects on future generations,
ii. The current generation funds the cost of its services.
The LTFP is developed to give effect to the Community Strategic Plan, deliver Council’s program and aspirations over time, and provide strong stewardship for community assets and resources. It contains a set of long-range financial projections based on an informed set of assumptions.
Council objectives
In addition to the legislated principles of sound financial management, Council has 5 financial objectives that it applies to its financial planning, control and management.
1. Ensure financial sustainability – to generate its own operating revenue and having sufficient assets to serve its liabilities with the aim of achieving all of the “fit for the future” financial sustainability benchmarks.
2. Deliver a balanced budget – ensure that each financial year’s expenses are funded by identified funding sources.
3. Fund existing service levels – ensure existing service levels that council currently provides continue to be fully funded when preparing budgets and making financial decisions.
4. Fund Infrastructure renewals – the funding allocated to annual capital works programs to ensure all infrastructure assets meet the determined satisfactory condition level.
5. Be financially responsible – ensure costs are well-considered and money is responsibly spent. We have carefully budgeted for a range of new initiatives to ensure Burwood remains affordable and sustainable well into the future.
19 Burwood Resourcing Strategy Our Finances

4. Structure
The LTFP presents financial forecasts that draw from Council’s Asset Management Strategy, Asset Management Plan, Digital Strategy and Workforce Plan and other strategic documents.
20 Back to contents
5. Current financial position of Council
Burwood Council operates at present from a sound financial position. The 2022-23 audited Annual Financial Statements reported that all but three of Burwood Council’s key ratios are performing better than the Industry Benchmarks. Only the Operating Performance Ratio and Infrastructure Backlog Ratio are below the benchmark due to the impact of the pandemic and an outdated asset management system which has now been replaced.
Table 1: Local Government Key Performance Measures
Indicator Quantitative Measure
Cash Expense
Measures the level of a Council’s fiscal flexibility. It is the degree of reliance on external funding sources such as operating grants and contributions
The Unrestricted Current Ratio is specific to local government and is designed to represent a Council’s ability to meet debt payments as they fall due
Infrastructure Backlog Ratio
This ratio assesses the impact of uncollected rates and annual charges on Council’s liquidity and the adequacy of recovery efforts
This liquidity ratio indicates the number of months a Council can continue paying for its immediate expenses without additional cash inflow
This ratio compares the proportion spent on infrastructure asset renewals and the asset’s deterioration measured by its accounting depreciation.
Asset renewal represents the replacement or refurbishment of existing assets to an equivalent capacity or performance as opposed to the acquisition of new assets or the refurbishment of old assets that increase capacity or performance.
This ratio shows what proportion the backlog is against total value of a Council’s infrastructure
Industry Benchmark 2022/ 2023 2021/ 2022 2020/ 2021 Operating Performance Ratio Measures a Council ability to contain operating expenditure within operating revenue >0 -4.26% -7.22% -7.97% Own Source Operating Revenue Ratio
>60% 73.02% 85.12% 81.89%
Unrestricted Current Ratio
>1.5x 1.91x 2.29x 3.18x Debt Service Cover Ratio This ratio measures the availability of operating cash to service debt including interest, principal and lease payments >2x 6.51x 5.89x 4.99x Rates
Annual Charges Outstanding percentage
and
<5% 6.19% 5.64% 4.53%
Cover Ratio
>3 months 4.01 months 6.09 months 6.58 months Building & Infrastructure Asset Renewals Ratio
>=100% 101.17% 81.12% 102.15%
<2% 4.12% 6.15% 9.43% 21 Burwood Resourcing Strategy Our Finances

2024/25 Budget Estimates 22 Back to contents
The following chart shows the major categories of revenue for Council in 2024/25.
Rates & Annual Charges
Investment Income
User Charges
Other Revenue
Rental Income
Grants Subsidies & Contributions - Operational
Sale of Assets
Grants Subsidies & Contributions - Capital
Rates and Annual Charges are 43% of our total revenue, effectively one of the largest category of Council revenue. Each year, the Independent Pricing and Regulatory Tribunal (IPART) sets the maximum allowable increase in rates based on a review of the Local Government Cost Index, which they have developed. The maximum allowable increase for 2024/25 set by IPART is 4.8%.

43% 2% 10% 7% 2% 3% 0% 33% 23 Burwood Resourcing Strategy Our Finances
The 2024/25 budget estimates that Council’s total expenditure, excluding depreciation expense will be $88.74 million, including loan repayments, as illustrated in the table below.
2024/25 Budget Estimates

Employee Costs
Materials & Services
Other Expenses
Borrowing Costs
Capital Works Program
Loan Repayment - Principal
35% 31% 1% 38% 2% 0% 24 Back to contents
6. LTFP Assumptions
In developing this LTFP, projections on future forecasts have been based on a number of assumptions. These assumptions are explained below.
Category Commentary Assumption
Rates Indexed by estimated NSW State Government rate pegging 4.8% for 2024/25, 3% for 2025/26 and 2.5% for 2026/27 and beyond
User Charges and Fees
Interest and Investment Revenue
Estimated annual increases of This varies from 0.0% to 6.0% depending on the fee and charge for 2024/25, 3% for 2025/26 and 2.5% for 2026/27 and beyond
Not indexed to CPI, based on average real expected yield of 4.0% for 2024/25, 2.5% for 2025/26 and beyond
Grants and contributions –Operating Based on estimated annual increases of 2.5%
Grants and Contributions –Capital Based on estimated annual increases of 2.5%
Other Revenue Based on estimated annual increases of 2.5%
Other Income
Employee Benefits and On-Costs
Based on estimated annual increases of CPI for 2023/24, 2.5% for 2024/25 and beyond
In line with award entitlements and on-costs including estimated 3.5% for 2024/25, 3% for 2025/26, and 2.5% for 2026/27 and beyond 2% organisation salary savings has been factored into all years
Materials and Contracts Based on estimated annual increases of 2.5%
Depreciation Based on estimated annual increases of 2.5%
Other Expenses Includes government levies and utilities, based on estimated annual increases of 2.5%
Asset Renewal Capitalisation
Based on estimated annual increases of 1.25%
25 Burwood Resourcing Strategy Our Finances
Levels of service to the community
The LTFP is based on Council maintaining existing services to the community at the existing service levels as well as incorporating works arising from the Strategic Asset Management Plan and other strategic plans.
Capital works program
Council’s extensive capital works program aims to deliver much needed renewal of infrastructure assets including roads, community buildings, parks & reserve and transport infrastructure. The total proposed value of works in Council’s 2024/25 capital works program is $33.9m. This is mainly attributed to the Western Sydney Infrastructure Grants Program. The LTFP capital works program 2024/25 to 2033/34 outlines all infrastructure renewal works arising from Council’s Asset Management Strategy, Asset Management Plan and other strategic plans along with the State Government funded projects.
The financial projection of future capital works will depend on the nature, timing and funding of specific projects. The majority of infrastructure projects are costed in accordance with current design estimates. Any significant cost revisions in subsequent years will be reflected in the LTFP going forward.
Debt policy
Council’s level of debt is low, with total outstanding loans of $5.075 million as at 30 June 2023. An increase in debt will therefore be considered from time to time if it will allow Council to spread the burden of costs more equitably across current and future generations in alignment with benefits and/or reduce the growth in renewal costs that may arise from delay in investment in assets. Assuming Council has capacity to service more debt, the use of debt financing is more likely to increase during the life of this Plan.
Debt is only to be considered by Council as a means of financing capital investments, not operational costs, and where there is a reliable source of income (funding source) for repayment.
Reserve funding
Council holds limited externally restricted cash reserves, covering Domestic Waste, Stormwater Management Services Charge, Section 7.12 Fixed Developers Contributions and Section 7.4 Planning Agreement Contributions. These funds are only to be used for the purposes for which they were raised. Internally restricted reserves include money held for such items as employee leave entitlements, bond and deposits, plant and vehicle replacement and infrastructure assets. These funds are to be used for the purpose for which they are held.
Revenue – rates
Rates are a major source of Council’s income, representing approximately 43% of the total revenue in the draft 2024/25 budget. This income projection is based on the Independent Pricing and Regulatory Tribunal (IPART) Rate Peg increase of 4.8% approved for 2024/25. The rate pegging assumption for the subsequent years is in line with the projected CPI for the life of the LTFP.
Domestic Waste charges
The Domestic Waste Management charge is based on the full cost recovery for the provision of the waste and recyclable collection service. The 2024-25 Domestic Waste Management Charge will increase from $547.75 to $580.75, this increase is due to increasing tipping fees and high CPI. This increase will maintain the Waste Reserve at its current amount. The Waste Reserve is essential to provide for the funding of waste bins, garbage trucks and fleet equipment replacements.
26 Back to contents
Stormwater Management Service Charges
The Stormwater Management Service Charge (SMSC) is intended as a mechanism for New South Wales (NSW) councils to raise income to invest in improving the stormwater systems in urban areas, under the Local Government Amendment (Stormwater) Act 2005 No70. The revenue raised from SMSC will be allocated to projects/activities in relation to capacity and water quality as well as works that arise from Catchment Flood Studies.
User charges and fees
Council provides a wide range of facilities and services for which it receives revenue from user fees and charges. Council sets its fees and charges in accordance with the provisions of the Local Government Act 1993 using the seven guiding principles defined in the Pricing Policy. Fees and Charges are updated annually. Some of the fees are classified as statutory fees which are fixed by regulations, legislation or a State/Federal Authority. Where Council has the legislative authority to vary fees and charges the Consumer Price Index (CPI) has generally been applied, where considered appropriate.
Often, the fee received does not fully offset the costs associated with the service or facility as they are aimed at providing a broad community benefit and if higher fees were charged many residents may be unable to enjoy the use of the facility and service. Revenue growth in these areas is limited due to Council seeking to provide services accessible to the wider community. Historically the revenue received from the majority of this group of fees and charges has increased in line with CPI. Accordingly, the LTFP model includes a projected increase for this income group in line with the projected CPI growth.
Interest and investment revenue
All cash investments made by councils in NSW are subject to Section 625 of the Local Government Act and associated regulations and circulars. All such investments must also be in accordance with the Council’s Investment Policy. Investment reports are submitted to Council on a monthly basis.
Burwood’s Investment Policy limits the proportion of investments Council can make in various types of facilities by limiting:
• the overall credit exposure of the portfolio
• the credit rating of individual financial institutions
• the term to maturity of the overall portfolio
Council’s investments yielded positive returns overall and exceeded the benchmark return on an annual basis. The level of interest revenue earned varies with regard to total funds held in Council’s investment portfolio. Interest revenue is also subject to external factors such as monetary policy decision and economic and investment market conditions. Over the longer term, economic conditions can vary considerably, which in turn can affect the interest rate. The graph below depicts movements in the official Australian cash rate.
27 Burwood Resourcing Strategy Our Finances
Trend analysis of RBA Cash Rate
Other Revenues
Other revenue increases have been projected to increase in line with estimated CPI growth.
Grants and contributions
Council receives grants from the State and Federal Governments. These are either for discretionary or non-discretionary purposes. The majority of grants provided to Council are for specific purposes, such as infrastructure maintenance and upgrade, provision of community services and environmental programs. Grants and contributions in general are not subject to indexation, however Council has allowed an estimated CPI growth.
Section 7.12 developer contributions
Section 7.12 (s7.12) of the Environmental Planning and Assessment Act 1979 enables councils to levy contributions for public amenities and services required as a consequence of development. Developer contributions are essential to providing key facilities and services for local residents. The s7.12 contributions are held as an externally restricted asset and they are allocated to fund the capital works program projects.
The level and timing of contributions fluctuate according to a variety of factors including economic growth and the level of development activity. In the LTFP, it is assumed that economic growth and development activities are relatively static throughout the life of the 10 years, recognising that there will be market fluctuations from time-to-time.
Section 7.4 Planning Agreements developer contributions
Section 7.4 of the Environmental Planning and Assessment Act 1979 enables councils to seek contributions for public amenities and services required as a consequence of development. Planning Agreements can take a number of formats, including dedication of land free of cost, payment of a monetary contribution, or provision of any other material public benefit, or any combination of them, to be used for or applied towards a public purpose. The Burwood Planning Agreement Policy outlines a value sharing approach in which Council seeks a share of value uplift generated from new development which exceeds current floor space ratio controls.
Planning Agreements are a form of developer contributions, which are essential to providing key facilities and services for local residents.
Cash Rate % 0.00 0 50 1.00 1.50 2 00 2.50 3.00 3 50 4.00 4.50 5 00 5.50 6.00 Jul-09 Apr-12 Dec-14 Sep-17 Jun-20 Mar-23 Dec-25 28 Back to contents
The Planning Agreement contributions are held as an externally restricted asset and allocated to fund projects in our capital works program.
The level and timing of Planning Agreement contributions for the LTFP fluctuate according to a variety of factors including economic growth and the level of development activity. There is a delay between when a contribution is agreed and when it is paid, given that contributions are not required to be paid until an Occupation Certificate is issued. In addition, Planning Agreements are voluntary in nature which adds another level of uncertainty for the stability of this income stream. In the LTFP, it is assumed that economic growth and development activities are relatively static throughout the life of the 10 years, recognising that there will be market related fluctuations from time-to-time.
Expenditure – employee costs
Employee costs include the payment of salary and wages, leave, superannuation, training and workers compensation expenses. Overall employee costs comprise around 38% of Council’s operating expenditure excluding depreciation. The LTFP projection includes the Award increase of 3.5% for 2024/25, 3% for 2025/26, and 2.5% for 2026/27, and thereafter it is assumed the award rate will be in line with CPI growth.
For Council employees in the accumulation scheme, Council is required to make compulsory employer superannuation contributions in accordance with the compulsory employer superannuation contribution limits. As a result of legislative changes, this contribution will progressively increase from its current level of 11% to 12% in 2025/26. The current rate of 11% will be increased by 0.5% from 2024/25 until it reaches 12%. For workers compensation, the budget provision is based on Council’s provider insurance company’s estimates for 2024/25. Thereafter it will increase in line with the forecast salary increase.
Materials and contracts
Expenditure on materials and contracts has generally been indexed below estimated CPI growth in the LTFP.
Loan borrowing costs
Whilst inflation is high, interest rates are forecasted to stabilise over time. The LTFP includes an average rate of 4.5% for loans with a 10 year term. This is conservative as it is above the forecast borrowing rates for 2024/25. The conservative position is considered appropriate in light of the current economic climate.
Depreciation
Depreciation for Council’s assets is a noncash expense that reflects the utilisation of Council’s assets and the degradation of their capacity to provide functionality over time. Depreciation expense is an indicator used by the Office of Local Government to determine the level of asset renewals that councils should be undertaking. Council uses a straight line method of depreciation which is commonly applied to Local Government infrastructure.
Other expenses
Increases in the range of levies imposed by the State Government are hard to predict. Levies such as the State Emergency Levy, Fire Brigade Levy and Sydney Regional Development Fund contribution have grown steadily and have been forecast to continue.
29 Burwood Resourcing Strategy Our Finances

7. Financial results
The LTFP forecasts that Council will successfully manage the financial sustainability challenges while sustaining Council’s current level of operations and capital program up to 2033/34. Internal restricted reserves are forecasted to be responsibly utilised to fund Council’s spending and balance the budget in a manner consistent with the purpose for which they were raised. The annual review of the LTFP allows Council to vary our approach to sustainable financial management as we progress through the planning period.
Like all councils, we access funds through a variety of sources including:
• Rates and other levies/charges
• Fees and Charges
• Loans
• Grants
• Council also has the ability to apply reserves Council also continuously reviews its operations with the aim to achieve cost efficiency improvements.
30 Back to contents

8. Productivity and efficiencies
In preparing the 2024/25 Budget, Council has committed to undertake a review of Council services in order to improve the productivity and efficiency of our operation, as well as containing costs and exploring additional revenue streams to deliver existing and improved service levels. These operational efficiencies will be built into the 2024/25 budget once they have been undertaken. Council Staff are currently working through several initiatives that will assist in managing financial sustainability.
These include:
• Council wide service reviews
• Employee leave management strategies
• Review of the Domestic Waste Charge and its application
• Digital Strategy and resulting process and productivity efficiencies
• A Workplace Health & Safety improvement program to reduce workplace injuries
• Identifying potential revenue streams
It is estimated that the benefits of these programs will provide financial benefits across future LTFPs. These productivity efficiencies will assist in offset rising costs over the life of this LTFP.
31 Burwood Resourcing Strategy Our Finances
9. Opportunities and threats
In projecting Council’s future financial position, a number of anticipated future challenges that may have an adverse impact on Council have been considered. These are summarised below.
Rate pegging
NSW councils are subjected to rate pegging. Rate pegging is the maximum percentage limit by which NSW councils may increase the total income they receive from rates. The rate pegging percentage is set each year by IPART. A general observation that rate pegging has constrained the capacity of NSW councils to raise total revenue so that they can keep pace with cost increase and service expansions to meet community expectations. Decisions on rate pegging and rate variations above the peg can therefore pose a significant threat to the modelled financial outcomes. Burwood’s experience is that rates revenue generates approximately 43% of the total revenue.

Non-rates revenue
The Council is heavily dependent on variable non-rates sources of revenue, these represents over 21% of the total revenue. Many of these income items are volatile to economic conditions, such as the building construction and property rental markets.
Parking income
Income from parking fees and fines account for approximately 5.7% of our total revenue. Market conditions and Council policies on public parking will have significant implications our long-term financial outlook.
Cost shifting from Federal and State Governments
Cost shifting is a challenge confronting Local Government. Cost shifting occurs when there is a transfer of services from the Federal or State Government to Local Government without the provision of adequate funding required to provide the service. The LTFP assumes the current cost will increase annually by CPI, but no growth in cost shifting in the life of the LTFP.
Developer contributions
In 2005 the Environmental Planning and Assessment Act was amended to introduce, among other things, a system for the negotiation of planning agreements between developers and planning authorities. The increased use of planning agreements, as well as changes in the application of Section 7.12 (formerly S94A) contributions, have positively impacted on the Council’s long term financial outlook. These contributions can be significantly affected by construction market conditions.
32 Back to contents
Direct labour costs
All councils in NSW, except the City of Sydney, are covered by the Local Government (State) Award which is centrally negotiated and largely beyond Council’s control. Direct employee costs (namely salaries/wages, superannuation, leave and overtime) represent over 35% Council’s operating expenditure (when depreciation is excluded). Salary/wage rates struck under the Award negotiations can have a significant impact on financial outcomes, especially when the Award increase is above the rate peg. This has the potential to significantly affect the reliability of the funding model.
Workers’ compensation costs
Variations in workforce safety performance pose a significant risk to the budget. In 2024/25 budget year, the workers compensation premium is estimated to be $1.1 million. Council is undertaking a program of improvements in WH&S in an effort to improve workplace safety. This improvement will result in premium reductions in the medium term. The LTFP assumes that our workers compensation premiums will be increased in the next two years by 2.5% from the 2024/25 level. However, threats to this may arise, due to Council’s ageing workforce and our high exposure to manual handling areas such as civil works, waste cleansing and open space operations.

33 Burwood Resourcing Strategy Our Finances

10. Sensitivity analysis
Council’s LTFP covers a 10-year period based on assumptions regarding future financial trends. These assumptions include future rate variation limits (i.e. rate pegging), increase in CPI and employment costs. Many of these factors can fluctuate over time as they are influenced by a variety of circumstances, such as government policies, economic conditions and changing community expectations. As it is not possible to accurately predict movements in these factors in individual years over the long term, they have been projected on the basis of recent trends or forecasted CPI based on available information in the time when the plan is prepared.
Over a 10 year period, these assumptions may be subject to change outside the parameters used in developing the assumptions for the LTFP. Any major change in these assumptions will have an impact on the financial projections contained therein. The level of impact depends not only on the level of change but also on the nature of the assumption.
A minor variance in some of the assumptions will have a relatively small impact on the projections contained in the LTFP. For example, increases in the level of grant income received for specific purposes would result in a corresponding increase in expenditure.
Conversely, a change in the annual rate pegging limit or employee award rate will have a significant impact on future financial projections. Sensitivity analysis has been undertaken to assess the impact of changes in the factors which have been used to project future revenue and expenditure.
Sensitivity analysis involves developing different scenarios by varying the critical assumptions, such as the items described in the Opportunities and Threats section above. The different scenarios demonstrate the impact of these changes on Council’s financial projections.
34 Back to contents
11. Monitoring financial performance
It is important that Council regularly assesses its financial performance and position against the projections contained in the LTFP. The planned model has been developed so that its implementation will, over the life of the LTFP, meet a set of financial indicators:
• Operating Performance Ratio
• Own Source Operating Revenue Ratio
• Unrestricted Current Ratio
• Debt Service Cover Ratio
• Rates and Annual Charges Outstanding %
• Cash Expense Cover Ratio
• Buildings and Infrastructure Renewals Ratio
12. Conclusion
The annual budgets are set to maintain service delivery, organisational capability and financial stability and responses which may follow the pandemic. Budget control and monitoring is paramount for Council achieving the outcomes of this Plan. Budgets are monitored internally on an on-going basis. Monthly financial reports are reported to the Executive Team and Managers and Quarterly Budget Reviews are reported to Council and illustrate the progress against the adopted budgets.
Council has a strong record in responsible financial management and a clear plan for continuing this track record to achieve the productivity and efficiency targets set in this LTFP through a thorough review of Council’s services.

35 Burwood Resourcing Strategy Our Finances
Appendix A
Base Case
Income Statement
2024-25 Budget 2025-26 Budget 2026-27 Budget 2027-28 Budget Estimate $ Estimate $ Estimate $ Estimate $ Income from Continuing Operations Rates & Annual Charges (40,923) (42,151) (43,205) (44,285) User Charges & Fees (9,176) (9,451) (9,688) (9,930) Other Revenues (6,452) (6,646) (6,812) (6,982) Grants & Contributions - Operating Purposes (2,674) (2,754) (2,823) (2,894) Grants & Contributions - Capital Purposes (31,841) (38,590) (33,248) (13,079) Interest & Investment Revenue (2,200) (2,266) (2,323) (2,381) Other Income (2,196) (2,262) (2,319) (2,377) Net Gain from the disposal of assets (360) (371) (380) (380) Net share of interest in Joint Ventures - - -Total Income From Continuing Operations (95,823) (104,492) (100,797) (82,307) Expenses From Continuing Operations Employee Benefits & On-Costs 25,259 26,016 26,667 27,333 Materials & Services 27,355 26,682 27,349 28,033 Borrowing Costs 298 298 301 281 Depreciation & Amortisation 11,090 11,367 11,651 11,942 Other Expenses 1,389 1,424 1,459 1,496 Loss on Disposal of Assets - - -Fair Value Decrement on Investment Properties - - -Total Expenses from Continuing Operations 65,390 65,787 67,428 69,085 (Surplus) Deficit from Continuing Operations (30,433) (38,705) (33,369) (13,222) (Surplus) Deficit from Continuing Operations Before Capital Amounts 1,408 (114) (121) (143) Deficit Surplus Surplus Surplus 36 Back to contents
2028-29 Budget 2029-30 Budget 2030-31 Budget 2031-32 Budget 2032-33 Budget 2033-34 Budget Estimate $ Estimate $ Estimate $ Estimate $ Estimate $ Estimate $ (45,392) (46,527) (47,690) (48,882) (50,104) (51,357) (10,178) (10,433) (10,693) (10,961) (11,235) (11,516) (7,157) (7,336) (7,519) (7,707) (7,900) (8,097) (2,966) (3,040) (3,116) (3,194) (3,274) (3,356) (8,406) (8,616) (8,831) (9,052) (9,278) (9,510) (2,440) (2,501) (2,564) (2,628) (2,694) (2,761) (2,436) (2,497) (2,560) (2,624) (2,689) (2,756) (380) (380) (380) (380) (380) (380) - - - - -(79,355) (81,330) (83,354) (85,428) (87,554) (89,733) 28,017 28,717 29,435 30,171 30,925 31,698 28,734 29,452 30,188 30,943 31,717 32,510 280 283 287 291 296 304 12,241 12,547 12,861 13,182 13,512 13,850 1,533 1,572 1,611 1,651 1,692 1,735 - - - - -- - - - -70,804 72,571 74,382 76,239 78,142 80,096 (8,551) (8,759) (8,971) (9,189) (9,412) (9,637) (145) (143) (140) (137) (133) (127) Surplus Surplus Surplus Surplus Surplus Surplus 37 Burwood Resourcing Strategy Our Finances
Base Case
Balance
2024-25 Budget 2025-26 Budget 2026-27 Budget 2027-28 Budget Estimate $ Estimate $ Estimate $ Estimate $ ASSETS Current Assets Cash & cash equivalents 15,593 12,283 9,578 9,396 Investments 22,550 27,550 32,550 37,550 Receivables 4,257 4,257 4,257 4,257 Inventories 7 7 7 7 Other 344 344 344 344 Total Current Assets 42,751 44,441 46,736 51,554 Non-Current Assets Investments 25,000 25,000 25,000 25,000 Infrastructure, property, plant & equipment 627,625 663,205 693,098 700,305 Investment property 5,000 5,000 5,000 5,000 Intangible assets 211 211 211 211 Right of use assets 743 743 743 743 Total Non-Current Assets 658,579 694,159 724,052 731,259 TOTAL ASSETS 701,330 738,601 770,788 782,814 LIABILITIES Current Liabilities Payables 9,963 9,213 8,463 7,713 Contract Liabilities - - -Lease Liabilities 268 Borrowings 416 431 447 314 Provisions 5,582 5,582 5,582 5,582 Total Current Liabilities 16,229 15,226 14,492 13,609 Non-Current Liabilities Lease Liabilities - - -Borrowings 3,444 3,013 2,566 2,253 Provisions 134 134 134 134 Total Non-Current Liabilities 3,578 3,147 2,700 2,387 TOTAL LIABILITIES 19,807 18,373 17,192 15,995 Net Assets 681,523 720,228 753,596 766,818 EQUITY Retained earnings 326,483 365,188 398,557 411,779 Revaluation reserves 355,039 355,039 355,039 355,039 Total Equity 681,522 720,227 753,596 766,818 38 Back to contents
Sheet
2028-29 Budget 2029-30 Budget 2030-31 Budget 2031-32 Budget 2032-33 Budget 2033-34 Budget Estimate $ Estimate $ Estimate $ Estimate $ Estimate $ Estimate $ 12,891 17,591 22,671 28,141 34,106 40,457 42,550 47,550 52,550 57,550 62,550 67,550 4,257 4,257 4,257 4,257 4,257 4,257 7 7 7 7 7 7 344 344 344 344 344 344 60,049 69,749 79,829 90,299 101,264 112,615 25,000 25,000 25,000 25,000 25,000 25,000 699,298 698,120 696,766 695,229 693,532 691,669 5,000 5,000 5,000 5,000 5,000 5,000 211 211 211 211 211 211 743 743 743 743 743 743 730,252 729,074 727,720 726,183 724,486 722,623 790,301 798,824 807,549 816,482 825,751 835,238 6,963 6,963 6,963 6,963 6,963 6,963 - - - - -237 246 256 144 149 149 5,582 5,582 5,582 5,582 5,582 5,582 12,782 12,791 12,801 12,689 12,694 12,694 - - - - -2,016 1,770 1,514 1,371 1,221 1,072 134 134 134 134 134 134 2,150 1,904 1,648 1,505 1,355 1,206 14,932 14,695 14,449 14,193 14,050 13,900 775,370 784,129 793,100 802,289 811,701 821,338 420,330 429,089 438,061 447,250 456,662 466,299 355,039 355,039 355,039 355,039 355,039 355,039 775,369 784,128 793,100 802,289 811,701 821,338 39 Burwood Resourcing Strategy Our Finances
Base Case
Cashflow
2024-25 Budget 2025-26 Budget 2026-27 Budget 2027-28 Budget Estimate $ Estimate $ Estimate $ Estimate $ Cash Flows from Operating Activities Receipts 97,128 104,121 100,417 81,927 Payments (54,450) (55,154) (56,244) (57,612) Net Cash provided (or used in) Operating Activities 42,678 48,967 44,172 24,315 Cash Flows from Investing Activities Receipts Sale of Investments 30,000 30,000 30,000 30,000 Sale of Infrastructure, Property, Plant & Equipment - - -Payments Purchase of Investments (35,000) (35,000) (35,000) (35,000) Purchase of Intangible Assets - - -Purchase of Property Plant & Equipment (33,922) (46,576) (41,164) (18,769) Net Cash Flow from Investing Activities (38,922) (51,576) (46,164) (23,769) Cash Flows from Financing Activities Receipts Borrowings - - -Payments Borrowings (812) (700) (714) (727) Principal Component of lease payments (268) Net Cash Flow from Financing Activities (1,080) (700) (714) (727) Net change in Cash and Cash Equivalents 2,676 (3,309) (2,706) (181) Plus: Cash & Cash Equivalents at beginning of the year 12,917 15,593 12,283 9,578 Cash & Cash Equivalents at end of the year 15,593 12,283 9,578 9,396 Cash and Investments External Restrictions 23,255 31,255 39,255 47,255 Internal Restrictions 23,658 23,658 23,658 21,658 Unrestricted 16,230 9,920 4,215 3,033 Total Cash, Cash Equivalents and Investments 63,143 64,833 67,128 71,946 40 Back to contents
2028-29 Budget 2029-30 Budget 2030-31 Budget 2031-32 Budget 2032-33 Budget 2033-34 Budget Estimate $ Estimate $ Estimate $ Estimate $ Estimate $ Estimate $ 78,975 80,950 82,973 85,048 87,174 89,353 (59,034) (59,741) (61,234) (62,765) (64,334) (65,943) 19,942 21,209 21,739 22,283 22,840 23,411 30,000 30,000 30,000 30,000 30,000 30,000 - - - - -(35,000) (35,000) (35,000) (35,000) (35,000) (35,000) - - - - -(10,853) (10,989) (11,126) (11,266) (11,435) (11,606) (15,853) (15,989) (16,126) (16,266) (16,435) (16,606) - - - - -(593) (520) (533) (547) (440) (454) (593) (520) (533) (547) (440) (454) 3,495 4,700 5,079 5,470 5,965 6,351 9,396 12,891 17,591 22,671 28,141 34,106 12,891 17,591 22,671 28,141 34,106 40,457 52,255 57,255 62,255 67,255 72,255 77,255 22,658 23,658 24,658 25,658 26,658 27,658 5,528 9,228 13,308 17,778 22,743 28,094 80,441 90,141 100,221 110,691 121,656 133,007 41 Burwood Resourcing Strategy Our Finances
Base Case
Performance Indicators
Meets Target Measure Does Not Meet Target Measure
Note: Council has not factored in any capital grants received to fund building or infrastructure renewal works. Once added, it would improve the ratio to over 100%
Target 2024-25 Budget 2025-26 Budget 2026-27 Budget 2027-28 Budget Estimate $ Estimate $ Estimate $ Estimate $ Operating Performance Ratio >0% -2.2% 0.2% 0.2% 0.2% Own Source Operating Revenue >60% 64.0% 60.4% 64.2% 80.6% Unrestricted current ratio >1.5% 3.60 3.37 3.06 3.01 Debt service ratio >2.00x 11.83 16.14 16.13 16.64 Rates & annual charges outstanding percentage <5% 4.1% 4.0% 3.9% 3.8% Cash Expense Cover Ratio >3 Months 13.4 13.6 13.9 14.5 Building and infrastructure renewals ratio >100% 187% 305% 276% 128%
42 Back to contents
2028-29 Budget 2029-30 Budget 2030-31 Budget 2031-32 Budget 2032-33 Budget 2033-34 Budget Estimate $ Estimate $ Estimate $ Estimate $ Estimate $ Estimate $ 0.2% 0.2% 0.2% 0.2% 0.2% 0.2% 85.7% 85.7% 85.7% 85.7% 85.7% 85.7% 3.68 4.21 4.77 5.46 6.13 6.85 20.89 24.43 24.38 24.35 31.00 30.80 3.7% 3.6% 3.5% 3.4% 3.4% 3.3% 15.9 17.7 19.2 20.7 22.3 23.8 65% 64% 63% 63% 62% 61% 43 Burwood Resourcing Strategy Our Finances

44 Back to contents
Our Assets

45 Burwood Resourcing Strategy Our Assets

Asset Management Strategy 2024 to 2034
Quick links Our Assets 45 Asset Management Strategy 2024 to 2034 46 1. Introduction 47 2. Asset Management Planning 49 2.1. Asset Management Planning Framework 49 2.2. Our Assets 50 2.3. Asset Management Policy 50 2.4. Where Are We Now? 50 2.5. Our community’s expectations 55 2.6. Where do we want to be 56 2.7. How will we get there? 57 3. Monitoring Our Performance 60 Appendix A: Asset Management Policy 61 Appendix B: References 64 46 Back to contents
1. Introduction
The infrastructure assets that Council owns and manages on behalf of our community are critical to the liveability, productivity and sustainability of the Burwood LGA. These assets include roads, drains, footpaths, buildings, recreational facilities, parks and gardens. The appropriate and timely planning and management of these assets is key to making sure that we deliver the right assets to support the desired services, business and lifestyle choices of our diverse and changing community. This Strategy outlines how our assets will over time work towards meeting our 2036 Community Vision. Our focus is on making decisions based on robust data and with a service delivery focus for the benefit of our community. This Asset Management Strategy sets out the broad roadmap for undertaking strategic and coordinated management of Council’s infrastructure assets.
The need for Asset Management Planning
The majority of Council’s existing infrastructure was historically built to support housing development as the LGA grew and evolved. At the time, little or no analysis was done to determine a strategic approach to sustain this infrastructure by matching future maintenance and renewal expenditures with future income projections. A better understanding of the longterm cumulative consequences of decisions to build infrastructure was also needed.
Our current Asset Management Framework attempts to rectify this situation. Our Asset Management Strategy and Asset Management Plan are based on our understanding of levels of service performance. They have strong links with our Long Term Financial Plan (LTFP) and Workforce Management Plan so that we are well placed to fully fund and resource the capital, maintenance and operating costs needed to sustain the agreed service level targets for our assets. In order to achieve this a number of service level scenarios and long-term cash flows are analysed to determine the optimum balance between environmental, economic, social and cultural objectives.
Lifecycle Costs
Lifecycle costs (or whole of life costs) are the average annual costs that are required to sustain the service levels over the longest asset life. Lifecycle costs include operations
and maintenance expenditures plus asset consumption (depreciation). Lifecycle costs can be compared to lifecycle expenditure to give an indication of sustainability in service provision.
Lifecycle expenditures include operations and maintenance expenditures (excluding depreciation) plus capital renewal expenditure. The capital renewal component of lifecycle expenditure can vary depending on the timing of asset renewals.
Strategic Considerations
Council has embraced the principles of asset management and is now working to bring the key elements of our asset management strategic framework and associated reporting into the corporate environment enabling advanced asset management practices to be followed. Crucial to best practice asset management is the requirement for comprehensive and reliable data on existing services and infrastructure, along with a strategy to link our operational activities with the planning, policy and service delivery directions of Council. This information will provide a high level of informed data and knowledge to assist our decision-making processes on the impact and consequences of our actions with respect to the infrastructure assets that we own and look after.
47 Burwood Resourcing Strategy Our Assets
Burwood2036 - Community Strategic Plan (CSP)
Burwood2036 identifies the Community’s Vision, Strategic Directions and the strategies that will be implemented to achieve this long term Vision. The purpose of the Plan is to turn community aspirations into reality, and make sure Council’s priorities are set according to our community’s needs and aspirations. Our assets need to be fit for purpose, delivered at the appropriate condition and service level and have a lifecycle that is sustainable and financially viable.
Legislative Reform – NSW Local Government Act
As part of its commitment to ongoing reform of local government, the NSW Government amended the NSW Local Government Act in 2009 to mandate Integrated Planning and Reporting (IP&R). This amendment included a requirement for a Community Strategic Plan, Delivery Program and a Resourcing Strategy inclusive of Asset Management (Policy, Strategy and Plans), Long Term Financial Plan and a Workforce Plan.
Financial Reporting Requirements
The NSW Office of Local Government requires that councils comply with the accounting standard AASB116 for reporting on infrastructure assets. The data required to provide this level of financial reporting is also essential for the planning of future infrastructure funding requirements.
Strategic Issues at a National Level
On 8 May 2009, the Local Government and Planning Ministers’ Council agreed to the enhancement and acceleration of the National Asset and Financial Management Frameworks.
The National Frameworks consist of three main frameworks of which Asset Planning and Management is one. The Asset Planning and Management Framework consists of seven elements which each State and Territory is expected to adopt as follows:
1. Development of an asset management policy: Each State/Territory is expected to develop an asset management policy, which provides high-level guidance to assist individual councils in developing their asset management policy
2. Strategy and Planning: Councils should be provided with guidance from the State on developing an asset management strategy which is designed to support and implement its asset management policy
3. Governance and Management Arrangements: Councils should be encouraged to apply and implement good governance and management arrangements which link asset management to service delivery and include assigning roles and responsibility for asset management between the General Manager, the Council and senior managers
4. Defining Levels of Service: Mechanisms should be established that include community consultation to define the levels of service councils are expected to provide from their asset base
5. Data and Systems: A framework for collection of asset management data should be established
6. Skills and Processes: The asset management framework should contain a continuous improvement program
7. Evaluation: The asset management framework should contain a mechanism to measure its effectiveness
The NSW legislative reforms are consistent with the National Frameworks.
48 Back to contents
2. Asset Management Planning
2.1.
Asset Management Planning Framework
An overview of the key elements of and their relationship within the Asset Management Planning Framework are depicted below.
As shown above, this Asset Management Strategy sits alongside and should be read in conjunction with our Asset Management Policy and Asset Management Plan.
The Asset Management Policy sets out the principles by which the organisation intends applying asset management to achieve its organisational objectives. It takes into
consideration the realisation of the long term Vision and Strategic Directions as established by Burwood2036, our Community Strategic Plan.
The Strategic Asset Management Plan details the activities and expenditure required across each asset class to achieve the principles, objectives and strategy set out in the Asset Management Policy and Strategy.
Burwood2036 Community Strategic Plan Where are we going? Workforce Management Plan Resourcing Strategy Knowledge to understand the present and plan for the future Delivery Program What will we do in 4 years Asset Management AM Policy | SAM Strategy | AM Plan Operational Plan What will we do each year Long Term Financial Plan 1 ISO, 2014, ISO 55002, Sec 5.2, p 7. 49 Burwood Resourcing Strategy Our Assets
Our Assets
2.3. Asset Management Policy
Council’s Asset Management Policy sets out the principles by which the organisation intends applying asset management to achieve its organisational objectives2. Our Asset Management Policy is contained in Appendix A.
2.4. Where Are We Now?
This section provides an overview of the current state of our assets.
Asset Values
Table 1 below the Figures 1 and 2 provide an overview of the current gross replacement and depreciated values of our assets as at 30 June 2023.
Table 1: Asset values covered by this Strategy
Burwood LGA
9a As at 30/6/2023 $’000 Current Replacement Cost Carrying Value Depreciation Expense Transport $359,035 $186,388 -$3,752 Stormwater $95,194 $36,741 -$766 Buildings $151,796 $118,272 -$2,679 Parks & Reserves $19,322 $16,557 -$576 TOTAL $625,347 $357,958 -$7,773 2 ISO, 2014, ISO 55002, Sec 5.2, p 7. 169.8 km 24 Total Length of Footpath Total number of Playgrounds 29 44 Total number of Parks Total Number of Buildings (Including shops and amenities) 89.73 km 73.98 km Total Length of Road Total length of stormwater pipes 180.15 km 2991 Total length of Kerb and Gutter Total number of stormwater pits 2.2.
50 Back to contents
- Note
Figure 1 shows the replacement value of our assets.
Figure 1: Asset Replacement Values ($000’s)

Figure 2 shows the asset consumption ratios of Council’s assets (average proportion of ‘as new’ condition left in assets).
2: Asset Remaining Value
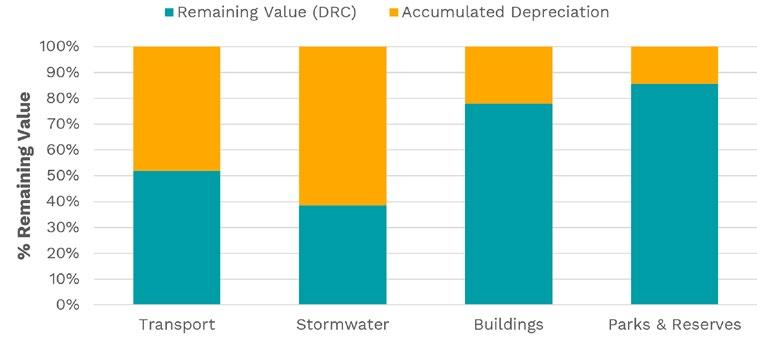
51 Burwood Resourcing Strategy Our Assets
Figure
Asset Condition
Asset physical condition is measured using a 1 - 5 grading system3 as summarised in the table below with an overview of current state presented in Figures 4 and 5 which follow.
Table 2: Asset Condition Grading Model
Condition Grading Description of Condition
1 Very Good: New condition only planned maintenance required
2 Good: Minor defects only requiring minimal maintenance plus planned maintenance
3 Fair: Programmed maintenance required to return to accepted level of service (Low Risk & acceptable level of service to community)
4 Poor: Consider rehabilitation/renewal (moderate risk & low level of service to community)
5 Very Poor: Approaching unserviceable requires renewal (High Risk & unacceptable level of service to community)

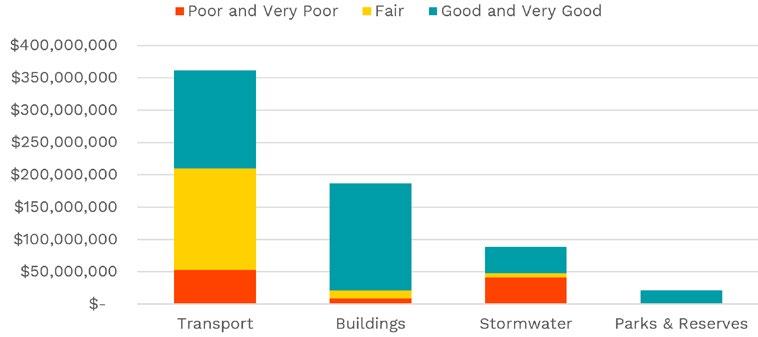 Figure 3: Condition of Assets (%)
3 IPWEA, 2011, IIMM, Sec 2.5.4, p 2|79. 52 Back to contents
Figure 4: Condition of Assets ($)
Asset Management Funding
A fundamental principle of asset management is to provide the services that the community needs at the optimum lifecycle cost and in a financially sustainable manner. Figure 5 shows the projected operations, maintenance, capital renewal, capital upgrade/new expenditure compared with financial outlays in the LTFP.

Figure 5 shows that whilst lifecycle expenditure exceeds requirements existing service levels can only be maintained and not significantly improved. Subsequently the existing funding gap or backlog of deferred renewals is expected to increase from the projected $17.7M in 2024/25 to $29.2M by 2033/34.
Figure 5: Projected Operating and Capital Expenditure (LTFP)53 Burwood Resourcing Strategy Our Assets
Asset and Financial Management Maturity
We are committed to an ongoing program of continuous improvement in our asset management practices and processes. To assist in guiding that improvement program, we have undertaken a maturity assessment of 11 core competencies developed from the National Asset Planning and Management and Financial Planning and Reporting Frameworks key elements.
A summary of Council’s maturity assessment is presented in Figure 6 below. Current maturity is shown by the blue bars, while the red bars represent the maturity gap to achieve core asset management competency.
Following progress made over the past 5 years, Council is in a position to achieve core maturity in the near future. A further maturity assessment will be scheduled to confirm attainment of core competency.
Figure 6: Maturity Assessment

Opportunities
We have identified opportunities relevant to the services included in this Strategy including:
• Regularly engaging with our community to understand the level of service they expect and to help them understand the level of service we can deliver. This information is important in setting priorities and determining resource allocation
• Improving asset knowledge so that data accurately records the asset inventory, how assets are performing and when assets are not able to provide the required service levels
• Improving our efficiency in operating, maintaining, renewing and replacing existing assets to optimise life cycle costs
• Identifying and managing risks associated with providing services from assets
• Making trade-offs between service levels and costs to ensure that the community receives the best return from assets
• Identifying assets surplus to needs for disposal to make savings in future operations and maintenance costs
• Consulting with the community to ensure that services and costs meet community needs and are affordable
• Developing partnerships with other bodies, where available to provide services
• Seeking additional funding from governments and other bodies to better reflect a ‘whole of government’ funding approach to asset intensive services
54 Back to contents
2.5. Our community’s expectations
We have identified community expectations for service levels to be generally consistent with current levels of service. We have acquired physical assets by ‘purchase’, by contract, construction by our staff and by donation of assets constructed by developers and others to meet increased levels of service.
Our goal in managing these assets is to meet the defined level of service (as amended from time to time) in the most cost effective manner for present and future consumers. Community engagement is necessary to ensure that informed decisions are made on future levels of service and costs and that service and risk consequences are known and accepted by stakeholders.
We know our community want us to deliver infrastructure assets:
• In a cost effective and sustainable way; and
• At a level which supports community life, local business and attracts visitors to the LGA.

55 Burwood Resourcing Strategy Our Assets

2.6. Where do we want to be
To ensure Council’s long-term financial sustainability, it is essential to balance the community’s expectations for services with the ability to pay for the assets used to provide the services. Maintenance of service levels for physical assets requires appropriate investment over the whole of each asset’s lifecycle. To assist in achieving this balance, we aspire to:
Develop and maintain asset management governance, skills, process, systems and data in order to provide the level of service the community need at present and in the future, in the most cost-effective and fit for purpose manner.
Objectives of this vision are to:
• Ensure that our services and assets are provided in an economically optimal way, with the appropriate level of service to residents, visitors and the environment determined by reference to our financial sustainability
• Safeguard our assets including physical assets and employees by implementing appropriate asset management strategies and appropriate financial resources for those assets
• Adopt the LTFP as the basis for all service and budget funding decisions
• Meet legislative requirements for all our operations
• Ensure resources and operational capabilities are identified and responsibility for asset management is allocated
• Provide high level oversight of financial and asset management responsibilities through Council’s Audit Risk and Improvement Committee and reports to Council on development and implementation of this Strategy, Asset Management Plan and Long-Term Financial Plan
56 Back to contents
2.7. How will we get there?
Asset Management Strategies
We will implement the following strategies to enable our organisational and asset management objectives and policies to be achieved.
Table 3: Asset Management Strategies
1 Move from annual budgeting to long term financial planning
2 Develop and annually review strategic asset management plans covering at least 10 years for all major asset classes (80% of asset value)
3 Develop and maintain a LTFP covering 10 years incorporating asset management plan expenditure projections with a sustainable funding position outcome
4 Incorporate Year 1 of the LTFP’s revenue and expenditure projections into annual budgets
5 Review and update strategic asset management plans and long-term financial plans after adoption of annual budgets. Communicate any consequence of funding decisions on service levels and service risks
6 Report our financial position at Fair Value in accordance with Australian Accounting Standards, financial sustainability and performance against organisational objectives in Annual Reports
7 Ensure council/board decisions are made from accurate and current information in asset registers, on service level performance and costs and ’whole of life’ costs
8 Report on our resources and operational capability to deliver the services needed by the community in the annual report
9 Ensure responsibilities for asset management are identified and incorporated into staff position descriptions
10 Implement an improvement plan to realise ‘core’ maturity for the financial and asset management competencies within 2 years
11 Report six monthly to Council/Board by Audit Committee/CEO on development and implementation of AM Plans and LTFPs
Desired Outcome
The long-term implications of all services are considered in annual budget deliberations
Identification of services needed by the community and required funding to optimise ‘whole of life’ costs
Sustainable funding model to provide our services
Long term financial planning drives budget deliberations
We and the community are aware of changes to service levels and costs arising from budget decisions
Financial sustainability information is available for Council and the community
Improved decision making and greater value for money
Services delivery is matched to available resources and operational capabilities
Responsibility for asset management is defined
Improved financial and asset management capacity within the organisation
Oversight of resource allocation and performance
No Strategies
57 Burwood Resourcing Strategy Our Assets
Information Systems
Council currently utilises a cloud based system for its asset register called ‘Brightly’ to effectively store detailed information on its assets. The Brightly system integrates with Council’s spatial Geographic Information System (GIS) component containing the spatial data of the assets.
Council’s information systems assist in facilitating the effective and efficient management of assets by enabling Council to:
• Document asset attributes, conditions and values
• Undertake predictive modelling to optimise the decision making process
• Project forward capital expenditure and preferred treatment options
• Fulfil the requirement to report regularly to the community and other government authorities about Council’s asset management programs and asset information
• Continuously develop the process, knowledge and support information systems as the feedback process progresses
Council will continue to develop its information systems to improve the efficiency and effectiveness of our overall asset management process. This may include improved integration between systems and the ability to assign works via the works requests system and record the associated expenditure.
Asset Management Improvement Plan
Detailed improvement tasks required to achieve a ‘core’ financial and asset management maturity are outlined in the asset management improvement plan in Section 7 of Council’s Strategic Asset Management Plan.
Consequences if actions are not completed
There are potential consequences for the Council if improvement actions are not completed. These include:
• Inability to achieve strategic and organisational objectives
• Inability to achieve financial sustainability for the organisation’s operations
• Current risks to service delivery are likely to eventuate and response actions may not be appropriately managed
• We may not be able to accommodate and/or manage changes in demand for asset intensive services
Service Levels
Service levels are outlined within the Burwood Council Asset Management Plan and can be summarised under three general categories.
Quality: Quality indicators are used to measure how assets will be maintained in a condition necessary to deliver targeted standards. Defects found or reported that are outside set service performance standards will be repaired. An asset management plan sets out the renewal and maintenance response if service levels fall below target levels. An important improvement to current practice is that there should be a forward projection of a minimum of 10 years rather than just an annual defect prioritisation.
Function: The intent of function based performance measurement is to ensure that assets are fit-for-purpose and meeting users’ needs relative to the service being provided. Where functionality gaps are identified, upgrades of existing, and/or creation of new, assets may be required.
Capacity / Utilisation: The intent of capacity based performance assessment is to ensure that assets are able to meet the current and projected demands for the service being provided. Where capacity gaps are identified, upgrades of existing, and/or creation of new, assets may be required.
58 Back to contents
Risk management
Risk management sets out how safety and risk will be managed to agreed levels. This includes the inspection and defect prioritisation processes as well as risk mitigation and control measures.
Incorporation of risk management in our Asset Management Plan must consider that:
• Risk management must be integrated with all service planning and delivery activities rather than an administrative “add on”. This means the Risk Register is an output from infrastructure asset management and the asset management plans so that it is integrated with corporate plans and 10-year financial plans
• Infrastructure risk management planning will be consistent with any existing risk management policy, particularly the steps for risk identification, assessment, management and mitigation. The corporate Risk Register is to be used as the tool for recording and reporting risk for infrastructure assets
• Risk is both an opportunity and a responsibility that should be reflected in the asset management plans. Innovative solutions and community promotion of solutions will be encouraged
• Systematic management of risk is a large task requiring a continuous improvement approach. Most service areas are already doing an excellent job of managing operational risk but not through a consistent framework of infrastructure asset management plans
• Ownership must be allocated to risk. Ownership must be linked to capacity in order to control risk
• Management of operational risk is a core line management function and is not an “add on” overhead
• Strategic risk inherent in resource allocation needs to be communicated, measured and reviewed through the framework of planning and operational plans. The 10-year financial plan for resource allocation is the mechanism for implementation
• Service performance measurement/review/ consultation/incident management is crucial to guide a systematic approach and enable us to learn from our mistakes

59 Burwood Resourcing Strategy Our Assets
3. Monitoring Our Performance
In addition to implementation and monitoring of the improvement actions detailed within the Burwood Council Asset Management Plan, Council will monitor asset management and financial performance via the following performance indicators. Indicator
Infrastructure Renewal Ratio
Capital Expenditure Ratio
Asset Maintenance Ratio
Infrastructure Backlog Ratio
To assess the rate at which these assets are being renewed relative to the rate at which they are depreciating.
To assess the extent to which Council is expanding its asset base through capital expenditure on both new assets and the replacement and renewal of existing assets.
Compares actual vs required annual asset maintenance. A ratio above 1.0 indicates Council is investing enough funds to stop the infrastructure backlog growing.
This ratio shows what proportion the backlog is against the total value of Council’s infrastructure.
1.10x
1.00x
2%
Purpose Target
>
100%
>
>
<
60 Back to contents
Appendix
Appendix A: Asset Management Policy
Purpose
The purpose of this Policy is to outline Council’s commitment to best practice, service focused and sustainable lifecycle asset management for all assets owned and/or administered by Council.
Scope
This Policy applies to the management of all services provided by infrastructure assets grouped as:
• Transport
• Drainage
• Buildings
• Parks and Recreation
Objectives
Assets owned or administered by Council must or will:
• Have an identified strategic purpose that contributes to Council’s community infrastructure and/or service delivery objectives as defined in Council’s Community Strategic Plan, Delivery Program and Operational Plan
• Be managed so that they are functionally and aesthetically sound within the appropriate levels of service, and are environmentally and financially sustainable
• Have a current Asset Management Plan detailing the whole lifecycle management of the asset
• Have budgeted funding planned for their long-term management, operation, maintenance, disposal and/or renewal
• Have the resource and capacity requirements, responsibility, custodianship and accountabilities for asset management clearly defined
• Be identified, registered and recorded in accordance with relevant legislation, regulatory requirements and accounting standards
• Be managed by transparent and responsible asset management processes that align with demonstrated best practice
• Have sufficient capacity, accessibility and adaptability to meet the varying needs of the Council community over time and be accessible and adaptable
• Be managed within an environment where all Burwood Council employees have an awareness of, an integral part in, and appropriate training and development for, infrastructure asset management practices and processes
61 Burwood Resourcing Strategy Our Assets
Policy commitment
Background
Asset management practices impact directly on the core business of Council and our ability to achieve our strategic service delivery objectives.
A focus on sustainable service delivery ensures that services are delivered in a socially, economically and environmentally responsible manner, and in a way that does not compromise the ability of future generations to make their own choices.
Sound asset management practices enable sustainable service delivery by integrating customer values, priorities and an informed understanding of the trade-offs between risks, costs and service performance.
Adopting the key asset management principles below will assist in achieving our strategic longterm community and financial objectives.
Principles
Council’s sustainable service delivery needs will be met by ensuring adequate provision is made for the long-term planning, financing, operation, maintenance, renewal, upgrade, and disposal of our infrastructure assets by:
1. Ensuring our infrastructure capital assets are provided in a manner that respects financial, cultural, economic and environmental sustainability needs
2. Meeting all relevant legislative and regulatory requirements
3. Demonstrating transparent and responsible asset management processes that align with demonstrable best-practices
4. Implementing asset management plans and strategies and providing sufficient financial resources to accomplish them
5. Incorporating Asset Management Plan expenditure projections into Council’s Long Term Financial Plan
6. Undertaking regular and systematic reviews of all asset management plans to ensure that assets are managed, valued, and depreciated in accordance with appropriate best practice
7. Conducting four yearly condition inspections, data collection, valuations and performance and risk monitoring will be carried out to ensure the currency and effectiveness of our Asset Management Plan. These inspections will also be used as part of the asset management process to ensure agreed service levels are maintained and to identify asset renewal priorities
8. Identifying asset lifecycle funding required to meet agreed service levels, as defined in adopted asset management plans, and when applicable long term financial plans, will form the basis of annual budget estimates with the service and risk consequences of variations in budget resources relative to defined asset life cycle funding requirements clearly documented
62 Back to contents
9. Reporting and consideration of future lifecycle costs in all decisions relating to new assets and upgrading of existing services and assets. Council will ensure the asset management of existing assets will not be compromised by the creation of new or upgraded assets
10. Determining future service and intervention levels in consultation with the community and key stakeholders
11. Ensuring necessary capacity and other operational capabilities are provided to asset management practices, and that responsibilities are effectively allocated for the development and implementation of asset strategies, asset management plans and service level documents
12. Implementing ongoing improvements to asset management maturity and practices, underpinned by performance measurement, audit and review at appropriate interval
13. Creating a corporate culture where all employees play a part in the overall care for Council’s assets by providing necessary asset management awareness, training and professional development
Related plans and strategies
• Burwood2036, Community Strategic Plan
• Delivery Program 2022-2026
• Resourcing Strategy 2022-2032
Asset Management Plan
Long Term Financial Plan
Digital Strategy
Workforce Management Plan
Responsibility
The Mayor and Councillors are responsible for adopting this Policy, providing high level oversight of the delivery of the Council’s asset management strategy and plans and ensuring sufficient resources are applied to manage the assets.
The General Manager has overall responsibility for developing infrastructure asset management systems, policies and procedures and financial models and reporting on the status and effectiveness of asset management within Council.
Directors and Group Managers/Managers are responsible for overseeing the development and implementation of asset and risk management plans across all asset classes, as well as implementing infrastructure asset management systems, policies and procedures. They are also responsible for ensuring that all asset management activities are consistent with the objectives of Council’s Community Strategic Plan, and our Integrated Planning and Reporting Framework. They are also responsible for ensuring that the appropriate people, processes and systems are in place and working together to deliver services and meet the corporate infrastructure asset management objectives.
Employees with management or supervisory responsibility are responsible for the management of assets within their area of responsibility. They will be responsible for the timely completion of those activities contained within those plans.
Review
This Policy has a life of 4 years or less at the discretion of the elected Council.
Contact
Manager Design and Assets on 9911 9940.
63 Burwood Resourcing Strategy Our Assets
Appendix B: References
ISO, 2014, ISO 55000, Asset management – Overview, principles and terminology, International Organization for Standardization, Geneva.
ISO, 2014, ISO 55001, Asset management – Management systems - Requirements, International Organization for Standardization, Geneva.
ISO, 2014, ISO 55002, Asset management – Management systems – Guidelines for the application of ISO 55001, International Organization for Standardization, Geneva.
IPWEA, 2014, ‘NAMS.PLUS3 Asset Management’, Institute of Public Works Engineering Australia, Sydney, www.ipwea.org/namsplus.
IPWEA, 2009, ‘Australian Infrastructure Financial Management Guidelines’, Institute of Public Works Engineering Australia, Sydney, www.ipwea.org/AIFMG.
IPWEA, 2011, ‘International Infrastructure Management Manual’, Institute of Public Works Engineering Australia, Sydney, www.ipwea.org/IIMM

64 Back to contents
Strategic Asset Management Plan
Council Infrastructure

Quick links
1. Executive Summary 66 2. Introduction 69 3. Levels of Service 71 4. Future Demand 80 5. Lifecycle Management Plan 82 6. Financial Summary 88 7. Plan Improvement and Monitoring 94 8. References 97 6. Appendices 98 Appendix A. Major Asset Class Modelling 99 Appendix B. Technical Levels of Service 107 Appendix C. Glossary 110 65 Burwood Resourcing Strategy Our Assets

1. Executive Summary
Context
Council is responsible for the acquisition, operation, maintenance, renewal and disposal of an extensive range of Infrastructure assets with a total replacement value nearing $625.35 million.
Our Asset Management Policy, Asset Management Strategy and Strategic Asset Management Plan provide the framework for Council to effectively manage its infrastructure resources in a strategic, coordinated and responsive way.
Council’s Infrastructure assets are categorised as:
• Transport
• Drainage
• Buildings
• Parks and Recreation
These assets contribute to the provision of services essential to our community’s quality of life, the prosperity of local business and the enjoyment of visitors to the Burwood LGA.
Like many NSW councils, we experience an infrastructure funding backlog due to ageing infrastructure and a funding gap between current and required capital expenditure. Therefore, long term capital plans and long-term financial planning are required to ensure that service delivery is sustainable.
This Strategic Asset Management Plan (SAMP) aligns the vision and strategic directions of Burwood2036, with the asset management objectives, principles, framework and strategies required to achieve our organisational objectives. The plan summarises the activities and expenditure projections required to achieve the asset management objectives.
Current situation
The objective of the SAMP is to describe how Council will meet its commitment to asset management as documented in Council’s Asset Management Policy. It achieves this by developing a structured set of strategic actions aimed at enabling Council to improve its asset management practices in alignment with service delivery needs.
Our aim is to achieve a ‘core’ maturity for asset management activities and continued maturity improvement where the benefits exceed the costs. Improvement tasks have been identified and documented in the Table 10 Improvement Plan.
66 Back to contents
Strategic Asset Management Plan Methodology
What does it Cost?
The forecast of the projected outlays necessary to provide the services covered by this SAMP includes operations, maintenance, capital renewal and upgrade of existing assets. Over the 10 year planning period the projected outlays are $213.05M or $21.3M on average per year.
Estimated available funding for this period is $183.9M or $18.4M on average per year which is 86% of the cost to provide the service. This is a funding deficit of $2.92M on average per year.
Projected expenditure required to provide services in the SAMP compared with planned expenditure currently included in the LTFP are shown in the following graph.
Burwood - Projected and Budget Expenditure for LTFP
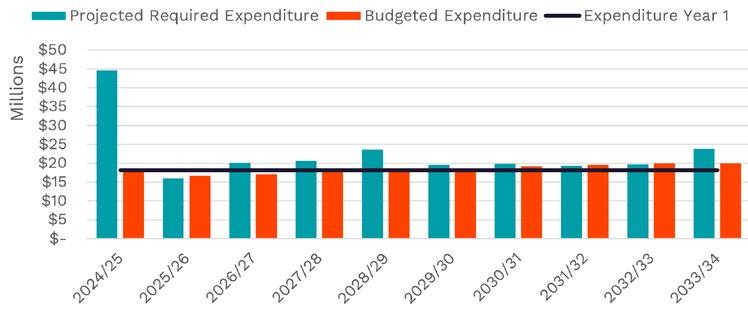
What we will do
Council has previously been driven by funding availability and been reactive to customer requests. A shift towards a strategic approach to effective asset management provides better accountability, sustainability, risk management, service management and financial efficiency.
Our aim is to provide the services needed by the community in a financially sustainable manner. Achieving financial sustainability requires balancing service levels and performance with cost and risk.
Over the next 10 years Council plans to sustain current service levels and continue its strong focus in the high-risk areas of Transport and Stormwater Drainage.
Major projects and initiatives include:
• Continued rolling works program for roads, footpaths, kerb and gutter and storm water drainage
• Continued upgrade of the Enfield Aquatic Centre
• Flockhart Park embellishment and upgrade works including new exercise equipment along the Cook’s River cycle pathway
• Burwood Park New Nature Play Park, Sensory Garden and Pond Upgrade
• Burwood Urban Park.
67 Burwood Resourcing Strategy Our Assets
What we have deferred
Whilst it is not be possible to meet all expectations for services within current financial resources, we will continue to work with the community to ensure that required services are provided at appropriate levels and at an affordable cost while managing risks.
Managing the Risks
There are risks associated with providing the service and not being able to complete all identified activities and projects. We have identified major risks as:
• Increasing financial pressure to adequately maintain the roads portfolio due to increasing costs
• Flooding caused by inadequate or lack of stormwater systems
• Highly variable and unpredictable extreme weather events, and the impact this will have on transport assets. What seemingly is a manageable position can change very quickly
We will endeavour to manage these risks within available funding by using our asset management systems implemented, to provide a sound platform for understanding the condition, maintenance and replacement schedule for all our assets, which will in turn inform our ongoing budgeting process.
Confidence Levels
This Plan is based on a mix of confidence levels as data and information varies greatly across different asset areas.
The Next Steps
The key actions resulting from this Plan are:
• Regular engagement with our community to understand the level of service they expect and to help them understand the level of service we can deliver. This information is important in setting priorities and determining resource allocation
• Improving asset knowledge so that data accurately records the asset inventory, how assets are performing and when assets are not able to provide the required service levels
• Improving our efficiency in operating, maintaining, renewing and replacing existing assets to optimise lifecycle costs
• Identifying and managing risks associated with providing services from assets
• Making trade-offs between service levels and costs to ensure that the community receives the best return from assets
• Identifying assets surplus to needs for disposal to make savings in future operations and maintenance costs
• Consulting with the community to ensure that services and costs meet community needs and are affordable
• Developing partnerships with other bodies where available, to provide services, and seeking additional funding from governments and other bodies to better reflect a ‘whole of government’ funding approach to asset intensive services
68 Back to contents
2. Introduction
Background
This Plan combines our 4 major infrastructure asset categories. It includes analysis at sub-category asset level. The purpose is to document the relationship between the organisational objectives set out in the Community Strategic Plan, Resourcing
Strategy, Delivery Program, and the asset management (or service) objectives and define the strategic framework required to achieve the asset management objectives.1 This Plan encompasses the following asset categories:
• Transport including footpaths and kerb and gutter
• Stormwater Drainage
• Buildings
• Parks and Recreation
1 ISO, 2014, ISO 55002, Sec 4.1.1, p 2.
2 Based on IPWEA 2015 IIMM, Sec 2.1.3, p 2| 13.
3 ISO 55000 Overview, principles and terminology.
Burwood
As at 30/6/2023 $’000 Current Replacement Cost Carrying Value Depreciation Expense Transport $359,035 $186,388 -$3,752 Stormwater $95,194 $36,741 -$766 Buildings $151,796 $118,272 -$2,679 Parks and Reserves $19,322 $16,557 -$576 TOTAL $625,347 $357,958 -$7,773 69 Burwood Resourcing Strategy Our Assets
Table 1: Assets covered by this Plan
LGA
- Note 9a
Goals and Objectives of Asset Ownership
Our goal in managing infrastructure assets is to meet the defined level of service (as amended from time to time) in the most cost effective manner for present and future consumers. The key elements of infrastructure asset management are:
• Providing a defined level of service and monitoring performance
• Managing the impact of growth through demand management and infrastructure investment
• Taking a lifecycle approach to developing cost-effective management strategies for the long-term that meet the defined level of service
• Identifying, assessing and appropriately controlling risks
• Linking to a long-term financial plan which identifies required, affordable expenditure and how it will be allocated.
Other relevant references to the benefits, fundamentals principles and objectives of asset management can be found in:
• International Infrastructure Management Manual 2020
• ISO 55000:2014 Asset Management –Overview, principles and terminology.
Plan Framework
Key elements of this Plan are:
• Levels of service – specifies the services and levels of service to be provided by the organisation
• Future demand – how this will impact on future service delivery and how this is to be met
• Life cycle management – how Council will manage its existing and future assets to provide defined levels of service
• Financial summary – what funds are required to provide the defined services
• Monitoring and improvement plan – how this Plan will be monitored to ensure it is meeting our organisation’s and community’s Vision and Strategic Directions.
Core and Advanced Asset Management
This Plan is prepared as a ‘core’ asset management plan over a 10-year planning period in accordance with the International Infrastructure Management Manual. Core asset management is a ‘top down’ approach where analysis is applied at the system or network level. An ‘advanced’ asset management approach uses a ‘bottom up’ approach for gathering detailed asset information for individual assets.
70 Back to contents
3. Levels of Service
Community Expectations
The expectations and requirements of various stakeholders were considered in the preparation of detailed asset management plans summarised in this SAMP. The following results have been extracted from Council’s Customer Satisfaction Survey conducted in March 2021. Key findings from the survey included:
1. 88% of residents agree/strongly agree that Burwood area is a great place to live
2. Managing development particularly high-rise development, traffic management, maintaining/ upgrading roads and natural environment/ more parks and open/green spaces for the area were all identified as the most important components to be included in the CSP
3. Residents expressed concerns for the impacts and management of high-density living and road safety
4. 92% rated their quality of life as ‘good’ to ‘excellent’
5. 94% of residents were at least ‘somewhat satisfied’ with the performance of Council.
Organisational Objectives
Our Community Strategic Plan establishes our community’s long term Vision and Strategic Directions for the Burwood LGA. Our Delivery Program defines the Principal Activities which Council will undertake to turn those aspirations into action. Our asset management objectives are developed from this overarching strategic framework and have strong links to the other elements of Council’s IP&R suite of plans and strategies. These organisational priorities and asset management objectives provide focus for the community and technical level of service outlined in this Plan.
Legislative Requirements
We have to meet many legislative requirements including Australian and State legislation and State regulations in the planning, provision and maintenance of our assets. These are outlined in the Table below.
Best thing about living in the Burwood Area
location/proximity
Natural environment/availability of parks and open spaces
‘The green open spaces’
‘Multicultural community of people’
‘Conveniently close to services and facilities’
‘Covenience of public transport’
‘Proximity to different areas and transport’
‘A lot of open space, play equipment for children and gym equipment for elderly’
‘People are nice in the area’
‘Close to shopping centres and schools’
‘Covenient transport options’
‘Close proximity to CBD’
‘Access to parks and walking tracks’
‘How well the community is connected with each other’
Close proximity to shops, services and facilities Access to public transport Multicultural area Quiet/peaceful area Sense of community/friendly atmosphere Safe area to live 0% 33% ↑ 24% 22% 16% 7% 7% 4% 4% 2% 4% 3% 3% 3% 3% 30% 20% ↓ 10% 2021 (N=406) 2019 (N=501) 20% 30% 40%
the city
Central/convenient
to
71 Burwood Resourcing Strategy Our Assets
Table 2: Legislative Requirements
Legislation
Local Government Act 1993
Requirement
Sets out role, purpose, responsibilities and powers of local governments.
The purposes of this Act are as follows:
to provide the legal framework for an effective, efficient, environmentally responsible and open system of local government in New South Wales,
to regulate the relationships between the people and bodies comprising the system of local government in New South Wales,
to encourage and assist the effective participation of local communities in the affairs of local government,
to give councils:
the ability to provide goods, services and facilities, and to carry out activities, appropriate to the current and future needs of local communities and of the wider public the responsibility for administering some regulatory systems under this Act a role in the management, improvement and development of the resources of their areas
to require councils, councillors and employees to have regard to the principles of ecologically sustainable development in carrying out their responsibilities
The land management provisions of the Act require that Council prepare plans of management for all community land. The plan of management identifies the management objectives for the land category, performance indicators and performance measures to meet the objectives identified.
Local Government Amendment (Planning and Reporting) Act 2009
Disability Discriminations Act, 1992
Work Health and Safety Act 2011
Environmental Planning and Assessment Act 1979
Local Government Amendment (Planning and Reporting) Act 2009 includes the preparation of a long-term financial plan supported by asset management plans for sustainable service delivery.
The Federal Disability Discrimination Act 1992 (D.D.A.) provides protection for everyone in Australia against discrimination based on disability. It encourages everyone to be involved in implementing the Act and to share in the overall benefits to the community and the economy that flow from participation by the widest range of people. It mandates that:
a) To eliminate, as far as possible, discrimination against persons on the ground of disability in the areas of:
i) Work, accommodation, education, access to premises, clubs and sport; and
ii) The provision of goods, facilities, services and land and
iii) existing laws and
iv) The administration of Commonwealth laws and programs and
b) To ensure, as far as practicable, that persons with disabilities have the same rights to equality before the law as the rest of the community; and to promote recognition and acceptance within the community of the principle that persons with disabilities have the same fundamental rights as the rest of the community.
Sets out roles and responsibilities to secure the health, safety and welfare of persons at work and covering injury management, emphasising rehabilitation of workers particularly for return to work. Council is to provide a safe working environment and supply equipment to ensure safety.
An Act to institute a system of environmental planning and assessment for the State of New South Wales. Among other requirements the Act outlines the requirement for the preparation of Local Environmental Plans (LEPs), Development Control Plans (DCPs), Environmental Impact Assessments (EIA) and Environmental Impact Statements.
Plant Protection Act 1989 This Act sets out requirements in respect to Flora Protection
72 Back to contents
Legislation
Environmental Protection Act 1994
Threatened Species Conservation Act, 1995
Requirement
This act sets out requirements in respect to environmental protection
An Act to conserve threatened species, populations and ecological communities of animals and plants.
Under the terms of this Act Council is required to ensure the long-term survival of the species identified.
Rivers and Foreshores Improvements Act, 1948
Protection of the Environment Operations Act 1997
National Parks and Wildlife Act (1974)
Native Vegetation Act 2003
Public Works Act 1912
Road Transport (General) Act 2005
Road Transport (Safety and Traffic Management) Act 1999
Roads Act 1993
Local Government (Highways) Act 1982
NSW Road Rules 2008
Valuation of Land Act 1916
An Act to provide for the carrying out of works for the removal of obstructions from and the improvement of rivers and foreshores and the prevention of erosion of lands by tidal and non-tidal waters
Council is required to exercise due diligence to avoid environmental impact and among others are required to develop operations emergency plans and due diligence plans to ensure that procedures are in place to prevent or minimise pollution.
An Act relating to the establishment, preservation and management of national parks, historic sites and certain other areas and the protection of certain fauna, native plants and Aboriginal objects.
This Act regulates the clearing of native vegetation on all land in NSW, except for excluded land listed in Schedule 1 of the Act. The Act outlines what landowners can and cannot do in clearing native vegetation.
Sets out the role of Council in the planning and construction of new assets.
Provides for the administration and enforcement of road transport legislation. It provides for the review of decisions made under road transport legislation. It makes provision for the use of vehicles on roads and road related areas and also with respect to written off and wrecked vehicles.
Facilitates the adoption of nationally consistent road rules in NSW, the Australian Road Rules. It also makes provision for safety and traffic management on roads and road related areas including alcohol and other drug use, speeding and other dangerous driving, traffic control devices and vehicle safety accidents.
Sets out rights of members of the public to pass along public roads, establishes procedures for opening and closing a public road, and provides for the classification of roads. It also provides for declaration of the RTA and other public authorities as roads authorities for both classified and unclassified roads, and confers certain functions (in particular, the function of carrying out roadwork) on the RTA and other roads authorities. Finally it provides for distribution of functions conferred by this Act between the RTA and other roads authorities, and regulates the carrying out of various activities on public roads.
An Act to consolidate with amendments certain enactments concerning the functions of the corporations of municipalities with respect to highways and certain other ways and places open to the public.
A provision of road rules that are based on the Australian Road Rules so as to ensure that the road rules applicable in this State are substantially uniform with road rules applicable elsewhere in Australia.
This act sets out requirements in respect Land Valuation
Crown Lands Act, 1989 An Act to provide for the administration and management of Crown land in the Eastern and Central Division of the State of NSW. Council has large holdings of Crown land under it care, control and management.
73 Burwood Resourcing Strategy Our Assets
Legislation Requirement
Heritage Act, 1977
An Act to conserve the environmental heritage of the State.
Several properties are listed under the terms of the Act and attract a high level of maintenance cost, approval and monitoring.
Several properties are listed under the terms of the Act and attract a high level of maintenance cost, approval and monitoring.
Building Code of Australia
Building Fire and Safety Regulation 1991
Electrical Safety Act 2002
The goal of the BCA is to enable the achievement of nationally consistent, minimum necessary standards of relevant, health, safety (including structural safety and safety from fire), amenity and sustainability objectives efficiently.
This Act sets out the regulations for things such as means of escape, Limitation of people in buildings, Fire and evacuation plans and testing of special fire services and installations.
This act sets out the installation, reporting and safe use with electricity
Building Regulation 2003 This act sets out requirements in respect to Building Requirements
Plumbing and Drainage Act 2002
This act sets out requirements in respect to Plumbing Requirements
Rural Fires Act, 1997 An Act to establish the NSW Rural Fire Service and define its functions; to make provision for the prevention, mitigation and suppression of rural fires.
Under the terms of this Act Council is required to mitigate any fire that emanate from bushland.
Dangerous Goods Safety Management Act 2001
Fire and Rescue Service Act 1990
Public Records Act 2002
Surveillance Devices Act
Civil Liability Act, 2002
Companion Animals Act, 1998
This act sets out the safe use, storage and disposal of dangerous goods
This act sets out requirements in respect to Emergency Services for Fire and Rescue
This act sets out requirements in respect maintaining Public Records
This act sets out requirements in respect use of Surveillance Devices
An Act to make provision in relation to the recovery of damages for death or personal injury caused by the fault of a person
An Act to provide for the identification and registration of companion animals and for the duties and responsibilities of their owners.
Under the terms of the Act Council is required to provide and maintain at least one off leash area. It currently has eleven areas identified as off leash.
Rural Fires Act, 1997 An Act to establish the NSW Rural Fire Service and define its functions; to make provision for the prevention, mitigation and suppression of rural fires.
Under the terms of this Act Council is required to mitigate any fire that emanate from bushland.
74 Back to contents
Levels of Service
We have defined service levels in two terms.
Community Levels of Service - measure how the community receives the service and whether the organisation is providing community value.
Community levels of service measures used in this Plan are:
Quality How good is the service?
Function Does it meet the needs of the user?
Capacity/Utilisation Is the service usage appropriate to capacity?
An overview of current community levels of service is provided in Table 3 below.
Technical Levels of Service - Supporting the community service levels are operational or technical measures of performance. These technical measures relate to the allocation of resources to service activities that the organisation undertakes to best achieve the desired community outcomes and demonstrate effective organisational performance.
Technical service measures are linked to annual budgets covering:
• Operations – the regular activities to provide services such as availability, cleansing, mowing, etc.
• Maintenance – the activities necessary to retain an assets as near as practicable to an appropriate service condition (e.g. road patching, unsealed road grading, building and structure repairs)
• Renewal – the activities that return the service capability of an asset up to that which it had originally (e.g. road resurfacing and pavement reconstruction, pipeline replacement and building component replacement)
• Upgrade – the activities to provide an higher level of service (e.g. widening a road, sealing an unsealed road, replacing a pipeline with a larger size) or a new service that did not exist previously (e.g. a new library).
Service managers plan, implement and control technical service levels to influence the customer service levels.2
Together the community and technical levels of service provide detail on service performance, cost and whether service levels are likely to stay the same, get better or worse.
Technical levels of service for each asset category are detailed in Appendix B.
75 Burwood Resourcing Strategy Our Assets
Key
Table 3: Community Levels of Service
Community Levels of Service – Transport and Stormwater Drainage
Quality Well maintained roads, footpaths and Kerb and Gutter
Roads, footpaths and Kerb and Gutter that do not cause water ponding
Look well maintained Transport infrastructure condition meets hierarchy requirements for condition measures
Customer surveys Customer requests
Access to public transport – 97% Satisfaction
Traffic management and road safety – 85% satisfaction
Maintaining Footpaths –83% satisfaction
Access to cycleways –58% satisfaction
Has not been fully assessed at this time
It is anticipated that customer requests and community satisfaction would remain the same if not improve over the next 10 years
Level of Service Objective Performance Measure Process Current Level of Service 10 Year Projection Current LTFP Funding
Performance Measure
Roads State of the Assets Report Condition Profiles 96% 4% 0% Confidence Level: High 72% 26% 2% Confidence Level: Medium Footpaths State of the Assets Report. Condition Profiles 62% 37% 1% Confidence Level: High 54% 41% 5% Confidence Level: Medium Kerb
State of the Assets Report. Condition Profiles 50% 50% 0% Confidence Level: High 25% 73% 2% Confidence Level: Medium 76 Back to contents
and Gutter
Provide efficient method of collection and disposal stormwater
Stormwater Drainage condition meets hierarchy requirements for condition measures
Customer surveys
Customer requests
Function Ensure access to facilities and services is provided that is suited to the use
Transport Infrastructure meets hierarchy requirements for traffic volumes, design speed, width, alignment, access etc.
Ensure stormwater system meets community expectations
Removal of gross pollutants
Capacity/ Utilisation
Transport network meets the capacity requirements appropriate to hierarchy
Customer requests
Function Profile
Has not been fully assessed at this time
Customer requests
Function Profile
Confidence Level: Low
Has not been fully assessed at this time
Confidence Level: Low
It is anticipated that customer requests and community satisfaction would remain generally the same over the next 10 years
Customer requests
Capacity Profile
Has not been fully assessed at this time
Confidence Level: Low
Confidence Level: Low
Requests received should not increase annually.
Confidence Level: Low
Has not been fully assessed at this time
Confidence Level: Low
Requests received should not increase annually.
Confidence Level: Low
Requests received should not increase annually.
Confidence Level: Low
Measure Level of Service Objective Performance Measure Process Current Level of Service 10 Year Projection Current LTFP Funding
Key Performance
State of the Assets Report. Condition Profile 50% 4% 46%
60% 3% 37%
77 Burwood Resourcing Strategy Our Assets
Community Levels of Service – Buildings
Quality Service the needs of the community and Council to an appropriate standard
Buildings and facilities to be safe and suitable to users
At a quality or standard suitable for their use
Function Buildings and facilities to be suitable for customer activities
Easy to access
Fit for their purpose
Create a pleasant experience
Capacity/ Utilisation
Building facilities meet program delivery needs
Available
Sufficient facilities for the number of users
Not overused
Customer surveys Customer requests
Protection of heritage buildings and items – 76% satisfaction
Community centres and facilities – 92% satisfaction
Has not been fully assessed at this time
It is anticipated that customer requests will not increase and community dissatisfaction would remain steady over the next 10 years
Customer requests Function Profile
Customer requests Capacity Profile
Has not been fully assessed at this time
Confidence Level: Low
Requests are likely to slowly increase annually
Confidence Level: Low
Has not been fully assessed at this time
Confidence Level: Low
Requests are likely to increase slowly annually
Confidence Level: Low
Key Performance Measure Level of Service Objective Performance Measure Process Current Level of Service 10 Year Projection Current LTFP Funding
Buildings State of the Assets Report Condition Profiles 91% 8% 1% Confidence Level: High 87% 6% 7% Confidence Level: Medium
78 Back to contents
Community Levels of Service – Parks and Recreation
Quality Look well maintained and clean
Fields have playable surface
At a quality or standard suitable for their purpose
Function Easy to access
Fit for their use
Create a pleasant experience
Capacity/ Utilisation
Available
Sufficient facilities for the number of users
Customer surveys Customer requests Enough opportunities to participate in sporting or recreational activities – 16% disagree
Has not been fully assessed at this time It is anticipated that customer requests will decrease and community satisfaction would improve over the next 10 years
Parks and Recreation State of the Assets Report
Condition Profiles
Customer requests Function Profile
Customer requests Capacity Profile
Has not been fully assessed at this time
Confidence Level: Low
Has not been fully assessed at this time
Confidence Level: Low
Requests received should not increase annually
Confidence Level: Low
Requests received should not increase annually
Confidence Level: Low
Key
Measure Level of Service Objective Performance Measure Process Current Level of Service 10 Year Projection Current LTFP Funding
Performance
96% 3% 1% Confidence Level: High 50% 38% 12% Confidence Level: Medium
79 Burwood Resourcing Strategy Our Assets
4. Future Demand
Demand Drivers
Drivers affecting demand include population change, changes in demographics, seasonal factors, climate change, vehicle ownership rates, consumer preferences and expectations, government decisions, technological changes, economic factors, agricultural practices, environmental awareness, etc.
Demand Forecast
The present position and projections for demand drivers that may impact future service delivery and utilisation of assets were identified and are documented in Table 4.
Demand Impact on Assets
The impact of demand drivers that may affect future service delivery and utilisation of assets are shown below.
Table 4: Demand Drivers, Projections and Impact on Services
Development
Population increase and higher density development
Steady growth anticipated to continue
Community Expectations
Increasing Costs
There is a desire from the community for a high standard of services
The cost to construct, maintain and renew infrastructure is increasing at a rate greater than council’s revenue
Expectations will continue to increase
Increase in demand for services supported by infrastructure due to development and population growth
Existing networks may not be fully suitable for the purpose
Cost of renewing infrastructure systems is increasing. Cost increases are anticipated to continue and will likely be at a higher rate than CPI.
The need to carefully target and plan infrastructure is increasing in importance as maximising the service that can be delivered within the funding limitations will be under pressure
80 Back to contents
Demand drivers Present position Projection Impact on services
Environment and Climate Change It is widely accepted that climate is changing
Future is uncertain but is likely that climate change will impact on the delivery of the services provided by infrastructure.
Weather extremes will have significant impact on infrastructure
Demand Management Plan
Demand for new services will be managed through a combination of managing existing assets, upgrading of existing assets and providing new assets to meet demand and implementing demand management practices. Such practices include non-asset solutions, insuring against risks and managing failures.
Non-asset solutions focus on providing the required service without the need for the organisation to own the assets and
Service Impact
Some services such as the Transport and stormwater drainage may be impacted directly by climate/ rainfall and severe events.
Higher frequency and larger flood events
management actions including reducing demand for the service, reducing the level of service (allowing some assets to deteriorate beyond current service levels) or educating customers to accept appropriate asset failures3.
Examples of non-asset solutions include providing joint services from existing assets such as aquatic centres and libraries that may be in another community area or public toilets provided in commercial premises.
Opportunities identified for demand management are shown in the table below.
Table 5: Demand Management Plan Summary
Communicate options and capacity to fund infrastructure works with the community
Funding priority works
Demand Management Plan
Monitor community expectations and communicate service levels and financial capacity with the community to balance priorities for infrastructure with what the community is prepared to pay for
Link asset management planning to LTFPs and community strategic plans.
Continue to seek grant funding for projects identified in Burwood’s Community and Strategic Asset Management Plans
Improve understanding of costs and capacity to maintain current service levels.
Climate Change
Continue to analyse the cost of providing service and the capacity to fund at the current level of service
Increased understanding of climate change effects and required management techniques
3 IPWEA, 2011, IIMM, Table 3.4.1, p 3|58.
81 Burwood Resourcing Strategy Our Assets
Asset Programs to meet Demand
The new assets required to meet growth will be acquired free of cost from land developments and constructed/acquired by the organisation. New assets constructed/acquired by the organisation are discussed in Section 5.
Acquiring these new assets will commit the organisation to fund ongoing operations, maintenance and renewal costs for the period that the service provided from the assets is required. These future costs are identified and considered in developing forecasts of future operations, maintenance and renewal costs in Section 5.
5. Lifecycle Management Plan
The lifecycle management plan details how the organisation plans to manage and operate the assets at the agreed levels of service (defined in Section 3) while optimising life cycle costs.
Background Data
Physical parameters
The assets covered by this Plan are
• Transport
• Drainage
• Buildings
• Parks and Recreation
Asset capacity and performance
The organisation’s services are generally provided to meet relevant design standards where these are available.
Infrastructure Risk Management Plan
An assessment of risks associated with service delivery from infrastructure assets conducted for each relevant asset management plan identified critical risks that will result in loss or reduction in service from infrastructure assets or a ‘financial shock’ to the organisation. The risk assessment process identifies credible risks, the likelihood of the risk event occurring, the consequences should the event occur, develops a risk rating, evaluates the risk and develops a risk treatment plan for nonacceptable risks.
Critical risks, being those assessed as ‘Very High’ – requiring immediate corrective action and ‘High’ – requiring prioritised corrective action identified in the Infrastructure Risk Management Plan(s) and the adopted treatment plan are summarised below. These risks are regularly reported to Council’s Executive and Councillors.
82 Back to contents
Table 6: Critical Risks and Treatment Plans
Service or Asset at Risk What can Happen
Roads
Increasing financial pressure to adequately maintain the roads portfolio The long-term renewal of road seals is not adequate
Road Maintenance
Road Damage
Increasing maintenance requirements
Damage to roads as a result of major storm events
Stormwater Drainage
Stormwater Network General deterioration of the network resulting in structural and capacity failures
Stormwater Network Flooding due to blockages
Stormwater Network Flooding caused by inadequate or lack of stormwater systems
Footpaths
Footpaths Path user trips and injure themselves on damaged path surface.
Buildings
Building Renewal
Utilisation
Park and Recreation
Playgrounds
Very High
Buildings deteriorate to a lesser service standard and higher risk situation
Buildings not suiting the needs of service providers
Incident or injury for community members using facilities
High
Very High
Roads resealing program focusing on high priority areas determined by road hierarchy, condition data, and priorities identified in the CSP
Continue to improve data
Documented service level risks and utilisation for establishing future maintenance priorities
At present this can be only partially managed within councils resourcing. Council is reliant on assistance funding from other levels of government to manage these events
High
Assess adequacy of inspections, particularly in aged network areas
Keep data up to date so that renewals can be planned
High
High
Assess adequacy of programs and monitor frequency of problems due to inadequate cleaning or maintenance
Review stormwater management program
High
Regular inspection of path condition and defects in accordance with footpath policy. Inspections by Council personnel for any hazards reported by public. Use of materials in new path construction to increase life of footpath
MediumHigh
MediumHigh
Future planning improvements can be made by further documented service level risks and utilisation of these in establishing future renewal priorities
Continue to monitor not only the condition of buildings, but how well they suit the needs of users
MediumHigh
Regular renewal of soft-fall, prevention of usages if broken, repair faulty or broken equipment through regular inspection and maintenance.
Risk
(VH, H) Risk Treatment Plan
Rating
83 Burwood Resourcing Strategy Our Assets
Routine Operations and Maintenance Plan
Operations include regular activities to provide services such as public health, safety and amenity, e.g. cleansing, utility services, street sweeping, grass mowing and street lighting.
Routine maintenance is the regular on-going work that is necessary to keep assets operating, including instances where portions of the asset fail and need immediate repair to make the asset operational again.
Operations and Maintenance Plan
Operations activities affect service levels including quality and function, such as cleanliness, appearance, etc., through street sweeping and grass mowing frequency, intensity and spacing of street lights and cleaning frequency and opening hours of building and other facilities.
Maintenance includes all actions necessary for retaining an asset as near as practicable to an appropriate service condition including regular ongoing day-to-day work necessary to keep assets operating, eg road patching but excluding rehabilitation or renewal.
Maintenance expenditure levels are considered to be adequate to meet projected service levels, which may be less than or equal to current service levels. Where maintenance expenditure levels are such that will result in a lesser level of service, the service consequences and service risks have been identified and service consequences highlighted in the respective AM Plan and service risks considered in the Infrastructure Risk Management Plan.
Operations and Maintenance Strategies
We will operate and maintain assets to provide the defined level of service to approved budgets in the most cost-efficient manner. The operation and maintenance activities include:
• Scheduling operations activities to deliver the defined level of service in the most efficient manner
• Undertaking maintenance activities through a planned maintenance system to reduce maintenance costs and improve maintenance outcomes. Undertake cost-benefit analysis to determine the most cost-effective split between planned and unplanned maintenance activities (50 – 70% planned desirable as measured by cost)
• Maintain a current infrastructure risk register for assets and present service risks associated with providing services from infrastructure assets and reporting Very High and High risks and residual risks after treatment to management and Council/Board
• Review current and required skills base and implement workforce training and development to meet required operations and maintenance needs
• Review asset utilisation to identify underutilised assets and appropriate remedies, and over utilised assets and customer demand management options
• Maintain a current hierarchy of critical assets and required operations and maintenance activities
• Develop and regularly review appropriate emergency response capability
• Review management of operations and maintenance activities to ensure we are obtaining best value for resources used.
Summary of future operations and maintenance expenditures
Future operations and maintenance expenditure is forecast to trend in line with the value of the asset stock as shown in Figure 2 with estimated available operating budget funding. Note that all costs are shown in current dollar values (i.e. real values).
84 Back to contents
Figure 2: Projected Operations and Maintenance Expenditure and Budget (LTFP)

Renewal and Replacement Plan
Renewal and replacement expenditure is major work which does not increase the asset’s design capacity but restores, rehabilitates, replaces or renews an existing asset to its original or lesser required service potential. Work over and above restoring an asset to original service potential is upgrade/expansion or new works expenditure.
Renewal and Replacement Strategies
We will plan capital renewal and replacement projects to meet level of service objectives and minimise infrastructure service risks by:
• Planning and scheduling renewal projects to deliver the defined level of service in the most efficient manner
• Using optimal renewal methods (cost of renewal is less than replacement) wherever possible
• Maintaining a current infrastructure risk register for assets and service risks associated from infrastructure assets reporting Very High and High risks and residual risks after treatment to management and Council
• Reviewing current and required skills base and implement workforce training and development to meet required construction and renewal needs
• Maintaining a current hierarchy of critical assets and capital renewal treatments and timings required
• Reviewing management of capital renewal and replacement activities to ensure we are obtaining best value for resources used.
• Undertaking project scoping for all capital renewal and replacement projects to identify the service delivery ‘deficiency’, present risk and optimum time for renewal/ replacement the project objectives to rectify the deficiency the range of options with estimated capital and life cycle costs for each options that could address the service deficiency and evaluate the options against evaluation criteria adopted by Council/Board, and select the best option to be included in capital renewal programs
85 Burwood Resourcing Strategy Our Assets
Renewal ranking criteria
Asset renewal and replacement is typically undertaken to either:
• Ensure the reliability of the existing infrastructure to deliver the service it was constructed to facilitate (e.g. replace a bridge that has a 5 t load limit) or
• To ensure the infrastructure is of sufficient quality to meet the service requirements (eg roughness of a road).4
It is possible to get some indication of capital renewal and replacement priorities by identifying assets or asset groups that:
• Have a high consequence of failure
• Have a high utilisation and subsequent impact on users would be greatest
• The total value represents the greatest net value to the organisation
• Have the highest average age relative to their expected lives
• Are identified in this Plan as key cost factors
• Have high operational or maintenance costs, and
• Where replacement with modern equivalent assets would yield material savings.5
The ranking criteria used to determine priority of identified renewal and replacement proposals is detailed in the respective sections of this Plan.
Summary of future renewal and replacement expenditure
Projected future renewal and replacement expenditures are forecast to increase over time as the asset stock increases from growth as shown in Figure 3. Note that all costs are shown in current dollar values.

4 IPWEA, 2011, IIMM, Sec 3.4.4, p 3|60.
5 Based on IPWEA, 2011, IIMM, Sec 3.4.5, p 3|66.
86 Back to contents
Figure 3: Projected Capital Renewal and Replacement Expenditure (LTFP)
Projected Capital Renewal and Replacement Expenditure
Creation/Acquisition/Upgrade Plan
New works are those works that create a new asset that did not previously exist, or works which upgrade or improve an existing asset beyond its existing capacity. They may result from growth, social or environmental needs. Assets may also be acquired at no cost to the organisation from land development. These assets from growth are discussed in Section 4.5.
Selection criteria
New assets and upgrade/expansion of existing assets are identified from various sources such as Councillor or community requests, proposals identified by strategic plans or partnerships with other organisations. Candidate proposals are inspected to verify need and to develop a preliminary cost estimate. Verified proposals are ranked by priority and available funds and scheduled in future works programmes. The priority ranking criteria is detailed in the respective asset management plans.
Capital Investment Strategies
We will plan capital upgrade and new projects to meet level of service objectives by:
• Planning and scheduling capital upgrade and new projects to deliver the defined level of service in the most efficient manner
• Undertake project scoping for all capital upgrade/new projects to identify the service delivery ‘deficiency’, present risk and required timeline for delivery of the upgrade/new asset the project objectives to rectify the deficiency including value management for major projects the range of options, estimated capital and life cycle costs for each options that could address the service deficiency management of risks associated with alternative options and evaluate the options against evaluation criteria adopted by Council/Board, and select the best option to be included in capital upgrade/new programs
• Review current and required skills base and implement training and development to meet required construction and project management needs
• Review management of capital project management activities to ensure we are obtaining best value for resources used.
Standards and specifications for maintenance of existing assets and construction of new assets and upgrade/expansion of existing assets are detailed in relevant sections of this Plan.
87 Burwood Resourcing Strategy Our Assets
Summary of future upgrade/new assets
expenditure
Summary of future upgrade/new assets
expenditure Over the next 10 years Council is planning to invest $10.3M to improve services
by upgrading or building new infrastructure to service the Burwood community. This is predominately made up of Transport $6.4M and Parks $3.9M. Proposed upgrade/new expenditure is shown in Figure 4.

Disposal Plan
Disposal includes any activity associated with disposal of a decommissioned asset including sale, demolition or relocation. No assets have been identified for possible decommissioning or disposal in this Plan.
6. Financial Summary
This section contains the financial requirements resulting from all the information presented in the previous sections of this asset management plan. The financial projections will be improved as further information becomes available on desired levels of service and current and projected future asset performance.
Financial Indicators and Projections
Sustainability of service delivery
In addition to long term life cycle costs/ expenditures there are 3 key indicators for service delivery sustainability that have been considered within this Plan, these being the asset renewal funding ratio and the medium term projected/budgeted expenditures over 5 and 10 years of the planning period.
The Asset Renewal Funding Ratio is the most important indicator and reveals whether projected capital renewal and replacement expenditure can be financed in the long-term financial plan. It is calculated by dividing the projected capital renewal expenditure shown in the AM Plan by the estimated capital renewal budget provided in the long-term financial plan.
Table 7 shows overall sustainability of service calculations for the assets covered by this Plan.
Figure 4: Projected Capital Upgrade/New Expenditure (LTFP)88 Back to contents
5
The table above shows that under the current LTFP Council can fund 70% of the projected asset renewals (Including existing backlog) over the next 10 years.
Providing services from infrastructure in a sustainable manner requires the matching and managing of service levels, risks, projected expenditures and financing to achieve a financial indicator of approximately 1.0 for the first years of the asset management plan and ideally over the 10 year life of the LTFP.
Figures 9.0 and 9.1 show the projected asset renewal and replacement expenditure over the 10 years of the SAMP. The graph also importantly shows the accumulated impact that each funding scenario is having on council’s reported backlog.
Table
Service Delivery
Sustainability of service delivery (Including Backlog) LTFP ($,000) Asset Renewal Funding Ratio 10 Year Renewal Projected Expenditure $96,768 10 Year Renewal Planned (Budget) Expenditure $67,590 Asset Renewal Funding Ratio 70% Medium
Sustainability
year Operations, Maintenance & Renewal Projected Expenditure $202,708 10 year Operations, Maintenance & Renewal Planned (Budget) Expenditures $173,530 10 year Funding Shortfall (10 year projected. expenditures. - Planned (Budget) Expenditures) $29,178 10 year Sustainability Indicator (10 year planned exp. / projected. Expenditure) 86% Short Term (5 years) Sustainability 5 year Operations, Maintenance & Renewal Projected Expenditure $104,357
year Operations, Maintenance & Renewal Planned (Budget) Expenditure $83,120
7: Sustainability of
(Including Current Backlog)
Term (10 yrs)
10
5
year Funding Shortfall (5 year projected expenditures. - planned (budget) expenditures) $21,237 5 year Sustainability Indicator (5 year planned expenditures. / projected expenditures) 80%
89 Burwood Resourcing Strategy Our Assets
Figure 5: Projected and LTFP Budgeted Renewal Expenditure including backlog (LTFP)

Table 8: Summary of Projected and Planned (LTFP) Renewal Expenditure including carrying backlog
Year Projected Renewals Planned/Funded Renewals Annual Shortfall Projected Backlog 2024/25 $25,695 $7,973 $17,722 $17,722 2025/26 $3,179 $6,183 -$3,004 $14,717 2026/27 $7,648 $6,243 $1,404 $16,122 2027/28 $7,407 $6,469 $937 $17,059 2028/29 $10,725 $6,547 $4,178 $21,237 2029/30 $8,654 $6,725 $1,929 $23,166 2030/31 $4,502 $6,804 -$2,301 $20,865 2031/32 $10,485 $6,884 $3,601 $24,466 2032/33 $8,732 $6,881 $1,851 $26,316 2033/34 $9,743 $6,881 $2,862 $29,178 90 Back to contents
Funding Strategy
The funding strategy to provide the services covered by this Plan is contained within the Council’s LTFP.
Valuation Forecasts
Asset values are forecasted to increase as additional upgraded and new assets are added to the asset stock from construction and acquisition by the organisation. Figure 10 shows the projected asset replacement cost asset values over the planning period in current dollar values.
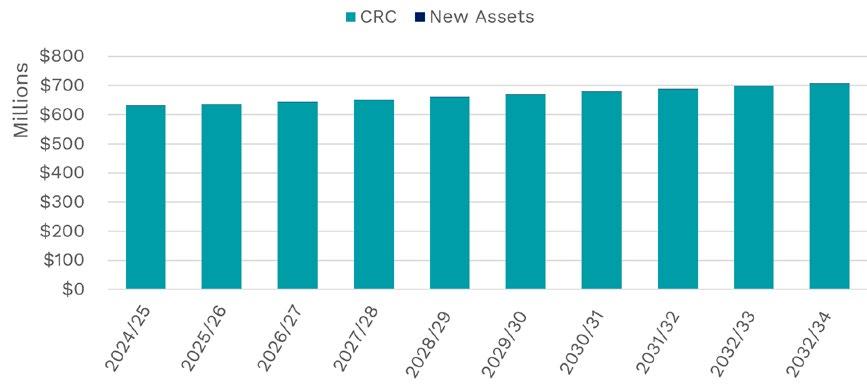
Annual depreciation expense is forecast to increase in line with asset replacement values as shown in Figure 7.
 Figure 6: Projected Asset Replacement Values
91 Burwood Resourcing Strategy Our Assets
Figure 7: Projected Depreciation Expense
The depreciated asset replacement value will vary over the forecast period depending on the rates of addition of new assets, disposal of old
assets and consumption and renewal of existing assets. The forecast of the depreciated asset replacement value is shown in Figure 8 below.
Figure 8: Projected Depreciated Replacement Value

Key Assumptions made in Financial Forecasts
This section details the key assumptions made in presenting the information contained in this Plan and in preparing forecasts of required operating and capital expenditure and asset values,
depreciation expense and carrying amount estimates. It is presented to enable readers to gain an understanding of the levels of confidence in the data behind the financial forecasts. Key assumptions made in this Plan and risks that these may change are shown below.
Table 9: Key Assumptions made in this Plan and Risks of Change
Key Assumptions
Projected renewal data including average annual asset consumption which is used for the Long Term sustainability assessments
Use of existing valuations, useful lives and remaining lives determined from the condition rating
Use of current expenditure information as best as this can be determined
Current levels of service will remain constant over the life of the AMP
Continued use of current construction techniques and materials in alignment with current standards
Risks of Change to Assumptions
Buildings - Medium
Parks – Low
Stormwater Drainage – Medium/High
Transport - Low
Buildings - Medium
Parks – Low
Stormwater Drainage – Medium
Transport - Low
Capital Forecasts – Low
Operations and Maintenance Forecasts – Medium
Buildings - Medium
Parks – Low
Stormwater Drainage – Medium
Transport - Low
Buildings - Medium
Parks – Low
Stormwater Drainage – Low
Transport - Low
92 Back to contents
Forecast Reliability and Confidence
The expenditure and valuations projections in this strategic AM Plan are based on best available data. Currency and accuracy of data is critical to effective asset and financial management.
The estimated confidence level for and reliability of data used in this AM Plan is shown below.
Table 10: Data Confidence Assessment for AM Plans summarised in Strategic AM Plan
Data Confidence
Demand Drivers
Growth Projections
Operations Expenditure
Maintenance Expenditure
Renewal Expenditure
C - Uncertain
B - Reliable
B - Reliable
B - Reliable
B - Reliable
Upgrade/New Expenditure
Disposal Expenditure
Condition Modelling
B - Reliable
B - Reliable
B - Reliable
Asset Values
Asset Useful Lives
B - Reliable
B - Reliable
Over all data sources, the data confidence level is assessed as medium to high confidence level for data used in the preparation of this Plan.
Actions to mitigate any adverse effects of data quality are included within Table 10 below.
Estimated, further substantiation required for next revision of the SAMP.
Estimated, further substantiation required for next revision of the SAMP.
From budget, however additional analysis required. Breakdown into operations and maintenance is estimated and requires further development.
From budget, however additional analysis required. Breakdown into operations and maintenance is estimated and requires further development.
Buildings – Medium Confidence Parks – High Confidence
Stormwater Drainage – Low Confidence Transport – High Confidence
Could be identified from total capital works budget.
None identified.
Buildings – Medium Confidence
Parks – High Confidence
Stormwater Drainage – Low Confidence Transport – High Confidence
From 2022-23 Financial Report.
Ongoing substantiation required.
Assessment Comment
93 Burwood Resourcing Strategy Our Assets
7. Plan Improvement and Monitoring
Improvement Program
The asset management improvement tasks identified from an external Asset Management Maturity Audit and preparation of this Plan are shown here.
Table 11: Key Strategies for Asset Management Maturity
AM Planning AM Policy Y KS-1
Ensure that the AM Policy is implemented and communicated to key stakeholders.
Ensure Council is briefed on their roles and governance responsibilities under the reviewed AM Policy
AM Planning Governance and Management Y KS-2
AM Planning AM Plans Y KS-3
Financial Planning Annual Budget Y KS-4
Implement this asset management development program to improve Council’s asset management maturity, particularly in the area of measurement and reporting of trends in service levels and risk that result from the available funding scenarios in the LTFP
Continue to develop and update Strategic Asset Management Plans for the major asset groups
• Governance and Risk Ongoing
AM Planning Governance and Management Y KS-5
Identify infrastructure expenditure by both:
• Expenditure Category i.e. the Asset Group it is associated with; for example, road pavement
• Expenditure Type – operating, maintenance, capital renewal, capital upgrade or capital expansion
Consider the ongoing ownership costs of new capital works proposals in budget deliberations. This is achieved by identifying the renewal and capital upgrade/expansion components of all capital works projects, and providing for the ongoing operational and maintenance requirements
• Infrastructure and Assets
• Finance
• Property
• Governance and Risk
• People and Performance Ongoing
• Infrastructure and Assets
• Property
• Finance Ongoing
• Infrastructure and Assets
• Property
• Finance Ongoing
• Infrastructure and Assets
• Property Ongoing
National Framework National Framework Element Core Element Key Strategy Number Task/Action Responsibility Timeframe
94 Back to contents
AM Planning Skills and Processes Y KS-6
Review skills and processes to ensure Asset Management objectives are met
AM Planning Data and Systems Y KS-7
Review the completeness and accuracy of the data for all major infrastructure classes.
AM Planning Data and Systems KS-8 Use a knowledge management strategy to ensure that appropriate and optimal decision support information is available to clearly communicate the cumulative consequences of decisions
AM Planning Data and Systems Y KS-9
Financial Planning Annual Report Y KS-10
Develop a corporate asset register meeting both technical and financial reporting requirements
Develop and adopt an Asset Accounting and Capitalisation Policy that assists in meeting the intention of Fair Value Reporting .AASB116)
• Infrastructure and Assets
• Property
• Finance
• Information Technology Ongoing
• Infrastructure and Assets
• Property
• Information Technology Ongoing
• Infrastructure and Assets
• Finance
• Information Technology Ongoing
• Infrastructure and Assets
• Finance
• Information Technology Ongoing
• Finance June 2023
AM Planning AM Plans Y KS-11
Financial Planning Strategic Longer Term Plan Y KS-12
Continue to develop funding models which address the need for sustainable renewal of infrastructure and which identifies all asset life cycle costs
The 10-year financial sustainability plan for all Council functions will consider both the future anticipated income projections, and the future expenditure requirements to sustain services. This Plan will consider the expenditures identified in the Asset Management Plans and will provide input into the annual Council budget
•
Financial Planning Annual Report Y KS-10
• Finance Ongoing
Develop and adopt an Asset Accounting and Capitalisation Policy that assists in meeting the intention of Fair Value Reporting is this something Finance have or plan to deliver?(AASB116) •
National Framework National Framework Element Core Element Key Strategy Number Task/Action Responsibility Timeframe
Finance Ongoing
Finance
95 Burwood Resourcing Strategy Our Assets
June 2023
AM Planning AM Plans Y KS-11
Financial Planning Strategic Longer Term Plan Y KS-12
Continue to develop funding models which address the need for sustainable renewal of infrastructure and which identifies all asset life cycle costs
The 10-year financial sustainability plan for all Council functions will consider both the future anticipated income projections, and the future expenditure requirements to sustain services. This Plan will consider the expenditures identified in the Asset Management Plans and will provide input into the annual Council budget
• Finance Ongoing
• Finance Ongoing
AM Planning Levels of Service Y KS-13
AM Planning Evaluation Y KS-14
Continue to improve the information on the relationship between the service level and cost so that future community consultation will be well informed of the options and costs
Undertake a detailed assessment of the resources required to implement this Asset Management Improvement Plan so that a program of improvement and milestones can be implemented and monitored
• Infrastructure and Assets
• Property
• Customer Experience and Business Improvement Ongoing
• Infrastructure and Assets
• Property
• Finance Ongoing
National Framework National Framework Element Core Element Key Strategy Number Task/Action Responsibility Timeframe
96 Back to contents
Monitoring and Review Procedures
The AM Plan has a life of 4 years (council election cycle) and is due for complete revision and updating within one year of each Council election.
Ongoing monitoring is required to ensure compliance with the proposed improvement program milestones.
Performance Measures
The effectiveness of this Plan can be measured in the following ways:
• The degree to which the required projected expenditures identified in this Plan are incorporated into the organisation’s LTFP
• The degree to which 1-5 year detailed works programs, budgets, business plans and organisational structures take into account the ‘global’ works program trends provided by the summarised asset management plans,
• The degree to which the existing and projected service levels and service consequences (what we cannot do), risks and residual risks are incorporated into the organisation’s Strategic Plan and associated plans,
• Actual performance relative to the Levels of Service documented in this Plan.
Supporting Asset Management Documents
Links to key asset management supporting documents are provided below.
Asset Management Policy
Asset Management Strategy
Digital Asset Management Plan Dashboard
8. References
ISO, 2014, ISO 55000, Asset management – Overview, principles and terminology, International Organization for Standardization, Geneva.
ISO, 2014, ISO 55001, Asset management – Management systems - Requirements, International Organization for Standardization, Geneva.
ISO, 2014, ISO 55002, Asset management – Management systems – Guidelines for the application of ISO 55001, International Organization for Standardization, Geneva.
IPWEA, 2014, ‘NAMS.PLUS3 Asset Management’, Institute of Public Works Engineering Australia, Sydney, www.ipwea.org/namsplus
IPWEA, 2009, ‘Australian Infrastructure Financial Management Guidelines’, Institute of Public Works Engineering Australia, Sydney, www.ipwea.org/AIFMG.
IPWEA, 2011, ‘International Infrastructure Management Manual’, Institute of Public Works Engineering Australia, Sydney, www.ipwea.org/IIMM
97 Burwood Resourcing Strategy Our Assets
6. Appendices
Appendix A General Fund Asset Class Modelling
Appendix B Technical Levels of Service
Appendix C Glossary

98 Back to contents
Appendix A. Major Asset Class Modelling
Burwood - Transport LTFP Funding Scenario

Transport Assets: ($,000) Roads Including Kerb and Gutter 256,447 Footpaths 87,182 Other Road Assets 15,406 Projected Operating
and Capital Expenditure
99 Burwood Resourcing Strategy Our Assets
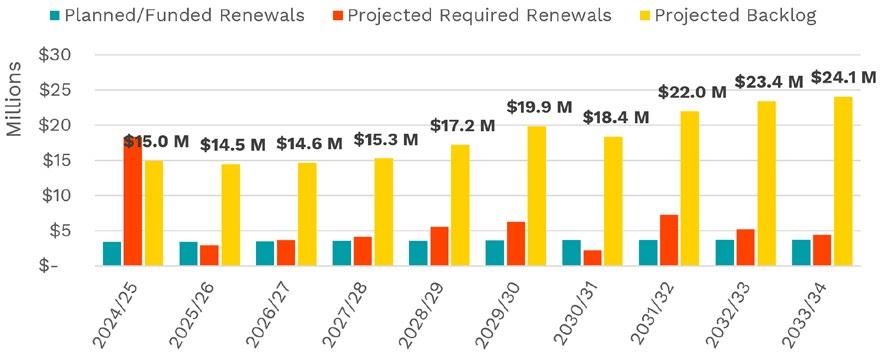
Sustainability of service delivery (Including Backlog) ($,000) Asset Renewal Funding Ratio 10 Year Renewal Projected Expenditure $59,895 10 Year Renewal Planned (Budget) Expenditure $35,800 Asset Renewal Funding Ratio 60% Medium Term (10 yrs) Sustainability 10 year Operations, Maintenance & Renewal Projected Expenditure $94,231 10 year Operations, Maintenance & Renewal Planned (Budget) Expenditures $70,137 10 year Funding Shortfall (10 year projected. expenditures. - planned (budget) expenditures) $24,094 10 year Sustainability Indicator (10 year planned exp. / projected. Expenditure) 74% Short Term (5 years) Sustainability 5 year Operations, Maintenance & Renewal Projected Expenditure $50,703 5 year Operations, Maintenance & Renewal Planned (Budget) Expenditure $33,481
year Funding Shortfall (5 year projected expenditures. - planned (budget) expenditures) $17,222 5 year Sustainability Indicator (5 year planned expenditures. / projected expenditures) 66% Projected and LTFP Budgeted RenewalsTransport LTFP Funding Scenario 100 Back to contents
5

Year Projected Renewals Planned/Funded Renewals Annual Shortfall Projected Backlog 2024/25 $18,369 $3,400 $14,968 $14,968 2025/26 $2,920 $3,434 -$514 $14,454 2026/27 $3,651 $3,469 $183 $14,637 2027/28 $4,142 $3,512 $630 $15,267 2028/29 $5,511 $3,556 $1,955 $17,222 2029/30 $6,233 $3,600 $2,633 $19,855 2030/31 $2,191 $3,645 -$1,454 $18,401 2031/32 $7,286 $3,691 $3,595 $21,996 2032/33 $5,180 $3,746 $1,433 $23,429 2033/34 $4,411 $3,746 $665 $24,094 Projected
Burwood - Projected Operations and Maintenance Expenditure Stormwater Drainage Asset Type: Current Replacement Cost ($,000) Drainage $95,194 101 Burwood Resourcing Strategy Our Assets
Renewal Financing
Operations and Maintenance Expenditure

Sustainability of service delivery (Including Backlog) ($,000) Asset Renewal Funding Ratio 10 Year Renewal Projected Expenditure $7,308 10 Year Renewal Planned (Budget) Expenditure $24,172 Asset Renewal Funding Ratio 331% Medium Term (10 yrs) Sustainability 10 year Operations, Maintenance & Renewal Projected Expenditure $9,101 10 year Operations, Maintenance & Renewal Planned (Budget) Expenditures $25,965 10 year Funding Shortfall (10 year projected. expenditures. - planned (budget) expenditures) -$16,864 10 year Sustainability Indicator (10 year planned exp. / projected. Expenditure) 285% Short Term (5 years) Sustainability 5 year Operations, Maintenance & Renewal Projected Expenditure $8,020 5 year Operations, Maintenance & Renewal Planned (Budget) Expenditure $12,570 5 year Funding Shortfall (5 year projected expenditures. - planned (budget) expenditures) -$4,550 5 year Sustainability Indicator (5 year planned expenditures. / projected expenditures) 157% 102 Back to contents
Projected Operating and Capital Expenditure Burwood - Stormwater LTFP Funding Scenario
Projected and LTFP Budgeted Renewals
Projected and LTFP Budgeted Renewals
Stormwater LTFP Funding Scenario


103 Burwood Resourcing Strategy Our Assets
Sissy by Sid Tapia, Woodstock
Renewal Financing ($,000)
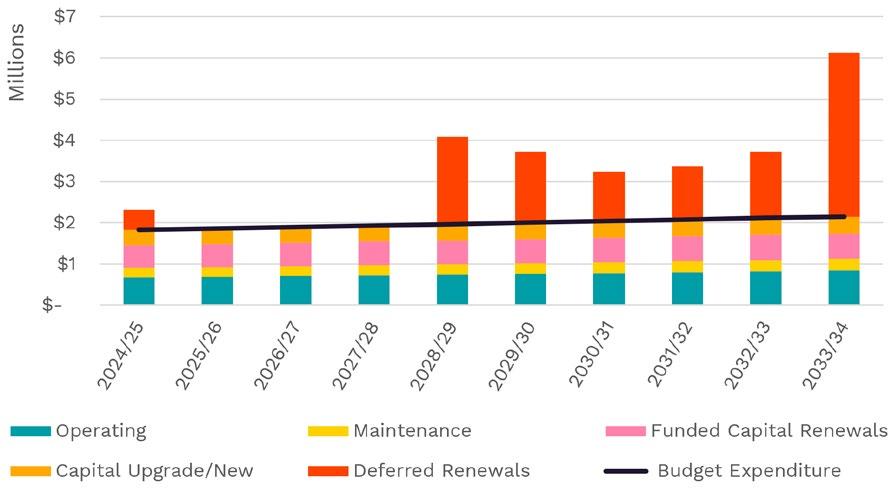
Year Projected Renewals Planned/Funded Renewals Annual Shortfall Projected Backlog 2024/25 $4,571 $2,296 $2,275 $2,275 2025/26 $44 $2,319 -$2,275 -$0 2026/27 $279 $2,342 -$2,063 -$2,063 2027/28 $29 $2,371 -$2,342 -$4,405 2028/29 $2,256 $2,401 -$145 -$4,550 2029/30 $30 $2,431 -$2,401 -$6,951 2030/31 $30 $2,461 -$2,431 -$9,381 2031/32 $31 $2,492 -$2,461 -$11,843 2032/33 $37 $2,529 -$2,492 -$14,335 2033/34 -$0 $2,529 -$2,529 -$16,864 Open Space and Recreation Asset Type: Current Replacement Cost ($,000) Open Space and Recreation Assets $19,332 Projected Operating and Capital Expenditure
104 Back to contents
Burwood – Open Space and Recreation LTFP Funding Scenario

Sustainability of service delivery (Including Backlog) ($,000) Asset Renewal Funding Ratio 10 Year Renewal Projected Expenditure $9,812 10 Year Renewal Planned (Budget) Expenditure $5,834 Asset Renewal Funding Ratio 59% Medium Term (10 yrs) Sustainability 10 year Operations, Maintenance & Renewal Projected Expenditure $19,879 10 year Operations, Maintenance & Renewal Planned (Budget) Expenditures $15,901 10 year Funding Shortfall (10 year projected. expenditures. - planned (budget) expenditures) $3,978 10 year Sustainability Indicator (10 year planned exp. / projected. expenditure) 80% Short Term (5 years) Sustainability 5 year Operations, Maintenance & Renewal Projected Expenditure $9,678 5 year Operations, Maintenance & Renewal Planned (Budget) Expenditure $7,554
year Funding Shortfall (5 year projected expenditures. - planned (budget) expenditures) $2,124
year Sustainability Indicator (5 year planned expenditures. / projected expenditures) 78% Projected & LTFP Budgeted RenewalsOpen Space and Recreation LTFP Funding Scenario 105 Burwood Resourcing Strategy Our Assets
5
5
Burwood – Projected Operations and Maintenance Expenditure

Year Projected Renewals Planned/Funded Renewals Annual Shortfall Projected Backlog 2024/25 $1,033 $554 $478 $478 2025/26 $86 $560 -$473 $5 2026/27 $560 $565 -$5 -$0 2027/28 $572 $572 $0 -$0 2028/29 $2,703 $579 $2,124 $2,124 2029/30 $182 $587 -$404 $1,719 2030/31 $67 $594 -$527 $1,193 2031/32 $702 $601 $100 $1,293 2032/33 $922 $611 $311 $1,604 2033/34 $2,984 $611 $2,374 $3,978
Renewal Financing
106 Back to contents
Appendix B. Technical Levels of Service
Note that the detail required here for Ops and Maintenance costs is not available within the provided LTFP. However, the ratio of Ops/Mtce from last year’s Asset Management Strategy has been applied to the LTFP Mtce funding.
Technical Levels of Service – Transport and Drainage
Budget Area Activities Measure
Operations Number of prompted Inspections
Number of stormwater service requests received
Number of prompted Inspections
Number of requests received
Operational Cost
Maintenance Remove hazards
Roads Defect Completion Rate
Number of defects outstanding
Maintenance Cost
Renewal Renewal of assets
Renewal Cost
Upgrade/New Provide services in a cost-effective manner
Respond to complaints
Defects completed during the year as a percentage of defects identified during the year
Number of defects outstanding
Replacement Cycle
Upgrade/New Cost
Cost, Meet Corporate Strategy
Current LTFP Funded Level of Service Scenario 1
Decreasing trend
Not expected to increase Passive reporting
$1.72M over the next 10 years
Reactive maintenance to limit of budget allocation.
Not increasing
Declining trend
$34.4M over the next 10 years
Further assessment required to inform future revisions of this Asset Management Plan.
$59.97M over the next 10 years
Achieved by a combination of Council and Contract works. The augmentation of Transport Infrastructure systems to meet appropriate service and risk outcomes is not being funded
$6.4M over the next 10 years
107 Burwood Resourcing Strategy Our Assets
Technical Levels of Service – Buildings
Budget Area Activities
Operations Number of prompted Inspections
Percentage of Buildings inspected as per inspection calendar
Number of Building service requests received
Measure Current LTFP Funded Level of Service Scenario 1
Number of prompted Inspections
Percentage of Buildings inspected as per inspection calendar
Number of requests received
Decreasing trend
100%
Expected to remain the same
Operational Cost
Maintenance Remove hazards
Building Defect Completion Rate
Unresolved Building defects
Maintenance Cost
Renewal
Renewal of assets
Respond to complaints
Defects completed during the year as a percentage of defects identified during the year
Number of open Building defects at the end of the year
Replacement cycle
Renewal Cost
$16.2M over the next 10 years
Reactive maintenance to limit of budget allocation
Trend to remain steady
Trend to remain steady
$2.2M over the next 10 years
Building renewals funded in the current LTFP
Projected building renewals to start to increase over the next 10-15 years
$4.7M over the next 10 years
Upgrade/New Provide services in a cost-effective manner Cost, meet corporate strategy Achieved by a combination of Council and Contract works. New or planned building upgrades have been funded in the current LTFP
Upgrade/New Cost
$0M over the next 10 years
108 Back to contents
Technical Levels of Service – Parks
Budget Area Activities Measure
Operations Number of prompted Inspections
Parks and gardens effectiveness and risk management.
Operational Cost
Maintenance
Parks defects identified
Defects outstanding for the reporting period
Number of prompted inspections
Current LTFP Funded Level of Service Scenario 1
Percentage of scheduled playground inspections completed Decreasing trend 100%
$6.9.53M over the next 10 years
Number of requests received
Number of defects outstanding
Maintenance Cost
Renewal
Renewal of assets
Replacement cycle
Renewal Cost
Upgrade/New Provide services in a cost-effective manner
Upgrade/New Cost
Cost, meet corporate strategy
Expected to Decrease
Expected to decrease
$2.3M over the next 10 years
Parks renewals funded in the current LTFP
Projected Parks renewals to remain constant over the next 10 years
$5.8M over the next 10 years
Achieved by a combination of Council and Contract works. New or planned Park Asset upgrades have been funded in the current LTFP
$3.98M over the next 10 years
109 Burwood Resourcing Strategy Our Assets
Appendix C. Glossary
Annual service cost (ASC)
1. Reporting actual cost
The annual (accrual) cost of providing a service including operations, maintenance, depreciation, finance/opportunity and disposal costs less revenue.
2. For investment analysis and budgeting
An estimate of the cost that would be tendered, per annum, if tenders were called for the supply of a service to a performance specification for a fixed term. The Annual Service Cost includes operations, maintenance, depreciation, finance/ opportunity and disposal costs, less revenue.
Asset
A resource controlled by an entity as a result of past events and from which future economic benefits are expected to flow to the entity. Infrastructure assets are a sub-class of property, plant and equipment which are non-current assets with a life greater than 12 months and enable services to be provided.
Asset category
Sub-group of assets within a class hierarchy for financial reporting and management purposes.
Asset class
A group of assets having a similar nature or function in the operations of an entity, and which, for purposes of disclosure, is shown as a single item without supplementary disclosure.
Asset condition assessment
The process of continuous or periodic inspection, assessment, measurement and interpretation of the resultant data to indicate the condition of a specific asset so as to determine the need for some preventative or remedial action.
Asset hierarchy
A framework for segmenting an asset base into appropriate classifications. The asset hierarchy can be based on asset function or asset type or a combination of the two.
Asset management (AM)
The combination of management, financial, economic, engineering and other practices applied to physical assets with the objective of providing the required level of service in the most cost effective manner.
Asset renewal funding ratio
The ratio of the net present value of asset renewal funding accommodated over a 10 year period in a LTFP relative to the net present value of projected capital renewal expenditures identified in an asset management plan for the same period [AIFMG Financial Sustainability Indicator No 8].
Average annual asset consumption (AAAC)*
The amount of an organisation’s asset base consumed during a reporting period (generally a year). This may be calculated by dividing the depreciable amount by the useful life (or total future economic benefits/service potential) and totalled for each and every asset OR by dividing the carrying amount (depreciated replacement cost) by the remaining useful life (or remaining future economic benefits/service potential) and totalled for each and every asset in an asset category or class.
Borrowings
A borrowing or loan is a contractual obligation of the borrowing entity to deliver cash or another financial asset to the lending entity over a specified period of time or at a specified point in time, to cover both the initial capital provided and the cost of the interest incurred for providing this capital. A borrowing or loan provides the means for the borrowing entity to finance outlays (typically physical assets) when it has insufficient funds of its own to do so, and for the lending entity to make a financial return, normally in the form of interest revenue, on the funding provided.
Capital expenditure
Relatively large (material) expenditure, which has benefits, expected to last for more than 12 months. Capital expenditure includes renewal, expansion and upgrade. Where capital projects involve a combination of renewal, expansion and/or upgrade expenditures, the total project cost needs to be allocated accordingly.
110 Back to contents
Capital expenditure - expansion
Expenditure that extends the capacity of an existing asset to provide benefits, at the same standard as is currently enjoyed by existing beneficiaries, to a new group of users. It is discretionary expenditure, which increases future operations and maintenance costs, because it increases the organisation’s asset base, but may be associated with additional revenue from the new user group, eg. extending a drainage or road network, the provision of an oval or park in a new suburb for new residents.
Capital expenditure - new
Expenditure which creates a new asset providing a new service/output that did not exist beforehand. As it increases service potential it may impact revenue and will increase future operations and maintenance expenditure.
Capital expenditure - renewal
Expenditure on an existing asset or on replacing an existing asset, which returns the service capability of the asset up to that which it had originally. It is periodically required expenditure, relatively large (material) in value compared with the value of the components or subcomponents of the asset being renewed. As it reinstates existing service potential, it generally has no impact on revenue, but may reduce future operations and maintenance expenditure if completed at the optimum time, eg. resurfacing or re-sheeting a material part of a road network, replacing a material section of a drainage network with pipes of the same capacity, resurfacing an oval.
Capital expenditure - upgrade
Expenditure, which enhances an existing asset to provide a higher level of service or expenditure that will increase the life of the asset beyond that which it had originally. Upgrade expenditure is discretionary and often does not result in additional revenue unless direct user charges apply. It will increase operations and maintenance expenditure in the future because of the increase in the organisation’s asset base, eg. widening the sealed area of an existing road, replacing drainage pipes with pipes of a greater capacity, enlarging a grandstand at a sporting facility.
Capital funding
Funding to pay for capital expenditure.
Capital grants
Monies received generally tied to the specific projects for which they are granted, which are often upgrade and/or expansion or new investment proposals.
Capital investment expenditure
See capital expenditure definition.
Capitalisation threshold
The value of expenditure on non-current assets above which the expenditure is recognised as capital expenditure and below which the expenditure is charged as an expense in the year of acquisition.
Carrying amount
The amount at which an asset is recognised after deducting any accumulated depreciation / amortisation and accumulated impairment losses thereon.
Class of assets
See asset class definition
Component
Specific parts of an asset having independent physical or functional identity and having specific attributes such as different life expectancy, maintenance regimes, risk or criticality.
Core asset management
Asset management which relies primarily on the use of an asset register, maintenance management systems, job resource management, inventory control, condition assessment, simple risk assessment and defined levels of service, in order to establish alternative treatment options and long-term cashflow predictions. Priorities are usually established on the basis of financial return gained by carrying out the work (rather than detailed risk analysis and optimised decision- making).
Cost of an asset
The amount of cash or cash equivalents paid or the fair value of the consideration given to acquire an asset at the time of its acquisition or construction, including any costs necessary to
111 Burwood Resourcing Strategy Our Assets
place the asset into service. This includes oneoff design and project management costs.
Critical assets
Assets for which the financial, business or service level consequences of failure are sufficiently severe to justify proactive inspection and rehabilitation. Critical assets have a lower threshold for action than noncritical assets.
Current replacement cost (CRC)
The cost the entity would incur to acquire the asset on the reporting date. The cost is measured by reference to the lowest cost at which the gross future economic benefits could be obtained in the normal course of business or the minimum it would cost, to replace the existing asset with a technologically modern equivalent new asset (not a second hand one) with the same economic benefits (gross service potential) allowing for any differences in the quantity and quality of output and in operating costs.
Deferred maintenance
The shortfall in rehabilitation work undertaken relative to that required to maintain the service potential of an asset.
Depreciable amount
The cost of an asset, or other amount substituted for its cost, less its residual value.
Depreciated replacement cost (DRC)
The current replacement cost (CRC) of an asset less, where applicable, accumulated depreciation calculated on the basis of such cost to reflect the already consumed or expired future economic benefits of the asset.
Depreciation / amortisation
The systematic allocation of the depreciable amount (service potential) of an asset over its useful life.
Economic life
See useful life definition.
Expenditure
The spending of money on goods and services. Expenditure includes recurrent and capital outlays.
Fair value
The amount for which an asset could be exchanged, or a liability settled, between knowledgeable, willing parties, in an arms length transaction.
Financing gap
A financing gap exists whenever an entity has insufficient capacity to finance asset renewal and other expenditure necessary to be able to appropriately maintain the range and level of services its existing asset stock was originally designed and intended to deliver. The service capability of the existing asset stock should be determined assuming no additional operating revenue, productivity improvements, or net financial liabilities above levels currently planned or projected. A current financing gap means service levels have already or are currently falling. A projected financing gap if not addressed will result in a future diminution of existing service levels.
Heritage asset
An asset with historic, artistic, scientific, technological, geographical or environmental qualities that is held and maintained principally for its contribution to knowledge and culture and this purpose is central to the objectives of the entity holding it.
Impairment Loss
The amount by which the carrying amount of an asset exceeds its recoverable amount.
Infrastructure assets
Physical assets that contribute to meeting the needs of organisations or the need for access to major economic and social facilities and services, eg. roads, drainage, footpaths and cycleways. These are typically large, interconnected networks or portfolios of composite assets. The components of these assets may be separately maintained, renewed or replaced individually so that the required level and standard of service from the network of assets is continuously sustained. Generally the components and hence the assets have long lives. They are fixed in place and are often have no separate market value.
112 Back to contents
Investment property
Property held to earn rentals or for capital appreciation or both, rather than for:
a) use in the production or supply of goods or services or for administrative purposes; or
b) sale in the ordinary course of business.
Key performance indicator
A qualitative or quantitative measure of a service or activity used to compare actual performance against a standard or other target. Performance indicators commonly relate to statutory limits, safety, responsiveness, cost, comfort, asset performance, reliability, efficiency, environmental protection and customer satisfaction.
Level of service
The defined service quality for a particular service/activity against which service performance may be measured. Service levels usually relate to quality, quantity, reliability, responsiveness, environmental impact, acceptability and cost.
Lifecycle Cost *
1. Total LCC The total cost of an asset throughout its life including planning, design, construction, acquisition, operation, maintenance, rehabilitation and disposal costs.
2. Average LCC The life cycle cost (LCC) is average cost to provide the service over the longest asset life cycle. It comprises average operations, maintenance expenditure plus asset consumption expense, represented by depreciation expense projected over 10 years. The Life Cycle Cost does not indicate the funds required to provide the service in a particular year.
Lifecycle Expenditure
The Life Cycle Expenditure (LCE) is the average operations, maintenance and capital renewal expenditure accommodated in the LTFP over 10 years. Life Cycle Expenditure may be compared to average Life Cycle Cost to give an initial indicator of affordability of projected service levels when considered with asset age profiles.
Loans / borrowings
See borrowings.
Maintenance
All actions necessary for retaining an asset as near as practicable to an appropriate service condition, including regular ongoing day-to-day work necessary to keep assets operating, eg road patching but excluding rehabilitation or renewal. It is operating expenditure required to ensure that the asset reaches its expected useful life.
• Planned maintenance
Repair work that is identified and managed through a maintenance management system (MMS). MMS activities include inspection, assessing the condition against failure/ breakdown criteria/experience, prioritising scheduling, actioning the work and reporting what was done to develop a maintenance history and improve maintenance and service delivery performance.
• Reactive maintenance
Unplanned repair work that is carried out in response to service requests and management/ supervisory directions.
• Specific maintenance
Maintenance work to repair components or replace sub-components that needs to be identified as a specific maintenance item in the maintenance budget.
• Unplanned maintenance
Corrective work required in the short-term to restore an asset to working condition so it can continue to deliver the required service or to maintain its level of security and integrity.
Maintenance expenditure *
Recurrent expenditure, which is periodically or regularly required as part of the anticipated schedule of works required to ensure that the asset achieves its useful life and provides the required level of service. It is expenditure, which was anticipated in determining the asset’s useful life.
113 Burwood Resourcing Strategy Our Assets
Materiality
The notion of materiality guides the margin of error acceptable, the degree of precision required and the extent of the disclosure required when preparing general purpose financial reports. Information is material if its omission, misstatement or non-disclosure has the potential, individually or collectively, to influence the economic decisions of users taken on the basis of the financial report or affect the discharge of accountability by the management or governing body of the entity.
Modern equivalent asset
Assets that replicate what is in existence with the most cost-effective asset performing the same level of service. It is the most cost efficient, currently available asset which will provide the same stream of services as the existing asset is capable of producing. It allows for technology changes and, improvements and efficiencies in production and installation techniques
Net present value (NPV)
The value to the organisation of the cash flows associated with an asset, liability, activity or event calculated using a discount rate to reflect the time value of money. It is the net amount of discounted total cash inflows after deducting the value of the discounted total cash outflows arising from eg the continued use and subsequent disposal of the asset after deducting the value of the discounted total cash outflows.
Non-revenue generating investments
Investments for the provision of goods and services to sustain or improve services to the community that are not expected to generate any savings or revenue to the Council, eg. parks and playgrounds, footpaths, roads and bridges, libraries, etc.
Operations
Regular activities to provide services such as public health, safety and amenity, eg street sweeping, grass mowing and street lighting.
Operating expenditure
Recurrent expenditure, which is continuously required to provide a service. In common use the term typically includes, eg power, fuel,
staff, plant equipment, on-costs and overheads but excludes maintenance and depreciation. Maintenance and depreciation is on the other hand included in operating expenses.
Operating expense
The gross outflow of economic benefits, being cash and non-cash items, during the period arising in the course of ordinary activities of an entity when those outflows result in decreases in equity, other than decreases relating to distributions to equity participants.
Operating expenses
Recurrent expenses continuously required to provide a service, including power, fuel, staff, plant equipment, maintenance, depreciation, on-costs and overheads.
Operations, maintenance and renewal financing ratio
Ratio of estimated budget to projected expenditure for operations, maintenance and renewal of assets over a defined time (eg 5, 10 and 15 years).
Operations, maintenance and renewal gap
Difference between budgeted expenditures in a LTFP (or estimated future budgets in absence of a LTFP) and projected expenditures for operations, maintenance and renewal of assets to achieve/ maintain specified service levels, totalled over a defined time (e.g. 5, 10 and 15 years).
Pavement management system (PMS)
A systematic process for measuring and predicting the condition of Transports and wearing surfaces over time and recommending corrective actions.
PMS Score
A measure of condition of a road segment determined from a Pavement Management System.
Rate of annual asset consumption *
The ratio of annual asset consumption relative to the depreciable amount of the assets. It measures the amount of the consumable parts of assets that are consumed in a period (depreciation) expressed as a percentage of the depreciable amount.
114 Back to contents
Rate of annual asset renewal *
The ratio of asset renewal and replacement expenditure relative to depreciable amount for a period. It measures whether assets are being replaced at the rate they are wearing out with capital renewal expenditure expressed as a percentage of depreciable amount (capital renewal expenditure/DA).
Rate of annual asset upgrade/new *
A measure of the rate at which assets are being upgraded and expanded per annum with capital upgrade/new expenditure expressed as a percentage of depreciable amount (capital upgrade/expansion expenditure/DA).
Recoverable amount
The higher of an asset’s fair value, less costs to sell and its value in use.
Recurrent expenditure
Relatively small (immaterial) expenditure or that which has benefits expected to last less than 12 months. Recurrent expenditure includes operations and maintenance expenditure.
Recurrent funding
Funding to pay for recurrent expenditure.
Rehabilitation
See capital renewal expenditure definition above.
Remaining useful life
The time remaining until an asset ceases to provide the required service level or economic usefulness. Age plus remaining useful life is useful life.
Renewal
See capital renewal expenditure definition above.
Residual value
The estimated amount that an entity would currently obtain from disposal of the asset, after deducting the estimated costs of disposal, if the asset were already of the age and in the condition expected at the end of its useful life.
Revenue generating investments
Investments for the provision of goods and services to sustain or improve services to the community that are expected to generate some savings or revenue to offset operating costs,
eg public halls and theatres, childcare centres, sporting and recreation facilities, tourist information centres, etc.
Risk management
The application of a formal process to the range of possible values relating to key factors associated with a risk in order to determine the resultant ranges of outcomes and their probability of occurrence.
Section or segment
A self-contained part or piece of an infrastructure asset.
Service potential
The total future service capacity of an asset. It is normally determined by reference to the operating capacity and economic life of an asset.
A measure of service potential is used in the notfor-profit sector/public sector to value assets, particularly those not producing a cash flow.
Service potential remaining
A measure of the future economic benefits remaining in assets. It may be expressed in dollar values (Fair Value) or as a percentage of total anticipated future economic benefits. It is also a measure of the percentage of the asset’s potential to provide services that is still available for use in providing services (Depreciated Replacement Cost/Depreciable Amount).
Specific Maintenance
Replacement of higher value components/subcomponents of assets that is undertaken on a regular cycle including repainting, replacement of air conditioning equipment, etc. This work generally falls below the capital/ maintenance threshold and needs to be identified in a specific maintenance budget allocation.
Strategic Longer-Term Plan
A plan covering the term of office of councillors (4 years minimum) reflecting the needs of the community for the foreseeable future. It brings together the detailed requirements in the Council’s longer-term plans such as the asset management plan and the long-term financial plan. The plan is prepared in consultation with the community and details where the Council is at that point in time, where it wants to go,
115 Burwood Resourcing Strategy Our Assets
how it is going to get there, mechanisms for monitoring the achievement of the outcomes and how the plan will be resourced.
Sub-component
Smaller individual parts that make up a component part.
Useful life
Either:
a) the period over which an asset is expected to be available for use by an entity, or
b) the number of production or similar units expected to be obtained from the asset by the entity.
It is estimated or expected time between placing the asset into service and removing it from service, or the estimated period of time over which the future economic benefits embodied in a depreciable asset, are expected to be consumed by the Council.
Source: IPWEA, 2009, Glossary Additional and modified glossary items shown *
Value in Use
The present value of future cash flows expected to be derived from an asset or cash generating unit. It is deemed to be depreciated replacement cost (DRC) for those assets whose future economic benefits are not primarily dependent on the asset’s ability to generate net cash inflows, where the entity would, if deprived of the asset, replace its remaining future economic benefits.

116 Back to contents
Our People

117 Burwood Resourcing Strategy Our People
Workforce Management Plan 2022 to 2026

Quick links
Scope and Purpose 119 Our Workforce 120 Factors informing Burwood’s Workforce Management Plan 121 Other Key Factors Considered 122 Strategic Pillars of our Workforce Plan 2022 to 2026 123 Our Action Plan 124 Monitoring and Reporting 130 118 Back to contents
Scope and Purpose
The Burwood Local Government Area (LGA) is in a unique and exciting position. Identified as a strategic hub by the State Government, with the population anticipated to nearly double to 73,500 by 2036, major infrastructure and liveability projects are set to be delivered for our community.
It is for these reasons, that Council needs to ensure that we have the workforce resourcing and capabilities available to deliver high quality services and infrastructure for our growing and evolving community.
The Workforce Management Plan includes information on Council’s current workforce as well as identifying future requirements based on the commitments in the Community Strategic Plan and Delivery Program. The four Strategic Pillars of this Plan are underpinned by our internal Performance Pyramid, which drives our annual performance review and development process, and are designed to ensure an agile organisation that can respond effectively and efficiently to the needs of our community. The key actions developed will enable Council to deliver a workforce that is innovative, engaged and driven by performance.
In partnership with Council’s Long Term Financial Plan, Digital Strategy and Asset Management Strategy and Plan, the Workforce Management Plan is about ensuring that there are sufficient people resources available in the right place, at the right time, with the right skills and capabilities to deliver on the community’s vision and aspirations for the Burwood community (Burwood2036). The Workforce Management Plan helps Council plan its workforce requirements for the next four years and beyond, and plan what needs to occur to ensure the necessary people are in place when they are needed. The right workforce is a critical element to delivering on the commitments made in Council’s Delivery Program 2022-2026 and each of our plans and strategies.

119 Burwood Resourcing Strategy Our People
Our Workforce
216 total staff
49% male and 51% female
64% employed full time, 11% part time and 25% casually
66% have worked with Council for 5 years or less
10% inside LGA
90% outside LGA
Staff median age = 40 years
Executive Team of 6
33% female, 67% male
58 people managers
62% males and 38% females
80% of staff deliver direct services to the community and 20% work in administration and support
Languages spoken by our staff:
Arabic, Chinese, Cantonese, Chaozhou, Croatian, English, Hindi, Italian, Mandarin, Malayalam, Marathi, Nepalese, Russian, Samoan, Tamil and Ukrainian

120 Back to contents
Leading Organisational Transformation
Our staff are critical to our success in delivering customer centred, responsive and future proof services to our community, customers and visitors to the Burwood LGA. Getting the right mix of talent at the right time with the right skills and capabilities will continue to be a focus for Council over the next four years and beyond.
With this in mind, in 2020 Council refreshed its Executive Team, and during 2021, undertook a review of its organisational structure – the first major review in 15 years. The review considered the functions, skills, leadership and culture required to enable Council to deliver the right mix of services to our community and customers in the years ahead. As a result, 23% of all positions in Council were changed and advertised early in 2022 with existing and new staff being appointed via an externally advertised merit-based recruitment process. Our new leadership team will continue to work collaboratively to lead further service reviews, modernisation and improvement of service delivery and prepare our organisation for the challenges ahead.
Factors informing Burwood’s Workforce Management Plan
Councils today face an important opportunity to revolutionise how we function and how we meet the ever-evolving needs and expectations of our customers in the digital era – the residents, businesses, partners, leaders and stakeholders across our diverse city and community that we serve.
New workforce models and innovative approaches driven by the pandemic response are expected to gain momentum, allowing our employees to flexibly shift their focus to work that is innovative, value-based and customercentred. Acquiring critical new skills for the digital era is paramount; leadership styles need to evolve as we move towards outcomefocused workplace cultures.
Burwood Council’s Workforce Management Plan has been developed with the future of work and our customers’ needs at the forefront and is focused on continuing to transform the organisation through innovation, enhanced customer experience and a high performance culture.
For these reasons, the following key factors are informing our Workforce Management Plan.
Putting the customer first through back office transformation
A well-designed back office can help drive customer centricity, reduce costs and employee manual effort, improve the ability to perform more value-adding activities and analysis, and improve the employee value proposition by enabling them to do more meaningful work. It can also increase the capacity of our staff to invest in more meaningful initiatives and reinvest back into the community, ultimately driving progress that will make a difference. Learning, skills and career pathways will become business critical (KPMG, 2021).
Hybrid work is an expectation: ‘In the office’ takes on new meaning
One result of the pandemic is that hybrid working has become the norm and employees expect to be trusted to work for a proportion of their time at home or remotely, if the work permits. They expect functioning IT systems, access to information and collaboration tools, and online resources that enable working easily from home or anywhere, at any time.
The focus on the employee experience has become mainstream
The return phase of the COVID-19 crisis presents a requirement for companies to rethink the employee experience in ways that respect individual differences – home lives, skills and capabilities, mindsets, personal characteristics, and other factors – while also adapting to rapidly changing circumstances. PwC, 2022.
121 Burwood Resourcing Strategy Our People

Other Key Factors Considered
1. The need to build on the organisational restructure and review, modernise and improve efficiencies and delivery of value to the community in a revenue-constrained environment with increasing community expectations.
2. Changing community and workforce (expectations accelerated by the pandemic) for online service delivery accelerating pressures for transformation and modernisation of Local Government systems and a shift in skills.
3. Pandemic impacts and constraints on revenue sources and pressures for cost containment are creating a need for innovative, ethical and commercially focused generation of new income streams for Council whilst managing governance issues.
4. Opportunities to deliver large scale and complex capital works projects such as the nearly $100M Western Sydney Infrastructure Grants Program are creating pressures on resourcing to win funds, deliver community projects and then operate new facilities and services within funding constraints.
5. Workforce trends are creating a competitive labour environment in which workplace culture, staff engagement, salaries, people leadership capability and development opportunities are key drivers of being able to attract, grow and retain the skills needed for service delivery.
122 Back to contents
Strategic Pillars of our Workforce Plan 2022 to 2026
With the future of work in mind and our customers’ needs at the centre of everything we do, Council has developed four strategic pillars of our Workforce Management Plan 2022 to 2026 that are underpinned by our Performance Pyramid:
The four strategic pillars of our Workforce Plan 2022 to 2026 are:
1. Our workforce is agile and responsive (Innovation)
We actively think of new and improved ways of working and champion change that adds value to the community. We utilise smart technology and improved systems of work that allow us to more effectively and efficiently understand and respond to our customers’ needs.
2. Our workforce is customer-centred (Customer experience)
The community is at the centre of everything we do and our staff feel connected to our purpose. We continuously look for ways to enhance our customer experience and internal service delivery.
3. Our leaders are building a culture of performance excellence and engagement (Performance and ethical leadership)
Our leaders work collaboratively across the organisation to embed performance excellence and enable our staff to deliver upon the expectations of their role. Our leaders inspire a culture of engagement and empower our staff to add value to our community.
4. Our workforce is safe, healthy and well (Performance and ethical leadership)
The safety, health and wellbeing of our staff is the foundation for every activity we undertake. We ensure our staff have safe systems of work and provide opportunities that enhance their health and wellbeing.
Innovation Ethical Leadership Performance Customer Experience
123 Burwood Resourcing Strategy Our People
Image: Council’s internal Performance Pyramid
Our Action Plan
Council is currently going through a time of major transformation in the way we work in order to deliver an agile, responsive and customer centred organisation that will support the growth and change of the wider community. The focus of our four-year Workforce Management Plan is on building leadership capability and team work, modernising systems and processes and driving a culture
of performance excellence and engagement, partnering with staff to continuously improve the way we deliver services and outcomes for our community. This is supported by ensuring that our staff are safe, healthy and well.
Outlined below are the goals we aim to achieve and the actions we will take to meet these goals over the next four years under each Strategic Pillar of our Workforce Management Plan 2022 to 2026.
Strategic Pillar 1: Our workforce is agile and responsive (Innovation)
Transform and modernise systems and service delivery models
Our working arrangements deliver upon community expectations
Expand smart/ mobile technology designed to enhance workflows and improve responsiveness and service delivery
Implement an online system to modernise our time and attendance and leave management processes
Undertake service reviews of core Council functions to deliver improved services and efficiencies
Review Council’s flexible working arrangements to ensure they are effective
Effective workforce plans at the divisional and project level have been developed in order to allow Council to scale our workforce up and down based on requirements (i.e. WestInvest funding)
City Assets/ Information Technology
People and Performance/ Information Technology
Customer Experience and Business Improvement
People and Performance
All
Goals Key actions Responsible 202223 202324 202425 202526
124 Back to contents

Strategic Pillar 2: Our workforce is customer-centred (Customer experience)
Staff have the skills and capabilities to deliver quality outcomes for our community
We are planning for our current and future workforce
Develop and implement a regulatory compliance training framework
Identify and implement an online Learning Management System to support our training programs
Introduce formal training programs that will enable our staff to deliver on the outcomes required in our Delivery Program and Operational Plan
Develop and implement a talent management framework and succession plans for critical roles and key services
People and Performance
People and Performance
People and Performance
People and Performance
Goals Key actions Responsible 2022-23 2023-24 2024-25 2025-26
125 Burwood Resourcing Strategy Our People
Our workforce reflects our community
Develop and implement organisational crossskilling and up-skilling program
Implement a formal apprentice/trainee program
Implement a formal work experience and work placement program
Develop and implement a project management framework that considers current and future workforce resourcing requirements
Deliver disability awareness training for all Council staff, Councillors and volunteers, including face-to-face and online learning
In collaboration with disability employment services, investigate opportunities to increase access to employment opportunities at Council for people with disability
Provide people with a disability with work experience through volunteering, apprenticeship, or internship opportunities across different Council services, programs and events
Deliver training that aligns with the Multicultural Strategy
Deliver First Nations Cultural Awareness training for all staff and Councillors
People and Performance
People and Performance
People and Performance
People and Performance
People and Performance/ Community Life
People and Performance
People and Performance
People and Performance/ Community Life
People and Performance/ Community Life
Goals
Responsible 2022-23 2023-24 2024-25 2025-26
Key actions
126 Back to contents
Our staff understand the needs of our customers and we champion change that adds value to our community
Review and update our Equal Employment Opportunity (EEO) Policy and Management Plan
Roll-out EEO training for all staff
Introduce information for staff on the Community Strategic Plan, Delivery Program and Operational Plan as part of Council’s induction program
Deliver call centre sessions for new starters
Community and customer feedback is provided to our workforce in a timely manner in order to respond effectively and efficiently
Deliver training to assigned Responsible Officers to ensure meaningful information is provided to the community in line with our Performance Reporting requirements
People and Performance
People and Performance
People and Performance
Customer Service and Business Improvement
All
People and Performance
Goals Key
Responsible 2022-23 2023-24 2024-25 2025-26
actions
127 Burwood Resourcing Strategy Our People
Strategic Pillar 3: Our leaders are building a culture of performance excellence and engagement
(Performance and ethical leadership)
Our leaders are supported to deliver upon the expectations of their role
We ensure our staff feel heard and valued for their contribution
Develop and deliver a comprehensive and rolling leadership development program designed to enhance leadership capability and drive performance
Implement an online performance review and development tool to enhance the quality of our performance review and development process
Improve corporate reporting to empower our leaders to drive and continuously improve organisational performance
Develop and implement a reward and recognition program
People and Performance
People and Performance
Our leaders are fiscally responsible; demonstrate good governance and have a commercial mindset
Roll-out and action feedback from a bi-annual staff organisational culture survey
Review and refresh our workplace values
Deliver training for leaders in financial management including developing and managing budgets
Deliver relevant governance training to promote transparency and accountability
New income streams identified and new partnerships established to improve value for the community
People and Performance
People and Performance
People and Performance
Finance/ People and Performance
Governance and Risk/People and Performance
Goals Key actions Responsible 2022-23 2023-24 2024-25 2025-26
All
All
All
128 Back to contents
Directorates Our financial position is sustainable
Directorates
Strategic Pillar 4: Our workforce is safe, healthy and well (Performance
and ethical leadership)
Goals Key actions
Improve reporting and visibility of safety, health and wellbeing in our workplace
We support our staff by providing safe systems of work and promote health and wellbeing at work
Implement an online Work Health and Safety system to enhance reporting and improve our safety culture
Develop and implement a formal framework for the delivery of safety related training
Conduct annual audits of our WHS Management System to ensure best practice
Develop and implement a fouryear Health and Wellbeing Strategy that addresses physical, mental, general and financial health and wellbeing
All staff understand and demonstrate a commitment to the principles of a safe workplace
Deliver Work Health and Safety Responsibilities and Risk Management training for Managers and Supervisors training
Deliver Code of Conduct training for all staff
Deliver Bullying and Harassment training for all staff
Deliver customised manual handling training to all staff
People and Performance
People and Performance
People and Performance
People and Performance/ WHS Committee
People and Performance
Governance and Risk/ People and Performance
People and Performance
People and Performance
Responsible 2022-23 2023-24 2024-25 2025-26
129 Burwood Resourcing Strategy Our People
Monitoring and Reporting
The Workforce Management Plan ensures the community and our staff that we are effectively managing our current and future workforce to deliver our collective vision for Burwood as outlined in Burwood2036, our Delivery Program and Operational Plan.
Four key pillars have been identified that align with our internal Performance Pyramid and overarching goals with key actions designed to meet these goals have been identified. The actions are designed to deliver on the strategic pillars of the Workforce Management Plan creating a workforce that is committed and able to provide high quality services for our community.
The progress on our actions will be reported through our six-monthly Operational Plan reporting process as we continue on the journey of building a workforce that is agile and responsive, customer-centred and safe, healthy and well while delivering on our commitment of demonstrating ethical leadership, accountability and transparency.
Our success will also be reported through our Annual Report and State of the City Report at the end of the elected Council’s term.
References
The Future of Local Government report – KPMG
PWC Future of work what-workers-want-report - PwC
WT-21_12-HR-Predictions-for-2022-Report
- The Josh Bersin Company

130 Back to contents
Our Digital Infrastructure

131 Burwood Resourcing Strategy Our Digital Infrastructure

Digital Strategy 2022 to 2026
Quick links Scope and Purpose 133 Context 134 Guiding Principles 135 Gap Analysis 136 Strategic Response 137 Our Action Plan 139 Monitoring and Reporting 143 References 143
132 Back to contents
Scope and Purpose
Council has identified the strategically important role that technology and digital innovation needs to play in order to meet present and future community expectations. This Digital Strategy has been developed alongside the suite of other documents, plans and strategies that form part of Council’s Integrated Planning and Reporting framework and outlines key themes and areas of technology focus that have been integrated in Council’s Delivery Program 2022-2026.
The three guiding principles detailed within the document define the qualities that Council will seek from all digital implementations, whilst the four priority areas outline the high level activities that Council will focus on during the 2022-2026 period to improve the effectiveness of Council’s service delivery and community outreach programs.
Introduction
Technology driven change and digital innovation have transformed our lives in unprecedented ways. Organisations, including councils, need to embrace digital technologies to be able to continue to deliver the services that our customers expect both now and in the future.
Council’s vision is to adopt emerging smart technologies, systems and business processes and to harness their potential in redesigning and streamlining the many services we deliver.
This document outlines the guiding principles that inform how Council will select appropriate technologies and the priority areas that it will focus on over the next four years to increase organisational agility, embrace a customercentric approach and streamline processes to provide simple, modern, efficient and effective services to the community.

133 Burwood Resourcing Strategy Our Digital Infrastructure
Context
Our Community
The Burwood community is young, vibrant and growing, with expectations for 24x7 access to modern and effective services. Council will need to continue to expand and transform our service delivery portfolio to deliver agile, scalable, relevant and responsive services as expectations continue to evolve. Solutions that enable the delivery of such services necessitate the deployment of digital tools and information management practices that allow our staff to efficiently and effectively redesign Council’s business processes and introduce novel approaches to service delivery.
Our Council
Council is undergoing significant transformation designed to deliver an agile, responsive and customer-focused organisation able to serve and support our growing and changing community. With a commitment to continue the development of new organisational capabilities and service offerings, Council’s digital implementations will support our staff and foster agile, dynamic and responsive teams by empowering them to tailor and modernise business practices to community needs and expectations.
Our Technology
The technological landscape is continuing to change and develop rapidly. Council’s reliance on technology for the delivery of its services requires highly available Information Technology (IT) systems and a broad skillset to support their successful operation and administration. cyber security threats that place business continuity and information security at risk are also growing and require adequate management and mitigation.
The actions implemented as part of the previous IT Strategy 2019-2022 have laid strong foundations by building a robust IT infrastructure capable of scaling and thus supporting future growth. Council has already completed the migration of its IT infrastructure to the cloud and implemented many Softwareas-a-Service (SaaS) solutions to ensure that IT systems are highly available and secure. Council’s IT team, whilst small, is diverse in composition and is equipped with a broad skillset. The recently implemented forwardlooking structure will facilitate the management of our IT infrastructure and provide support to Council staff to ensure that value is derived from the use of digital solutions, all the while delivering a large portfolio of digital transformation projects that introduce new business capabilities and innovative approaches to Council’s service delivery.
134 Back to contents
Guiding
Principles
Council will invest in digital platforms aligned with the following three Guiding Principles, which have been specifically selected to describe the essential characteristics required to achieve organisational objectives.
Guiding Principle 2: Simple
Council will adopt platforms that integrate with existing solutions and are simple for our staff, partners and community to use and interact with. These solutions will require less effort to implement and operate by featuring easy to use interfaces.
Examples of simple solutions are:
• Use of single sign-on mechanisms to reduce barriers to access to information
Guiding Principle 1: Smart
With the rapid rise in innovative digital platforms available in the marketplace, the selection of the most appropriate solution can often be a very difficult task. Council will evaluate platforms that are fit for purpose and that can demonstrate alignment with Council’s overall direction. Case studies and previous implementations will be explored and assessed, and if possible the solutions will be thoroughly tested prior to purchase. Council will adopt solutions in all potential areas including SmartCities solutions that assist us in increasing the efficiency of service delivery to our Community.
Examples of smart solutions are:
• Implementation of platforms that are device and software system agnostic are accessible to all and facilitate mobile workforce implementations
• Systems that automate previously manual tasks or digitise traditional business processes
• Systems and devices that create operational efficiencies and/or allow Council to improve service delivery and access to information, such as platforms that easily integrate with one another to streamline business processes.
• Platforms that provide intuitive interfaces, that people are already accustomed to for other purposes or in other facets of life
• Intuitive collaboration and communication systems able to facilitate interactions within and outside of the organisation.
Guiding Principle 3: Secure
Data security is a critical aspect of today’s digital world. The availability, confidentiality and integrity of systems and information is paramount to the delivery of the vast majority of Council Services. Council will adopt cyber security best practices to ensure that the safety of its data is in line with the NSW Government’s Cyber Security Policy. Council will further improve its disaster recovery and business continuity processes to ensure prompt resumption of services in the case of a disaster or the prompt and effective response to a cyber security incident.
Examples of security solutions are:
• Regular reviews and assessments of IT infrastructure and platforms used
• Implement solutions that are able to strengthen and mitigate cyber security risks
• Include cyber security evaluations for new system implementations.
Smart Simple Secure 135 Burwood Resourcing Strategy Our Digital Infrastructure
Gap Analysis
Council has conducted a full review of its systems and digital practices and identified the following gaps that this Strategy will aim to address:
• Information systems used in the delivery of Council services have limited integration
• Council’s field based workers have limited access to systems and information
• Council’s systems supporting engagement and communication with customers could be expanded and simplified to meet new emerging customer expectations
• Some systems provide limited functionality, restricting Council’s service offering
• Many automation opportunities exist that could result in improved efficiencies, reduced manual errors and improved customer experience outcomes
• Workforce planning and staff engagement systems in use have limited functionality
• Council’s event management systems and processes require additional functionality and redesign to meet modern demands
• Adoption of smart sensor technologies, modelling applications, software based analytics and community safety solutions are limited
• Cyber security framework and mitigation strategies are needed to safeguard data, minimise security risks and ensure continuity of Council services

136 Back to contents
Strategic Response
This Strategy focuses on four Priority Areas which together will address the identified gaps in our digital systems and practices and will deliver the commitments made in Council’s Delivery Program 2022-2026. Over the next four years we will undertake Key Actions within each of these Priority Areas.
Priority Area 1: Technology Upgrades
Council will continue to increase efficiency and streamline business processes through the enhancement of our IT systems. To keep abreast with technological changes, we will continue upgrading or updating our infrastructure to optimum levels so that it supports our business initiatives.
Investing in these upgrades will ensure Council can provide our services more efficiently, securely and responsively. We will adopt platforms that increase productivity and improve service delivery, working in a cohesive manner to our existing infrastructure.
Priority Area 2: Customer Experience and Community Engagement
Council will continue to enhance its online platforms to improve customer experience and community engagement. We will focus on our relationship with our customers, review and identify the most effective way to enhance services provided by technology uplifts. Whether it is a call to our contact centre, organising an event, or even something as routine as paying a bill, every interaction with our customers is of value to us. Council will adopt systems and processes to provide a best in industry customer experience.
Council is committed to listening to our customers on our current service offerings and hearing suggestions on how we could enhance our services. Customer feedback is already integral to Council, with many successfully implemented digital engagement initiatives. Council will expand on these to increase our feedback and community engagement reach. Council will simplify the process of capturing meaningful feedback from our diverse community via different platforms.
Technology Upgrades Digital Strategy Customer Experience and Community Engagement Digital Innovation Enhance Cyber Security Capabilities
137 Burwood Resourcing Strategy Our Digital Infrastructure
Priority Area 3: Digital Innovation
Council will expand its use of SmartCities technologies to enhance the delivery of our services while embracing several technological advancements for digital adaptation and collaboratively finding new and better ways to navigate the digital world. With the aim to stimulate innovation and foster strategic partnerships across Council, we will evaluate and adopt emerging technologies to enhance our service delivery. We will do this utilising the benefits of digital innovation such as Internet of Things (IoT), geospatial technology, next-generation networks, automation and so on. Use of data analytics will be expanded to support decision making.
Priority Area 4: Enhance Cyber Security Capabilities
Cyber-attacks have become more common and sophisticated. A strong Cyber Security posture is necessary to ensure the confidentiality, integrity and availability of systems and information. In addition to traditional mitigation strategies such as securing the network perimeter with firewalls and endpoint devices with security software, we will advance Council’s Cyber Security Capabilities to further safeguard customer information and to improve the resilience of our service delivery in the event of a cyber-attack.

138 Back to contents
Our Action Plan
Our digital Infrastructure is critical to our success in being able to deliver on our community’s needs and expectations. It also plays a key role in our ability to attract and retain skilled staff and enhance their experience. It is important that we get the right systems and
Priority Area 1: Technology Upgrades
processes in place so that we are well placed to deliver the Burwood2036 Vision through a contemporary, responsive and agile organisation. Outlined below are the Key Actions we will take within each Priority Area to address current gaps and continue on our digital transformation journey over the next four years.
Increase efficiencies and streamline business processes through the enhancement of Information Technology systems
Rationalise and integrate the Information systems used in the delivery of Council services
Expand mobile workforce
Migrate Council's Telephony system including Call Centre to Software-as-a-Service platform
Maintain Council's IT Hardware to support the effective delivery of Council services
Adoption of Software-as-aService platforms to provide seamless services with better disaster recovery objectives
Upgrade systems and applications to support the effective delivery of Council services
Introduce systems and processes to maintain compliance with legislative requirements
Introduce systems to manage Council buildings and services
Enhance workforce planning and staff engagement information systems
Information Technology, Customer Experience and Business Improvement
Information Technology
Information Technology
Information Technology
Information Technology, Finance, Governance and Risk
Information Technology, Property, Enfield Aquatic Centre
Information Technology, People and Performance
Delivery Program Principal Activity 2022-26 Key action Responsible 2022 -23 2023 -24 2024 -25 2025 -26
All
All
139 Burwood Resourcing Strategy Our Digital Infrastructure
Priority Area 2: Customer Experience and Community Engagement
Delivery Program
Principal Activity
Enhance online platforms to improve customer experience and community engagement
Improve access to Council events by implementing online ticketing and event support solutions
Implement digital customer experience enhancements to our online platforms
Introduce automation to improve customer response times and reduce human error
Enhance community engagement platforms to increase the effectiveness of community feedback mechanisms and stakeholder management.
Information Technology, Customer Experience and Business Improvement, Community and Culture
Information Technology, Customer Experience and Business Improvement
Information Technology, Place Management and Communications, Library and Community Hub
Information Technology, Finance, Customer Experience and Business Improvement, Operations, City Development, Community Safety, Infrastructure and Assets
2022-26 Key action Responsible 2022 -23 2023 -24 2024 -25 2025 -26
140 Back to contents
Priority Area 3: Digital Innovation
Delivery Program
Principal Activity
Expand the use of Smart Cities technologies to enhance the delivery of Council services
Evaluate and adopt emerging technologies to improve service delivery
Introduce digital parking permits and payment systems
Information Technology, Community Safety, Infrastructure and Assets, Operations, Major Capital Works & Projects, Customer Experience and Business Improvement, Library and Community Hub
Information Technology, Infrastructure and Assets, Community Safety
Improve decision making by expanding the use of geographical information systems
Enhance traffic management capabilities through the implementation of innovative technological solutions
Introduce technological solutions to improve the management of abandoned assets and community safety
Information Technology, City Planning, City Development
Information Technology, Infrastructure and Assets, Community Safety
Information Technology, Community Safety
2022-26 Key action Responsible 2022 -23 2023 -24 2024 -25 2025 -26
141 Burwood Resourcing Strategy Our Digital Infrastructure
Priority Area 4: Enhance Cyber Security Capabilities
Delivery Program
Principal Activity
Advance Council’s cyber security capabilities to safeguard customer information and access to services
Develop and adopt a cyber security framework in compliance with New South Wales Government’s Cyber Security Policy, including the adoption of an Incident Response Plan
Enhance availability and resilience of IT systems to safeguard Council services
Implement cyber security mitigation initiatives
Information Technology, Governance and Risk
Information Technology
Information Technology

2022-26 Key action Responsible 2022 -23 2023 -24 2024 -25 2025 -26
142 Back to contents
Monitoring and Reporting
This Strategy outlines our organisational commitment to incorporate new technologies and transform our services to align with our approach of enhancing service delivery. Council has identified Priority Areas and developed separate actions and strategies for implementation which will become a part of our Delivery Program 20222026 and annual operational plans.
Individual projects and enhancement activities defined in each of our Priority Areas will be implemented with a commitment to improve Council services to our customers and community. These improvements will also enhance the experience of our staff in fulfilling their roles. Our progress in our digital transformation journey will be reported through our six-monthly Operational Plan reporting. Our progress will also be reported through our Annual Report and State of the City Report prepared at the end of the elected Council’s term.
References
• Burwood2036 – Community Strategic Plan
• Delivery Program 2022 – 2026
• Operational Plan 2022 – 2023
143 Burwood Resourcing Strategy Our Digital Infrastructure
2 Conder St, Burwood NSW 2134 PO Box 240 Burwood NSW 1805 P 02 9911 9911 E council@burwood.nsw.gov.au Follow Council @BurwoodCouncil www.burwood.nsw.gov.au