MOVEMENTS
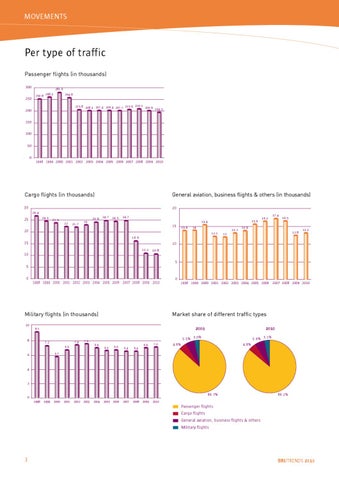
Per type of traffic Passenger flights (in thousands) 00 2 0
2 . 2 0. 2 .
2 . 2 . 20 . 20 . 20 . 20 . 2 . 2 . 200. .
200 0 00 0 0
2000 200 2002 200 200 200 200 200 200 200 20 0
Cargo flights (in thousands)
General aviation, business flights & others (in thousands)
0
20 2 . 2 . 2 .
2
22
2 .
2
2 . 2 . 2 . 2 .
.
.
.
20
2.
.
.
. 2.
2
.
0
2000 200 2002 200 200 200 200 200 200 200 20 0
Military flights (in thousands) 0
.
. 0.
0
0
.2
.
0
2000 200 2002 200 200 200 200 200 200 200 20 0
Market share of different traffic types 2009
.
.
.2
. % .0%
.
.
2010
.
.
.
.
.
.
.0
. % . %
. %
. %
.
2
. %
0
2000
200
2002 200
200
200 200
200 200 200
.2%
20 0
Passenger flights Cargo flights General aviation, business flights & others Military flights
BRUTRENDS 2010