The Greater Toronto Area’s Top Luxury Markets


Bridle Path-Sunnybrook-York Mills, St. Andrews-Windfields-Hoggs Hollow (C12)


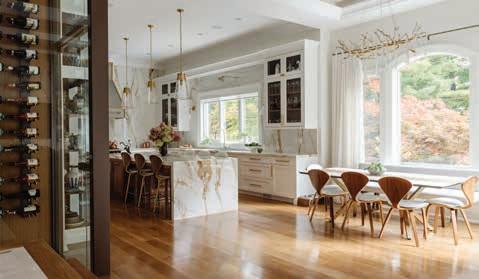
Homebuying activity is heating up in the Toronto Regional Real Estate Board’s C12 district (consisting of the Bridle Path-Sunnybrook-York Mills and St. Andrew-Windfields-Hoggs Hollow), where luxury purchasers will find the greatest selection of high-end homes and estates available for sale. Forty-one properties have sold in the first four months of 2023 in the area, with most sales occurring in March and April.


Average price over $2 million hovered at $5,648,033 in the Bridle Path–Sunnybrook-York Mills pocket between January and April of 2023, falling eight per cent short of the $6,152,438 reported during the same period in 2022. Forty-eight homes are currently listed for sale, ranging in price from $2.6 million to two at almost $29 million.

Forty properties are also available for sale in St. Andrew-Windfields-Hoggs Hollow, where prices start at $2.2 million and climb to almost $30 million. Values have held relatively steady year-over-year as well, with the average price sitting at just under $3.9 million in 2023.
Bridle Path-Sunnybrook-York Mills and St. Andrew-Windfields-Hoggs Hollow, well-known for spacious homes on well-treed and generous lot sizes, continue to attract affluent buyers. In fact, five of the 10 properties that changed hands over the $7.5 million price point in the GTA to-date have occurred in the C12 district. The average days on market for a property in C12 sat at 30 in April.
10
SOLD | 16 Beaverhall Drive COUNTRY LIVING IN THE CITY Offered at $4,995,000 SOLD | 46A Beechwood Avenue
GATED
FIFESHIRE ESTATE Offered at $7,880,000


Bridle Path-Sunnybrook-York Mills


Average Sold Price 2023 $5,648,033


Average Sold Price 2022 $6,152,438 -8% Year-over-year


St.

Hollow


Average Sold Price 2023 $3,868,535

11
January 1st - April 30st, 2023 vs. same period in 2022 2023 2022 % Change $2 million plus 15 32 -53.1% $3 million plus 12 30 -60.0% $5 million plus 8 21 -61.9% $7.5 million plus 4 4 -
Andrews-Windfields-Hoggs
January 1st - April 30st, 2023 vs. same period in 2022 2023 2022 % Change $2 million plus 26 49 -46.9% $3 million plus 18 31 -41.9% $5 million plus 5 10 -50% $7.5 million plus 1 3 -66.7%
SOLD
Rollscourt
ST. ANDREWS TRANSITIONAL Offered at $5,488,000 NEWLY BUILT DESIGNER ESTATE ON OLD COLONY Offered at $28,800,000 BRIDLE PATH MANSION ON RAVINE Offered at $28,880,000
Average Sold Price 2022 $4,069,554 -5% Year-over-year CRESCENT CUSTOM Offered at $6,995,000
| 35
Drive
ARJAY
Forest Hill South, Humewood-Cedarvale (C03)


Tight inventory levels prevailed in both HumewoodCedarvale and Forest Hill South during the first four months of the year, hampering sales activity in TRREB’s C03 district. Just three properties are currently listed for sale over $2 million in Humewood, while selection is scarce over the $5 million price point in Forest Hill, with just 10 homes available.
To date, ten homes have sold in Forest Hill South, with all but three sales occurring under the $4 million price point. Thirty-three properties are currently listed for sale. In Humewood-Cedarvale, ten properties moved between January and April, with just three currently available for sale.

While average price over the $2 million price point is down in both markets year-over-year, there has been upward pressure on pricing for freehold properties throughout the GTA. New listings that are well priced tend to move quickly in Forest Hill South and Cedarvale-Humewood, with some selling in multiple offer situations. Properties that are overpriced, however, continue to stagnate in today’s competitive environment.

Forest Hill South
12
January 1st - April 30st, 2023 vs. same period in 2022 2023 2022 % Change $2 million plus 10 27 -63.0% $3 million plus 7 21 -66.7% $5 million plus 1 10 -90.0% $7.5 million plus 0 2 -100.0% Average Sold Price 2023 $3,649,689 Average Sold Price 2022 $4,523,633 -19% Year-over-year Humewood-Cedarvale January 1st - April 30st, 2023 vs. same period in 2022 2023 2022 % Change $2 million plus 10 14 -28.6% $3 million plus 1 5 -80.0% $5 million plus 1 0 100% $7.5 million plus 0 0Average Sold Price 2023 $2,479,704 Average Sold Price 2022 $2,900,374 -15% Year-over-year
FOREST HILL ENGLISH MANOR Offered at $8,995,000
SOLD
| 55 Colin Avenue
Rosedale, Moore Park (C09)


While demand for luxury properties within Rosedale, Moore Park remains strong, a limited number of homes listed for sale across all price points has had a substantial impact on sales in the area. Twenty-four properties changed hands in the first four months of the year, down from 36 during the same period in 2022. Nearly half of those properties moved in multiple offer situations in 2023, with one selling for substantially more than asking price.

Just 21 properties are currently listed for sale in the area, with values ranging from $2.2 million to close to $11.9 million. Sellers are reluctant to sell their properties, given softer prices, that, in large part reflect the 11 sales between $2 million and $2.9 million to date. Upward pressure on pricing has been noted in recent months, but average price remains six per cent off year-ago levels.


Luxury purchasers will continue to be drawn to the Rosedale, Moore Park area in the coming months. While the advent of the traditional spring market is expected to bring new listings to the market, quantity and quality will dictate sales activity in this hot pocket.


Rosedale, Moore Park
January 1st - April 30st, 2023 vs. same period in 2022

Average Sold Price 2023 $3,548,202


Average Sold Price 2022 $3,763,827
-6% Year-over-year

13
2022 % Change $2 million plus 24 36 -33.3% $3 million plus 13 25 -48.0% $5 million plus 5 6 -16.7% $7.5 million plus 0 0 -
2023
SOLD | 732/734 Avenue Road
SOLD | 300 Vesta Drive Represented the buyer
ROSEDALE LANDMARK ESTATE Offered at $11,895,000
FULLY RENOVATED IN FOREST HILL Offered at $7,995,000
Yonge-St. Clair, Casa Loma, Annex (C02)


While fewer homes were sold in the Yonge-St. Clair, Casa Loma, and Annex neighbourhoods in the first quarter of 2023, momentum appears to be on the upswing heading into the spring market, with most sales occurring at the entry-level to luxury. Of the 32 properties sold in TRREB’s C02 district, 72 per cent occurred between $2 million and $3 million.


Downsizing purchasers and young professionals make up the lion’s share of purchasers, with many seeking properties in close proximity to the vibrant core areas, along Yonge St., Bloor St., and St. Clair Ave. By far the greatest demand this year existed in the Annex, where 10 sales occurred over the $2 million price point, followed by Casa Loma and Yonge-St. Clair at five and two sales respectively.
Tight inventory issues were apparent in Casa Loma and Yonge-St. Clair moving into the strong spring market. Thirteen properties were listed for sale in the Yonge-St. Clair area, while 14 were available in the Casa Loma area, with prices ranging from $2 million to $25 million. Twenty-eight properties were available for sale in the Annex.
Although the number of homes listed for sale is expected to climb in the Annex, Casa Loma, and Yonge-St. Clair in conjunction with the traditional spring market, conditions should remain tight throughout the second quarter. Days on market, at eight in C02, were the lowest in the central core districts in April.
Average Sold Price 2023 $2,959,333


Average Sold Price 2022 $3,337,834 -11% Year-over-year


14
Yonge-St. Clair January 1st - April 30st, 2023 vs. same period in 2022 2023 2022 % Change $2 million plus 6 22 -72.7% $3 million plus 2 11 -81.8% $5 million plus 1 4 -75.0% $7.5 million plus 0 0 -
DRAMATIC NEW FOREST HILL CUSTOM Offered at $14,750,000
SOLD | 106 Wychwood Park
3/4 AC IN CASA LOMA ENCLAVE Offered at $25,000,000 STUNNING RUSSELL HILL ESTATE Offered at $16,900,000
January 1st - April 30st,
Casa Loma
January
Average Sold Price 2023 $2,969,907
Average Sold Price 2022 $3,566,200 -17% Year-over-year
Average Sold Price 2023 $2,945,250
Average Sold Price 2022 $3,874,667 -24% Year-over-year
Leaside continues be one of the city’s strongest housing pockets, with the average price of a home over $2 million up three per cent over year-ago levels, climbing to close to $3.3 million in the first four months of 2023. Twenty-five properties were sold in between January and April, down from the 31 sales reported during the same period in 2022. Nearly half of the 25 properties were sold for more than list price.


Homebuying activity in Leaside is greatest between the $2 - $4 million price point, with young families leading the charge for the area’s detached and semi-detached properties. Eight homes are currently listed for sale, ranging in price from close to $2.4 million to just under $5.4 million.
With demand outpacing supply in Leaside yet again, upward pressure on housing values is expected to remain strong. Properties sold in April spent an average of 10 days on market and the trend is likely continue throughout the busy spring market.
Leaside (C11) Leaside
SOLD | 61 Southvale Drive
Average Sold Price 2023 $3,281,732
Average Sold Price 2022 $3,176,833
3% Year-over-year
15
1st - April 30st, 2023 vs. same period in 2022 2023 2022 % Change $2 million plus 25 31 -19.4% $3 million plus 16 15 6.7% $5 million plus 0 1 -100.0% $7.5 million plus 0 0 -
January
Annex
2023 vs. same period in 2022 2023 2022 % Change $2 million plus 18 31 -41.9% $3 million plus 5 15 -66.7% $5 million plus 0 6 -100.0% $7.5 million plus 0 1 -100.0%
1st - April 30st, 2023 vs. same period in 2022 2023 2022 % Change $2 million plus 8 15 -46.7% $3 million plus 3 11 -72.7% $5 million plus 0 3 -100.0% $7.5 million plus 0 1 -100.0%
Bedford Park, Lawrence Park, Lytton Park, Forest Hill North (C04)

The Bank of Canada’s decision to maintain the overnight rate at 4.5 per cent in April is likely to further bolster homebuying activity in TRREB’s C04 district, comprised of the Bedford Park-Nortown, Lawrence Park North and South, and Forest Hill North communities, in the second quarter of 2023.

In Forest Hill North, eight sales occurred in the first four months of the year, just one short of year ago levels for the same period. Listings are typically tight in the neighbourhood and this year is no different, with just five homes currently listed for sale. Average price over $2 million is up twelve per cent over last year in the area, hovering at close to $3.1 million so far this year, up from $2,745,333 during the same period in 2022.

Sales of homes in Bedford Park-Nortown were down year-over-year, with just 43 properties sold in the first four months of the year. Average price, however, held relatively steady, down five per cent to just short of $3.2 million. There are 33 homes available for sale at present, ranging in value from $2.15 million to close to $7.6 million.
Housing values in Lawrence Park remain steady, with the average price over $2 million down three per cent in Lawrence Park North to $2,683,787 year-to-date, compared to the same period in 2022, and 16 per cent off year-ago levels in Lawrence Park South. Lawrence Park has experienced some softening in sales in the first four months of the year. Just 14 homes are currently listed for sale between almost $2.6 million and $11.35 million in Lawrence Park South, while 10 priced from almost $2.2 million to close to $15 million are available in Lawrence Park North.
Park-Nortown
January

16 Bedford
1st - April 30st, 2023 vs. same period in 2022 2023 2022 % Change $2 million plus 43 70 -38.6% $3 million plus 23 35 -34.3% $5 million plus 1 7 -85.7% $7.5 million plus 0 1 -100.0% Average Sold Price 2023 $3,193,248 Average Sold Price 2022 $3,377,336 -5% Year-over-year
Lawrence Park North January 1st - April 30st, 2023 vs. same period in 2022 2023 2022 % Change $2 million plus 21 41 -48.8% $3 million plus 3 7 -57.1% $5 million plus 0 2 -100.0% $7.5 million plus 0 1 -100.0% Average Sold Price 2023 $2,683,787 Average Sold Price 2022 $2,765,859 3% Year-over-year BEDFORD PARK CONTEMPORARY Offered at $2,995,000
Average Sold Price 2023 $3,267,875
Average Sold Price 2022 $3,882,975 -16% Year-over-year


Forest Hill North

Average Sold Price 2023 $3,084,563


Average Sold Price 2022 $2,745,333 12% Year-over-year

17 Lawrence
January 1st - April 30st, 2023 vs. same period in 2022 2023 2022 % Change $2 million plus 24 32 -25.0% $3 million plus 13 19 -31.6% $5 million plus 1 5 -80.0% $7.5 million plus 1 2 -50.0%
Park South
January 1st - April 30st, 2023 vs. same period in 2022 2023 2022 % Change $2 million plus 8 9 -11.1% $3 million plus 4 3 33.3% $5 million plus 1 0 100% $7.5 million plus 0 0 -
NEWLY BUILT CRICKET CLUB MASTERPIECE Offered at $6,299,000
SOLD | 538 Douglas Avenue
SOLD | 19 Forest Glen Crescent Represented the seller & the buyer
1.8 ACRES ON CORTLEIGH BLVD Offered at $8,650,000
PERMIT READY IN LYTTON PARK Offered at $6,880,000
SOLD | 46 Teddington Park Avenue Represented the buyer
Banbury-Don Mills (C13)


While luxury sales have tapered year-over-year in the Banbury-Don Mills neighbourhood, demand remains steady for entry-level product priced from $2 million to $3 million. Twenty-eight homes changed hands in the first four months of 2023, eleven of which sold for more than list price.


Young families continue to drive activity, with most drawn to the value offered by homes in the community. Sixteen sales occurred under $3 million and 12 at $3 million plus. Just 16 homes are currently listed for sale, priced from almost $2.3 million to $13.8 million.
Inventory levels at the $2 million to $3 million remain tight across the GTA, including the Banbury-Don Mills community. Supply is expected to increase in the second quarter, but if new listings fail to materialize, we could see upward pressure on prices yet again.
Average Sold Price 2023


$3,082,679

Average Sold Price 2022 $3,451,123 -11% Year-over-year


18
Mills January 1st - April 30st, 2023 vs. same period in 2022 2023 2022 % Change $2 million plus 28 30 -6.7% $3 million plus 12 18 -33.3% $5 million plus 0 3 -100.0% $7.5 million plus 0 1 -100.0%
Banbury-Don
SOLD | 9 Alderdale Court
SOLD | 1 Blaine Drive
SOLD | 3 Sagewood Drive
Luxury Condominiums (GTA)


Despite lower year-over-year sales activity, demand for luxury condominiums throughout the GTA has held up relatively well. Eighty-one condominium apartments and townhomes were sold in the first four months of the year, down from 113 units reported during the same period in 2022. The average price of a luxury condominium over $2 million softened in the first quarter of 2023, falling about four per cent from the $3.02 million posted in Q1 2022.

The 416-area code continues to draw the vast majority of condominium buyers, with 89 per cent of year-todate sales over $2 million occurring in Toronto Proper. Communities in the city’s downtown core such as the Annex, Bay St. Corridor, and Waterfront Communities (C1/C8) are most sought-after, although there has been a flurry of activity in older, established neighbourhoods such as Rosedale and Bedford Park this year. Waterfront condominiums in Old Oakville are also a popular choice with luxury condominium buyers, many of whom are downsizing from larger homes in the Oakville area.
While inventory may be tight in some sought-after buildings in the core, more than 216 condominiums, ranging in price from $2 million to almost $35 million, are currently listed for sale in the GTA.
Luxury Condominiums


January 1st - April 30st, 2023 vs. same period in 2022
Average Sold Price 2023 $2,902,961
Average Sold Price 2022 $3,026,531 -4% Year-over-year

19
2023 2022 % Change $2 million plus 81 113 -28.3% $3 million plus 24 42 -42.9% $5 million plus 5 6 -16.7% $7.5 million plus 0 0 -
STUNNING HAZELTON HOTEL CONDO Offered at $9,990,000
CHARACTER & GRANDEUR AT THE FOUR SEASONS RESIDENCES Offered at $18,000,000
HAZELTON HOTEL CORNER SUITE Offered at $13,800,000


ICONIC YORKVILLE ADDRESS Offered at $8,380,000 ST. ANDREWS LEGAL DUPLEX Offered at $2,950,000
PALATIAL ESTATE ABUTTING MAGNA G.C. Offered at $10,800,000 UNDER CONSTRUCTION IN FOREST HILL Offered at $ $12,969,000 REDESIGNED ON HIGHLAND ROAD Offered at $8,380,000 STATE-OF-THE-ART IN HOGGS HOLLOW Offered at $11,995,000 STUNNING CUSTOM ON LARABEE Offered at $3,998,000 STATELY YORK MILLS HOME Offered at $7,500,000 BUILD NEW IN LYTTON PARK Offered at $4,996,000 LAWRENCE PARK DEVELOPMENT Offered at $5,500,000 20 ELEGANT MELROSE CUSTOM Offered at $3,450,000 ARCHITECTS OWN ON PINE VALLEY Offered at $8,250,000
Featured Spring Collection Properties
RE/MAX Dominates Luxury
When it comes to luxury listings, RE/MAX’s network, dedicated platforms, and marketing reach find exactly the right buyer – no matter where they reside.
Our Global Presence
110+ Countries | 8,629 Offi ces | 40+ Languages
V.S.
THE NEXT LARGEST INTERNATIONAL LUXURY REAL ESTATE COMPANIES
Positioned as the only real estate company with true global reach, the Global RE/MAX portal, global.remax.net, facilitates listing marketing in nearly 100 countries and 40+ languages, from coast to coast and beyond.
#1 On Google: Barry Cohen & RE/MAX
RE/MAX’s online advantage, across the planet, is miles ahead of the competition, due to a marketing budget that is bigger than all other competitors combined. Additionally, Barry Cohen Homes is organically found at the top of Google for Toronto Luxury Real Estate key search words, allowing us the ability to reach the most amount of buyers for your home.
Real Estate Brokerage Google Search Trends Comparison - WORLD WIDE
T.O.’s TOP
February
3 rd LARGEST 60 Countries 4,000 Offices 2 nd LARGEST 70 Countries 880 Offices 4 th LARGEST 45 Countries 1,200 Offices
21
Brokerage #5 RE/MAX Brokerage #2 Brokerage #3 Brokerage #4 April 2022
2022
September
2023
2023 100 75 50 25 0
April
5
HOMES & ESTATES
#1 I n Toronto for Luxury Homes, since 2008
Sales Higher Than $10,000,000 (January 01, 2017 to April 30, 2023) Cohen Homes & Estates $242,636,000 23 $99,740,000 $22,700,000 $13,500,000 9 4 3 $24,550,000 $35,448,000 $27,300,000 $124,290,000 $58,148,000 $40,800,000 $74,746,000 $317,382,000 Competitor A Competitor B Competitor C Listings Volume Total Units Buyer Volume Total Volume Sales Higher Than $7.500,000 (January 01, 2017 to April 30, 2023) Cohen Homes & Estates $419,187,500 54 $134,340,000 $81,193,800 $53,082,000 15 15 10 $41,950,000 $69,394,800 $38,950,000 $176,290,000 $150,588,600 $92,032,000 $172,957,500 $592,145,00 Competitor A Competitor B Competitor C Listings Volume Total Units Buyer Volume Total Volume Sales Higher Than $5,000,000 (January 01, 2017 to April 30, 2023) Cohen Homes & Estates $832,670,528 145 $225,204,000 $226,443,800 $178,606,688 62 36 35 $162,476,000 $78,650,000 $85,819,800 $387,680,000 $305,093,800 $264,426,488 $309,992,500 $1,142,663,028 Competitor A Competitor B Competitor C Listings Volume Total Units Buyer Volume Total Volume Sales Higher Than $3,000,000 (January 01, 2017 to April 30, 2023) Cohen Homes & Estates $1,311,029,096 323 $690,491,518 $421,756,956 $373,662,090 253 116 108 $403,893,027 $69,314,999 $118,115,018 $1,094,384,545 $491,071,955 $491,777,108 $512,665,300 $1,823,694,396 Competitor A Competitor B Competitor C Listings Volume Total Units Buyer Volume Total Volume 22
Data complied from The Toronto Real Estate Board, by REDATUM.
Source:
COHEN


23 Why More Sellers Choose Us? Most importantly, we represent More Sellers than any competitor which allows us to generate More Buyers, more offers, higher prices, and ultimately More Sales! Barry’s Market Insight Price Validation from Brand Reputation Custom & Effective Marketing Strategies 11 Magazine Publications Client Concierge for Staging & Repairs Multicultural Team Forbes Global Reach Exclusive to BCH Unrivalled Negotiation Strategies #1 Team & Individual in Central Toronto Unparalleled Service Our Team Farzad
Sales Representative Sasha
Sales Representative Nima
Sales Representative Olga
Sales Representative Simone
Tyler
Sales Representative Justin
Broker Barry Cohen President & Broker Nigel
Broker Lance
Of Record Patricia
Sales Representative Natasha
Sales Representative Diana
Broker Aaron
Sales Representative Adam
Evelyn
Angie
Sales Representative
Ghazi
Firestone
Hafezian
Donchenko
Chen Broker
Cohen
Cohen
Wain
Stoute Broker
Sun
Omrin
Mendonca
Luftspring
Sajjadian Broker
Li Broker
Chang
Toronto’s Leader in Luxury
No
#1 in Toronto For Homes Sold $3,000,000 - 35,000,000, since 2010
309 York Mills Road, Unit 7 Toronto ON M2L 1L3 | Trademark Barry Cohen Homes. Each office independently owned and operated. *Based on Barry Cohen Homes Sales on TRREB. Not intended to solicit buyers or sellers currently under contract with another brokerage. REALTRON BARRY COHEN HOMES INC., BROKERAGE 416.223.1818 View our collection of fine homes virtually at www. BARRYCOHENHOMES .com HOMES & ESTATES COHEN
one has sold more luxury real estate in this decade than Cohen Homes & Estates.* The reason is obvious. In addition to our unmatched negotiation skills, we provide the greatest exposure for your home. By utilizing the very latest in print and online marketing strategies enhanced by our exclusive international affiliations, more local and foreign buyers see our homes. Simply put, we do more for our clients than our competition. The proof is in the numbers.
*


 SHERWOOD HOMES & RICHARD WENGLE ARCHITECTURAL MASTERPIECE ON RAVINE | Offered at $8,350,000


 Barry Cohen