Barfoot & Thompson - Property Management Mairangi Bay

Page 1

May2024 Mairangi Bay Property Management Rental Report barfoot.co.nz/mairangi-bay RENT

Mairangi Bay Property Management Team

Small Property Management Office, North Shore Region to end March 2022

Karen Williams Head of Property Management 0274 319 514 k.williams@barfoot.co.nz

Angie Pike-Taylor

Senior Property Manager 027 431 9503 a.pike-taylor@barfoot.co.nz

Georgie Hutchison Property Manager 027 237 6952 g.hutchison@barfoot.co.nz

Top

Hello

Welcome to the May edition of our RENT – Property Management magazine from the Mairangi Bay branch team. Inside you will find the latest property management market data for the areas across Auckland, along with tips and information about our Property Management services.

Property Management is anything but an idle job. It’s constantly busy - constantly finding out of the box solutions to problems, constantly keeping everyone happy, and constantly doing all of this with a smile.

Karen Williams is passionate about this role she plays as a Property Manager. Driven and enthusiastic, she has led Mairangi Bay’s Property Management team since 1996. Over this time she has amassed a wealth of knowledge and grown the sector from just herself to now a highly effective team of three.

Part of what makes Karen so effective is her ability to juggle the needs of landlords and tenants alike - something that she partially attributes to being the mother of four boys. An expert at multitasking and getting results, Karen knows how to find solutions that satisfy everyone.

She prides herself on being able to look at things from multiple points of view. Being a property owner and landlord herself, she appreciates what landlords want and need, whilst still being able to take quality care of her tenants. Karen is a true people person and she loves being able to give exceptional service to all of her clients.

North Shore born and raised, Karen has plenty of local knowledge and experience.

Call or email Karen and her team today to discuss how they can help you manage your assets and investments. Your property will be in very safe hands.

Mairangi Bay branch 386 Beach Road, Mairangi Bay 0630 Property Mgt 09 479 3677 E mairangi.rental@barfoot.co.nz barfoot.co.nz/mairangi-bay

Latest News

Auckland’s Quarterly Rental Update

Auckland

rents start year on the rise; Plus - the latest ‘pet-friendly rental’ data

Auckland rents edged up again in the first three months of 2024. Barfoot & Thomspon says pricing data from more than 17,500 properties the agency manages across the region shows the average weekly rent reached $671.35 in March 2024, up 5.69% on the same time last year.

This surpasses a 5.27% year-on-year increase recorded in December 2023 which, at the time, was the highest since 2015.

Barfoot & Thompson’s General Manager for Property Management Samantha Arnold says the numbers indicate the market has entered a new pricing cycle.

“Over the past six to nine months the Auckland rental market has been emerging from a slower period of pricing change after hovering around 3% yearon-year for some time.

“What we are seeing now is more familiar to the market pace experienced eight to ten years ago, in 2014 to 2016.”

She says the tension between high demand for rental properties and constrained supply continued to be a major factor.

“This is not a new dynamic for Auckland, but it has been compounded by several coinciding factors including the return of long-term visitors and international students, record high net migration and the ongoing impact of 2023’s extreme weather events, which saw more people in need of housing and fewer houses available due to storm damage.”

Property owners have also been grappling with higher interest and operating costs, says Arnold, with relief through interest deductibility and tenancy rule changes still to come into effect.

Across the region, rents rose fastest in the Central City apartment market as it continued its post-Covid rebound. The average rent there reached $573.74 in March, up 8.56% on 2023. Rents rose slowest in Rodney, up 3.75% or $24.23 on March 2023, to $670.07.

By size, one-bedroom properties attracted higher rent rises, up 6.87% on last year, while three-bedroom properties saw less price pressure than other sized homes, up 5.00%.

The latest data on renting with pets

Barfoot & Thompson tracks a number of property attributes across the agency’s rental portfolio, including whether a rental is ‘pet friendly’.

“The Government recently announced several changes to the Rental Tenancies Act related to pets, prompting us to take a look at what’s happening in the market now, prior to the changes coming into effect,” says Arnold.

“The latest figures show that around 14% of Auckland rentals allow pets. This equates to around 2,500 properties of the 17,500 plus that we manage in Auckland.

“We’ve been providing advice and guidance about renting with pets to both our property owners and renters over many years to encourage growth and are excited by what the latest changes

to the Act will mean for renter choice and property owner confidence.”

The data shows the North Shore had the highest proportion of pet-friendly rentals as of March 2024, with around 21% of properties welcoming pets, while it was hardest to find a pet friendly rental in Central Auckland apartments, where less than 2% of properties allowed them.

Comparing average weekly rents between properties that do and don’t allow pets, Barfoot & Thompson also found that pet friendly rentals were already drawing a premium of around 10% more than the average for a home in the same area, however this varied greatly between different parts of the city.

“City and city fringe properties were priced around 20% to 40% higher when pets were allowed. However, that pricing may also reflect those properties, such as apartments, are typically less suited to pets, so those that allow them may be larger or unique in a way that naturally demands a higher price.”

Pet lovers in Pakuranga and Howick pay the lowest premium to rent with their furry friends, just 1.12% higher than the local average.

“Another thing we noted is the contrast between the number of fenced properties which can be a particularly important factor for dog owners.

“Fewer than 2% of rental properties were listed as fenced. And while we expect the real number is higher, it highlights an aspect renters and property owners need to consider before deciding if a home is suitable for some types of pets.”

Auckland Region Rental Summary

Apr. 2024

Source: Barfoot & Thompson analysis of its tenancies as at end of the noted month and its sales over the last six months for three bedroom properties. Suburbs with less than four tenancies or four sales for three bedroom properties with Barfoot & Thompson are not included. Number of bedrooms Rent received Number of rentals Key: 1 2 3 4 5+ $447 $569 $676 $823 $1,013 1,683 4,668 6,534 3,469 1,038 WEST AUCKLAND 1 $421 2 $540 3 $628 4 $755 5+ $915 ISLANDS OF THE GULF 1 N/A 2 N/A 3 $1,100 4 N/A 5+ N/A SOUTH AUCKLAND 1 $385 2 $504 3 $627 4 $743 5+ $863 CENTRAL AUCKLAND 1 $463 2 $656 3 $927 4 $945 5+ $1,100 CENTRAL AUCKLAND WEST 1 $505 2 $617 3 $803 4 $947 5+ $1,390 CENTRAL AUCKLAND EAST 1 $446 2 $577 3 $722 4 $929 5+ $1,170 EASTERN SUBURBS 1 $455 2 $609 3 $769 4 $978 5+ $1,228 FRANKLIN/ MANUKAU RURAL 1 $389 2 $480 3 $578 4 $681 5+ $795 PAKURANGA / HOWICK 1 $445 2 $560 3 $677 4 $819 5+ $998 NORTH SHORE 1 $468 2 $572 3 $702 4 $854 5+ $1,045 RODNEY 1 $414 2 $547 3 $647 4 $790 5+ $914 AUCKLAND AVERAGE TOTAL

Market Facts and Figures

AUCKLAND AVERAGE

Central Auckland East Suburb Average sale price (3 bdrm) Average rent per week (3 bdrm) Gross yield Epsom $1,529,567 $816 2.78% Greenlane $1,293,571 $749 3.01% Lynfield $1,196,400 $662 2.88% Mount Eden $1,687,286 $789 2.43% Mount Roskill $1,272,907 $661 2.70% New Windsor $1,174,250 $641 2.84% One Tree Hill $1,299,686 $730 2.92% Onehunga $1,099,235 $697 3.30% Royal Oak $1,446,063 $732 2.63% Sandringham $1,304,043 $714 2.85% Three Kings $1,461,750 $796 2.83% Central Auckland Suburb Average sale price (3 bdrm) Average rent per week (3 bdrm) Gross yield Auckland Central $1,530,000 $1,015 3.45% Eastern Suburbs Suburb Average sale price (3 bdrm) Average rent per week (3 bdrm) Gross yield Ellerslie $1,123,800 $732 3.39% Glen Innes $1,177,923 $690 3.05% Glendowie $1,783,936 $803 2.34% Kohimarama $2,102,500 $949 2.35% Meadowbank $1,394,250 $824 3.07% Mission Bay $1,704,167 $855 2.61% Mount Wellington $972,078 $670 3.59% Panmure $849,500 $648 3.96% Parnell $1,958,333 $849 2.25% Point England $1,106,250 $669 3.14% Remuera $2,398,727 $841 1.82% Saint Heliers $1,839,000 $866 2.45% Saint Johns $1,311,000 $758 3.01% Apr. 2024 Apr. 2024 AUCKLAND REGION AVERAGES Average Rent 3 Bedroom p/wk. $676 p/w Average Sale Price 3 Bedroom $1,082,525 3.25% Gross Yield Source: Barfoot & Thompson analysis of its tenancies for the period noted and its sales over the last six months for three bedroom properties. Gross yield calculated using average sales price and average rental per week for three bedroom properties. Suburbs with less than four tenancies or four sales for three bedroom properties with Barfoot & Thompson are not included.
Suburb Average sale price (3 bdrm) Average rent per week (3 bdrm) Gross yield Freemans Bay $1,485,833 $1,008 3.53% Grey Lynn $1,852,857 $890 2.50% Mount Albert $1,196,075 $660 2.87% Point Chevalier $1,648,333 $832 2.63% Ponsonby $1,671,000 $990 3.08% Westmere $1,393,333 $958 3.57%
Central Auckland West
Franklin/Manukau Rural Suburb Average sale price (3 bdrm) Average rent per week (3 bdrm) Gross yield Clarks Beach $854,333 $584 3.55% Pokeno $925,000 $647 3.64% Pukekohe $837,632 $577 3.58% Tuakau $740,000 $556 3.91% Waiuku $843,091 $558 3.44%

North Shore

Pakuranga/Howick

West Auckland

Source: Barfoot & Thompson analysis of its tenancies for the period noted and its sales over the last six months for three bedroom properties. Gross yield calculated using average sales price and average rental per week for three bedroom properties. Suburbs with less than four tenancies or four sales for three bedroom properties with Barfoot & Thompson are not included.

Suburb Average sale price (3 bdrm) Average rent per week (3 bdrm) Gross yield Albany $966,306 $698 3.75% Bayview $958,333 $651 3.53% Beach Haven $891,375 $639 3.73% Belmont $1,664,627 $769 2.40% Birkdale $987,500 $620 3.27% Browns Bay $1,042,941 $694 3.46% Castor Bay $1,343,400 $837 3.24% Devonport $1,839,000 $855 2.42% Forrest Hill $1,248,524 $726 3.03% Glenfield $1,056,486 $645 3.18% Greenhithe $1,316,500 $790 3.12% Hillcrest $1,134,750 $696 3.19% Mairangi Bay $1,207,125 $763 3.29% Milford $1,195,333 $725 3.15% Northcote $1,026,640 $664 3.36% Northcross $1,192,000 $803 3.51% Pinehill $1,013,333 $757 3.88% Rothesay Bay $1,664,200 $762 2.38% Sunnynook $1,223,273 $656 2.79% Takapuna $1,468,857 $796 2.82% Torbay $1,136,568 $689 3.15% Totara Vale $968,000 $654 3.51% Unsworth Heights $1,045,750 $675 3.36%
Suburb Average sale price (3 bdrm) Average rent per week (3 bdrm) Gross yield Avondale $929,922 $658 3.68% Blockhouse Bay $1,177,896 $673 2.97% Glen Eden $853,723 $601 3.66% Glendene $839,167 $610 3.78% Green Bay $1,041,500 $637 3.18% Henderson $892,431 $600 3.50% Hobsonville $1,378,571 $724 2.73% Kelston $999,600 $611 3.18% Laingholm $909,000 $621 3.55% Massey $885,599 $612 3.59% New Lynn $927,256 $619 3.47% Ranui $791,591 $583 3.83% Sunnyvale $813,563 $608 3.88% Swanson $879,333 $654 3.87% Te Atatu Peninsula $1,017,496 $633 3.24% Te Atatu South $930,398 $619 3.46% Titirangi $937,000 $637 3.54% West Harbour $986,852 $624 3.29% Westgate $890,273 $707 4.13% South Auckland Suburb Average sale price (3 bdrm) Average rent per week (3 bdrm) Gross yield Clendon Park $758,577 $585 4.01% Clover Park $751,625 $613 4.24% Conifer Grove $911,429 $601 3.43% Drury $1,130,348 $684 3.15% East Tamaki $1,083,600 $693 3.32% Favona $835,800 $635 3.95% Goodwood Heights $967,250 $678 3.65% Karaka $1,043,400 $685 3.41% Mangere $786,333 $601 3.97% Mangere Bridge $927,153 $650 3.64% Mangere East $846,095 $629 3.87% Manurewa $985,475 $618 3.26% Manurewa East $828,750 $625 3.92% Opaheke $893,333 $607 3.53% Otahuhu $749,786 $606 4.20% Otara $734,273 $578 4.09% Papakura $834,718 $621 3.87% Papatoetoe $1,018,819 $639 3.26% Randwick Park $744,268 $595 4.16% Rosehill $755,296 $633 4.36% Takanini $864,105 $639 3.84% Totara Heights $872,892 $692 4.12% Wattle Downs $911,400 $646 3.69% Weymouth $1,376,950 $636 2.40% Rodney Suburb Average sale price (3 bdrm) Average rent per week (3 bdrm) Gross yield Gulf Harbour $770,714 $651 4.39% Helensville $954,714 $603 3.29% Huapai $1,096,250 $689 3.27% Kumeu $790,500 $640 4.21% Manly $1,063,214 $660 3.23% Orewa $1,142,778 $667 3.03% Red Beach $1,022,667 $662 3.37% Silverdale $1,191,000 $705 3.08% Stanmore Bay $862,464 $626 3.77% Warkworth $1,035,125 $630 3.17%
Suburb Average sale price (3 bdrm) Average rent per week (3 bdrm) Gross yield Botany Downs $1,342,667 $682 2.64% Bucklands Beach $1,515,909 $691 2.37% Burswood $1,073,667 $680 3.29% Cockle Bay $1,293,167 $698 2.81% Flat Bush $912,439 $690 3.93% Half Moon Bay $1,096,915 $677 3.21% Highland Park $1,070,689 $642 3.12% Howick $1,181,269 $668 2.94% Northpark $1,241,143 $702 2.94% Pakuranga $950,849 $645 3.52% Pakuranga Heights $1,050,000 $638
Sunnyhills $1,510,333 $690
Apr. 2024
3.16%
2.38% AUCKLAND REGION AVERAGES

ADVICE FOR NEW PROPERTY BUYERS

TOP TIPS

Why work with a Barfoot & Thompson Property Manager to take care of your rental investment?

Whether you’re looking to purchase your first home or your first investment property, if you’re a new property buyer, it can be daunting to navigate today’s market. Barfoot & Thompson Director Kiri Barfoot shares some tips.

Save, save, and save some more

There’s no getting around the fact that, in order to purchase your first property, you’ll need money in the bank.

Saving up a home deposit can be the biggest obstacle for first property buyers. Studies, travel, and money spent on an active social life are obvious roadblocks to saving, but with rising house prices not corresponding to wage increases, what’s a young person to do?

“It’s important to remember that it has always been difficult to get your foot on the property ladder,” says Kiri Barfoot. “Instead of giving up, keep focused on your goals and consider your options.”

Some ideas to help you save faster

• Those who are fortunate to have the option of living with family while saving for a deposit could make the most of it. “It’s also becoming more common for parents to leverage the equity in their own homes to help their kids get on the ladder.”

• Maximising your KiwiSaver contributions with a view to withdraw funds for your first home can be another way to build up savings more quickly and automatically.

• You may be eligible for the Welcome Home Loan, check their website for more details and eligibility criteria.

• It may seem obvious, but cutting back on non-essential spending is necessary to reach your goals faster. Saving even small amounts can add up over time, and most importantly, will help build the savings habit and mindset.

“Property investment is an expensive pursuit and some sacrifices will need to be made. This doesn’t have to mean no more fun, but you’ll have to consider your priorities and savings goals before purchasing something non-essentialonly you can decide whether something is worth it to you.”

Think outside the box

If you’ve managed to save a deposit, the next step is to find a property you can afford.

As a young property buyer, it helps to look beyond the ‘traditional’ standalone house on a quarter-acre and expand your search to include apartments, units, terraced houses, multi-family properties and new builds.

“Remember that your first property isn’t necessarily your forever home, but a good way to build equity that you can use for your next property,” says Kiri.

You could also consider getting a flatmate or two, or look into temporary options such as Airbnb or boarding overseas students. While it can be a sacrifice to give up some privacy, the rental income can go towards covering costs such as the mortgage, utilities bills, or property maintenance.

Look for opportunities

Keep an open mind and be prepared to look at neighbourhoods that aren’t so trendy, or properties that are rough around the edges. “If you look around, there are still opportunities to be had for entry-level properties,” says Kiri. Areas that are close to public transport hubs or new motorways (both new and proposed) are great places to look.

“It pays to not be a snob. In the 1960s, people turned down Herne Bay properties as they had to drive through Ponsonby to get there. Now, look at both suburbs! You never know which suburb will be the next up-and-comer.”

Consider rentvesting

While you may not be able to afford to buy in the neighbourhood you want to live in, it’s likely that you’ll be able to afford to rent there, and perhaps purchase a property in a more affordable area to rent out.

While there are trade offs - e.g. you will still be living in a rented property and not one that you own, plus learn to become a landlord or engage the services of a professional property manager - this could be a way to continue to live the lifestyle that you want and build equity, which could then be used to get you into your forever home in several years’ time.

It’s important to note that as an investor, you will not be eligible to withdraw funds from KiwiSaver or be eligible for the HomeStart Grant. Doing your due diligence and weighing up the pros and cons is essential if you choose to go this route.

Keep your finger on the pulse and your eyes on the prize

Read our market updates to keep your finger on exactly what is happening in the market, and work with a salesperson who knows your area well, who’ll be able to inform you of any properties coming into the market that meet your criteria, as well as offer support and professional advice.

“Property is a long game. Don’t get swayed by the daily headlines and think longterm,” says Kiri.

Last but not least, stay positive! “Don’t give up, you’ll get there eventually,” says Kiri. “You can have it all - you just can’t have it all at once.” The financial stability and freedom you create for yourself will far outweigh any sacrifices you make now.

Auckland Suburbs

Market Data

The following pages show a summary of rental market data for suburbs across Auckland for the last six months, as sourced from the Ministry of Business, Innovation & Employment NZ - Tenancy Services for the period shown.

Please do not hesitate to contact any of our Property Management team if you would like more information, we would be delighted to help you with your Real Estate needs.

*The data shown on this page is sourced from the Ministry of Business, Innovation & Employment NZ - Tenancy Services for the period shown. Summary totals include averages for some types of property not shown. The market rent information comes from bond data. The results may not be a true indication of the rental market, as they only reflect properties where bonds have been lodged in the previous 6 months. More information is available at https://www.tenancy.govt.nz/ rent-bond-and-bills/market-rent/market-rent-explained.

Reproduction of market data is permitted under the terms of the Creative Commons Attribution 3.0 New Zealand License - https:// creativecommons.org/licenses/by/3.0/nz/. Every reasonable effort has been made to ensure the accuracy of the information in this report. Barfoot and Thompson Limited (REA2008) accepts no responsibility should the contents of this market report prove to be incomplete or incorrect.

Market rent in Albany

The data shown on this page is sourced from the Ministry of Business, Innovation & Employment NZ - Tenancy Services for the period shown. Summary totals include averages for some types of property not shown. The market rent information comes from bond data. The results may not be a true indication of the rental market, as they only reflect properties where bonds have been lodged in the previous 6 months. More information is available at https://www.tenancy.govt.nz/rent-bond-and-bills/market-rent/market-rent-explained. Reproduction of market data is permitted under the terms of the Creative Commons Attribution 3.0 New Zealand License - https://creativecommons.org/licenses/by/3.0/nz/. Every reasonable effort has been made to ensure the accuracy of the information in this report. Barfoot and Thompson Limited (REA2008) accepts no responsibility should the contents of this market report prove to be incomplete or incorrect.
6 Months ending 31/03/2024 BONDS 1710 $370 LOWER $600 MEDIAN $770 UPPER SIZE BONDS RECEIVED LOWER QUARTILE MEDIAN RENT UPPER QUARTILE 1 2 3 4 5+ SIZE BONDS RECEIVED LOWER QUARTILE MEDIAN RENT UPPER QUARTILE 1 180 $353 $488 $575 2 3 219 $559 $603 $696 48 $693 $765 $868 57 $475 $500 $525 126 $573 $655 $698 237 $750 $780 $825 198 $800 $900 $960 42 $1,030 $1,200 $1,300 HOUSE APARTMENT/FLAT Market rent in Auckland Central 6 Months ending 31/03/2024 BONDS 15252 $400 LOWER $500 MEDIAN $600 UPPER SIZE BONDS RECEIVED LOWER QUARTILE MEDIAN RENT UPPER QUARTILE 1 2 3 4 5+ SIZE BONDS RECEIVED LOWER QUARTILE MEDIAN RENT UPPER QUARTILE 1 5406 $400 $450 $530 2 3 4266 $525 $590 $660 459 $694 $850 $1,096 765 $400 $450 $503 840 $530 $583 $680 117 $610 $780 $1,000 N/A N/A N/A N/A N/A N/A N/A N/A HOUSE APARTMENT/FLAT Market rent in Avondale 6 Months ending 31/03/2024 BONDS 2577 $520 LOWER $660 MEDIAN $770 UPPER SIZE BONDS RECEIVED LOWER QUARTILE MEDIAN RENT UPPER QUARTILE 1 2 3 4 5+ SIZE BONDS RECEIVED LOWER QUARTILE MEDIAN RENT UPPER QUARTILE 1 45 $444 $450 $501 2 3 102 $520 $550 $640 33 $550 $600 $600 60 $400 $445 $570 360 $575 $640 $675 906 $675 $720 $786 324 $795 $850 $880 66 $983 $1,000 $1,083 HOUSE APARTMENT/FLAT Market rent in Birkdale 6 Months ending 31/03/2024 BONDS 1020 $560 LOWER $660 MEDIAN $723 UPPER SIZE BONDS RECEIVED LOWER QUARTILE MEDIAN RENT UPPER QUARTILE 1 2 3 4 5+ SIZE BONDS RECEIVED LOWER QUARTILE MEDIAN RENT UPPER QUARTILE 1 30 $425 $448 $586 2 3 36 $510 $530 $550 N/A N/A N/A N/A N/A N/A N/A N/A 162 $530 $560 $615 477 $650 $690 $730 96 $705 $798 $888 N/A N/A N/A N/A HOUSE APARTMENT/FLAT

Market rent in Birkenhead

The data shown on this page is sourced from the Ministry of Business, Innovation & Employment NZ - Tenancy Services for the period shown. Summary totals include averages for some types of property not shown. The market rent information comes from bond data. The results may not be a true indication of the rental market, as they only reflect properties where bonds have been lodged in the previous 6 months. More information is available at https://www.tenancy.govt.nz/rent-bond-and-bills/market-rent/market-rent-explained. Reproduction of market data is permitted under the terms of the Creative Commons Attribution 3.0 New Zealand License - https://creativecommons.org/licenses/by/3.0/nz/. Every reasonable effort has been made to ensure the accuracy of the information in this report. Barfoot and Thompson Limited (REA2008) accepts no responsibility should the contents of this market report prove to be incomplete or incorrect.
6 Months ending 31/03/2024 BONDS 1092 $593 LOWER $700 MEDIAN $850 UPPER SIZE BONDS RECEIVED LOWER QUARTILE MEDIAN RENT UPPER QUARTILE 1 2 3 4 5+ SIZE BONDS RECEIVED LOWER QUARTILE MEDIAN RENT UPPER QUARTILE 1 42 $473 $475 $480 2 3 132 $599 $610 $650 12 $680 $680 $698 N/A N/A N/A N/A 147 $534 $575 $646 303 $699 $755 $825 141 $800 $850 $1,150 33 $1,051 $1,095 $1,206 HOUSE APARTMENT/FLAT Market rent in Blockhouse Bay 6 Months ending 31/03/2024 BONDS 1437 $620 LOWER $695 MEDIAN $800 UPPER SIZE BONDS RECEIVED LOWER QUARTILE MEDIAN RENT UPPER QUARTILE 1 2 3 4 5+ SIZE BONDS RECEIVED LOWER QUARTILE MEDIAN RENT UPPER QUARTILE 1 N/A N/A N/A N/A 2 3 66 $473 $495 $548 N/A N/A N/A N/A 36 $423 $463 $520 153 $560 $590 $620 588 $650 $695 $750 222 $805 $850 $890 93 $1,095 $1,200 $1,248 HOUSE APARTMENT/FLAT Market rent in Browns Bay 6 Months ending 31/03/2024 BONDS 1392 $595 LOWER $700 MEDIAN $820 UPPER SIZE BONDS RECEIVED LOWER QUARTILE MEDIAN RENT UPPER QUARTILE 1 2 3 4 5+ SIZE BONDS RECEIVED LOWER QUARTILE MEDIAN RENT UPPER QUARTILE 1 30 $503 $588 $595 2 3 84 $580 $710 $750 18 $859 $998 $1,125 N/A N/A N/A N/A 186 $550 $600 $650 390 $658 $710 $760 264 $820 $870 $950 84 $968 $1,025 $1,163 HOUSE APARTMENT/FLAT Market rent in Castor Bay 6 Months ending 31/03/2024 BONDS 417 $598 LOWER $895 MEDIAN $1,150 UPPER SIZE BONDS RECEIVED LOWER QUARTILE MEDIAN RENT UPPER QUARTILE 1 2 3 4 5+ SIZE BONDS RECEIVED LOWER QUARTILE MEDIAN RENT UPPER QUARTILE 1 N/A N/A N/A N/A 2 3 N/A N/A N/A N/A N/A N/A N/A N/A N/A N/A N/A N/A 51 $550 $588 $720 93 $700 $895 $1,100 105 $1,100 $1,200 $1,350 39 $1,000 $1,050 $1,100 HOUSE APARTMENT/FLAT

Market rent in Chatswood

The data shown on this page is sourced from the Ministry of Business, Innovation & Employment NZ - Tenancy Services for the period shown. Summary totals include averages for some types of property not shown. The market rent information comes from bond data. The results may not be a true indication of the rental market, as they only reflect properties where bonds have been lodged in the previous 6 months. More information is available at https://www.tenancy.govt.nz/rent-bond-and-bills/market-rent/market-rent-explained. Reproduction of market data is permitted under the terms of the Creative Commons Attribution 3.0 New Zealand License - https://creativecommons.org/licenses/by/3.0/nz/. Every reasonable effort has been made to ensure the accuracy of the information in this report. Barfoot and Thompson Limited (REA2008) accepts no responsibility should the contents of this market report prove to be incomplete or incorrect.
6 Months ending 31/03/2024 BONDS 186 $740 LOWER $890 MEDIAN $940 UPPER SIZE BONDS RECEIVED LOWER QUARTILE MEDIAN RENT UPPER QUARTILE 1 2 3 4 5+ SIZE BONDS RECEIVED LOWER QUARTILE MEDIAN RENT UPPER QUARTILE 1 N/A N/A N/A N/A 2 3 N/A N/A N/A N/A N/A N/A N/A N/A N/A N/A N/A N/A N/A N/A N/A N/A 39 $778 $800 $950 54 $825 $895 $900 33 $898 $935 $998 HOUSE APARTMENT/FLAT Market rent in Devonport 6 Months ending 31/03/2024 BONDS 708 $578 LOWER $725 MEDIAN $898 UPPER SIZE BONDS RECEIVED LOWER QUARTILE MEDIAN RENT UPPER QUARTILE 1 2 3 4 5+ SIZE BONDS RECEIVED LOWER QUARTILE MEDIAN RENT UPPER QUARTILE 1 39 $491 $548 $579 2 3 69 $569 $623 $691 N/A N/A N/A N/A N/A N/A N/A N/A 96 $678 $750 $780 135 $785 $880 $960 84 $950 $1,125 $1,288 N/A N/A N/A N/A HOUSE APARTMENT/FLAT Market rent in Eden Terrace 6 Months ending 31/03/2024 BONDS 1503 $420 LOWER $570 MEDIAN $690 UPPER SIZE BONDS RECEIVED LOWER QUARTILE MEDIAN RENT UPPER QUARTILE 1 2 3 4 5+ SIZE BONDS RECEIVED LOWER QUARTILE MEDIAN RENT UPPER QUARTILE 1 387 $430 $530 $595 2 3 423 $589 $633 $696 51 $695 $795 $890 72 $440 $485 $535 108 $630 $670 $735 48 $800 $890 $920 27 $946 $1,075 $1,138 N/A N/A N/A N/A HOUSE APARTMENT/FLAT Market rent in Ellerslie 6 Months ending 31/03/2024 BONDS 1584 $543 LOWER $640 MEDIAN $750 UPPER SIZE BONDS RECEIVED LOWER QUARTILE MEDIAN RENT UPPER QUARTILE 1 2 3 4 5+ SIZE BONDS RECEIVED LOWER QUARTILE MEDIAN RENT UPPER QUARTILE 1 48 $466 $513 $581 2 3 105 $560 $650 $715 18 $670 $695 $728 75 $499 $550 $595 273 $600 $650 $700 432 $720 $760 $850 135 $860 $900 $1,065 N/A N/A N/A N/A HOUSE APARTMENT/FLAT

Market rent in Epsom

The data shown on this page is sourced from the Ministry of Business, Innovation & Employment NZ - Tenancy Services for the period shown. Summary totals include averages for some types of property not shown. The market rent information comes from bond data. The results may not be a true indication of the rental market, as they only reflect properties where bonds have been lodged in the previous 6 months. More information is available at https://www.tenancy.govt.nz/rent-bond-and-bills/market-rent/market-rent-explained. Reproduction of market data is permitted under the terms of the Creative Commons Attribution 3.0 New Zealand License - https://creativecommons.org/licenses/by/3.0/nz/. Every reasonable effort has been made to ensure the accuracy of the information in this report. Barfoot and Thompson Limited (REA2008) accepts no responsibility should the contents of this market report prove to be incomplete or incorrect.
6 Months ending 31/03/2024 BONDS 3081 $560 LOWER $720 MEDIAN $1,000 UPPER SIZE BONDS RECEIVED LOWER QUARTILE MEDIAN RENT UPPER QUARTILE 1 2 3 4 5+ SIZE BONDS RECEIVED LOWER QUARTILE MEDIAN RENT UPPER QUARTILE 1 141 $473 $520 $550 2 3 219 $630 $695 $780 57 $723 $848 $988 96 $450 $545 $646 312 $599 $650 $696 468 $751 $850 $980 387 $1,000 $1,125 $1,300 195 $1,165 $1,300 $1,550 HOUSE APARTMENT/FLAT Market rent in Forrest Hill 6 Months ending 31/03/2024 BONDS 1215 $645 LOWER $730 MEDIAN $880 UPPER SIZE BONDS RECEIVED LOWER QUARTILE MEDIAN RENT UPPER QUARTILE 1 2 3 4 5+ SIZE BONDS RECEIVED LOWER QUARTILE MEDIAN RENT UPPER QUARTILE 1 N/A N/A N/A N/A 2 3 66 $605 $623 $629 N/A N/A N/A N/A N/A N/A N/A N/A 156 $550 $600 $620 465 $699 $723 $763 246 $823 $885 $950 78 $940 $1,100 $1,200 HOUSE APARTMENT/FLAT Market rent in Freemans Bay 6 Months ending 31/03/2024 BONDS 828 $550 LOWER $700 MEDIAN $925 UPPER SIZE BONDS RECEIVED LOWER QUARTILE MEDIAN RENT UPPER QUARTILE 1 2 3 4 5+ SIZE BONDS RECEIVED LOWER QUARTILE MEDIAN RENT UPPER QUARTILE 1 111 $475 $550 $730 2 3 198 $595 $685 $774 24 $889 $955 $1,325 30 $358 $435 $631 75 $700 $735 $798 114 $958 $1,250 $1,631 39 $1,350 $1,350 $1,459 N/A N/A N/A N/A HOUSE APARTMENT/FLAT Market rent in Glen Eden 6 Months ending 31/03/2024 BONDS 2304 $589 LOWER $620 MEDIAN $690 UPPER SIZE BONDS RECEIVED LOWER QUARTILE MEDIAN RENT UPPER QUARTILE 1 2 3 4 5+ SIZE BONDS RECEIVED LOWER QUARTILE MEDIAN RENT UPPER QUARTILE 1 81 $375 $415 $450 2 3 114 $465 $495 $521 N/A N/A N/A N/A 45 $273 $415 $483 402 $578 $595 $600 975 $620 $650 $690 261 $700 $745 $795 51 $875 $900 $1,065 HOUSE APARTMENT/FLAT

Market rent in Glen Innes

The data shown on this page is sourced from the Ministry of Business, Innovation & Employment NZ - Tenancy Services for the period shown. Summary totals include averages for some types of property not shown. The market rent information comes from bond data. The results may not be a true indication of the rental market, as they only reflect properties where bonds have been lodged in the previous 6 months. More information is available at https://www.tenancy.govt.nz/rent-bond-and-bills/market-rent/market-rent-explained. Reproduction of market data is permitted under the terms of the Creative Commons Attribution 3.0 New Zealand License - https://creativecommons.org/licenses/by/3.0/nz/. Every reasonable effort has been made to ensure the accuracy of the information in this report. Barfoot and Thompson Limited (REA2008) accepts no responsibility should the contents of this market report prove to be incomplete or incorrect.
6 Months ending 31/03/2024 BONDS 633 $635 LOWER $670 MEDIAN $785 UPPER SIZE BONDS RECEIVED LOWER QUARTILE MEDIAN RENT UPPER QUARTILE 1 2 3 4 5+ SIZE BONDS RECEIVED LOWER QUARTILE MEDIAN RENT UPPER QUARTILE 1 27 $525 $540 $558 2 3 54 $635 $650 $670 9 $674 $765 $770 27 $530 $550 $555 63 $650 $695 $695 246 $700 $760 $818 87 $840 $900 $920 N/A N/A N/A N/A HOUSE APARTMENT/FLAT Market rent in Glendene 6 Months ending 31/03/2024 BONDS 744 $550 LOWER $645 MEDIAN $726 UPPER SIZE BONDS RECEIVED LOWER QUARTILE MEDIAN RENT UPPER QUARTILE 1 2 3 4 5+ SIZE BONDS RECEIVED LOWER QUARTILE MEDIAN RENT UPPER QUARTILE 1 N/A N/A N/A N/A 2 3 45 $460 $540 $545 N/A N/A N/A N/A N/A N/A N/A N/A 111 $540 $550 $600 318 $618 $650 $700 72 $780 $795 $850 30 $949 $1,003 $1,049 HOUSE APARTMENT/FLAT Market rent in Glendowie 6 Months ending 31/03/2024 BONDS 561 $700 LOWER $850 MEDIAN $1,100 UPPER SIZE BONDS RECEIVED LOWER QUARTILE MEDIAN RENT UPPER QUARTILE 1 2 3 4 5+ SIZE BONDS RECEIVED LOWER QUARTILE MEDIAN RENT UPPER QUARTILE 1 N/A N/A N/A N/A 2 3 45 $529 $590 $619 N/A N/A N/A N/A N/A N/A N/A N/A 36 $645 $673 $701 174 $796 $818 $885 114 $950 $1,100 $1,180 N/A N/A N/A N/A HOUSE APARTMENT/FLAT Market rent in Glenfield 6 Months ending 31/03/2024 BONDS 2178 $600 LOWER $675 MEDIAN $750 UPPER SIZE BONDS RECEIVED LOWER QUARTILE MEDIAN RENT UPPER QUARTILE 1 2 3 4 5+ SIZE BONDS RECEIVED LOWER QUARTILE MEDIAN RENT UPPER QUARTILE 1 69 $348 $375 $395 2 3 147 $545 $565 $585 N/A N/A N/A N/A 45 $445 $483 $509 345 $560 $595 $610 885 $660 $700 $750 273 $784 $820 $894 81 $955 $985 $1,038 HOUSE APARTMENT/FLAT

Market rent in Grafton

The data shown on this page is sourced from the Ministry of Business, Innovation & Employment NZ - Tenancy Services for the period shown. Summary totals include averages for some types of property not shown. The market rent information comes from bond data. The results may not be a true indication of the rental market, as they only reflect properties where bonds have been lodged in the previous 6 months. More information is available at https://www.tenancy.govt.nz/rent-bond-and-bills/market-rent/market-rent-explained. Reproduction of market data is permitted under the terms of the Creative Commons Attribution 3.0 New Zealand License - https://creativecommons.org/licenses/by/3.0/nz/. Every reasonable effort has been made to ensure the accuracy of the information in this report. Barfoot and Thompson Limited (REA2008) accepts no responsibility should the contents of this market report prove to be incomplete or incorrect.
6 Months ending 31/03/2024 BONDS 2277 $300 LOWER $419 MEDIAN $508 UPPER SIZE BONDS RECEIVED LOWER QUARTILE MEDIAN RENT UPPER QUARTILE 1 2 3 4 5+ SIZE BONDS RECEIVED LOWER QUARTILE MEDIAN RENT UPPER QUARTILE 1 348 $400 $450 $521 2 3 375 $555 $620 $735 84 $603 $750 $795 525 $300 $300 $300 102 $510 $645 $698 57 $838 $900 $1,075 N/A N/A N/A N/A N/A N/A N/A N/A HOUSE APARTMENT/FLAT Market rent in Greenhithe 6 Months ending 31/03/2024 BONDS 564 $590 LOWER $790 MEDIAN $1,000 UPPER SIZE BONDS RECEIVED LOWER QUARTILE MEDIAN RENT UPPER QUARTILE 1 2 3 4 5+ SIZE BONDS RECEIVED LOWER QUARTILE MEDIAN RENT UPPER QUARTILE 1 N/A N/A N/A N/A 2 3 N/A N/A N/A N/A N/A N/A N/A N/A N/A N/A N/A N/A 93 $573 $595 $688 78 $713 $770 $790 156 $825 $900 $1,050 84 $1,100 $1,150 $1,200 HOUSE APARTMENT/FLAT Market rent in Greenlane 6 Months ending 31/03/2024 BONDS 936 $650 LOWER $780 MEDIAN $984 UPPER SIZE BONDS RECEIVED LOWER QUARTILE MEDIAN RENT UPPER QUARTILE 1 2 3 4 5+ SIZE BONDS RECEIVED LOWER QUARTILE MEDIAN RENT UPPER QUARTILE 1 N/A N/A N/A N/A 2 3 36 $600 $630 $643 N/A N/A N/A N/A N/A N/A N/A N/A 126 $605 $650 $698 267 $770 $800 $900 141 $980 $1,095 $1,188 69 $1,124 $1,225 $1,329 HOUSE APARTMENT/FLAT Market rent in Henderson 6 Months ending 31/03/2024 BONDS 3612 $570 LOWER $650 MEDIAN $740 UPPER SIZE BONDS RECEIVED LOWER QUARTILE MEDIAN RENT UPPER QUARTILE 1 2 3 4 5+ SIZE BONDS RECEIVED LOWER QUARTILE MEDIAN RENT UPPER QUARTILE 1 66 $395 $410 $420 2 3 141 $515 $550 $553 N/A N/A N/A N/A 66 $420 $450 $493 435 $540 $593 $600 1572 $634 $670 $705 537 $773 $810 $850 153 $820 $900 $1,000 HOUSE APARTMENT/FLAT

List with a good listener.

At Barfoot & Thompson, we understand that every buyer’s needs are unique, and so we take the time to personalise our service accordingly. Once our salespeople have sat down with you to determine the right type of buyers for your property, we’ll produce a customised marketing plan that works with your budget and timeframe. We want you to

be 100% confident and happy with the process, so we’ll never force you into a rushed decision. We believe getting you a result is only half the job –you also need to be completely satisfied with how we get there. No wonder we make one in three of Auckland’s property sales every day. Check out our website to find out more.

barfoot.co.nz

Market rent in Herne Bay

The data shown on this page is sourced from the Ministry of Business, Innovation & Employment NZ - Tenancy Services for the period shown. Summary totals include averages for some types of property not shown. The market rent information comes from bond data. The results may not be a true indication of the rental market, as they only reflect properties where bonds have been lodged in the previous 6 months. More information is available at https://www.tenancy.govt.nz/rent-bond-and-bills/market-rent/market-rent-explained. Reproduction of market data is permitted under the terms of the Creative Commons Attribution 3.0 New Zealand License - https://creativecommons.org/licenses/by/3.0/nz/. Every reasonable effort has been made to ensure the accuracy of the information in this report. Barfoot and Thompson Limited (REA2008) accepts no responsibility should the contents of this market report prove to be incomplete or incorrect.
6 Months ending 31/03/2024 BONDS 528 $620 LOWER $800 MEDIAN $1,250 UPPER SIZE BONDS RECEIVED LOWER QUARTILE MEDIAN RENT UPPER QUARTILE 1 2 3 4 5+ SIZE BONDS RECEIVED LOWER QUARTILE MEDIAN RENT UPPER QUARTILE 1 90 $484 $608 $699 2 3 75 $645 $723 $850 21 $1,529 $1,908 $2,154 N/A N/A N/A N/A 33 $568 $695 $793 75 $985 $1,125 $1,334 36 $1,400 $1,600 $1,950 12 $1,488 $1,925 $2,575 HOUSE APARTMENT/FLAT Market rent in Hillcrest 6 Months ending 31/03/2024 BONDS 1302 $580 LOWER $655 MEDIAN $773 UPPER SIZE BONDS RECEIVED LOWER QUARTILE MEDIAN RENT UPPER QUARTILE 1 2 3 4 5+ SIZE BONDS RECEIVED LOWER QUARTILE MEDIAN RENT UPPER QUARTILE 1 N/A N/A N/A N/A 2 3 141 $518 $565 $605 24 $545 $615 $684 24 $436 $450 $456 249 $560 $590 $625 363 $680 $720 $763 165 $800 $910 $1,000 69 $909 $1,000 $1,163 HOUSE APARTMENT/FLAT Market rent in Hillsborough 6 Months ending 31/03/2024 BONDS 783 $630 LOWER $770 MEDIAN $890 UPPER SIZE BONDS RECEIVED LOWER QUARTILE MEDIAN RENT UPPER QUARTILE 1 2 3 4 5+ SIZE BONDS RECEIVED LOWER QUARTILE MEDIAN RENT UPPER QUARTILE 1 N/A N/A N/A N/A 2 3 45 $581 $590 $599 N/A N/A N/A N/A N/A N/A N/A N/A N/A N/A N/A N/A 207 $658 $695 $776 153 $800 $860 $900 66 $995 $1,095 $1,150 HOUSE APARTMENT/FLAT Market rent in Kohimarama 6 Months ending 31/03/2024 BONDS 495 $705 LOWER $880 MEDIAN $1,150 UPPER SIZE BONDS RECEIVED LOWER QUARTILE MEDIAN RENT UPPER QUARTILE 1 2 3 4 5+ SIZE BONDS RECEIVED LOWER QUARTILE MEDIAN RENT UPPER QUARTILE 1 N/A N/A N/A N/A 2 3 51 $633 $690 $766 N/A N/A N/A N/A N/A N/A N/A N/A 57 $600 $675 $750 102 $850 $925 $1,161 78 $955 $1,000 $1,200 24 $1,025 $1,300 $1,413 HOUSE APARTMENT/FLAT

Market rent in Mairangi Bay

The data shown on this page is sourced from the Ministry of Business, Innovation & Employment NZ - Tenancy Services for the period shown. Summary totals include averages for some types of property not shown. The market rent information comes from bond data. The results may not be a true indication of the rental market, as they only reflect properties where bonds have been lodged in the previous 6 months. More information is available at https://www.tenancy.govt.nz/rent-bond-and-bills/market-rent/market-rent-explained. Reproduction of market data is permitted under the terms of the Creative Commons Attribution 3.0 New Zealand License - https://creativecommons.org/licenses/by/3.0/nz/. Every reasonable effort has been made to ensure the accuracy of the information in this report. Barfoot and Thompson Limited (REA2008) accepts no responsibility should the contents of this market report prove to be incomplete or incorrect.
6 Months ending 31/03/2024 BONDS 513 $618 LOWER $760 MEDIAN $920 UPPER SIZE BONDS RECEIVED LOWER QUARTILE MEDIAN RENT UPPER QUARTILE 1 2 3 4 5+ SIZE BONDS RECEIVED LOWER QUARTILE MEDIAN RENT UPPER QUARTILE 1 21 $416 $460 $494 2 3 N/A N/A N/A N/A N/A N/A N/A N/A N/A N/A N/A N/A 57 $581 $608 $628 126 $750 $780 $850 129 $850 $950 $995 45 $883 $1,040 $1,175 HOUSE APARTMENT/FLAT Market rent in Mangere Bridge 6 Months ending 31/03/2024 BONDS 972 $604 LOWER $675 MEDIAN $770 UPPER SIZE BONDS RECEIVED LOWER QUARTILE MEDIAN RENT UPPER QUARTILE 1 2 3 4 5+ SIZE BONDS RECEIVED LOWER QUARTILE MEDIAN RENT UPPER QUARTILE 1 51 $404 $410 $416 2 3 N/A N/A N/A N/A N/A N/A N/A N/A 33 $450 $520 $548 159 $620 $650 $695 333 $675 $730 $750 114 $825 $850 $893 N/A N/A N/A N/A HOUSE APARTMENT/FLAT Market rent in Massey 6 Months ending 31/03/2024 BONDS 2565 $600 LOWER $670 MEDIAN $750 UPPER SIZE BONDS RECEIVED LOWER QUARTILE MEDIAN RENT UPPER QUARTILE 1 2 3 4 5+ SIZE BONDS RECEIVED LOWER QUARTILE MEDIAN RENT UPPER QUARTILE 1 54 $366 $413 $431 2 3 N/A N/A N/A N/A 24 $598 $600 $675 39 $405 $463 $485 261 $550 $595 $620 1245 $620 $670 $715 447 $750 $790 $845 126 $850 $900 $1,000 HOUSE APARTMENT/FLAT Market rent in Meadowbank 6 Months ending 31/03/2024 BONDS 594 $550 LOWER $680 MEDIAN $835 UPPER SIZE BONDS RECEIVED LOWER QUARTILE MEDIAN RENT UPPER QUARTILE 1 2 3 4 5+ SIZE BONDS RECEIVED LOWER QUARTILE MEDIAN RENT UPPER QUARTILE 1 60 $330 $375 $445 2 3 117 $525 $570 $658 N/A N/A N/A N/A N/A N/A N/A N/A 63 $586 $650 $713 135 $710 $760 $828 54 $950 $990 $1,100 N/A N/A N/A N/A HOUSE APARTMENT/FLAT

Market rent in Milford

The data shown on this page is sourced from the Ministry of Business, Innovation & Employment NZ - Tenancy Services for the period shown. Summary totals include averages for some types of property not shown. The market rent information comes from bond data. The results may not be a true indication of the rental market, as they only reflect properties where bonds have been lodged in the previous 6 months. More information is available at https://www.tenancy.govt.nz/rent-bond-and-bills/market-rent/market-rent-explained. Reproduction of market data is permitted under the terms of the Creative Commons Attribution 3.0 New Zealand License - https://creativecommons.org/licenses/by/3.0/nz/. Every reasonable effort has been made to ensure the accuracy of the information in this report. Barfoot and Thompson Limited (REA2008) accepts no responsibility should the contents of this market report prove to be incomplete or incorrect.
6 Months ending 31/03/2024 BONDS 1338 $550 LOWER $665 MEDIAN $835 UPPER SIZE BONDS RECEIVED LOWER QUARTILE MEDIAN RENT UPPER QUARTILE 1 2 3 4 5+ SIZE BONDS RECEIVED LOWER QUARTILE MEDIAN RENT UPPER QUARTILE 1 123 $399 $430 $450 2 3 96 $570 $630 $690 N/A N/A N/A N/A 39 $355 $438 $470 240 $600 $635 $695 258 $750 $800 $875 144 $841 $925 $1,138 36 $1,025 $1,050 $1,145 HOUSE APARTMENT/FLAT Market rent in Mission Bay 6 Months ending 31/03/2024 BONDS 684 $599 LOWER $800 MEDIAN $1,000 UPPER SIZE BONDS RECEIVED LOWER QUARTILE MEDIAN RENT UPPER QUARTILE 1 2 3 4 5+ SIZE BONDS RECEIVED LOWER QUARTILE MEDIAN RENT UPPER QUARTILE 1 45 $440 $500 $550 2 3 99 $600 $660 $750 12 $901 $1,130 $1,406 N/A N/A N/A N/A 69 $573 $680 $830 120 $835 $898 $999 66 $1,025 $1,250 $1,575 N/A N/A N/A N/A HOUSE APARTMENT/FLAT Market rent in Mt Albert 6 Months ending 31/03/2024 BONDS 2697 $530 LOWER $620 MEDIAN $775 UPPER SIZE BONDS RECEIVED LOWER QUARTILE MEDIAN RENT UPPER QUARTILE 1 2 3 4 5+ SIZE BONDS RECEIVED LOWER QUARTILE MEDIAN RENT UPPER QUARTILE 1 96 $491 $525 $550 2 3 207 $550 $595 $623 90 $565 $638 $700 54 $300 $450 $500 372 $570 $620 $695 549 $690 $780 $843 243 $835 $950 $995 105 $1,060 $1,165 $1,258 HOUSE APARTMENT/FLAT Market rent in Mt Eden 6 Months ending 31/03/2024 BONDS 4338 $495 LOWER $620 MEDIAN $820 UPPER SIZE BONDS RECEIVED LOWER QUARTILE MEDIAN RENT UPPER QUARTILE 1 2 3 4 5+ SIZE BONDS RECEIVED LOWER QUARTILE MEDIAN RENT UPPER QUARTILE 1 444 $450 $495 $563 2 3 459 $570 $650 $723 72 $600 $675 $725 195 $430 $475 $538 390 $568 $630 $720 591 $750 $800 $900 378 $900 $1,038 $1,295 144 $1,200 $1,300 $1,484 HOUSE APARTMENT/FLAT

Market rent in Mt Wellington

The data shown on this page is sourced from the Ministry of Business, Innovation & Employment NZ - Tenancy Services for the period shown. Summary totals include averages for some types of property not shown. The market rent information comes from bond data. The results may not be a true indication of the rental market, as they only reflect properties where bonds have been lodged in the previous 6 months. More information is available at https://www.tenancy.govt.nz/rent-bond-and-bills/market-rent/market-rent-explained. Reproduction of market data is permitted under the terms of the Creative Commons Attribution 3.0 New Zealand License - https://creativecommons.org/licenses/by/3.0/nz/. Every reasonable effort has been made to ensure the accuracy of the information in this report. Barfoot and Thompson Limited (REA2008) accepts no responsibility should the contents of this market report prove to be incomplete or incorrect.
6 Months ending 31/03/2024 BONDS 4020 $560 LOWER $660 MEDIAN $750 UPPER SIZE BONDS RECEIVED LOWER QUARTILE MEDIAN RENT UPPER QUARTILE 1 2 3 4 5+ SIZE BONDS RECEIVED LOWER QUARTILE MEDIAN RENT UPPER QUARTILE 1 78 $400 $450 $500 2 3 222 $525 $560 $620 57 $704 $740 $761 72 $360 $405 $455 681 $560 $603 $660 1227 $680 $730 $770 429 $800 $895 $958 81 $938 $1,005 $1,125 HOUSE APARTMENT/FLAT Market rent in Murrays Bay 6 Months ending 31/03/2024 BONDS 411 $650 LOWER $790 MEDIAN $928 UPPER SIZE BONDS RECEIVED LOWER QUARTILE MEDIAN RENT UPPER QUARTILE 1 2 3 4 5+ SIZE BONDS RECEIVED LOWER QUARTILE MEDIAN RENT UPPER QUARTILE 1 N/A N/A N/A N/A 2 3 N/A N/A N/A N/A N/A N/A N/A N/A N/A N/A N/A N/A 45 $550 $650 $660 123 $690 $775 $860 99 $920 $970 $1,010 39 $1,085 $1,275 $1,400 HOUSE APARTMENT/FLAT Market rent in New Lynn 6 Months ending 31/03/2024 BONDS 2937 $515 LOWER $620 MEDIAN $680 UPPER SIZE BONDS RECEIVED LOWER QUARTILE MEDIAN RENT UPPER QUARTILE 1 2 3 4 5+ SIZE BONDS RECEIVED LOWER QUARTILE MEDIAN RENT UPPER QUARTILE 1 156 $400 $430 $454 2 3 114 $508 $550 $596 N/A N/A N/A N/A 54 $375 $400 $450 528 $530 $570 $620 984 $650 $665 $700 273 $700 $780 $830 51 $950 $950 $960 HOUSE APARTMENT/FLAT Market rent in Newmarket 6 Months ending 31/03/2024 BONDS 663 $580 LOWER $630 MEDIAN $720 UPPER SIZE BONDS RECEIVED LOWER QUARTILE MEDIAN RENT UPPER QUARTILE 1 2 3 4 5+ SIZE BONDS RECEIVED LOWER QUARTILE MEDIAN RENT UPPER QUARTILE 1 108 $429 $495 $528 2 3 258 $595 $620 $650 93 $780 $790 $820 N/A N/A N/A N/A 42 $630 $655 $688 N/A N/A N/A N/A N/A N/A N/A N/A N/A N/A N/A N/A HOUSE APARTMENT/FLAT

Market rent in Northcote

The data shown on this page is sourced from the Ministry of Business, Innovation & Employment NZ - Tenancy Services for the period shown. Summary totals include averages for some types of property not shown. The market rent information comes from bond data. The results may not be a true indication of the rental market, as they only reflect properties where bonds have been lodged in the previous 6 months. More information is available at https://www.tenancy.govt.nz/rent-bond-and-bills/market-rent/market-rent-explained. Reproduction of market data is permitted under the terms of the Creative Commons Attribution 3.0 New Zealand License - https://creativecommons.org/licenses/by/3.0/nz/. Every reasonable effort has been made to ensure the accuracy of the information in this report. Barfoot and Thompson Limited (REA2008) accepts no responsibility should the contents of this market report prove to be incomplete or incorrect.
6 Months ending 31/03/2024 BONDS 1083 $570 LOWER $653 MEDIAN $820 UPPER SIZE BONDS RECEIVED LOWER QUARTILE MEDIAN RENT UPPER QUARTILE 1 2 3 4 5+ SIZE BONDS RECEIVED LOWER QUARTILE MEDIAN RENT UPPER QUARTILE 1 N/A N/A N/A N/A 2 3 102 $585 $630 $640 N/A N/A N/A N/A 24 $364 $418 $439 150 $560 $588 $643 306 $680 $738 $800 132 $840 $900 $1,000 42 $873 $975 $1,098 HOUSE APARTMENT/FLAT Market rent in Northcote Point 6 Months ending 31/03/2024 BONDS 243 $558 LOWER $705 MEDIAN $805 UPPER SIZE BONDS RECEIVED LOWER QUARTILE MEDIAN RENT UPPER QUARTILE 1 2 3 4 5+ SIZE BONDS RECEIVED LOWER QUARTILE MEDIAN RENT UPPER QUARTILE 1 15 $523 $568 $601 2 3 N/A N/A N/A N/A N/A N/A N/A N/A N/A N/A N/A N/A 45 $618 $700 $718 63 $790 $820 $893 N/A N/A N/A N/A N/A N/A N/A N/A HOUSE APARTMENT/FLAT Market rent in One Tree Hill 6 Months ending 31/03/2024 BONDS 630 $600 LOWER $730 MEDIAN $795 UPPER SIZE BONDS RECEIVED LOWER QUARTILE MEDIAN RENT UPPER QUARTILE 1 2 3 4 5+ SIZE BONDS RECEIVED LOWER QUARTILE MEDIAN RENT UPPER QUARTILE 1 N/A N/A N/A N/A 2 3 105 $534 $578 $628 N/A N/A N/A N/A N/A N/A N/A N/A 102 $570 $600 $650 180 $738 $775 $791 57 $850 $945 $1,250 N/A N/A N/A N/A HOUSE APARTMENT/FLAT Market rent in Onehunga 6 Months ending 31/03/2024 BONDS 2556 $564 LOWER $650 MEDIAN $780 UPPER SIZE BONDS RECEIVED LOWER QUARTILE MEDIAN RENT UPPER QUARTILE 1 2 3 4 5+ SIZE BONDS RECEIVED LOWER QUARTILE MEDIAN RENT UPPER QUARTILE 1 90 $490 $550 $590 2 3 219 $599 $668 $700 27 $686 $730 $743 96 $425 $450 $485 471 $560 $585 $630 579 $700 $750 $813 210 $850 $900 $950 42 $965 $1,250 $1,295 HOUSE APARTMENT/FLAT

Market rent in Orakei

The data shown on this page is sourced from the Ministry of Business, Innovation & Employment NZ - Tenancy Services for the period shown. Summary totals include averages for some types of property not shown. The market rent information comes from bond data. The results may not be a true indication of the rental market, as they only reflect properties where bonds have been lodged in the previous 6 months. More information is available at https://www.tenancy.govt.nz/rent-bond-and-bills/market-rent/market-rent-explained. Reproduction of market data is permitted under the terms of the Creative Commons Attribution 3.0 New Zealand License - https://creativecommons.org/licenses/by/3.0/nz/. Every reasonable effort has been made to ensure the accuracy of the information in this report. Barfoot and Thompson Limited (REA2008) accepts no responsibility should the contents of this market report prove to be incomplete or incorrect.
6 Months ending 31/03/2024 BONDS 522 $711 LOWER $850 MEDIAN $1,000 UPPER SIZE BONDS RECEIVED LOWER QUARTILE MEDIAN RENT UPPER QUARTILE 1 2 3 4 5+ SIZE BONDS RECEIVED LOWER QUARTILE MEDIAN RENT UPPER QUARTILE 1 N/A N/A N/A N/A 2 3 63 $700 $805 $900 N/A N/A N/A N/A N/A N/A N/A N/A 66 $680 $760 $810 138 $773 $850 $900 72 $1,020 $1,125 $1,194 N/A N/A N/A N/A HOUSE APARTMENT/FLAT Market rent in Panmure 6 Months ending 31/03/2024 BONDS 804 $535 LOWER $595 MEDIAN $695 UPPER SIZE BONDS RECEIVED LOWER QUARTILE MEDIAN RENT UPPER QUARTILE 1 2 3 4 5+ SIZE BONDS RECEIVED LOWER QUARTILE MEDIAN RENT UPPER QUARTILE 1 N/A N/A N/A N/A 2 3 30 $373 $490 $554 N/A N/A N/A N/A N/A N/A N/A N/A 126 $543 $578 $595 261 $640 $680 $720 78 $738 $780 $805 N/A N/A N/A N/A HOUSE APARTMENT/FLAT Market rent in Parnell 6 Months ending 31/03/2024 BONDS 1623 $535 LOWER $725 MEDIAN $885 UPPER SIZE BONDS RECEIVED LOWER QUARTILE MEDIAN RENT UPPER QUARTILE 1 2 3 4 5+ SIZE BONDS RECEIVED LOWER QUARTILE MEDIAN RENT UPPER QUARTILE 1 270 $498 $530 $580 2 3 267 $688 $750 $825 99 $735 $885 $1,063 54 $453 $510 $539 117 $695 $745 $796 282 $800 $849 $988 87 $1,005 $1,245 $1,500 N/A N/A N/A N/A HOUSE APARTMENT/FLAT Market rent in Pinehill 6 Months ending 31/03/2024 BONDS 474 $580 LOWER $730 MEDIAN $900 UPPER SIZE BONDS RECEIVED LOWER QUARTILE MEDIAN RENT UPPER QUARTILE 1 2 3 4 5+ SIZE BONDS RECEIVED LOWER QUARTILE MEDIAN RENT UPPER QUARTILE 1 N/A N/A N/A N/A 2 3 N/A N/A N/A N/A N/A N/A N/A N/A N/A N/A N/A N/A 69 $558 $580 $660 78 $703 $755 $800 93 $850 $850 $900 90 $1,099 $1,150 $1,275 HOUSE APARTMENT/FLAT

Market rent in Point Chevalier

The data shown on this page is sourced from the Ministry of Business, Innovation & Employment NZ - Tenancy Services for the period shown. Summary totals include averages for some types of property not shown. The market rent information comes from bond data. The results may not be a true indication of the rental market, as they only reflect properties where bonds have been lodged in the previous 6 months. More information is available at https://www.tenancy.govt.nz/rent-bond-and-bills/market-rent/market-rent-explained. Reproduction of market data is permitted under the terms of the Creative Commons Attribution 3.0 New Zealand License - https://creativecommons.org/licenses/by/3.0/nz/. Every reasonable effort has been made to ensure the accuracy of the information in this report. Barfoot and Thompson Limited (REA2008) accepts no responsibility should the contents of this market report prove to be incomplete or incorrect.
6 Months ending 31/03/2024 BONDS 792 $465 LOWER $700 MEDIAN $898 UPPER SIZE BONDS RECEIVED LOWER QUARTILE MEDIAN RENT UPPER QUARTILE 1 2 3 4 5+ SIZE BONDS RECEIVED LOWER QUARTILE MEDIAN RENT UPPER QUARTILE 1 42 $450 $475 $609 2 3 30 $614 $673 $735 N/A N/A N/A N/A 30 $455 $470 $525 120 $611 $678 $751 264 $800 $880 $980 72 $978 $1,300 $1,300 N/A N/A N/A N/A HOUSE APARTMENT/FLAT Market rent in Ponsonby 6 Months ending 31/03/2024 BONDS 699 $533 LOWER $788 MEDIAN $1,000 UPPER SIZE BONDS RECEIVED LOWER QUARTILE MEDIAN RENT UPPER QUARTILE 1 2 3 4 5+ SIZE BONDS RECEIVED LOWER QUARTILE MEDIAN RENT UPPER QUARTILE 1 75 $520 $558 $596 2 3 N/A N/A N/A N/A N/A N/A N/A N/A N/A N/A N/A N/A 75 $700 $815 $900 204 $900 $980 $1,150 81 $1,075 $1,473 $1,650 N/A N/A N/A N/A HOUSE APARTMENT/FLAT Market rent in Point England 6 Months ending 31/03/2024 BONDS 429 $550 LOWER $650 MEDIAN $750 UPPER SIZE BONDS RECEIVED LOWER QUARTILE MEDIAN RENT UPPER QUARTILE 1 2 3 4 5+ SIZE BONDS RECEIVED LOWER QUARTILE MEDIAN RENT UPPER QUARTILE 1 N/A N/A N/A N/A 2 3 N/A N/A N/A N/A N/A N/A N/A N/A 18 $450 $455 $460 111 $550 $555 $583 129 $660 $695 $755 66 $800 $820 $850 N/A N/A N/A N/A HOUSE APARTMENT/FLAT Market rent in Remuera 6 Months ending 31/03/2024 BONDS 2946 $695 LOWER $860 MEDIAN $1,073 UPPER SIZE BONDS RECEIVED LOWER QUARTILE MEDIAN RENT UPPER QUARTILE 1 2 3 4 5+ SIZE BONDS RECEIVED LOWER QUARTILE MEDIAN RENT UPPER QUARTILE 1 72 $495 $520 $645 2 3 195 $670 $750 $850 75 $758 $853 $1,056 54 $446 $550 $595 294 $650 $700 $833 753 $798 $880 $950 480 $979 $1,150 $1,350 180 $1,290 $1,480 $1,668 HOUSE APARTMENT/FLAT

Market rent in Rothesay Bay

The data shown on this page is sourced from the Ministry of Business, Innovation & Employment NZ - Tenancy Services for the period shown. Summary totals include averages for some types of property not shown. The market rent information comes from bond data. The results may not be a true indication of the rental market, as they only reflect properties where bonds have been lodged in the previous 6 months. More information is available at https://www.tenancy.govt.nz/rent-bond-and-bills/market-rent/market-rent-explained. Reproduction of market data is permitted under the terms of the Creative Commons Attribution 3.0 New Zealand License - https://creativecommons.org/licenses/by/3.0/nz/. Every reasonable effort has been made to ensure the accuracy of the information in this report. Barfoot and Thompson Limited (REA2008) accepts no responsibility should the contents of this market report prove to be incomplete or incorrect.
6 Months ending 31/03/2024 BONDS 303 $591 LOWER $700 MEDIAN $868 UPPER SIZE BONDS RECEIVED LOWER QUARTILE MEDIAN RENT UPPER QUARTILE 1 2 3 4 5+ SIZE BONDS RECEIVED LOWER QUARTILE MEDIAN RENT UPPER QUARTILE 1 15 $400 $450 $460 2 3 N/A N/A N/A N/A N/A N/A N/A N/A N/A N/A N/A N/A 45 $580 $650 $695 69 $665 $700 $745 75 $1,000 $1,150 $1,200 N/A N/A N/A N/A HOUSE APARTMENT/FLAT Market rent in Royal Oak 6 Months ending 31/03/2024 BONDS 801 $590 LOWER $680 MEDIAN $850 UPPER SIZE BONDS RECEIVED LOWER QUARTILE MEDIAN RENT UPPER QUARTILE 1 2 3 4 5+ SIZE BONDS RECEIVED LOWER QUARTILE MEDIAN RENT UPPER QUARTILE 1 N/A N/A N/A N/A 2 3 129 $558 $570 $621 N/A N/A N/A N/A N/A N/A N/A N/A 108 $598 $630 $655 192 $705 $805 $850 84 $940 $1,030 $1,100 27 $1,029 $1,070 $1,200 HOUSE APARTMENT/FLAT Market rent in Sandringham 6 Months ending 31/03/2024 BONDS 1734 $535 LOWER $600 MEDIAN $800 UPPER SIZE BONDS RECEIVED LOWER QUARTILE MEDIAN RENT UPPER QUARTILE 1 2 3 4 5+ SIZE BONDS RECEIVED LOWER QUARTILE MEDIAN RENT UPPER QUARTILE 1 36 $430 $450 $500 2 3 144 $520 $550 $580 N/A N/A N/A N/A 69 $476 $515 $553 252 $550 $580 $610 381 $680 $730 $800 177 $900 $950 $1,000 39 $1,027 $1,150 $1,296 HOUSE APARTMENT/FLAT Market rent in St Heliers 6 Months ending 31/03/2024 BONDS 1257 $680 LOWER $850 MEDIAN $999 UPPER SIZE BONDS RECEIVED LOWER QUARTILE MEDIAN RENT UPPER QUARTILE 1 2 3 4 5+ SIZE BONDS RECEIVED LOWER QUARTILE MEDIAN RENT UPPER QUARTILE 1 81 $410 $425 $460 2 3 153 $580 $610 $698 N/A N/A N/A N/A N/A N/A N/A N/A 138 $643 $720 $771 288 $800 $850 $950 204 $995 $1,200 $1,500 42 $1,150 $1,200 $1,313 HOUSE APARTMENT/FLAT

Market rent in St Johns

The data shown on this page is sourced from the Ministry of Business, Innovation & Employment NZ - Tenancy Services for the period shown. Summary totals include averages for some types of property not shown. The market rent information comes from bond data. The results may not be a true indication of the rental market, as they only reflect properties where bonds have been lodged in the previous 6 months. More information is available at https://www.tenancy.govt.nz/rent-bond-and-bills/market-rent/market-rent-explained. Reproduction of market data is permitted under the terms of the Creative Commons Attribution 3.0 New Zealand License - https://creativecommons.org/licenses/by/3.0/nz/. Every reasonable effort has been made to ensure the accuracy of the information in this report. Barfoot and Thompson Limited (REA2008) accepts no responsibility should the contents of this market report prove to be incomplete or incorrect.
6 Months ending 31/03/2024 BONDS 954 $460 LOWER $625 MEDIAN $815 UPPER SIZE BONDS RECEIVED LOWER QUARTILE MEDIAN RENT UPPER QUARTILE 1 2 3 4 5+ SIZE BONDS RECEIVED LOWER QUARTILE MEDIAN RENT UPPER QUARTILE 1 66 $413 $435 $469 2 3 168 $518 $538 $606 N/A N/A N/A N/A N/A N/A N/A N/A 99 $540 $595 $680 213 $725 $790 $840 117 $885 $995 $1,150 27 $995 $1,040 $1,085 HOUSE APARTMENT/FLAT Market rent in St Marys Bay 6 Months ending 31/03/2024 BONDS 261 $620 LOWER $800 MEDIAN $1,388 UPPER SIZE BONDS RECEIVED LOWER QUARTILE MEDIAN RENT UPPER QUARTILE 1 2 3 4 5+ SIZE BONDS RECEIVED LOWER QUARTILE MEDIAN RENT UPPER QUARTILE 1 51 $485 $525 $575 2 3 27 $644 $663 $694 N/A N/A N/A N/A N/A N/A N/A N/A N/A N/A N/A N/A 48 $950 $1,250 $1,350 24 $1,500 $1,750 $2,063 6 $1,571 $1,673 $1,788 HOUSE APARTMENT/FLAT Market rent in Sunnynook 6 Months ending 31/03/2024 BONDS 708 $650 LOWER $695 MEDIAN $825 UPPER SIZE BONDS RECEIVED LOWER QUARTILE MEDIAN RENT UPPER QUARTILE 1 2 3 4 5+ SIZE BONDS RECEIVED LOWER QUARTILE MEDIAN RENT UPPER QUARTILE 1 N/A N/A N/A N/A 2 3 N/A N/A N/A N/A N/A N/A N/A N/A N/A N/A N/A N/A 84 $575 $610 $646 339 $660 $690 $750 99 $850 $875 $950 24 $850 $930 $965 HOUSE APARTMENT/FLAT Market rent in Takapuna 6 Months ending 31/03/2024 BONDS 1437 $568 LOWER $670 MEDIAN $850 UPPER SIZE BONDS RECEIVED LOWER QUARTILE MEDIAN RENT UPPER QUARTILE 1 2 3 4 5+ SIZE BONDS RECEIVED LOWER QUARTILE MEDIAN RENT UPPER QUARTILE 1 144 $520 $550 $600 2 3 225 $650 $783 $870 48 $763 $1,070 $1,198 48 $454 $515 $600 231 $600 $630 $700 225 $750 $800 $950 120 $860 $1,100 $1,248 33 $945 $1,100 $1,270 HOUSE APARTMENT/FLAT
The data shown on this page is sourced from the Ministry of Business, Innovation & Employment NZ - Tenancy Services for the period shown. Summary totals include averages for some types of property not shown. The market rent information comes from bond data. The results may not be a true indication of the rental market, as they only reflect properties where bonds have been lodged in the previous 6 months. More information is available at https://www.tenancy.govt.nz/rent-bond-and-bills/market-rent/market-rent-explained. Reproduction of market data is permitted under the terms of the Creative Commons Attribution 3.0 New Zealand License - https://creativecommons.org/licenses/by/3.0/nz/. Every reasonable effort has been made to ensure the accuracy of the information in this report. Barfoot and Thompson Limited (REA2008) accepts no responsibility should the contents of this market report prove to be incomplete or incorrect. Market rent in Te Atatu Peninsula 6 Months ending 31/03/2024 BONDS 1689 $600 LOWER $650 MEDIAN $733 UPPER SIZE BONDS RECEIVED LOWER QUARTILE MEDIAN RENT UPPER QUARTILE 1 2 3 4 5+ SIZE BONDS RECEIVED LOWER QUARTILE MEDIAN RENT UPPER QUARTILE 1 N/A N/A N/A N/A 2 3 27 $623 $635 $648 N/A N/A N/A N/A 75 $501 $518 $520 405 $600 $615 $650 651 $650 $680 $700 183 $781 $800 $888 63 $698 $950 $1,100 HOUSE APARTMENT/FLAT Market rent in Te Atatu South 6 Months ending 31/03/2024 BONDS 1890 $580 LOWER $640 MEDIAN $710 UPPER SIZE BONDS RECEIVED LOWER QUARTILE MEDIAN RENT UPPER QUARTILE 1 2 3 4 5+ SIZE BONDS RECEIVED LOWER QUARTILE MEDIAN RENT UPPER QUARTILE 1 N/A N/A N/A N/A 2 3 36 $410 $420 $520 N/A N/A N/A N/A 36 $410 $420 $520 345 $550 $580 $600 699 $633 $670 $700 255 $750 $800 $850 75 $875 $950 $950 HOUSE APARTMENT/FLAT Market rent in Three Kings 6 Months ending 31/03/2024 BONDS 369 $650 LOWER $720 MEDIAN $790 UPPER SIZE BONDS RECEIVED LOWER QUARTILE MEDIAN RENT UPPER QUARTILE 1 2 3 4 5+ SIZE BONDS RECEIVED LOWER QUARTILE MEDIAN RENT UPPER QUARTILE 1 N/A N/A N/A N/A 2 3 27 $535 $550 $583 N/A N/A N/A N/A N/A N/A N/A N/A 57 $650 $670 $700 105 $715 $730 $753 48 $855 $900 $975 N/A N/A N/A N/A HOUSE APARTMENT/FLAT Market rent in Torbay 6 Months ending 31/03/2024 BONDS 1263 $640 LOWER $750 MEDIAN $850 UPPER SIZE BONDS RECEIVED LOWER QUARTILE MEDIAN RENT UPPER QUARTILE 1 2 3 4 5+ SIZE BONDS RECEIVED LOWER QUARTILE MEDIAN RENT UPPER QUARTILE 1 N/A N/A N/A N/A 2 3 51 $480 $490 $563 N/A N/A N/A N/A N/A N/A N/A N/A 153 $530 $593 $650 435 $680 $710 $761 282 $840 $880 $928 81 $800 $965 $1,275 HOUSE APARTMENT/FLAT
The data shown on this page is sourced from the Ministry of Business, Innovation & Employment NZ - Tenancy Services for the period shown. Summary totals include averages for some types of property not shown. The market rent information comes from bond data. The results may not be a true indication of the rental market, as they only reflect properties where bonds have been lodged in the previous 6 months. More information is available at https://www.tenancy.govt.nz/rent-bond-and-bills/market-rent/market-rent-explained. Reproduction of market data is permitted under the terms of the Creative Commons Attribution 3.0 New Zealand License - https://creativecommons.org/licenses/by/3.0/nz/. Every reasonable effort has been made to ensure the accuracy of the information in this report. Barfoot and Thompson Limited (REA2008) accepts no responsibility should the contents of this market report prove to be incomplete or incorrect.
6 Months ending 31/03/2024 BONDS 753 $430 LOWER $650 MEDIAN $770 UPPER SIZE BONDS RECEIVED LOWER QUARTILE MEDIAN RENT UPPER QUARTILE 1 2 3 4 5+ SIZE BONDS RECEIVED LOWER QUARTILE MEDIAN RENT UPPER QUARTILE 1 N/A N/A N/A N/A 2 3 N/A N/A N/A N/A N/A N/A N/A N/A N/A N/A N/A N/A 66 $545 $595 $625 270 $680 $720 $760 135 $800 $840 $875 N/A N/A N/A N/A HOUSE APARTMENT/FLAT Market rent in Wai O Taiki Bay 6 Months ending 31/03/2024 BONDS 132 $785 LOWER $900 MEDIAN $1,125 UPPER SIZE BONDS RECEIVED LOWER QUARTILE MEDIAN RENT UPPER QUARTILE 1 2 3 4 5+ SIZE BONDS RECEIVED LOWER QUARTILE MEDIAN RENT UPPER QUARTILE 1 N/A N/A N/A N/A 2 3 N/A N/A N/A N/A N/A N/A N/A N/A N/A N/A N/A N/A N/A N/A N/A N/A 48 $866 $900 $965 33 $900 $1,075 $1,340 N/A N/A N/A N/A HOUSE APARTMENT/FLAT Market rent in Waterview 6 Months ending 31/03/2024 BONDS 414 $550 LOWER $630 MEDIAN $770 UPPER SIZE BONDS RECEIVED LOWER QUARTILE MEDIAN RENT UPPER QUARTILE 1 2 3 4 5+ SIZE BONDS RECEIVED LOWER QUARTILE MEDIAN RENT UPPER QUARTILE 1 N/A N/A N/A N/A 2 3 33 $524 $533 $543 N/A N/A N/A N/A N/A N/A N/A N/A 66 $530 $570 $628 138 $695 $778 $850 N/A N/A N/A N/A N/A N/A N/A N/A HOUSE APARTMENT/FLAT Market rent in West Harbour 6 Months ending 31/03/2024 BONDS 978 $610 LOWER $680 MEDIAN $765 UPPER SIZE BONDS RECEIVED LOWER QUARTILE MEDIAN RENT UPPER QUARTILE 1 2 3 4 5+ SIZE BONDS RECEIVED LOWER QUARTILE MEDIAN RENT UPPER QUARTILE 1 N/A N/A N/A N/A 2 3 N/A N/A N/A N/A N/A N/A N/A N/A N/A N/A N/A N/A 66 $550 $580 $625 468 $640 $670 $720 195 $775 $850 $850 69 $923 $995 $1,038 HOUSE APARTMENT/FLAT
Market rent in Unsworth Heights

HOW WE HELP LANDLORDS

Stress-free property management?

No worries.

Owning a rental property can provide outstanding returns over time, but can also be a time consuming and stressful business.

From screening tenants, negotiating rent increases and getting calls about blocked sinks, you know what a hassle it can be. But when you leave the hassle to someone else, you want to be confident that your property is being well looked after.

That is where Barfoot & Thompson’s Property Management team comes in.

Our team of dedicated property managers removes the stress of maintaining your investment. We’ll find the right tenants, collect and review rent, arrange maintenance and more - all for a very competitive agreed rate.

Managing over 15,500 properties across Auckland and Northland, we have our finger on the pulse of the latest rental rates and access to quality tenants. By choosing a company awarded Best International Lettings Agency 2017/18, you can be sure your property is in safe hands.

“The industry is dynamic and it is evolving. We are seeing high immigration levels impacting the market. Our average tenancy is now almost 2 years, and changes in legislation mean that poor management can not only affect your revenue, it can affect people’s lives. With our knowledge of both the industry and the rental market in Auckland and Northland, we are committed to providing consistent and reliable service to investors and the people renting our properties.”

Our services

The best thing we offer is peace of mind, but we have a range of other great services too! Whether you have a single rental property or a full investment portfolio, Barfoot & Thompson Property Management has a service to suit your needs. We also offer body corporate and commercial property management services for your investment.

Full property management service

If you’d like us to take all of the stress off your hands, go for our full property management service. This includes:

• An online marketing campaign for your property, including free listing on barfoot.co.nz. realestate.co.nz and trademe.co.nz

• Automated booking system for prospective tenants to streamline the viewing of your property and 24/7 response to inquiries.

• Credit and reference checks.

• Interviewing and rigorous screening of suitable prospective tenants and completion of residential tenancy agreement.

• Bond lodgement with the Bond Centre.

• Dispute resolution on your behalf.

• Income collection and reporting.

• Thorough inspections of your property including an initial inspection with your new tenant, regular follow up inspections at a pre-arranged frequency, and a final inspect1on before the tenant moves out.

• Arrangement of property repairs and maintenance, including advice and assistance on the best way to rectify any damages, deal with tenants, and approach the Tenancy Tribunal if required.

• Access to professional tradespeople at reduced costs.

• Advice on current market conditions and rental rates as well as regular rent reviews.

• Guidance around changes in legislation to ensure your property meets the required standard.

• Access to the latest technology (such as our trust account management system) to ensure your money is safe at all times.

Cost: A competitive fee of 8.5% + GST (9.5-% + GST if the property is furnished) of all money collected and any repairs and maintenance we carry out on your behalf. The fee is usually tax deductible. Extra costs may apply for credit checks and marketing upgrades.

Cost: A competitive fee of 8.5% + GST (9.5-% + GST if the property is furnished) of all money collected and any repairs and maintenance we carry out on your behalf. The fee is usually tax deductible. Extra costs may apply for credit checks and marketing upgrades.

Why choose us?

Why use a property manager?

Apart from the time and hassle it takes to find tenants and arrange repairs and maintenance, there’s a lot of legislation to understand and processes to follow - especially if a dispute with tenants arises.

By using a property manager, you can be sure that an expert is looking after your investmentso when issues arise they are managed quickly and effectively.

Why choose Barfoot & Thompson?

As an investor you want to know your rental property is in safe hands. By choosing us, you’re choosing a company that has been awarded Best International Lettings Agency 2017/18. You’ll have the strength of Auckland’s largest and most trusted real estate company behind you and peace of mind that property management experts are protecting your investment.

The power of Barfoot & Thompson

Barfoot & Thompson is New Zealand’s largest privately owned real estate company - still run by the Barfoot and Thompson families after more than 90 years.

We manage over 15,500 rental properties and with dedicated property managers in over 60 branches, we have the experience and scale to help you.

Knowledge, experience and service

We know the property market inside out, including the intricate legislation and legalities behind property investment. We provide you with the highest quality advice so you understand the obligations, responsibilities and rights for you as a landlord and for your tenants.

Leaders in our market

We’re committed to being the best real estate agency around. We are thrilled to be recognised nationally and internationally for providing outstanding service including being awarded Best International Lettings Agency 2017/18.

• International Property Awards

• Best International Lettings Agency 2017/18

Best Real Estate Agency Asia Pacific - 2 years running

• Best Real Estate Agency Marketing Asia Pacific 2017/18

• REINZ Large Real Estate Agency of the Year

- All Disciplines 2017

It doesn’t cost as much as think

Our complete service comes at a very competitive property management fee of 8.5% + GST or 9.5% + GST if your property is furnished, of all monies collected and any repairs or maintenance carried out on your behalf. There are no additional charges for inspections, representation at dispute resolutions or when your property is vacant. (N. B. There may be fees for credit checks, additional inspections or marketing upgrades).

The right tenants, the right rent

Our wide-reaching network, rigorous selection process and market knowledge ensures you’ll get the right tenant and be paid the right rent for your property. We conduct regular rent reviews, so you’ll see an increase in rent to match any changes in the market. And with our large tenant portfolio we will do our best to ensure your property is always occupied

You can trust that your money is in good hands

Handling of your rental funds is managed through our head office accounting department. Unlike many other property management companies all money collected on your behalf is held in an audited trust account so you know where it is at any time.

We work hard for you

From the very beginning, we work hard to ensure your investment is well looked after. Here’s an overview of what you can expect when you choose to work with our expert team.

Initial consultation

We identify the management service that meets your needs and help you complete all the paperwork needed.

Account activation

We set up your account in our management system. This includes all the details for your property. All future quotes, repairs, maintenance and information associated with your property will be linked to this account and can be sent to you easily whenever you require it.

Marketing

We organise all the marketing for your property (in line with your agreed marketing strategy and budget). This can include advertising copy, signboards, photography, floorplans and video.

Finding tenants

To locate quality tenants, we organise online advertisements on barfoot.co.nz, realestate.co.nz, and trademe.co.nz. This service is free of charge for you.

Property viewings

We conduct viewings of your property by appointment on your behalf. Our Book-AViewing system helps us manage these efficiently for you. Ask us for more information.

Tenant applications

We know that the success of your investment lies in finding you a quality tenant. We thoroughly check every tenant that applies to rent your property. This includes looking at employment references, past rental history, credit checks, tenancy tribunal checks and proof of income.

Approval

Once we’ve screened our shortlisted applicants we present these applications to you so that you can make an informed decision and select the most suitable tenant for your property. Everyone is different and you may or may not want to be involved in this part of the process; the decision is yours.

Notification

Once an appropriate tenant has been selected, we promptly notify them of the decision to avoid losing them to another rental property.

Preparation

We organise all final paperwork, monies and lodgement of the bond. If your property is vacant or a tenant is vacating it will be cleaned, the state of all chattels is documented and any necessary maintenance is completed.

Pre-inspection

We complete a full inspection of your property, including water readings and body corporate information (if applicable).

Handover

Once a full inspection is completed and recorded, we meet and hand over keys to your new tenant on commencement date.

Receiving rent payments

Unlike many property management companies, we collect rental funds from your tenants and hold them in an audited trust account so you know where your money is at any time.

Find out more about what a property manager can do for you, visit barfoot. co.nz/howwehelp

Find out more about what a property manager can do for you, visit barfoot. co.nz/howwehelp

FAQs

From the very beginning, we work hard to ensure your investment is well looked after. Here’s an overview of what you can expect when you choose to work with our expert team.

How much will your service cost me?

Barfoot & Thompson charge a flat fee of 8.5% + GST (9.5% + GST if the property is furnished) of rent collected and any repairs, maintenance, and renovations carried out, or invoices paid on your behalf. There is no extra charge for routine inspections, administration, monthly and end of year financial statements and mediation or any appearances we make at the Tenancy Tribunal on your behalf.

Our fee is very competitive, and these costs may be tax deductible.

How often will you pay me?

We pay you monthly or twice a month, whichever you prefer, by direct crediting funds into your account. A comprehensive monthly statement detailing funds collected and disbursed on your behalf can be posted or emailed to you anywhere in the world. Invoice copies of accounts paid are included.

Do you collect a bond?

Yes. The Residential Tenancies Act requires that no more than four weeks bond be collected. Unless otherwise agreed, Barfoot & Thompson consider two weeks to be the minimum that should be paid. The bond is paid before the tenant takes possession and held by the Bond Centre until the tenant vacates.

Will it cost me to advertise the property?

No. If you have a full property management contract with us, our Option A marketing package is complimentary. You may choose to upgrade your marketing package at an extra cost.

Will I be charged for a vacant property?

No.

What if my tenant doesn’t pay the rent?

Barfoot & Thompson rent collection is computer monitored, enabling us to act very quickly when a rental payment is missed. The debt recovery process commences immediately. While we take every possible action to resolve the matter, in some cases it may be necessary to take the tenant through the mediation process or to the.

Tenancy Tribunal. If this is the case you will not be charged for our time.

Does Barfoot & Thompson guarantee me for any loss of rent?

No.

I will be moving overseas - can you handle all repairs?

Yes. Our property managers use a range of contractors who are highly skilled, competitively priced and quick to respond to our calls. If you have a preference for any particular tradesperson we would be pleased to accommodate this.

Legally, if you are overseas for 21 days or more, you are required to appoint someone to manage your property.

How often will you inspect my property?

Inspections are carried out on a regular basis. The frequency should be discussed with your property manager at the commencement of the management. Be sure to check what your insurance policy states as well, as they do generally have a set frequency. Pass this onto your property manager and we will set it as what is required.

What if I want to sell the property?

Your property manager can arrange with any of our experienced sales staff to have the property appraised and then listed for sale. This can be a very delicate situation and it is important that it’s handled professionally and efficiently. It is our job to ensure you and your tenants interests are protected. Your property manager will be happy to walk you through the process at any time.

Do you offer a Body Corporate service?

Yes, we offer full body corporate services. Ask our property managers for more details.

Do you offer commercial property management services?

Yes, we offer comprehensive property management services for commercial investments. Ask our property managers for more details.

Meet the team

Saull Hinton Branch Manager 021 305 237

Since joining the real estate profession in 2002 Saull Hinton established himself as a highly successful and well-regarded salesperson.

His ability to communicate with clients from all cultures and backgrounds, along with his honesty about the market ensured his clients were both informed and at ease throughout the entire process.

Saull’s experience gives him extensive knowledge of the local property market and equips him to help his team deliver a top service and top result to their clients. Whether you are buying, selling or wanting a hand with your investment property, then Saull and his team here to help.

Barfoot & Thompson Real Estate Mairangi Bay

Established in 1973, Barfoot & Thompson has long been part of Mairangi Bay and this experience has delivered some outstanding results.

Today’s team at Barfoot & Thompson Mairangi Bay is made up of top performing, self motivated, experienced locals who understand the local market. Having been in the industry for a long time, we’re able to offer sound real estate advice and help both buyers and sellers make informed decisions.

This depth of experience and expertise is backed up by the strong network and leading technology of Barfoot & Thompson. An electronic digital window display means listings are clearly visible both day and night.

And because more and more people are house hunting online while they’re out and about, Barfoot & Thompson has created a website that’s easy and intuitive to use on any device - ensuring all those buyers can find your property quickly and have a great experience viewing it.

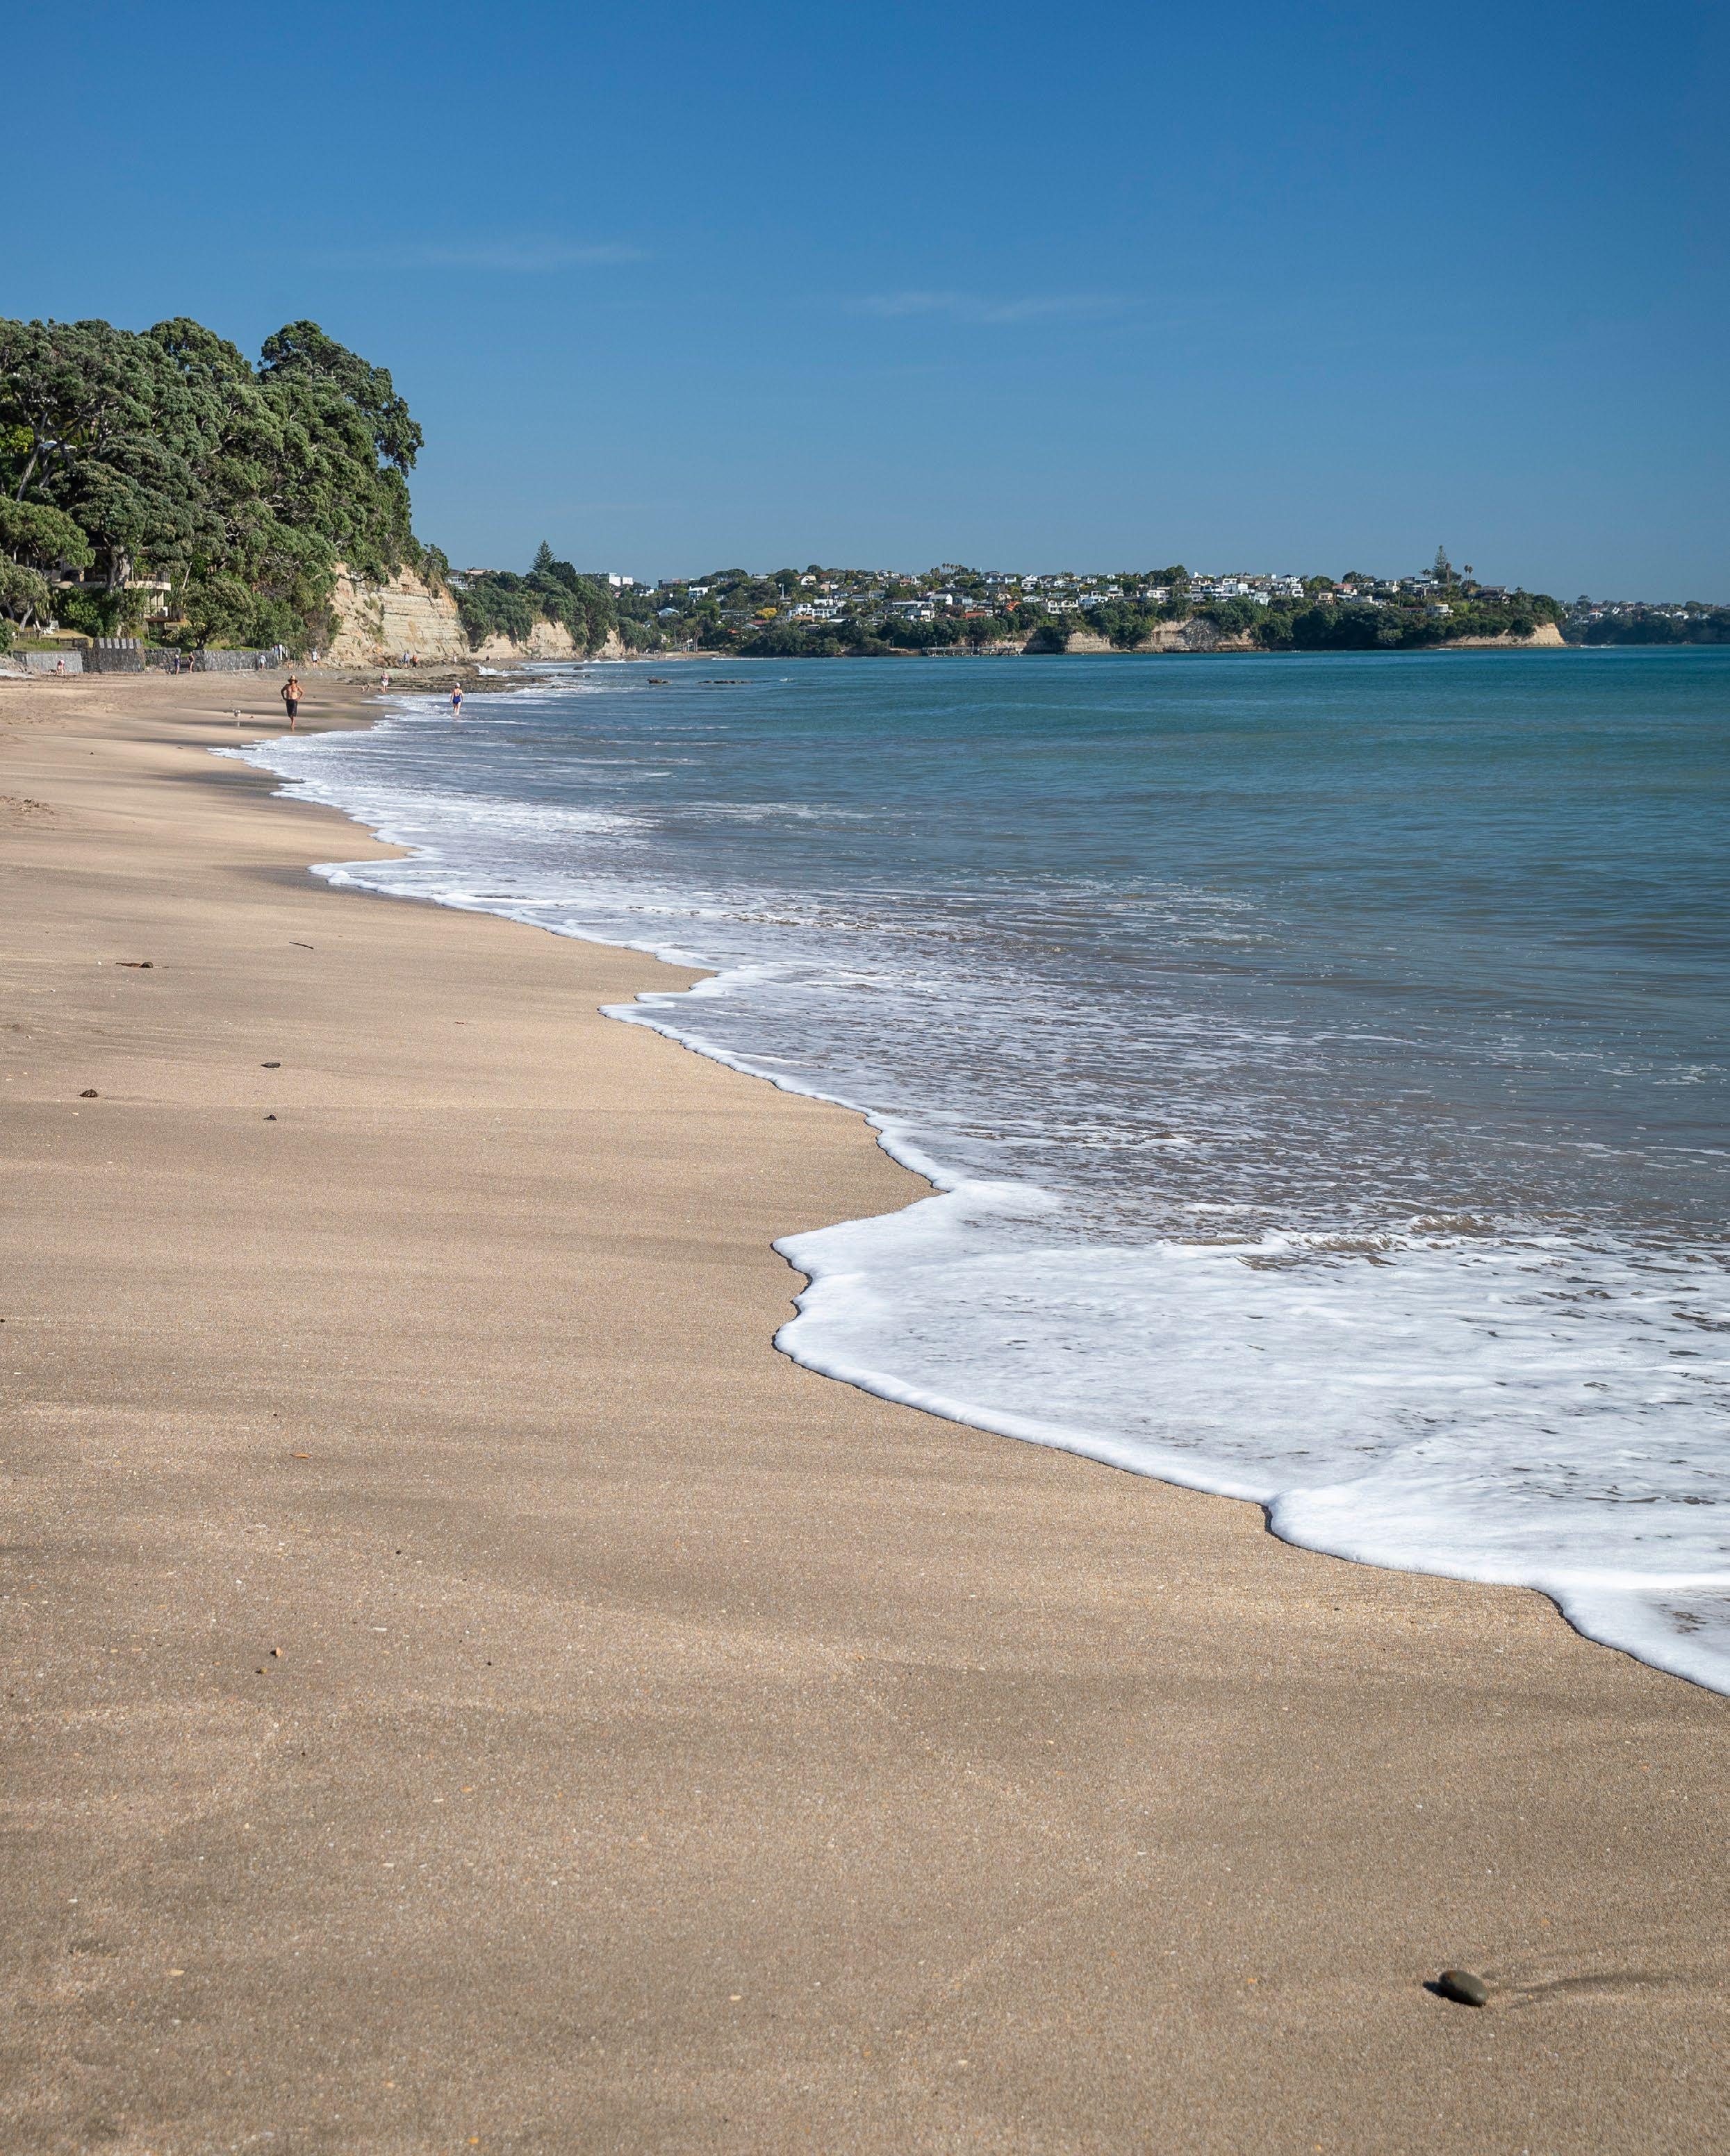
Residential seaside suburb

Mairangi Bay is a residential seaside suburb with a distinct village-like feel on Auckland’s North Shore, within commuting distance of Auckland City.

Housing ranges from renovated 1950’s houses to modern, designer homes, apartments and stunning cliff-top properties with water views.

The village offers boutique shops and a range of good cafes and restaurants, and there are some excellent local schools as well as sought-after Rangitoto College not far away.

Property Management team

Karen

Williams Head of Property Management 0274 319 514 Angie Pike-Taylor Senior Property Manager 027 431 9503 Georgie Hutchison Property Manager 027 237 6952

Residential Sales team

Nadja Court 021 777 690

Frank Bai 021 054 7755

Kelly Choi 021 535 658

Grant Haworth 021 194 4095

William Liang 021 053 7788

Kevin Ye 021 185 8778

Zhang 021 084 96230

Ming Qin 021 0246 3600

Jin Cai 021 262 5288

Gabrielle Elborough 021 257 5018

Sherlock Huang 021 037 1252

James Peng 021 180 4158

Carol Yin 021 107 1993

Zhang 021 876 717

Sunny Chae 027 498 9132

Debby Candy-Gill 021 731 846

Susan Fan 021 138 1648

Joe Kennedy 021 217 1540

Shirley Tong 021 166 9548

Jacky Yu 021 493 395

Nicki O’Sullivan 021 119 8153

Ceejay Chen 021 028 45315

Gibson 021 577 552

Lee 021 701 157

Sarah Wang 022 642 4405

Ray Yu 021 679 236

Lika DeVito 027 583 3655

Sam Cheong 027 486 8030

Mathew Gill 022 4731 846

Li 021 920 608

Jonathan Wu 027 399 3930

Zareian 021 023 02469

Tony Cederwall 027 5466 377

Cho 021 310 203

021 465 334

Li 021 876 618

Yang 021 027 16265

Alex Zhang 022 694 9394

Zheng 021 967 837

Jenny Zheng Chris Leo Mehran Jeremy Michael Gladding Justin Danny Darren Jenny

386 Beach Road, Mairangi Bay 0630

Property Management 09 521 0152

Residential Sales 09 478 9089

Email mairangi.rental@barfoot.co.nz

barfoot.co.nz/mairangi-bay

AKTPM6
Bay Mairangi Bay
Barfoot & Thompson
Mairangi
Issuu converts static files into: digital portfolios, online yearbooks, online catalogs, digital photo albums and more. Sign up and create your flipbook.