PRODUCT FOCUS
AutoCAD
by: Xavier Loayza
AutoCAD for 3D Modeling and Visualization A
bout three quarters of the world’s population are visual learners. This fact highlights the importance of quality visuals when communicating ideas. Clear images can be more accurately interpreted and lead to project success. Our ability to communicate in the AEC industry currently depends on the right software and modeling tools and how to get the most out of them. Better options for visualization have been exponentially improved due to advances in reality capture, GPU/CPU capacity, and rendering quality. There are many tools available for 3D modeling and visualization but some of the best tools are just within reach—that is, they are available in recent versions of AutoCAD®. Tools for working with point clouds, solid modeling, and internal renderings within AutoCAD have been forgotten in the shuffle, but still provide value due to their availability. Let’s uncover what they can do.
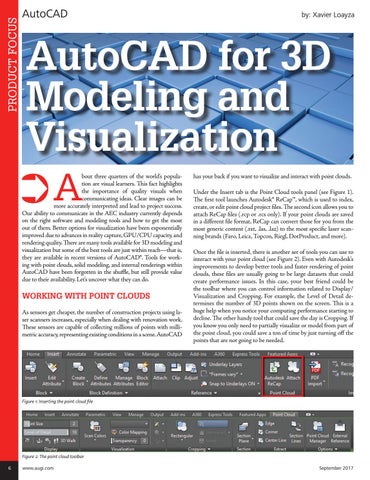
WORKING WITH POINT CLOUDS As sensors get cheaper, the number of construction projects using laser scanners increases, especially when dealing with renovation work. These sensors are capable of collecting millions of points with millimetric accuracy, representing existing conditions in a scene. AutoCAD
has your back if you want to visualize and interact with point clouds. Under the Insert tab is the Point Cloud tools panel (see Figure 1). The first tool launches Autodesk® ReCap™, which is used to index, create, or edit point cloud project files. The second icon allows you to attach ReCap files (.rcp or .rcs only). If your point clouds are saved in a different file format, ReCap can convert those for you from the most generic content (.txt, .las, .laz) to the most specific laser scanning brands (Faro, Leica, Topcon, Riegl, DotProduct, and more). Once the file is inserted, there is another set of tools you can use to interact with your point cloud (see Figure 2). Even with Autodesk’s improvements to develop better tools and faster rendering of point clouds, these files are usually going to be large datasets that could create performance issues. In this case, your best friend could be the toolbar where you can control information related to Display/ Visualization and Cropping. For example, the Level of Detail determines the number of 3D points shown on the screen. This is a huge help when you notice your computing performance starting to decline. The other handy tool that could save the day is Cropping. If you know you only need to partially visualize or model from part of the point cloud, you could save a ton of time by just turning off the points that are not going to be needed.
Figure 1: Inserting the point cloud file
Figure 2: The point cloud toolbar 6
www.augi.com
September 2017