VERTICAL COALESCENCE
A MIXED-USE AFFORDABLE HOUSING SOLUTION FOR CHICAGO, ILLINOIS
AINSLEY LUDEMA

Vertical Coalescence
FIGURE 6.9: Image by Author. Created using Rhino, Lumion, & Photoshop.
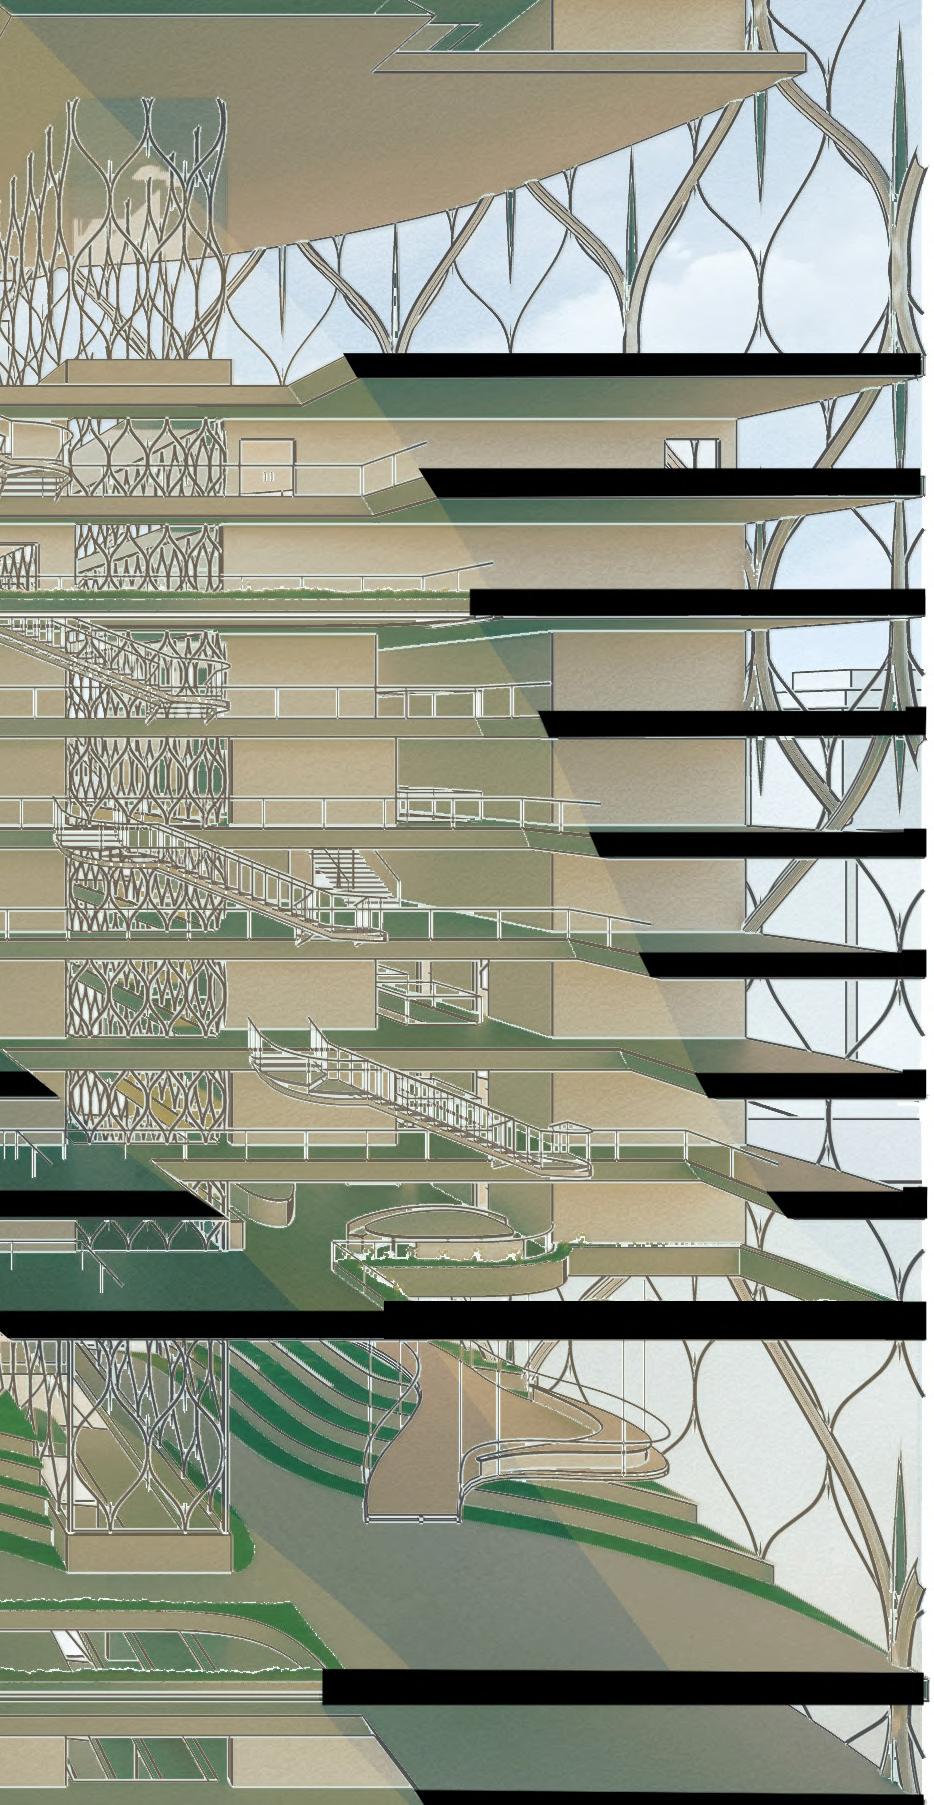
SECTION PERSPECTIVE OF ONE VILLAGE
Before moving further into the structure, this section highlights one village within the larger skyscraper. This zoomed-in section perspective illustrates how residential and social elements are organized within the overall design and provides context for the floor plans and visualizations on the following pages.
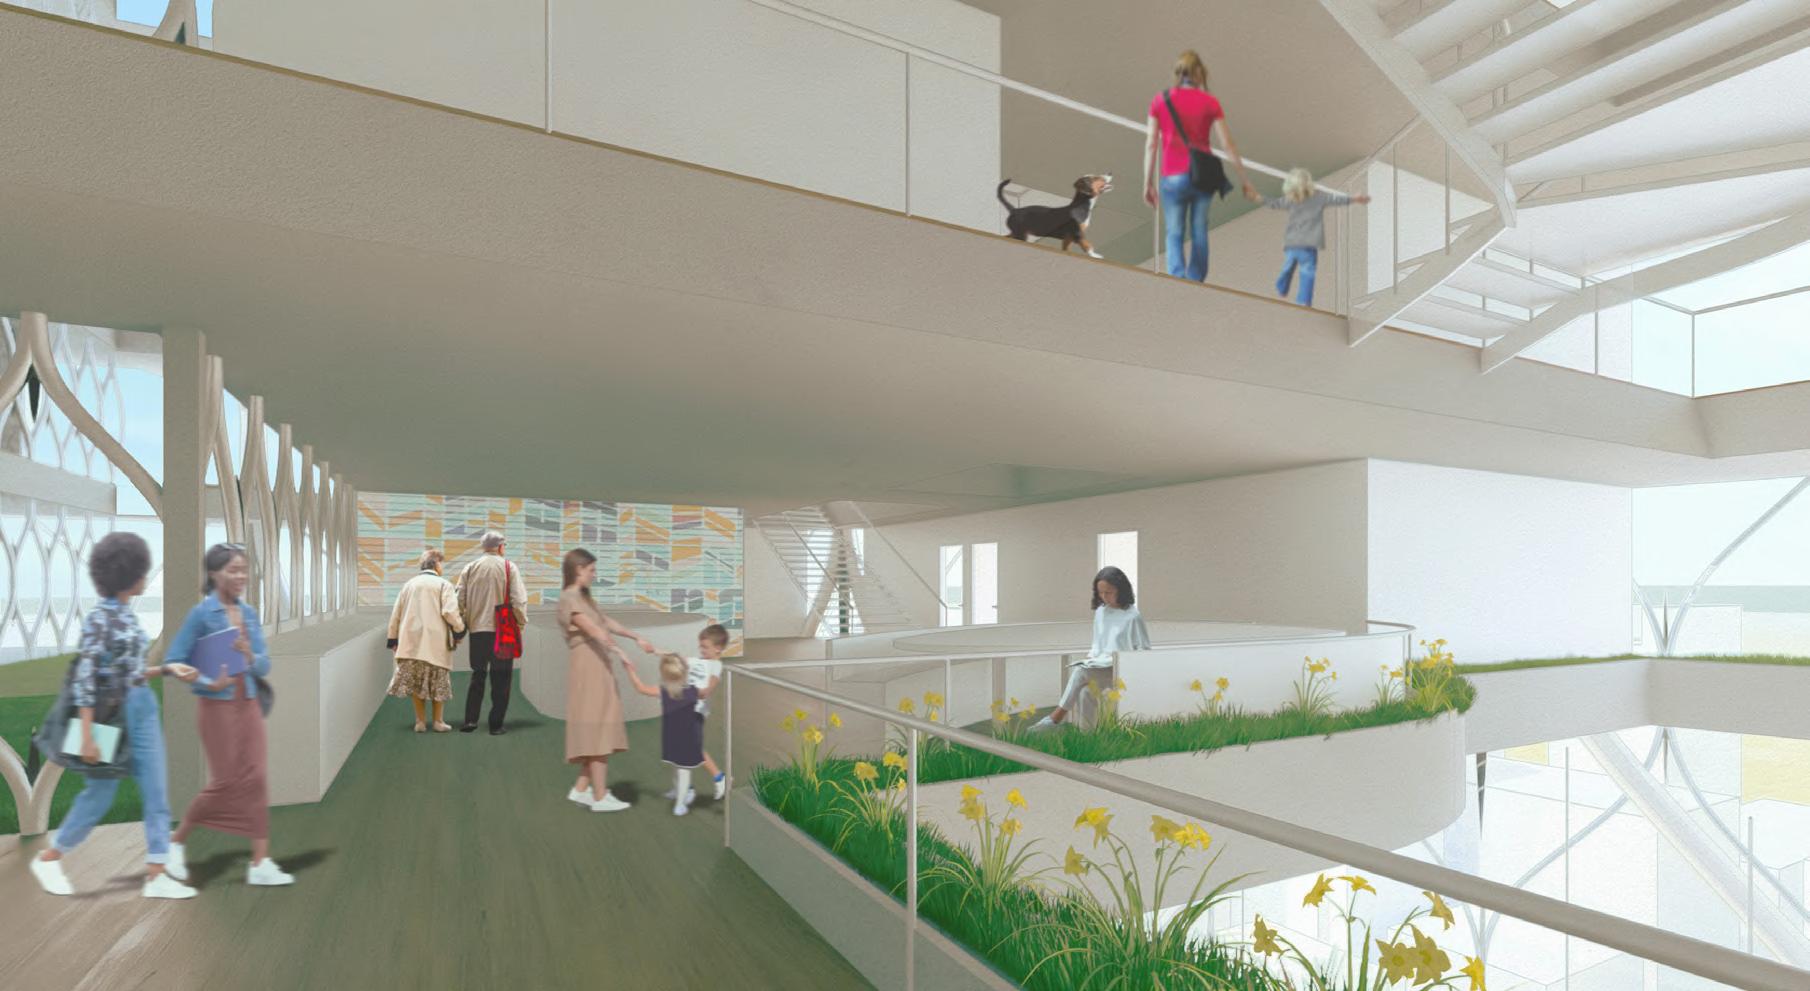
FIGURE 6.10: Image by Author. Created using Rhino & Adobe Illustrator.
TRANQUILITY PARK
level 2 | elevated walkway
Level one of this village is the Tranquility Park, a green space featuring hills of vegetation and intimate seating nooks. From this first level, occupants may ascend to an elevated walkway that weaves through the park, offering additional seating areas and new perspectives of the landscape below.
Vertical Coalescence
level 1
1’
FIGURE 6.11: Diagrams by Author. Created using Rhino & Adobe Illustrator.


FIGURE 6.12: Images by Author. Created using Rhino, Lumion, & Photoshop.


level 3
RESIDENTIAL FLOORS
ADULTS detailed block
ADULTS - FAMILIES
ADULTS - YOUNG PROFESSIONALS
level 2
ADULTS - YOUNG PROFESSIONALS
ADULTS
ADULTS - FAMILIES
level 1
FIGURE 6.13 (PREVIOUS PAGE): Image by Author. Created using Rhino, Lumion, & Photoshop. FIGURE 6.14: Diagrams by Author. Created using Rhino & Adobe Illustrator.
The next three floors combine residential units with shared amenities and smaller green spaces. Each residential block is identified here, thoughtfully distributed throughout the village and linked vertically through light wells. These vertical penetrations create dynamic connections while allowing natural light to filter deep into the living spaces.
FIGURE 6.15: Images by Author. Created using Rhino, Lumion, & Photoshop.
1’ 10’ 20’ 50’
GATHERING SPACE
SOCIAL FLOORS
LIBRARY
BODEGA ICE CREAM SHOP RESTAURANT
GATHERING SPACE
LENDING CENTER
LAUNDROMAT BAR
ENTERTAINMENT CENTER

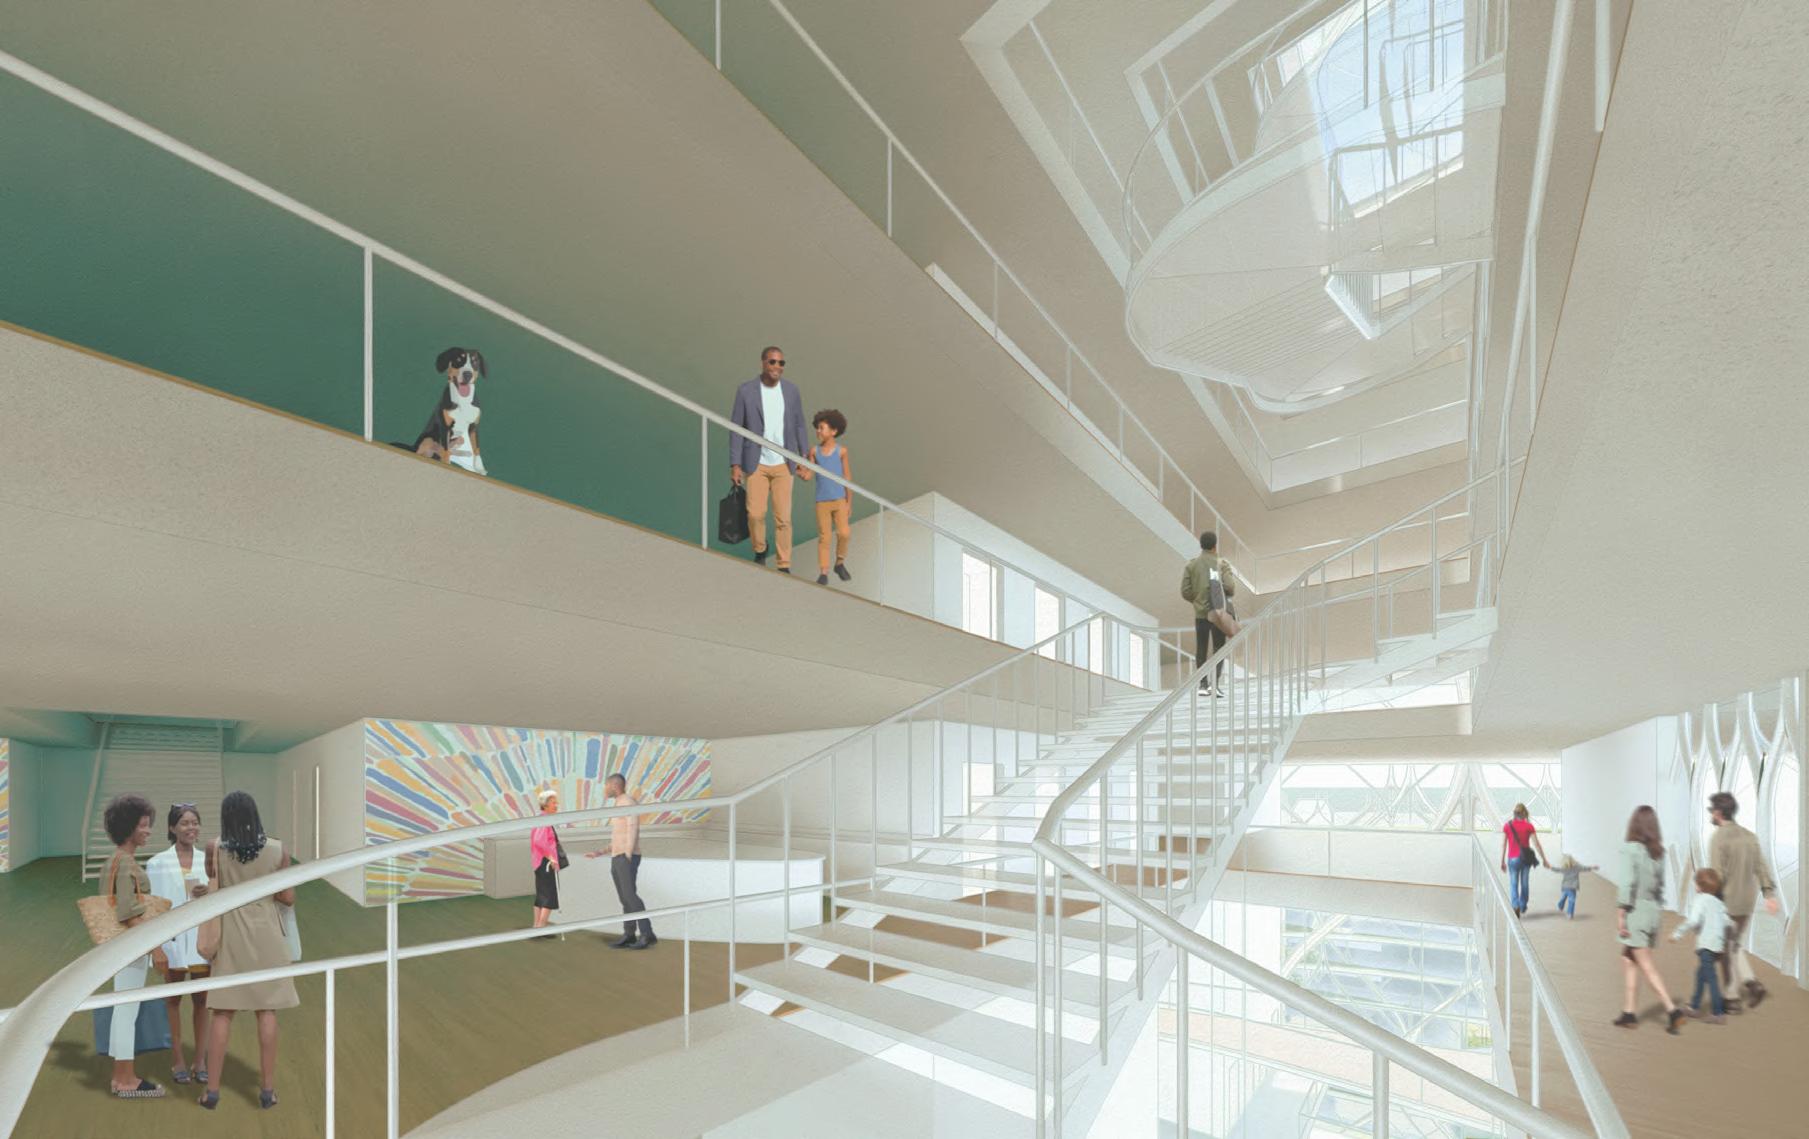
Continuing upward, we arrive at one of the designated social floors, which offers community spaces that foster a lively, interconnected atmosphere within the vertical village.
Vertical Coalescence
FIGURE 6.16: Diagram by Author. Created using Rhino & Adobe Illustrator.
FIGURE 6.17: Image by Author. Created using Rhino, Lumion, & Photoshop.
PARK BRIDGES
Stepping out onto one of the park bridges, we are now oriented facing north. From this vantage point, the connection between the two towers becomes clear, framed by greenery and expansive views of the city beyond. The park bridges serve as vital social and ecological links within the structure, inviting movement, gathering, and reflection high above the urban streetscape.
FIGURE 6.18: Image by Author. Created using Rhino, Lumion, & Photoshop.
FIGURE 6.19 (NEXT PAGE): Image by Author. Created using Rhino, Lumion, & Photoshop.


CONCLUSIONS & REFLECTIONS
CONTEXT MODEL


This physical model captures the final massing in relation to the dense urban fabric of downtown Chicago. At 1/50” = 1’, the surrounding buildings, streets, and elevated train are articulated to show the site's position within the city’s dynamic environment.
FIGURE 7.1: Images by Author. Massing model created using chipboard & paper.
Vertical Coalescence
INTERMEDIATE MODEL


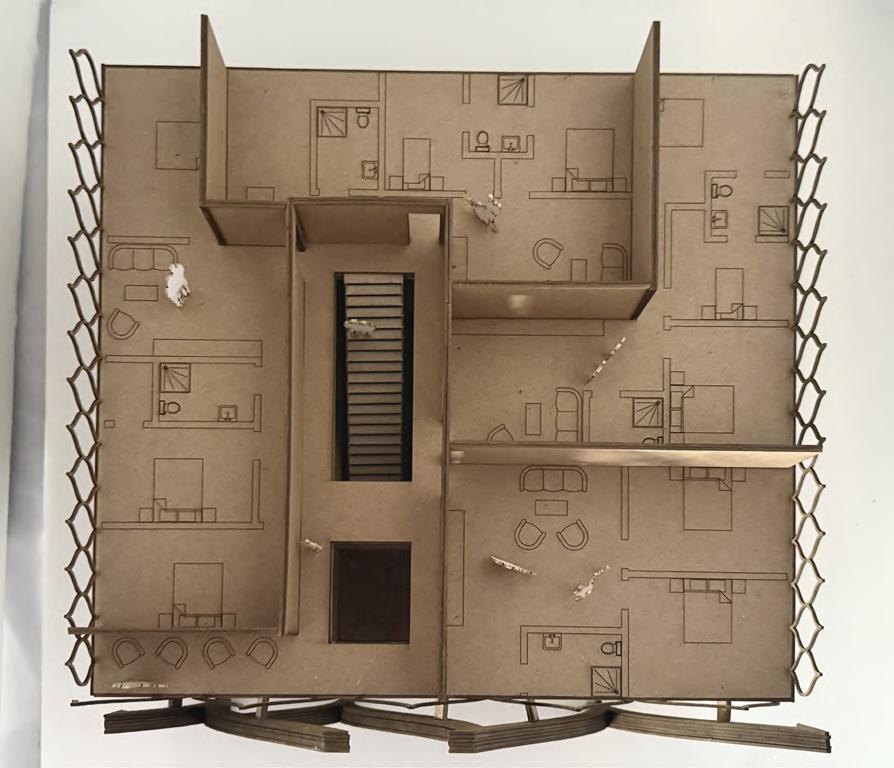
One neighborhood is represented in this physical model, providing a closer look at the internal organization and spatial character of the project. The vertical relationships of circulation and light wells are revealed, illustrating how movement, air, and natural light are woven through the structure. The model captures the layered connections between individual spaces, the hierarchy of public and private zones, and the way vertical elements support both functional and experiential continuity across the design. Conclusions & Reflections
FIGURE 7.2: Images by Author. Massing model created using chipboard.
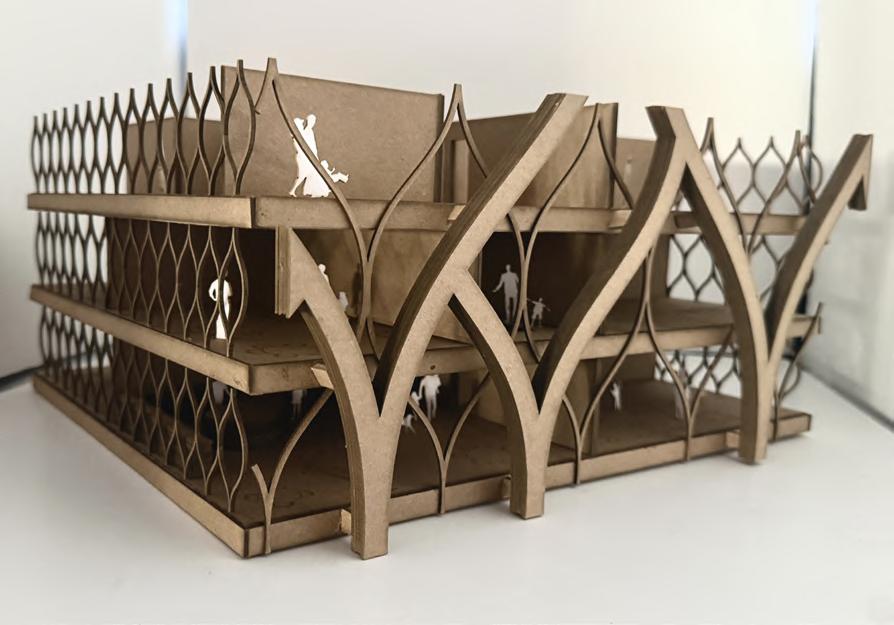
DETAIL MODEL


Vertical Coalescence
FIGURE 7.3: Images by Author. Massing model created using chipboard.
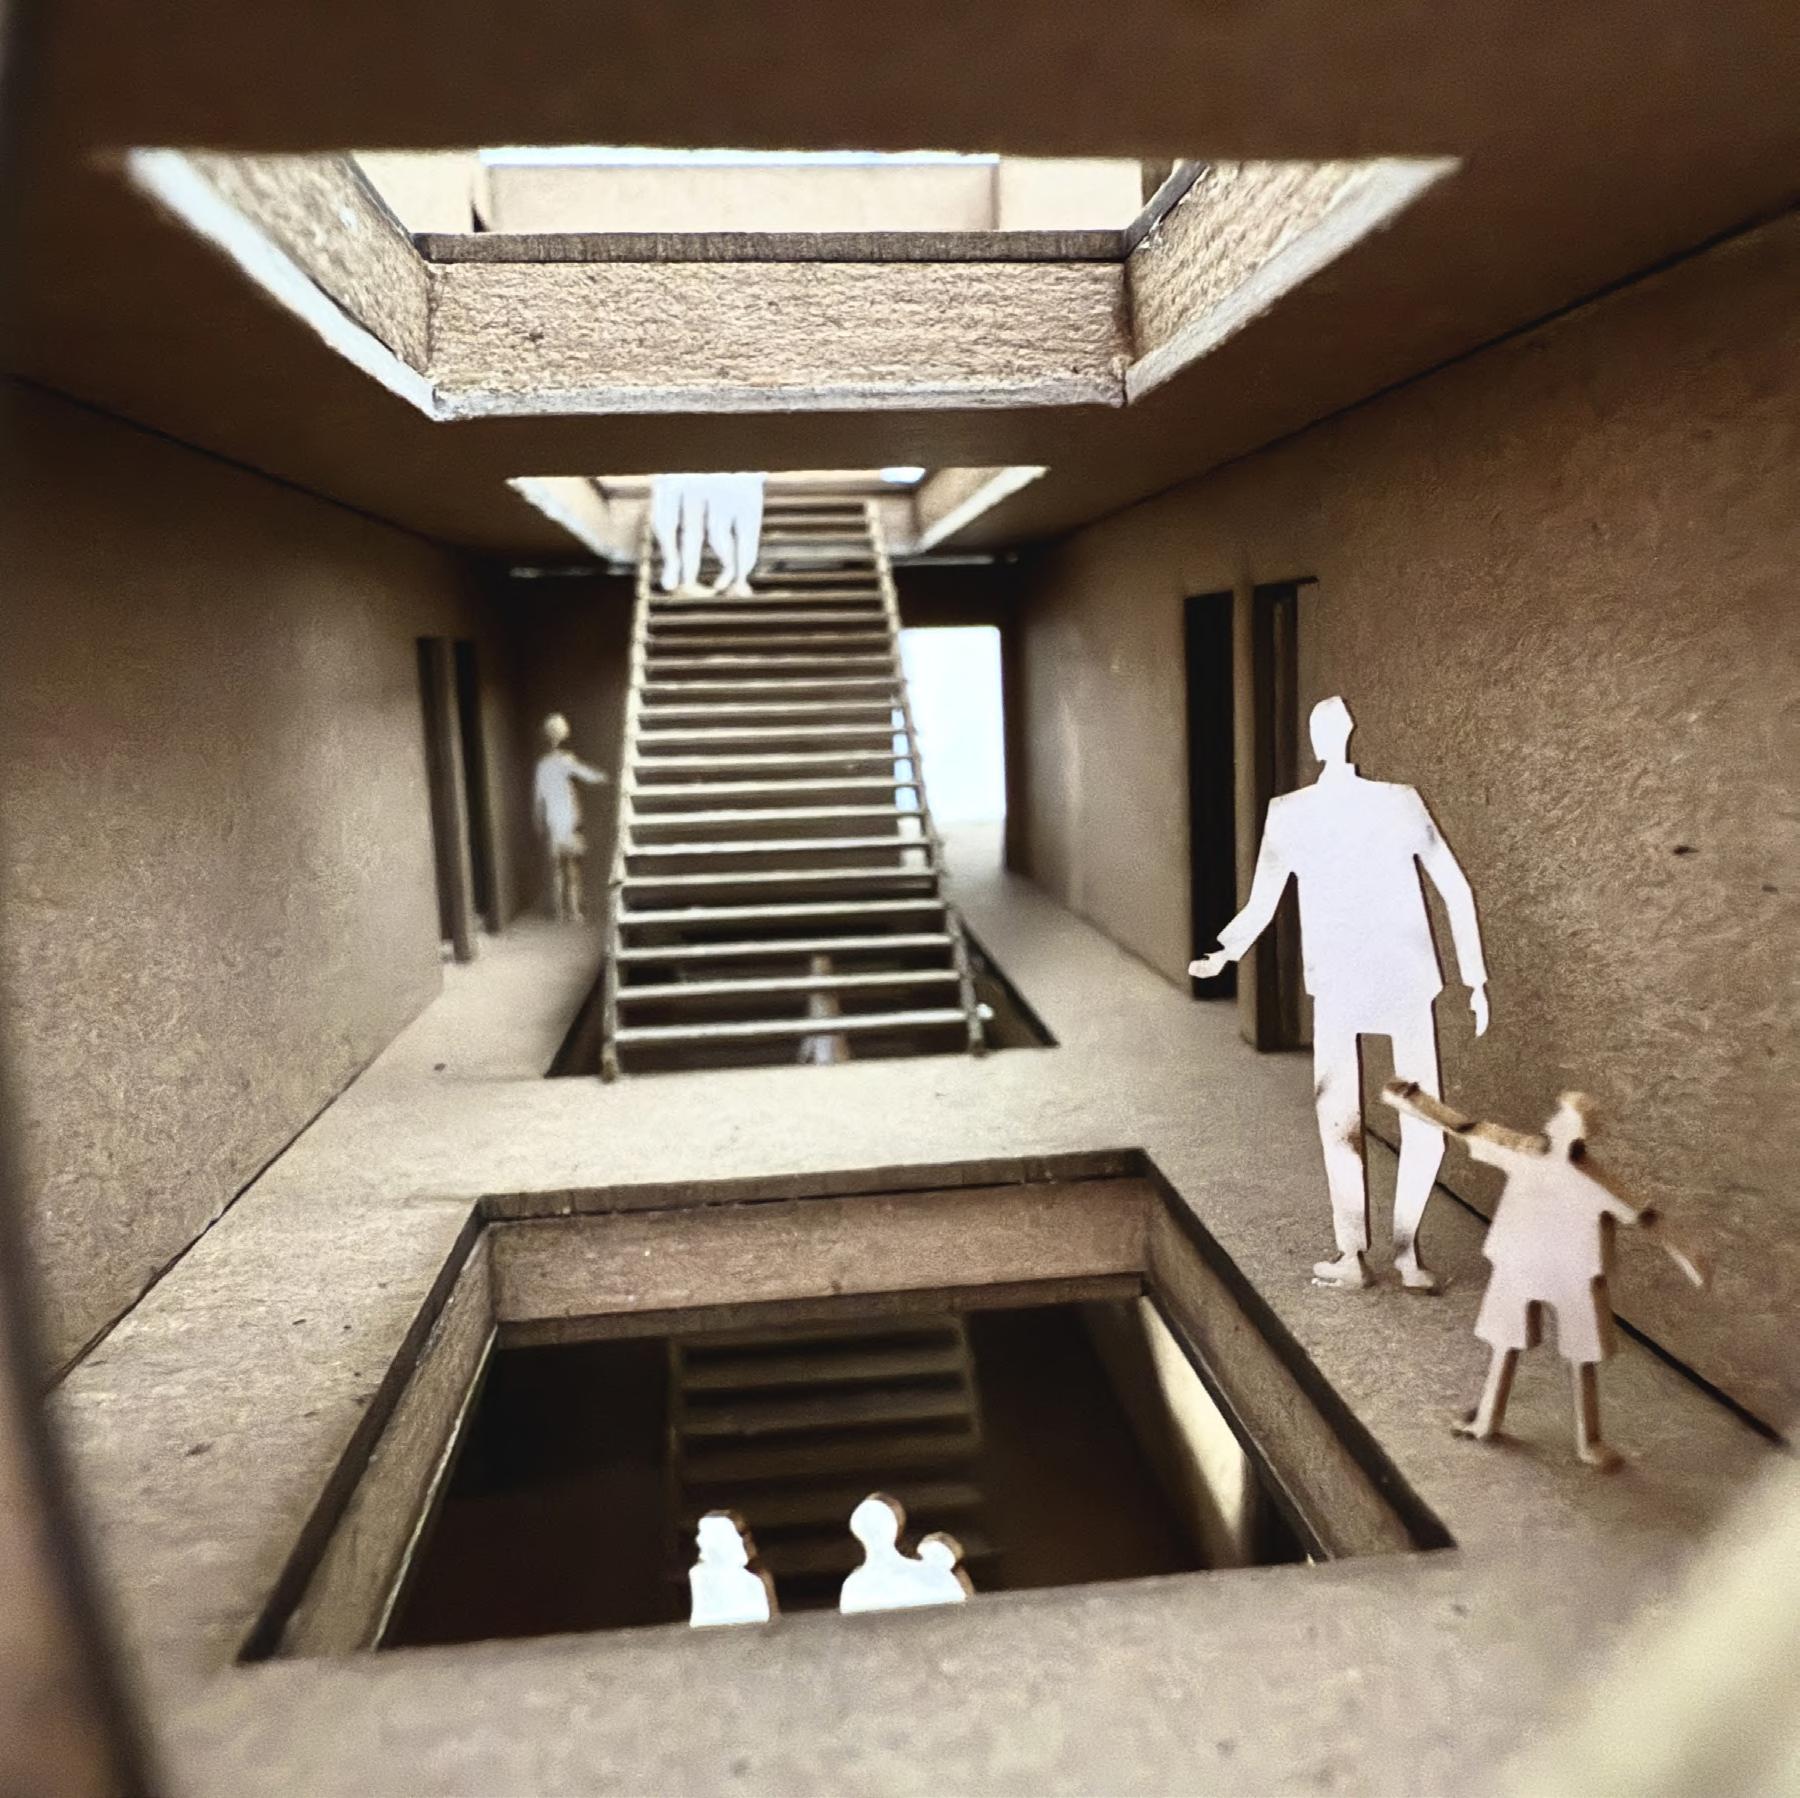
This physical model zooms into a single block within the skyscraper, representing the smallest scale of sociability. This model captures three floors of residential units organized around a shared kitchen and dining space, alongside a variety of amenities. The arrangement emphasizes proximity and connection, with private living spaces surrounding a vibrant communal core. Vertical circulation through the small central lobby space links the floors and encourages interaction among residents. The model illustrates the balance between privacy and community and highlights how spatial design fosters everyday social encounters within the vertical neighborhood.
FIGURE 7.4: Images by Author. Massing model created using chipboard.
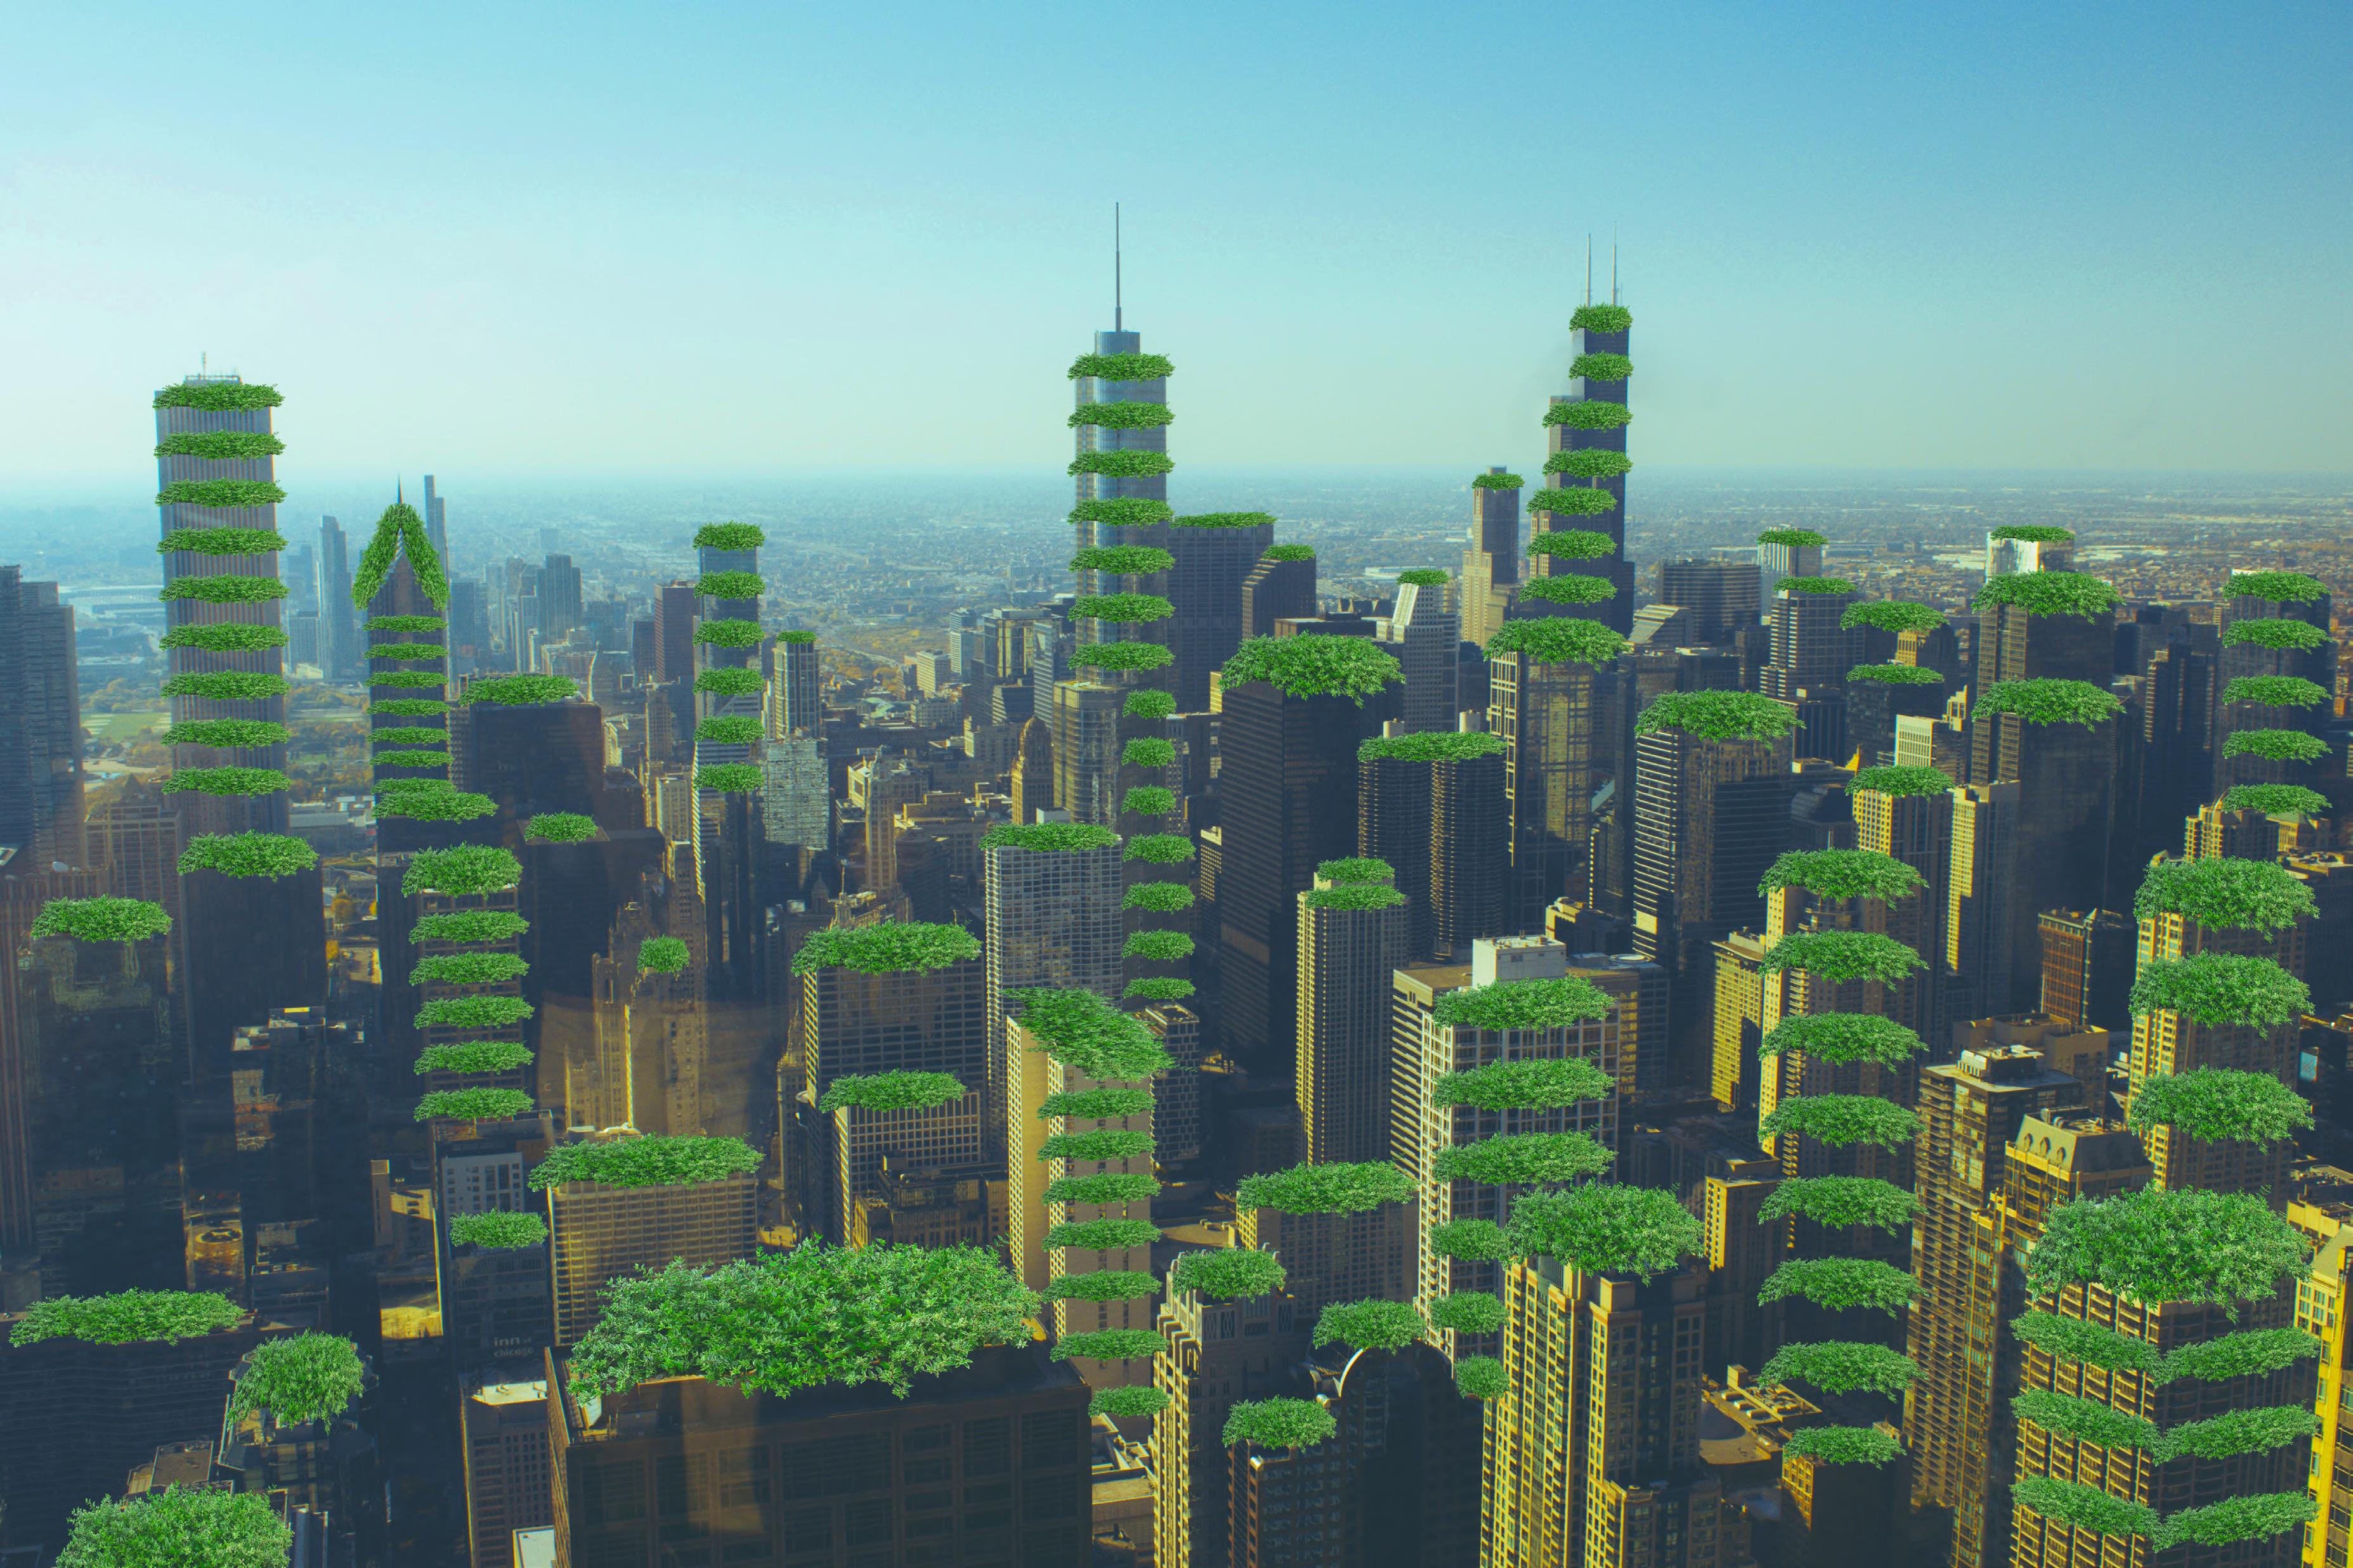
FIGURE 7.5: Image by Author. Created using Adobe Illustrator.
Vertical Coalescence
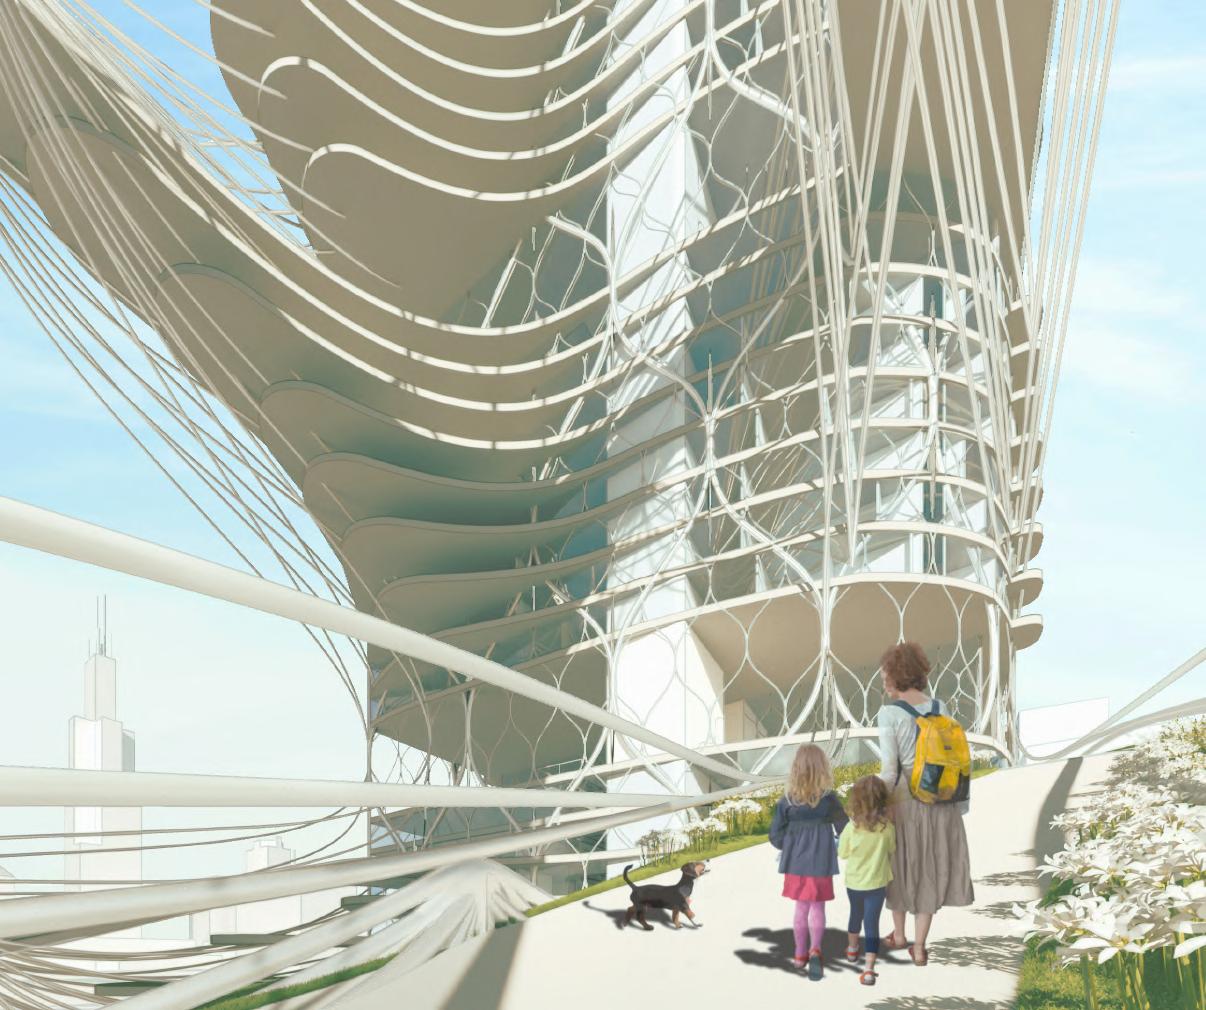
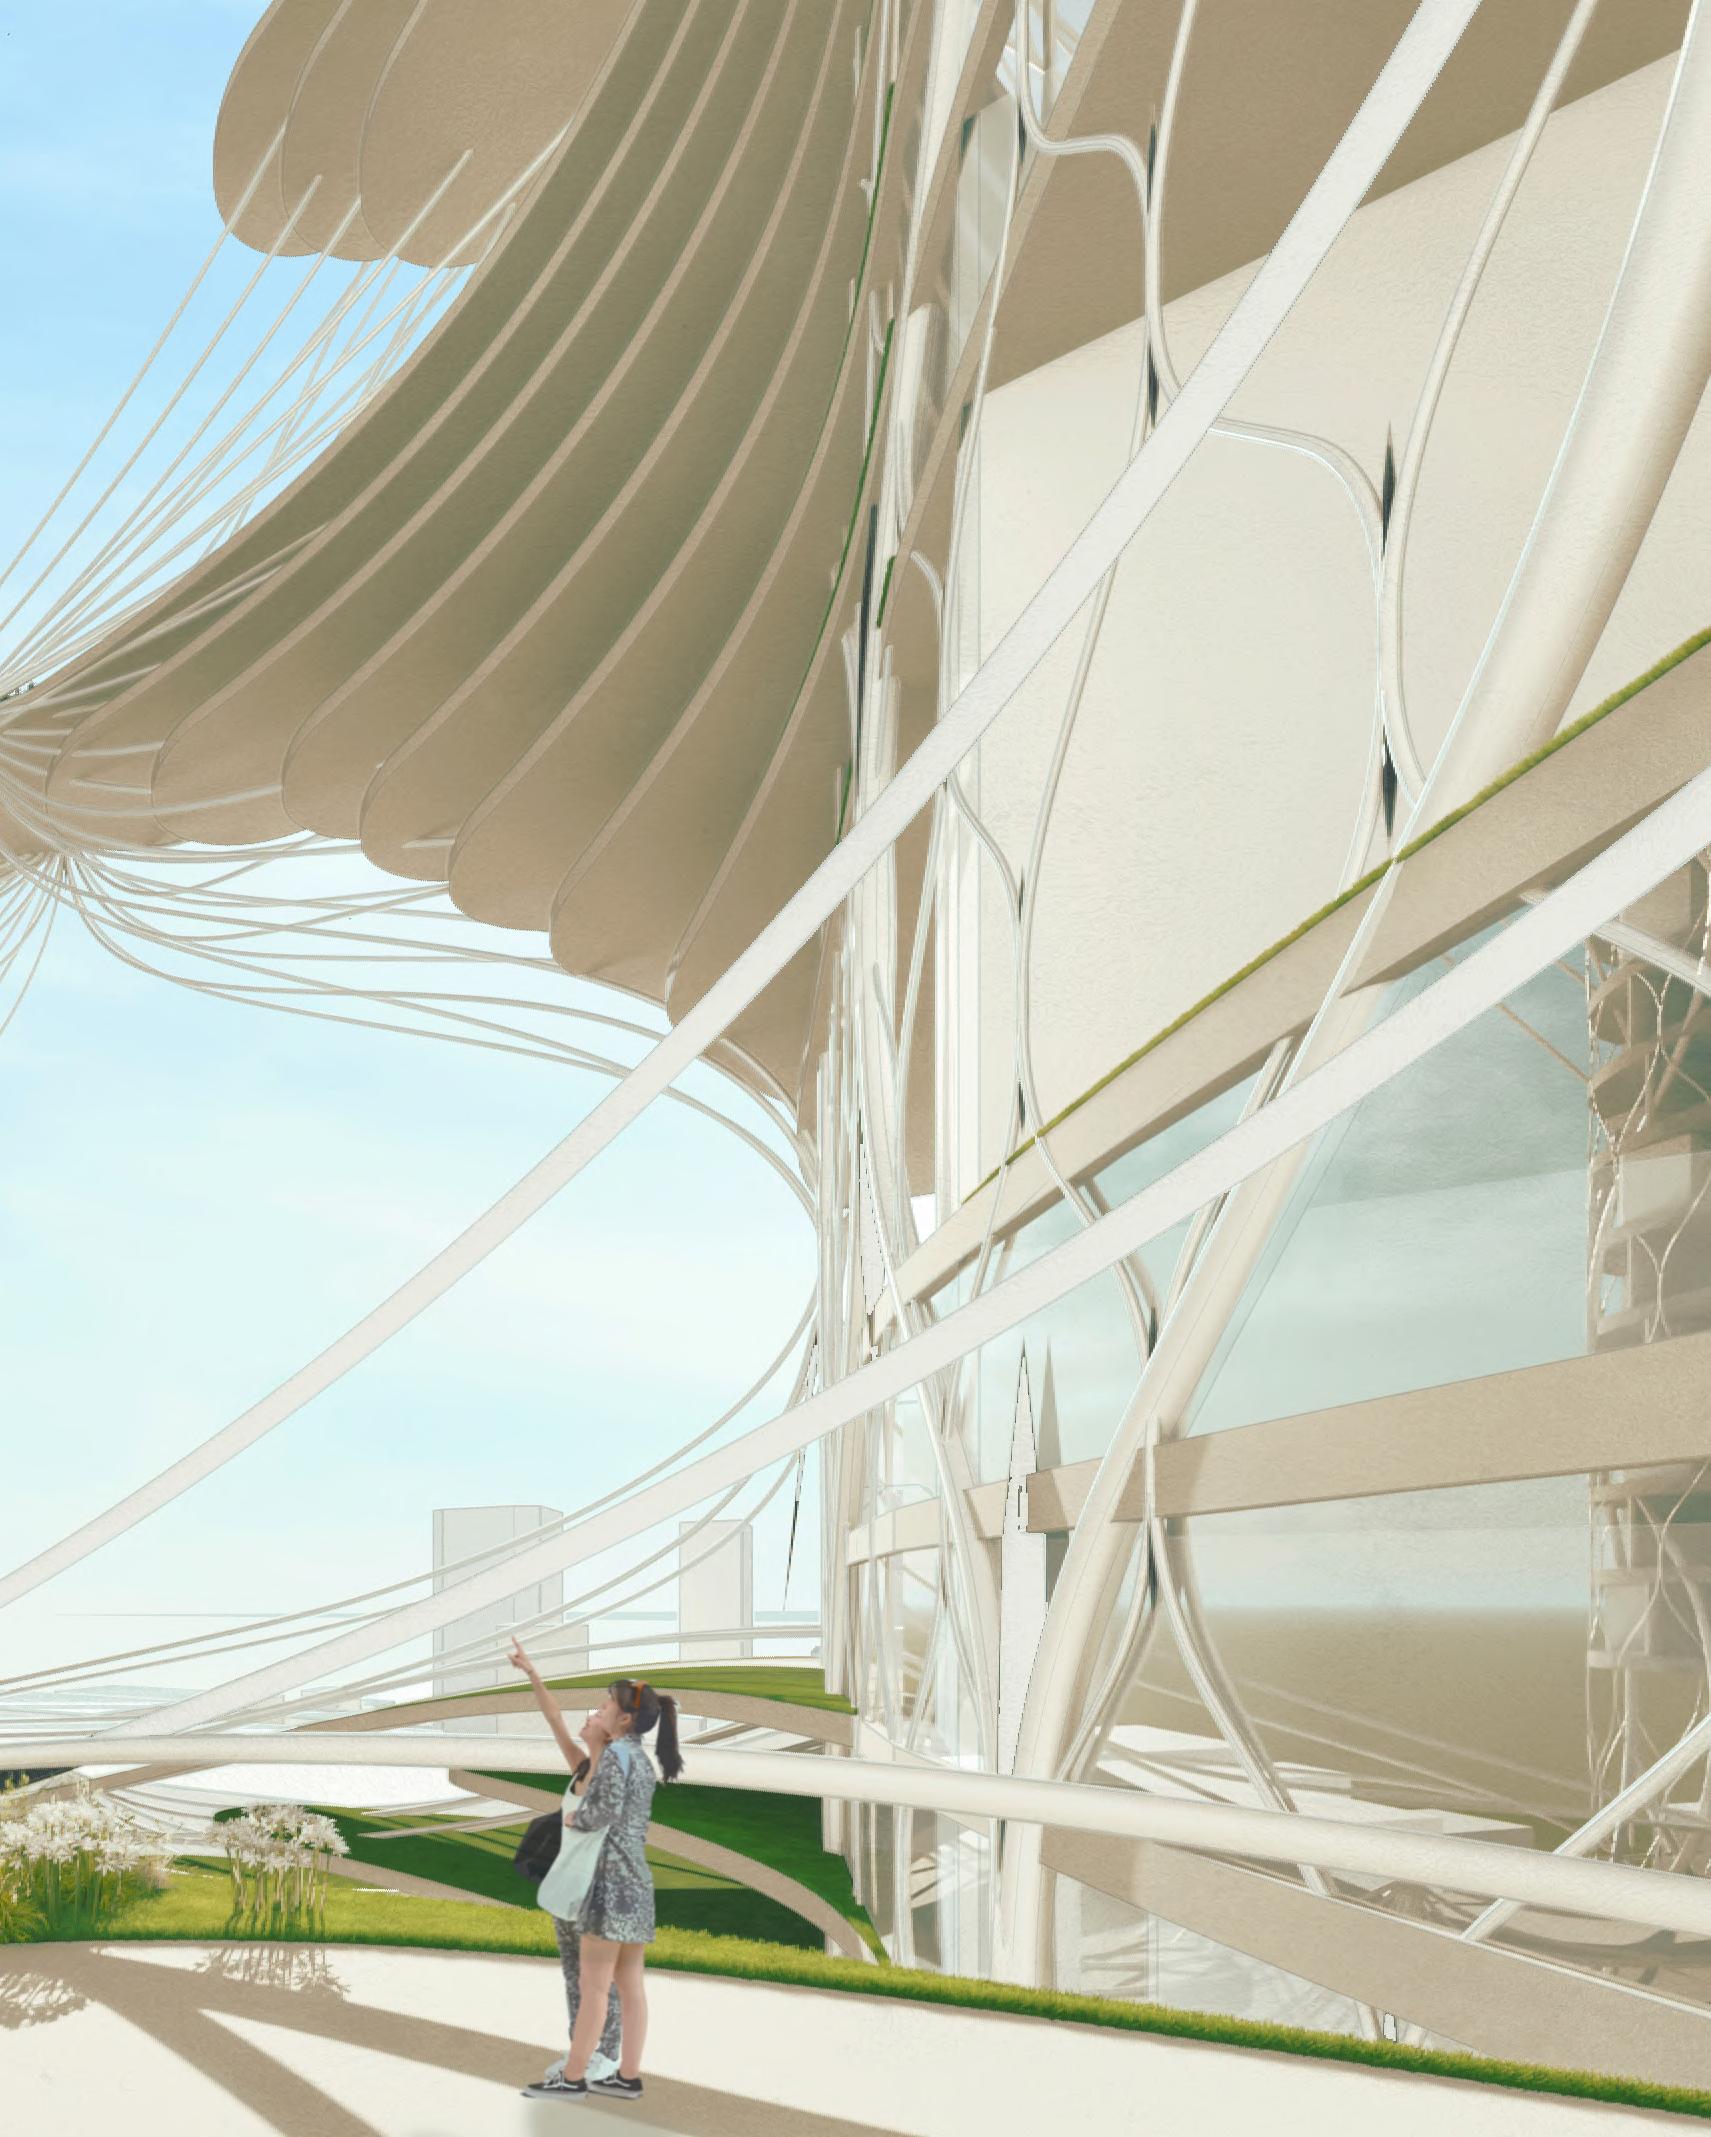
FUTURE APPLICATION
Architecture surpasses shelter. It embodies abstract thought, and it should aim to be the physical manifestation of positive emotion. Looking ahead, I understand that this is an vision leans toward optimism, but it emerges from a deep and present need. This image imagines a future where the spaces both between and within buildings are no longer overlooked, but seen as vital grounds for nature to return, for people to reconnect, and for communities to grow. This is not about transforming every rooftop into a dense forest or layering greenery onto every surface just for the sake of appearance. It is about reshaping the way we approach urban life and seeing the everyday as worthy of care, design, and intention.
By weaving environmental values into the vertical rhythm of the city, we can begin to expect more from our shared environments. These are not ideas meant only for large-scale redevelopment or utopian design. They can begin in the smallest of shifts, in a single building that chooses to value air, light, and access to nature as essential rather than optional. Through this approach, cities become not just places to live but places of life that are responsive, inclusive, and more deeply human.
REFLECTIONS
This project has deeply influenced my understanding of environmental design, especially within the urban context. In a rapidly urbanizing world, the importance of environmental design cannot be overstated. It is too often overlooked, yet it is essential for cities to adapt in ways that better support human life. One of the key realizations I had during this process was the impracticality of traditional penthouses and large residential units. As I developed this design, it became clear that continuing dense housing up the entire skyscraper allowed for the addition of expansive green spaces without sacrificing spatial efficiency. This alignment of human habitation with nature is fundamental in supporting the wellbeing of both individuals and communities within urban settings.
The design process was not without its challenges. One of the most significant hurdles I faced was the form and structure of the building. Initially, I had intended to implement a traditional diagrid system, but I ultimately decided to alter it, which was time-consuming to research and digitally model. This process could have extended the project timeline by months, as refining this structure was a complex and iterative process. Unfortunately, due to time constraints, I had to prioritize the programmatic aspects of the design, and as a result, the back-and-forth process between form and function was not as thoroughly explored as I would have liked. In hindsight, I would have dedicated
more time to fully integrating the structural form with the program, ensuring that every decision was as thoughtful as possible.
One of the most rewarding aspects of the design process was seeing how decisions related to spatial organization contributed to the social goals of the project. Every design choice served the larger vision of creating an environment that fostered both personal well-being and a sense of community. These decisions allowed the project to reflect a holistic approach to urban living, balancing both environmental and social needs in ways that I feel were previously underexplored.
The density of Chicago, its climate, and its unique context all demanded careful consideration throughout the design process. The challenge of integrating a vertical neighborhood within an urban environment pushed me to think critically about the use of space and resources. I had to balance the desire for shared green spaces with the limitations of a dense urban setting. It was a process of negotiation between form, function, and environmental factors that ultimately defined the building’s final layout.
This project has provided me with invaluable insights into how architecture can be used to address not only environmental challenges but also social complexities. It has affirmed my belief that environmental design is crucial to creating a built environment that truly supports community.
Vertical Coalescence
FIGURE 7.6: Image by Author. Created using Rhino & Adobe Illustrator.
APPENDIX
COMPARISON OF SPATIAL EFFICIENCY
Coalescence
FIGURE 8.1: Diagram by Author. Created using Adobe InDesign.
FIGURE 8.2: Diagrams by Author. Created using Adobe Illustrator.
CODE REVIEW: ACCESSIBLE ROUTES
36”min. clear width. *42” for center doors of min. 80” x 51” car.
Accessible vertical access between stories is required.
*Accessible routes must serve each level on a floor required to be accessible.
1:20 maximum walking surface running slope.
*1:48 maximum cross slope
32”min. clear width for doorways and other short distances
36”min. continuous clear width for path of travel.
CODE REVIEW: ACCESSIBLE TOILET & BATHING ROOM
60”x30”min. shower stall with 36”min. opening.
30”x48”min. clearance in front of lavatory.
60”min. diameter turning circle.
*Door may swing into turning space in single occupant toilet rooms. Floor mounted water closet with grab bars.
FIGURE 8.4: Diagram by Author. Created using Adobe Illustrator.
FIGURE 8.3: Diagram by Author. Created using Adobe Illustrator.
CODE REVIEW: APPLICABLE OCCUPANCY TYPES
OCCUPANCY TYPE
(Chicago Building Code 2019 Section 302.1)
ancillary use
mercantile group M
assembly group A-2
assembly group A-3
residential group R-2
Vertical Coalescence
FIGURE 8.5: Diagram by Author. Created using Rhino & Adobe Illustrator.
E Van Buren St
S Wabash Ave
CODE REVIEW: OCCUPIABLE GREEN ROOFS
CODE REVIEW: HEIGHT LIMITATIONS
FIGURE 8.7: Diagram by Author. Created using Rhino & Adobe Illustrator.
FIGURE 8.6: Diagram by Author. Created using Rhino & Adobe Illustrator.
living space working space
STUDIO APARTMENT REQUIREMENTS
natural light & wind enters living/sleeping space
400 sqft. *1-2 occupants
bathing space storage space
cooking space
sleeping space
Vertical Coalescence
FIGURE 8.8: Diagram by Author. Created using Rhino & Adobe Illustrator.
playground equipment
GREEN SPACE REQUIREMENTS
greenery (native species) adjacent to relaxation space
relaxation space
water feature
socialization & eating space
6000 sqft. *60 occupants
FITNESS CENTER REQUIREMENTS
fitness center entrance & access to locker rooms
weight training area
group fitness area
1500 sqft. *30 occupants
cardio area
natural light & wind enters cardio area
open lawn area
FIGURE 8.10: Diagram by Author. Created using Rhino & Adobe Illustrator.
FIGURE 8.9: Diagram by Author. Created using Adobe Illustrator.
REFERENCES
IMAGE LIST
Figure 0.1: 3D drawing of Chicago, designed by author in October 2024. Created using Rhino & Adobe Illustrator.
Figure 0.2: Map of Chicago, designed by author in October 2024. Created using Adobe Illustrator.
Figure 0.3: 3D drawing of final design with context, designed by author in March 2025. Created using Rhino & Adobe Illustrator.
Figure 0.4: Map of Chicago, designed by author in October 2024. Created using Adobe Illustrator.
Figure 1.1: Map of Chicago, designed by author in October 2024. Created using Adobe Illustrator.
Figure 1.2: Collage of Chicago, designed by author in March 2025. Created using Adobe Photoshop & Illustrator.
Figure 1.3: World map, designed by author in November 2024. Created using Adobe Illustrator.
Figure 1.4: Figure ground map of Chicago, designed by author in September 2024. Created using Adobe Illustrator.
Figure 1.5: Diagram of the Chicagoan routine, designed by author in December 2024. Created using Adobe Illustrator.
Figure 1.6: Diagram of Chicago median household income, designed by author in December 2024. Created using Adobe Illustrator.
Figure 1.7: Map of nearby green spaces, designed by author in February 2025. Created using Adobe Illustrator.
Figure 1.8: Site analysis map, designed by author in October 2024. Created using Adobe Illustrator.
Figure 1.9: Site axon, designed by author in March 2025. Created using Adobe Illustrator.
Coalescence
Figure 1.10: Land use & transportation map, designed by author in October 2024. Created using Adobe Illustrator.
Figure 1.11: Wind, noise, views, & permeability map, designed by author in October 2024. Created using Adobe Illustrator.
Figure 1.12: Site narrative diagram, designed by author in December 2024. Created using Rhino and Adobe Illustrator.
Figure 2.1: Section showing air flow through Menara Mesiniaga, designed by Malaysian architecture firm T.R. Hamzah & Yeang Sdn. Bhd. in 1990. Edited by author using Adobe Photoshop in December 2024. Image downloaded from https://www.archdaily.com/774098/ad-classics-menara-mesiniaga-t-rhamzah-and-yeang-sdn-bhd in August 2024.
Figure 2.2: Drawing of the Academy for Global Citizenship, designed by author in December 2024. Created using Adobe Photoshop.
Figure 2.3: Diagram showing reflective mirror panels providing natural lighting for One Central Park, designed by French architecture firm Ateliers Jean Nouvel in September 2014. Edited by author using Adobe Photoshop in December 2024. Image downloaded from https://www.archdaily.com/551329/one-centralpark-jean-nouvel-patrick-blanc in September 2024.
Figure 2.4: Diagram showing the form finding process for De Jakoba Social Housing, designed by Dutch architecture firm Studioninedots in December 2023. Edited by author using Adobe Photoshop in December 2024. Image downloaded from https://www.archdaily.com/993760/de-jakoba-social-housingstudioninedots in October 2024.
Figure 2.5: Diagram showing circulation through Residential Complex Le Lorrain, designed by Belgian firm MDW Architecture in November 2011. Edited by author using Adobe Photoshop in December 2024. Image downloaded from https://www.archdaily.com/181207/residential-complex-le-lorrain-mdwarchitecture in October 2024.
Figure 3.1: Diagram of a horizontal neighborhood, designed by author in January 2025. Created using Adobe Illustrator.
References
Figure 3.2: Diagram of a vertical neighborhood, designed by author in March 2025. Created using Adobe Illustrator.
Figure 3.3: Conceptual experiential vignettes, designed by author in December 2024. Created using Rhino and Adobe Illustrator.
Figure 3.4: Programming matrix, designed by author in November 2024. Created using Adobe Illustrator.
Figure 3.5: Programming bubble diagram, designed by author in November 2024. Created using Adobe Illustrator.
Figure 3.6: Vertical programming diagram, designed by author in November 2024. Created using Adobe Illustrator.
Figure 3.7: Program stacking diagram, designed by author in November 2024. Created using Rhino & Adobe Illustrator.
Figure 3.8: Layered programming diagram, designed by author in March 2025. Created using Adobe Illustrator.
Figure 3.9: Flowing programming diagram, designed by author in January 2025. Created using Adobe Illustrator.
Figure 4.1: Images of parti models, designed by author in December 2024. Created using cardboard, paper, toothpicks, & straws.
Figure 4.2 Image of final parti models, designed by author in November 2024. Created using paper, clay, & matboard.
Figure 4.3: Image of final concept massing model, designed by author in December 2024. Created using chipboard & paper.
Figure 4.4: Image of final concept massing model, designed by author in December 2024. Created using chipboard & paper.
Figure 4.5: Image of final concept massing model, designed by author in December 2024. Created using chipboard & paper.
Figure 4.6: Image of concept sketches, designed by author in February 2025. Created using marker, paper, & Adobe Illustrator.
Figure 4.7: Image of concept sketches, designed by author in February 2025. Created using marker, paper, & Adobe Illustrator.
Figure 5.1: Diagram of final programming, designed by author in March 2025. Created using Adobe InDesign.
Figure 5.2: Diagram of final program massing, designed by author in March 2025. Created using Adobe InDesign.
Figure 5.3: Diagram of various block types, designed by author in March 2025. Created using Rhino & Adobe Illustrator.
Figure 5.4: Diagram of block arrangement, designed by author in March 2025. Created using Rhino & Adobe Illustrator.
Figure 5.5: Diagram of green spaces, designed by author in March 2025. Created using Rhino & Adobe Illustrator.
Figure 6.1: Diagram of programming in section, designed by author in March 2025. Created using Rhino & Adobe Illustrator.
Figure 6.2: Diagram of voids, designed by author in March 2025. Created using Rhino & Adobe Illustrator.
Figure 6.3: Diagram of diagrid, designed by author in February 2025. Created using Rhino & Adobe Illustrator.
Figure 6.4: Diagram of double curtain wall section, designed by author in March 2025. Created using Rhino & Adobe Illustrator.
Figure 6.5: Diagram of water catchment system, designed by author in March 2025. Created using Rhino & Adobe Illustrator.
Figure 6.6: Rendering of exterior, designed by author in March 2025. Created using Rhino, Lumion, & Photoshop. References
Figure 6.7: Rendering of exterior, designed by author in March 2025. Created using Rhino, Lumion, & Photoshop.
Figure 6.8: Rendering of lobby & retail space, designed by author in March 2025. Created using Rhino, Lumion, & Photoshop.
Figure 6.9: Section perspective of one village, designed by author in March 2025. Created using Rhino, Lumion, & Photoshop.
Figure 6.10: Section highlighting one village, designed by author in March 2025. Created using Rhino & Adobe Illustrator.
Figure 6.11: Tranquility park floor plans, designed by author in March 2025. Created using Rhino & Adobe Illustrator.
Figure 6.12: Renderings of tranquility park, designed by author in March 2025. Created using Rhino, Lumion, & Photoshop.
Figure 6.13: Rendering of tranquility park, designed by author in March 2025. Created using Rhino, Lumion, & Photoshop.
Figure 6.14: Residential floor plans, designed by author in March 2025. Created using Rhino & Adobe Illustrator.
Figure 6.15: Renderings of residential spaces, designed by author in March 2025. Created using Rhino, Lumion, & Photoshop.
Figure 6.16: Social floor plans, designed by author in March 2025. Created using Rhino & Adobe Illustrator.
Figure 6.17: Rendering of social floor, designed by author in March 2025. Created using Rhino, Lumion, & Photoshop.
Figure 6.18: Rendering of park bridge facing north, designed by author in March 2025. Created using Rhino, Lumion, & Photoshop.
Figure 6.19: Rendering of park bridge facing south, designed by author in March 2025. Created using Rhino, Lumion, & Photoshop.
Coalescence
Figure 7.1: Images of final massing model, designed by author in March 2025. Created using chipboard & paper.
Figure 7.2: Images of final intermediate chunk model, designed by author in April 2025. Created using chipboard.
Figure 7.3: Images of final detail chunk model, designed by author in April 2025. Created using chipboard.
Figure 7.4: Image inside final detail chunk model, designed by author in April 2025. Created using chipboard.
Figure 7.5: Diagram of future application, designed by author in April 2025. Created using Adobe Illustrator.
Figure 7.6: 3D drawing of final design with context, designed by author in March 2025. Created using Rhino & Adobe Illustrator.
Figure 8.1: Comparison of spatial efficiency, designed by author in March 2025. Created using Adobe InDesign.
Figure 8.2: Diagrams of sustainable features, designed by author in January 2025. Created using Adobe Illustrator.
Figure 8.3: Diagram of code pertaining to accessible routes, designed by author in November 2024. Created using Adobe Illustrator.
Figure 8.4: Diagram of code pertaining to accessible toilet rooms, designed by author in November 2024. Created using Rhino & Adobe Illustrator.
Figure 8.5: Diagram of applicable occupancy types, designed by author in November 2024. Created using Rhino & Adobe Illustrator.
Figure 8.6: Diagram of code pertaining to occupiable green roofs, designed by author in November 2024. Created using Rhino & Adobe Illustrator.
Figure 8.7: Diagram of code pertaining to height limitations, designed by author in November 2024. Created using Rhino & Adobe Illustrator. References
Figure 8.8: Diagram of studio apartment requirements, designed by author in November 2024. Created using Rhino & Adobe Illustrator.
Figure 8.9: Diagram of green space requirements, designed by author in November 2024. Created using Rhino & Adobe Illustrator.
Figure 8.10: Diagram of fitness center requirements, designed by author in November 2024. Created using Rhino & Adobe Illustrator.
Vertical Coalescence
RESEARCH BIBLIOGRAPHY
Canter, David. “Environment in Buildings Series-3: Architecture and Psychology.” Built Environment 1, no. 3 (1972): 188–90. JSTOR.
Cheshmehzangi, Ali, and Ayotunde Dawodu. “Passive Cooling Energy Systems: Holistic SWOT Analyses for Achieving Urban Sustainability.” International Journal of Sustainable Energy 39, no. 9 (2020): 822–42. GreenFILE.
Gonzales, Teresa Irene. Building a Better Chicago: Race and Community Resistance to Urban Redevelopment. New York University Press, 2021.
Howell, Kathryn, and Barbara Brown Wilson. “Preserving Community through Radical Collaboration: Affordable Housing Preservation Networks in Chicago, Washington, DC, and Denver.” Housing, Theory & Society 36, no. 3 (2019): 319–37. Academic Search Complete.
Kozamernik, Jana, Martin Rakusa, and Matej Niksic. “How Green Facades Affect the Perception of Urban Ambiences: Comparing Slovenia and the Netherlands.” Urbani Izziv 31, no. 2 (2020): 88–100. JSTOR.
Peterson, Terry. “A Vision for Change.” Economic Development Journal 4, no. 2 (2005): 30–34. Academic Search Complete.
References
