
Tracking key demographic and health status trends over time provides insights into progress made towards reducing longstanding unfair health differences. Health is commonly defined as ‘a state of complete physical, mental and social well-being and not merely the absence of disease or infirmity’,1 and in economic terms it refers to the ability of people to thrive. What determines the realisation of good health however is multifactorial and complex. Importantly, the attainment of good health outcomes cannot be achieved exclusively through the efforts of the health sector. One’s genetic predisposition, along with a range of political, social, economic and environmental factors all influence health and well-being. This includes factors such as the geographic and political contexts within which one lives.
This chapter updates the one from the previous publication, covering the 2009–2014 period. It provides an overview of the main demographic and health trends in the country. It also highlights areas in which progress has been made as well as the challenges that remain, and concludes with a focus on how the country can improve the monitoring of the health status of South Africans in terms of equity.
South Africa is one of the most unequal countries in the world. The inequality in South Africa is rooted in the apartheid era. South Africa has a Gini coefficient of 63.0.2 Key drivers of inequality in South Africa are income, race, gender, geographic location and household composition.3,4 Labour and investment income are the greatest drivers of inequality. In recent years however, social grants have been shown to decrease inequality, as have remittances.3, 5
Examining health trends through an equity lens requires the application of a moral dimension or judgement when analysing the differences in health across population strata (health inequalities). The judgement considers how much these differences are (1) avoidable (i.e. not the result of biology and genetics but rather consequences of how the society distributes resources and opportunities), and (2) unfair and unjust where factors such as wealth, power or social standing and not need drives unequal distribution of resources.6, 7
In South Africa, various studies have directly or indirectly measured health equity, and produced indicators of health inequality.4, 8, 9, 10, 11, 12 The studies have largely adopted cross-sectional methods to measure health status.13 The analysis of health inequality has also been based on comparisons of health outcomes across population strata defined in geographical, socio-economic or demographic terms accompanied by a composite index.9, 12, 14, 15 While explicit recall of the moral judgement that underlies the definition of health inequity is not absent in the cited literature, in most cases the unfair and unjust nature of socio-economic disparities (after adjustment for biological determinants such as gender and age) is implicit in the approach.
The equity analyses carried out in the South African population have been mostly based on self-reported data from population surveys 9, 10, 12, 15, 13, 14 and sometimes on local epidemiological surveillance sites, and reflects the general weakness of routinely collected aggregate health data and health information systems in providing indicators disaggregated by population strata. This is a problem common in countries with limited resources and often hinders the possibility of measuring inequalities and inequities by using the most suitable indicators from a theoretical point of view requiring the choice of alternative measures as proxies. A case in point is the difficulty in monitoring geographical inequalities in the progress towards universal health coverage in South Africa.16 The District Health Barometer has however made use of socio-economic status by geographic areas as a crude measure of inequity that can be used with aggregate routine data.17
Knowledge of the limitations of existing data collection systems and the implications thereof are however important to highlight here as these are to be considered when reviewing and discussing the health data presented in this chapter where possible. In the following sections, we will accompany our description of the demographic and health trends between 2015 and 2020 with equity considerations. We will do this by presenting and commenting on selected geographic, demographic and socio-economic patterns observed in the data and on how these patterns differ from those that we would expect from an equity perspective.
South Africa’s population was just under 60 million during 2020.18 Over the period under review (2015–2020), the population increased by 8.5%.18 In 2020, females (51.1%) outnumbered males, and 80.8% were classified as African, followed by Coloured (8.8%), White (7.8%) and Indian/Asian (2.6%). In general, urbanisation is increasing.18 More than half the population live in three provinces, and two-thirds (66.7%) live in urban areas.19 Gauteng, the economic hub, remains the most populous province (at over 15 million people) despite being the smallest in size, followed by KwaZulu-Natal (KZN) (19.3% of the total population) and the Western Cape (WC) at 11.7%.18 The remaining primarily rural provinces have much smaller population sizes, with the Northern Cape (NC) estimated to comprise 2.2% of the population.
Internal migration patterns reveal population movements from rural to more urbanised provinces between 2015 and 2020. Internal migration was positive for Gauteng (13.4%), WC (9.9%) and NW (8.9%), but almost negligible for MP and NC and negative for the remaining provinces.18 A positive influx of migrants from outside of South Africa was observed for all provinces between 2016 and 2021. Gauteng province and the WC received the greatest influx of migrants (internal and external), while the EC, LP and KZN had a negative total for migration. The population shifts have implications for resource allocation and health care provision, access and usage and have impacts beyond health to other sectors.
Births are the main driver of population growth in South Africa. The total fertility rate peaked in 2008 at 2.66 and is progressively declining, dropping to 2.33 in 2020.18 Fertility varies across provinces. In 2020, fertility was highest in the rural provinces, namely LP (2.90) and MP (2.85) and lowest in the urban provinces of WC (2.01) and GP (1.90).18
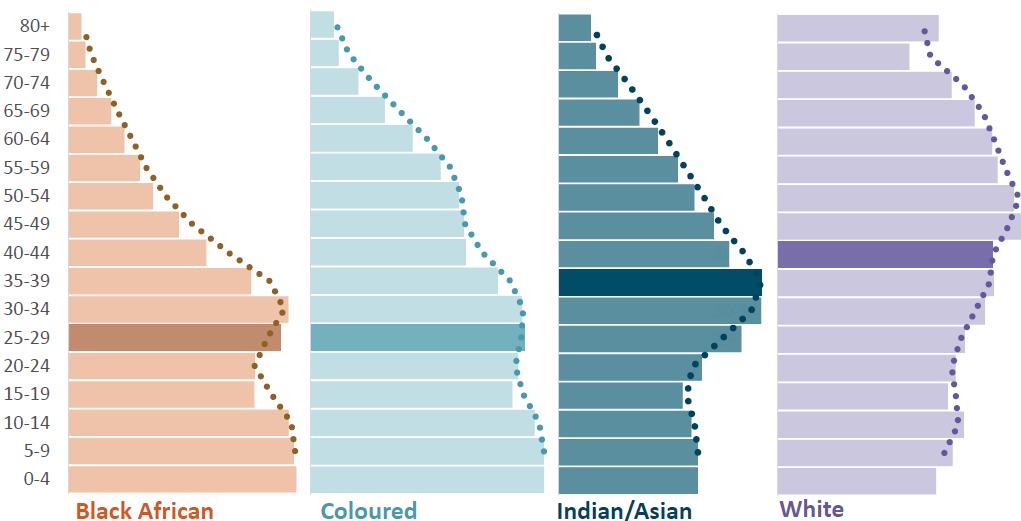
Trends also show that South Africa’s population is growing older as the fertility rate declines overall.18 The rate of annual growth among the elderly (60 years and older) rose from 1.09% in 2002/2003 to 2.99% in 2015/2016 and remained relatively static at 2.97% in 2019/2020. In 2020, 28.6% of the population were aged 0–14 years, with most residing in KZN (21.8%) and GP (21.4%), with the 25–54-years age bracket comprising the largest population proportion (42.5%).18 The median age is also increasing from 23 years in 2002 to 27 years in 2020 (Figure 2.1). The youth (15–34 years) have increased by 4.2 million between 2002 and 2020. The economically active age group (15–64 years) represents 63.5% of the total population.18 Child and old age dependency ratios show a decrease since 2002. In 2020 Statistics South Africa reported that the population under 15 was lowest in WC (27%) and highest in rural provinces, with LP being the highest at 39%. This suggests a greater economic burden on the working-age population in these provinces. Importantly, population profiles also differ according to population group, with higher dependency ratios amongst Africans and Coloureds (Figure 2.2).18
Demographic and health trends: 2015-2020
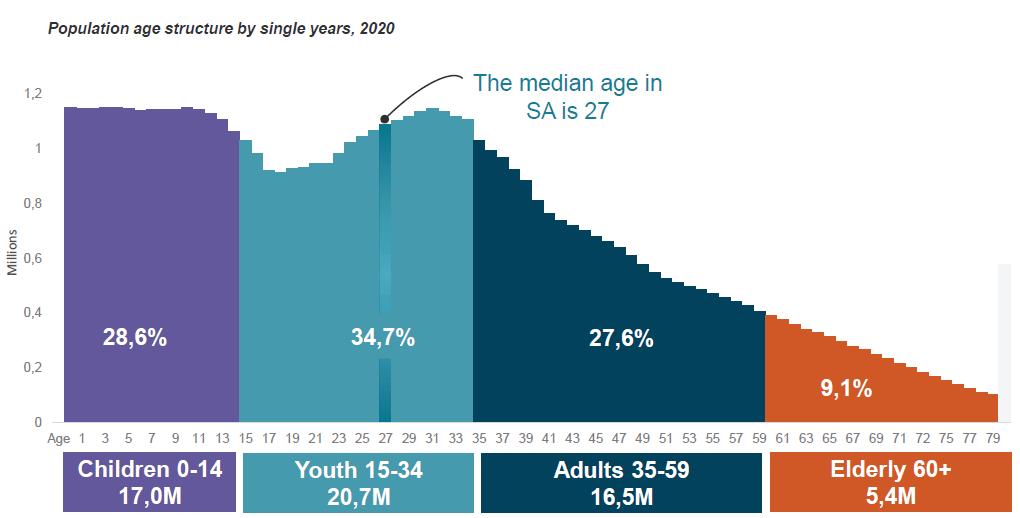
2.1 Population age structure by single years, 2020 18
18
South Africa has observed declines in overall mortality, and mortality among infants, children and women. However, these gains have all reversed over the last year due to the impact of the COVID-19 pandemic. The overall health status of the South African population has improved since 2007 and this trend continued between 2015 and 2020. Life expectancy (LE) has increased and was at an all-time high in South Africa during 2020.
The LE at birth increased between 2015 and 2020, from 60.2 to 62.5 years for males and from 64.3 to 68.5 years for females.18 The increase in LE over the past decade has largely been driven by decreasing child and young adult mortality rates attributable to the scale-up of various health programmes, including the South African antiretroviral treatment programme.20 21
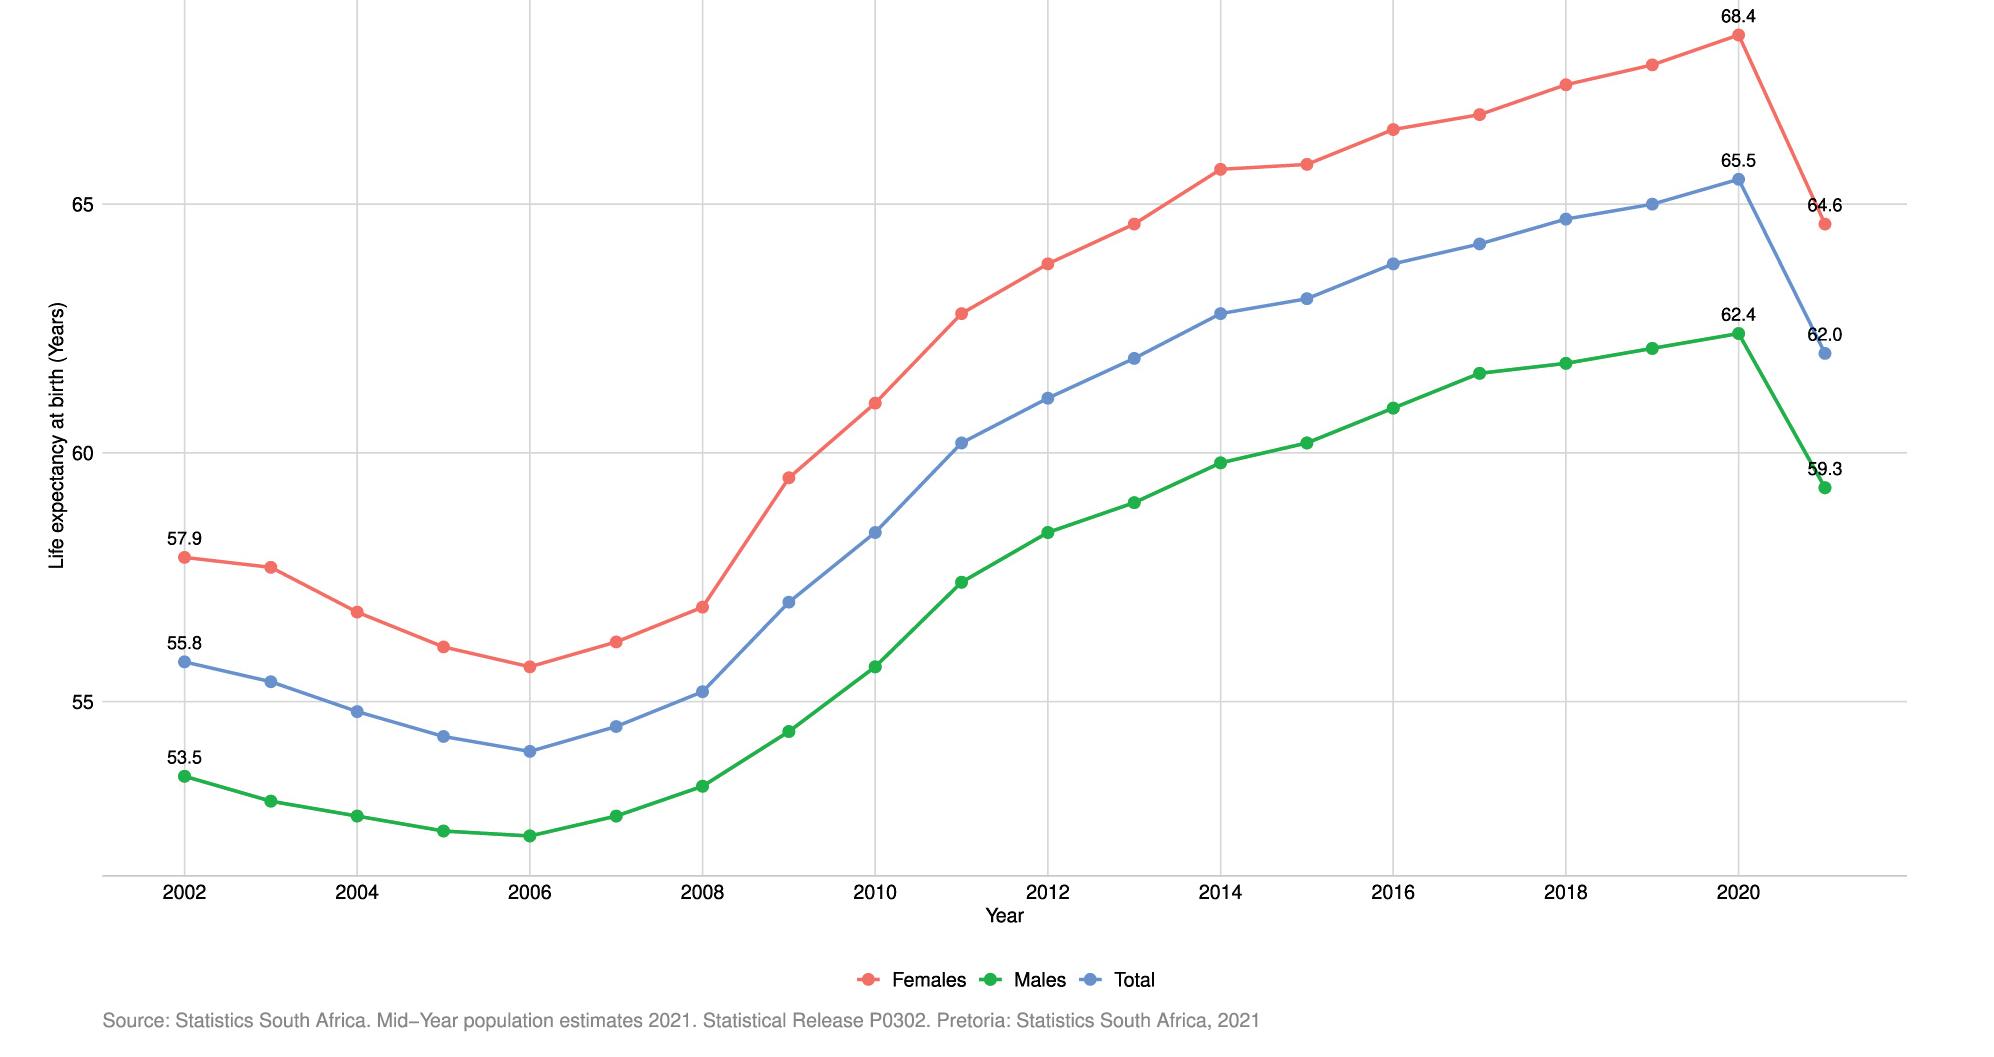
Figure 2.3 Life expectancy at birth: South Africa 2002–2021 [Years]
Since early 2020, South Africa was however ravaged by SARS-CoV-2 infections which reversed the LE gains (See chapter on Emergencies and COVID-19).
Mid-year estimates for 2021 released by Statistics South Africa estimate the impact of the pandemic on mortality since early 2020.22 The LE for males declined from 62.4 in 2020 to 59.3 in 2021, and for females the decline was from 68.4 to 64.6 years (see Figure 2.3). These declines in LE and increases in mortality reflect the ‘cumulative burden of the crisis’ when compared to recent trends. Excess deaths are defined as the total number of all-cause deaths observed during a crisis that occurs in excess of levels observed under normal conditions, and provides information on the impact of the pandemic in terms of deaths reported due to confirmed COVID-19 infections.22 23 Higher mortality was observed amongst older people and groups with comorbidities, as reflected in the age-mortality profiles.
In South Africa, causes of deaths are recorded on death notification forms completed by medical practitioners and other role players within the health system. These deaths are further categorised as natural or unnatural. Profiles of deaths in South Africa confirm that the country is faced with a quadruple burden of disease and is currently experiencing an epidemiological transition. The trends suggest an ongoing shift towards non-communicable diseases (NCDs) as the predominant cause of death, whereas communicable diseases drive infant and child mortality. Most of these causes are avoidable and have their root causes within an array of social and economic determinants of health.
A steady rise in NCDs as a cause of death has been observed since the late 2000s.24 As of 2018, just under 60% of total deaths were attributable to NCDs compared to 55.5% in 2015. Just over 10% of the population died due to injuries (e.g. homicide, accidents and suicide). A marginal upward trend is observed for the past two years. Non-communicable diseases are the primary broad cause of death amongst adult males aged 30–50 years and women aged 25–39 years, whereas the percentage of deaths due to injuries is high amongst males in the 5–9 years and 15–19 years groups, and peaks at about 65% for those aged 20–24 years.
Tuberculosis (TB) still ranks as the leading natural cause of death in 2018, followed by diabetes mellitus (DM), cardiovascular disease and other forms of heart diseases. HIV ranked fifth overall. Amongst males, TB, HIV and other forms of heart disease, DM and influenza and pneumonia are the primary underlying causes of death. For females, the primary causes are DM, cardiovascular heart disease, hypertensive disease and other forms of heart disease and HIV. For males, trends in underlying causes of death (per cause) have remained static for all causes except for TB, other forms of heart disease, influenza and pneumonia, where increases were noted. For women, increasing trends were noted for TB, other forms of heart disease, and influenza and pneumonia.
The 10 leading underlying natural causes of death for broad age groups (2018) reveal important information for policy-makers (Table 2.1). When exploring the underlying immediate, or contributing causes of death in 2018, TB, DM, cardiovascular disease, other forms of heart disease, HIV, hypertensive disorders, influenza and pneumonia, chronic lower respiratory disease and malignant neoplasms of digestive disorders were ranked amongst the top 10 (descending order). Non-natural causes of death in 2018 (n=54 163) were primarily due to external causes of accidental injury (68.3%), followed by assault (14.5%) and transport accidents (11.4%). The number of unnatural deaths among the 15–59-year-olds showed a constant increase over time, which is of great concern.23
Table 2.1 The 10 leading underlying natural causes of death per age groups in South Africa
Ages 1–14
Influenza and pneumonia
Intestinal infectious disease
TB
Other forms of heart disease
Cerebral palsy and other paralytic syndromes
Ages 15–44
TB
HIV
Other viral diseases
Other forms of heart disease
Cerebral palsy and other paralytic syndromes
Ages 45–64 years
TB
DM
HIV
Cardiovascular Disease
Other forms of heart disease
Ages 65+
DM
Cardiovascular Disease
Hypertensive Disease
Other forms of heart disease
Ischaemic Heart Disease
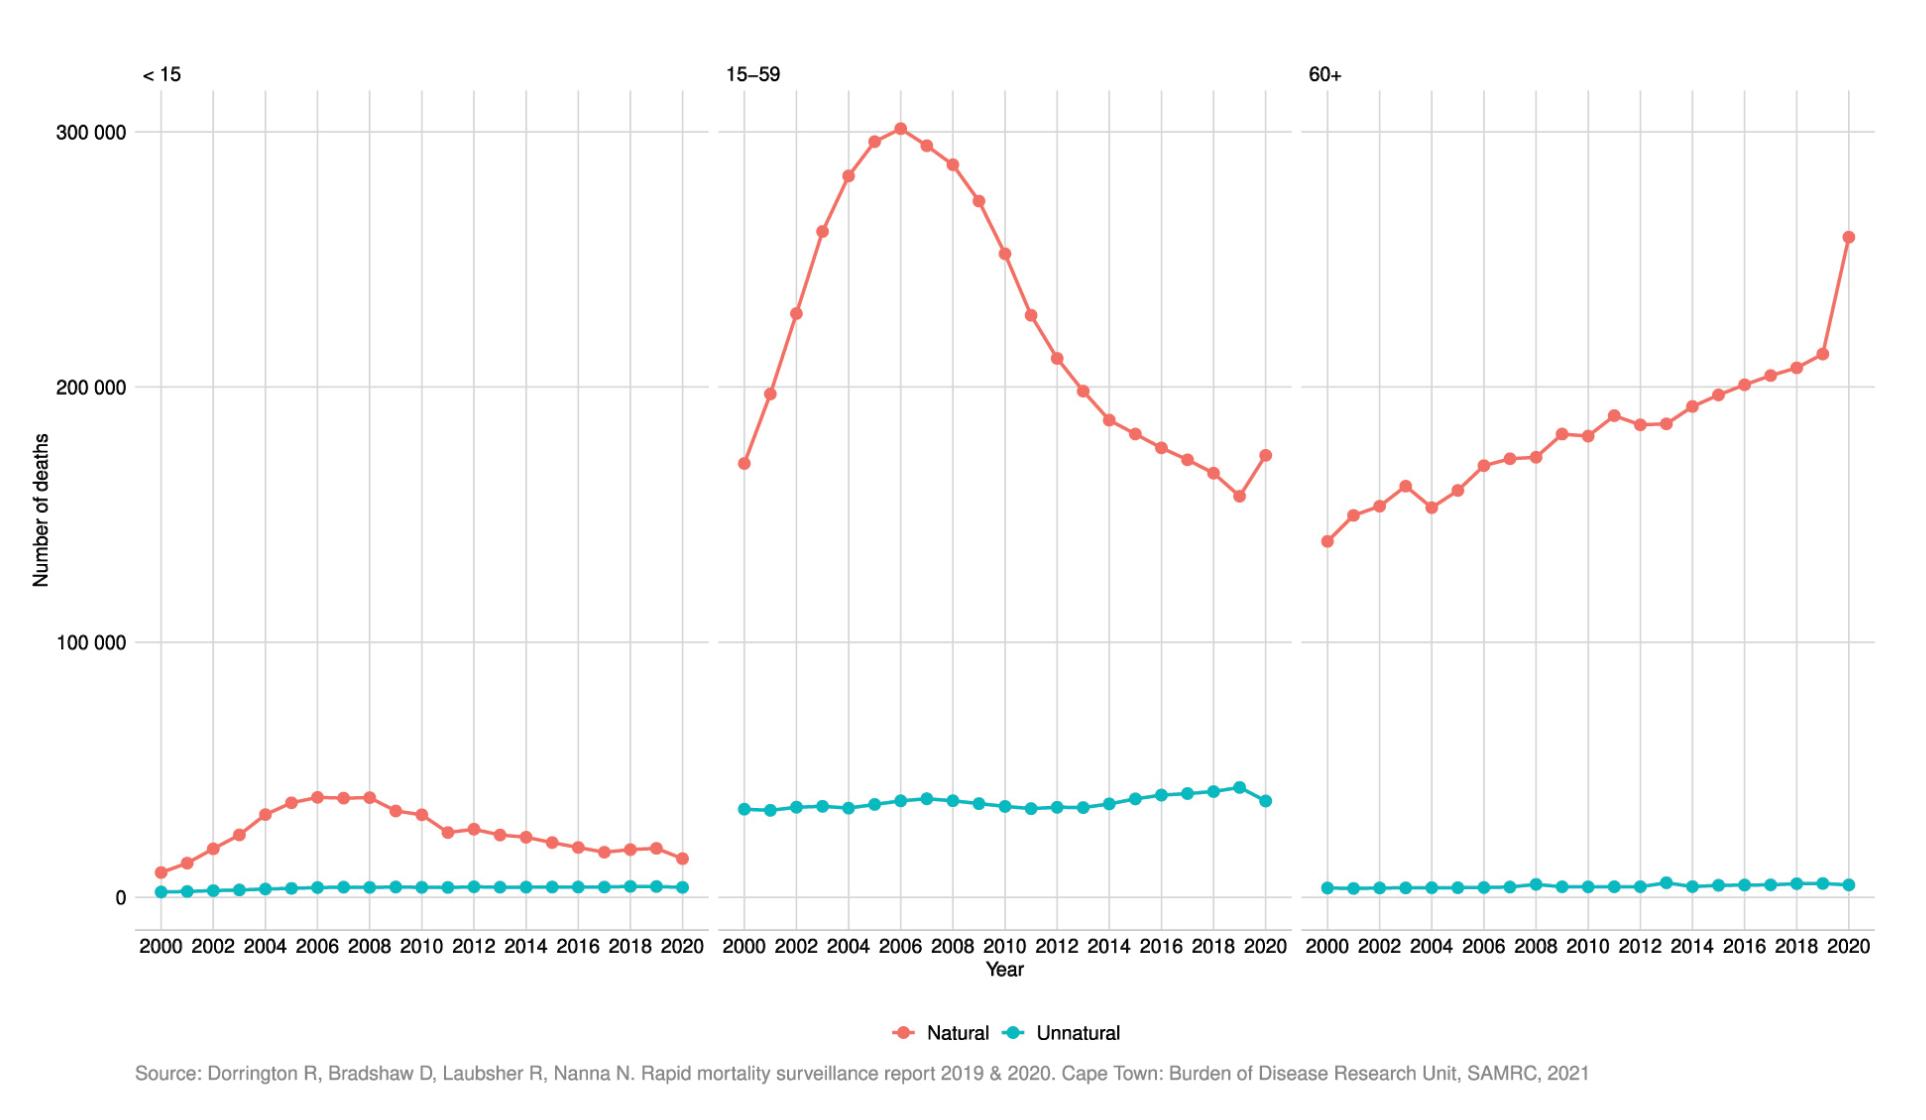
2.4 Number of natural and unnatural deaths: South Africa 2000–2020
Indicators measuring child mortality are good indicators of a population’s health,25 and neonatal mortality is said to reflect the strength of a country’s health system.26 High death rates amongst children reflect policy failures at multiple levels and have broader societal and public health impacts. Overall, infant mortality rates (IMRs) and under-five mortality rates (U5MRs) in South Africa continue to decline. In South Africa, most women access public sector health facilities during the antenatal period and when giving birth. The indicators presented here reflect mortality rates as measured within public sector health facilities.
The early neonatal death in-facility rate, namely infants of 0–7 days who died during their stay, has decreased between 2017/18 and 2019/20 from 10.2 to 9.6 per 1 000 live births, respectively. Similar reductions are reflected for overall in-facility neonatal mortality (infants 0–28 days who died during their stay in-facility per 1 000 live births) and stillbirth rates. Disaggregation by province however reveals inter-provincial differences with poorer outcomes observed in the more rural provinces. The early neonatal death in-facility rate was highest in the NC (13.1 per 1 000 live births) and lowest in the WC (6.5), with increasing rates observed within three predominantly rural provinces (LP, NC and NW). Stillbirth rates were highest in the NC (24) and lowest in the WC (16.5). Neonatal death rates are highest in the FS (15.6) and NC (15.5), and lowest in the WC (8.2). Increasing trends are noted in the FS, LP, NC and NW provinces.
Infant mortality rates (deaths under one-year per 1 000 live births) and U5MRs have significantly improved over the five-year period. The IMR was estimated to be at 28 per 1 000 live births in 2015, compared to 21 in 2020 (according to the Rapid Mortality Surveillance report 2019/2020) and 23.6 in 2020 (according to Statistics South Africa). The U5MR was 39 per 1 000 live births in 2015, compared to 28 per 1 000 live births in 2020 (according to the Rapid Mortality Surveillance report 2019/20 ) and 34.1 in 2020 (according to Statistics South Africa).28
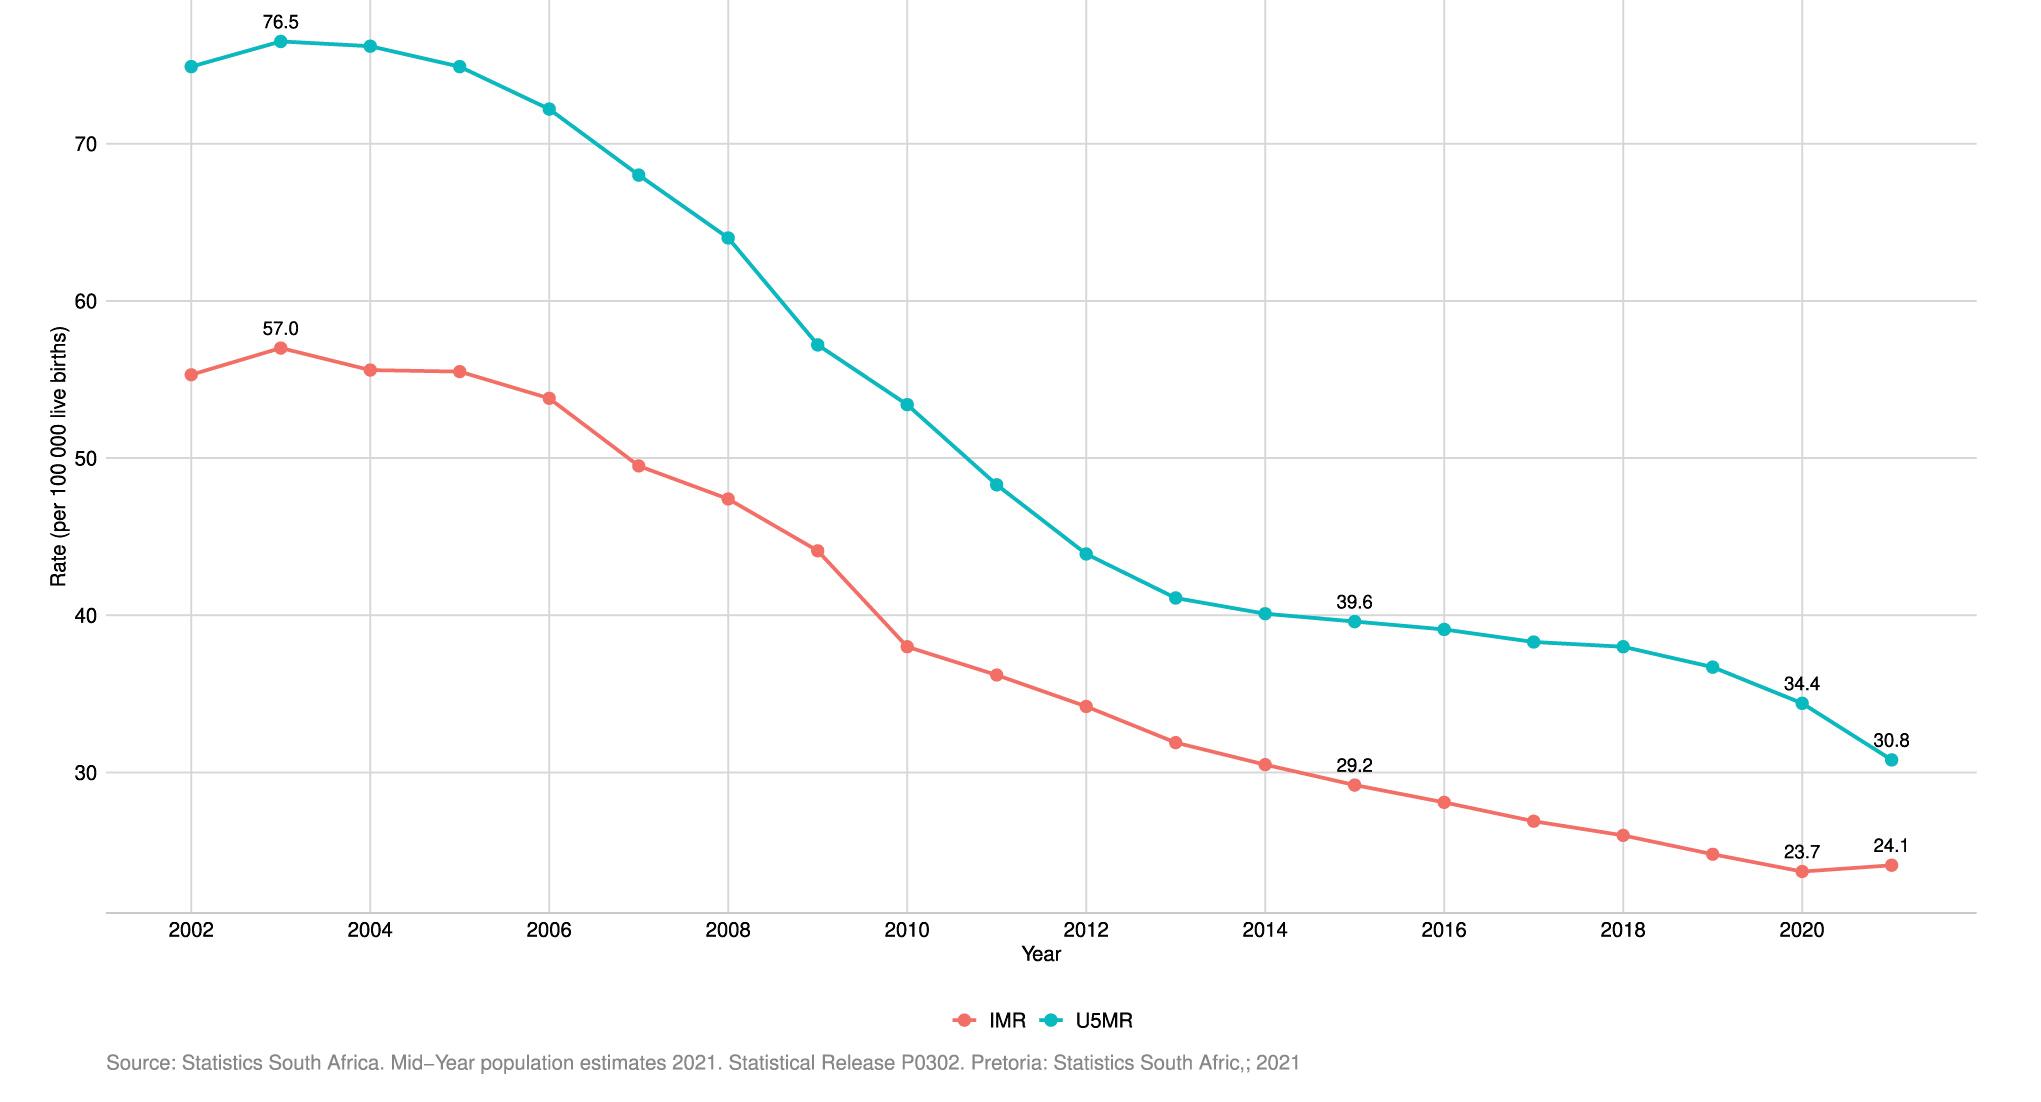
Figure 2.5 Infant Mortality Rate (IMR) and Under-5 Mortality Rate (U5MR): South Africa 2002–2020 [%]
Low birth weight is defined as weight at birth less than 2 500g. The proportions were calculated from the sum of live births under 2 500g divided by the total sum of live births in a facility. Nationally, there was a decrease in the percentage of children with low birth weight between the years 2014 and 2015 (13.1% to 12.9%). Thereafter, there was a steady increase from 12.9% in 2015 to 13.5% in 2017, then a decrease to 12.9% in 2018 reverting back to 2015 levels. The figure below reflects the provincial trends. Northern Cape has consistently recorded the highest percentages of children with low birth weight for all the years. Provinces that have experienced an increase in the proportions of live births under 2 500g over the 2014–2019 period are EC (13.6% to 14.0%) and FS (13.6% to 13.9%).
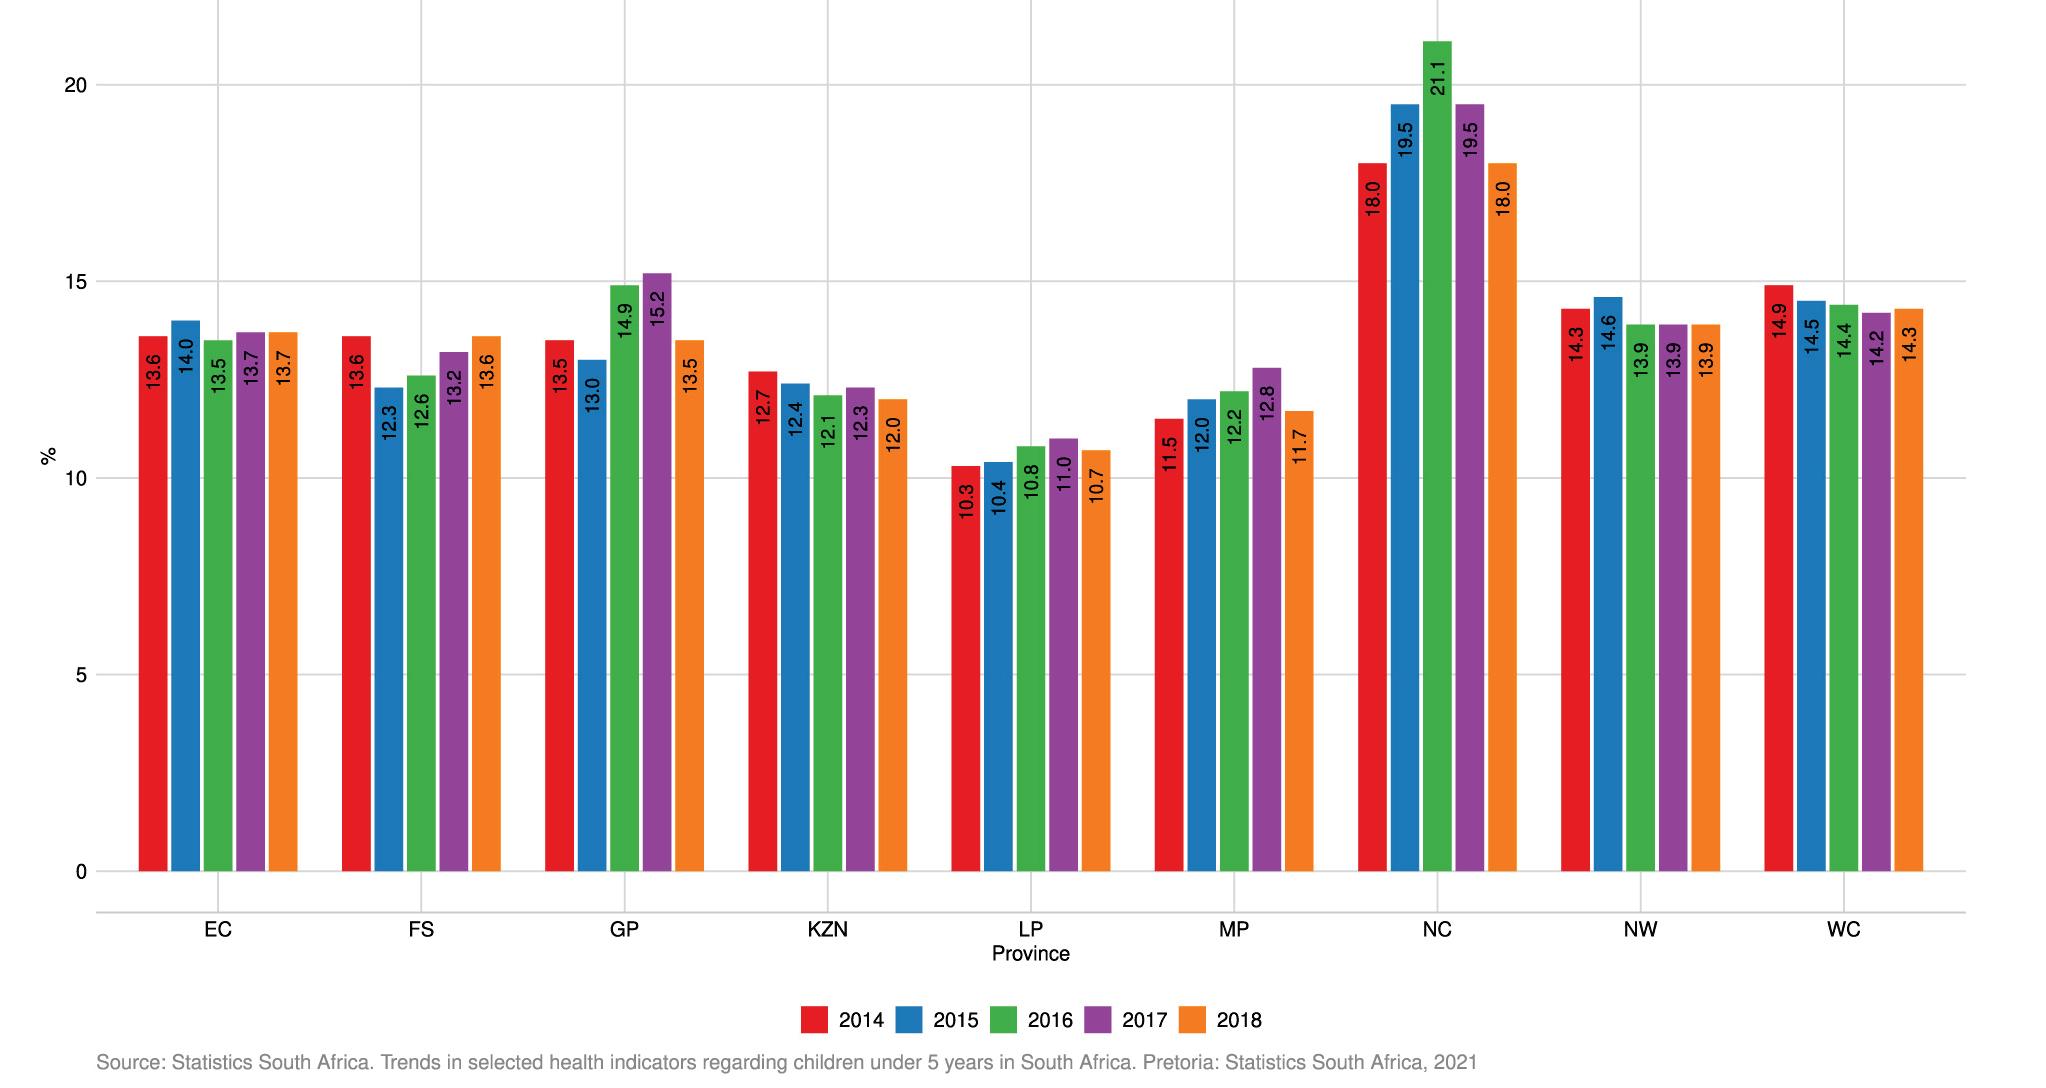
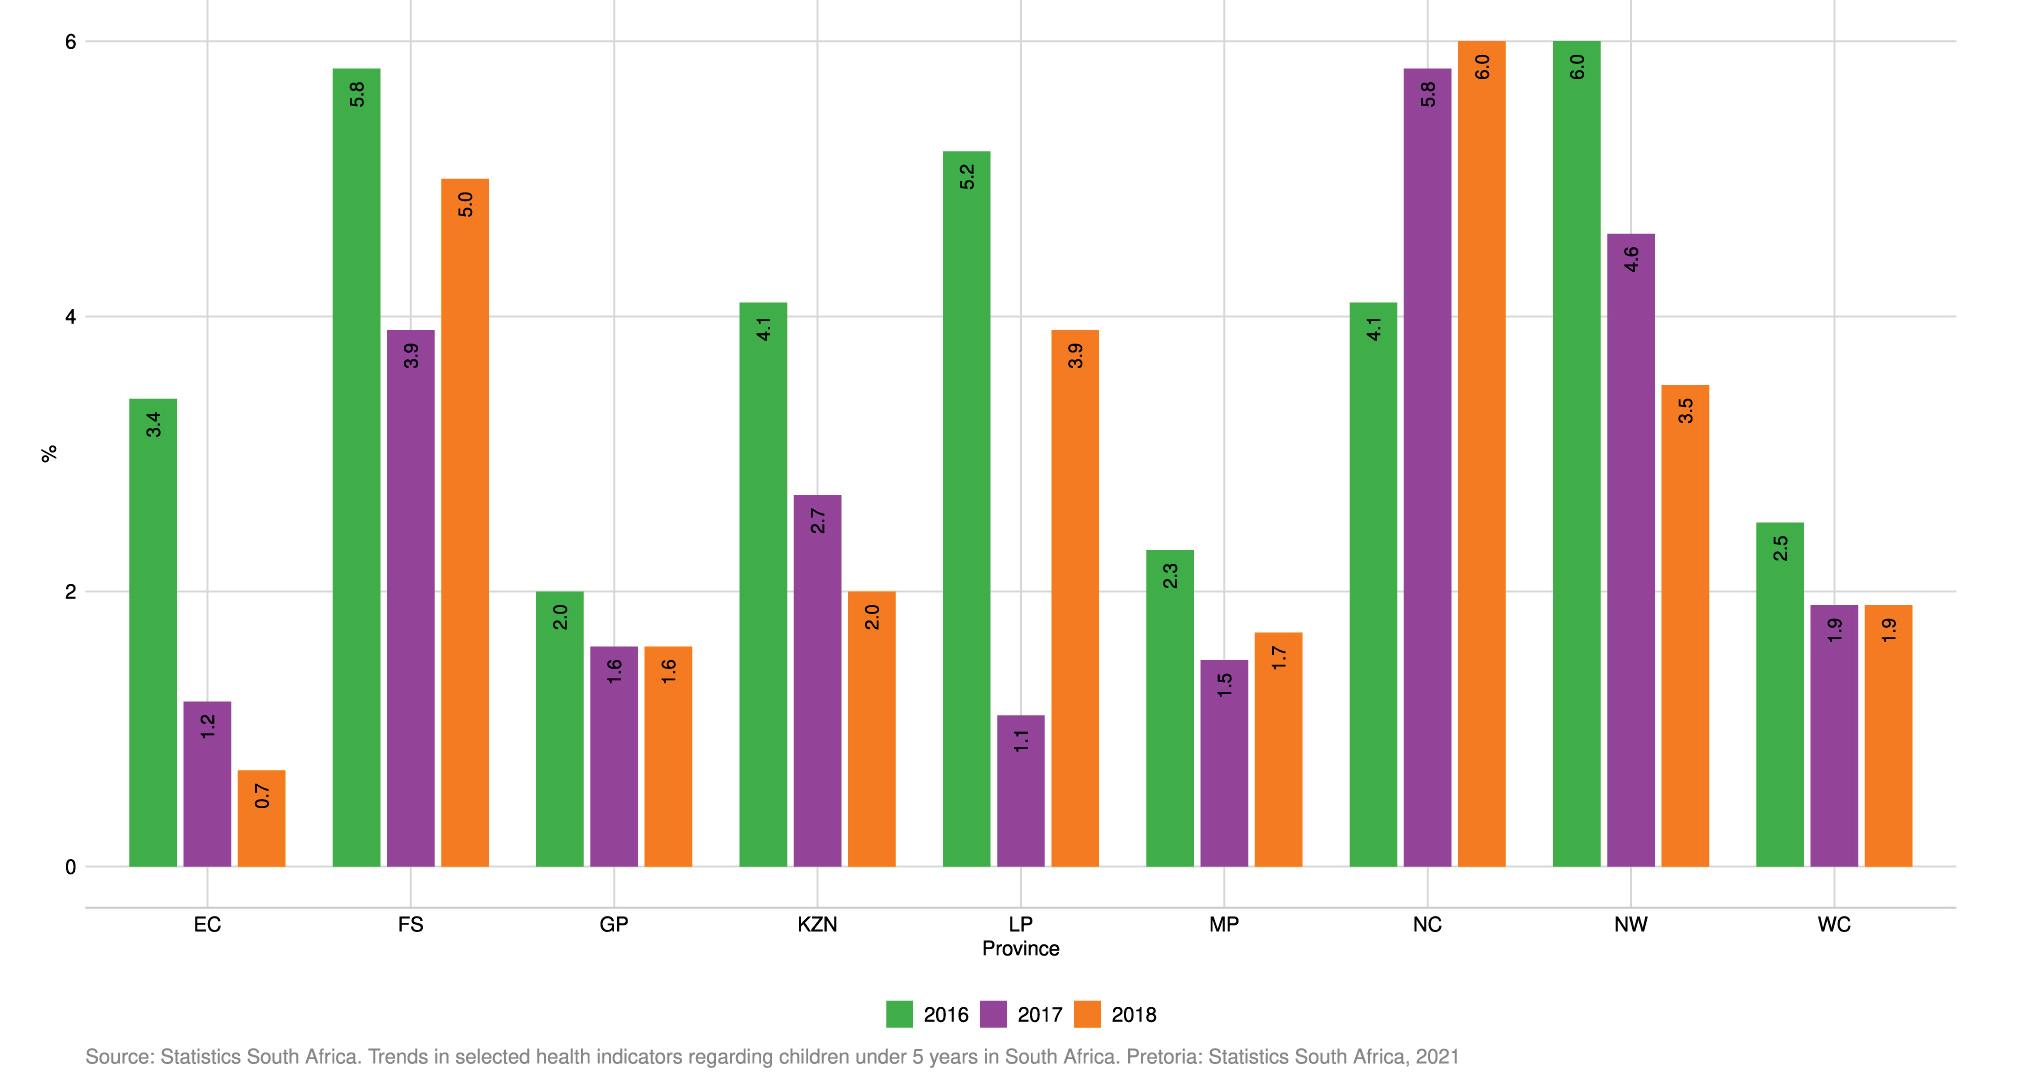
Figure 2.6 Proportion of children under five years born with low birth weight: South Africa 2015–2018, by province [%]
Malnutrition
Malnutrition is a leading cause of death amongst children in South Africa and has significant longstanding effects on those who survive and generations to come. Nationally, proportions of children under five years with Severe Acute Malnutrition (SAM) decreased slightly from 3.6% in 2016 to 2.1% in 2017, and then increased slightly from 2.1% in 2017 to 2.2% in 2018. In 2018, NC, FS and NW had the highest proportion of SAM incidences of 6%, 5% and 4.6%, respectively, while EC, GP and MP had the lowest proportions at 0.7%, 1.6% and 1.7%, respectively. In 2019, the General Household Survey reported that severe food inadequacy was highest in the NC (12.2%) and the NW (11.4%) provinces – higher than the national value of 6.3%.29 It is very likely that the levels of SAM will have been massively worsened by the COVID-19 crisis.
Measuring maternal mortality provides insights into health services and broader societal factors that determine the health of a pregnant woman and her ability to deliver a child. The National Committee on Confidential Enquiries into Maternal Deaths (NCCEMD) has documented the rise and fall of maternal deaths, with the institutional Maternal Mortality Ratio (iMMR) reaching a peak of 189 per 100 000 live births in 2009 and dropping well below 100 per 100 000 live births in 2019 for the first time since the start of the enquiry.30 Nationally, in-facility maternal deaths declined from 1 019 (2017/18) to 928 (2019/20) per annum. This translates into an iMMR of 105.7 to 88.0 per 100 000 live births over the same period. Provincial trends over time reflect similar improvements, except for the NC where the ratio has increased from 65.9 to 109.9 per 100 000 live births over the 2017/18 to 2019/20 period.
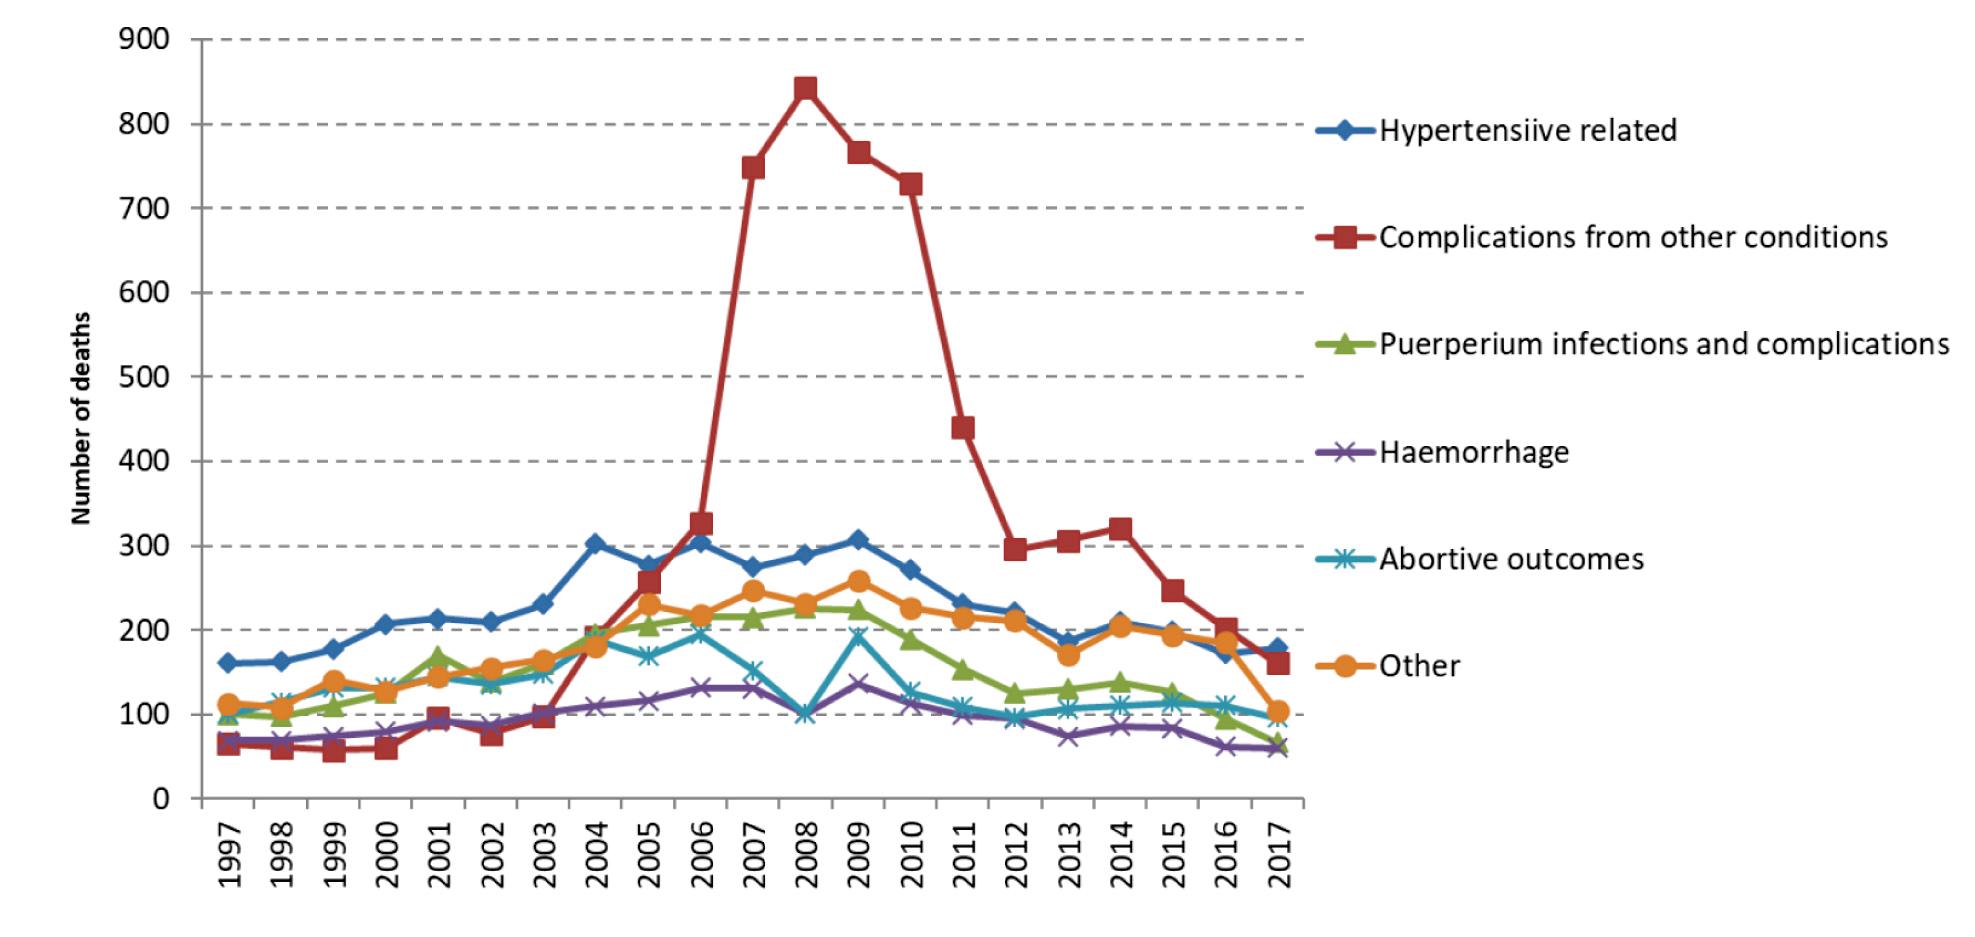
Figure 2.8 Number of maternal deaths by underlying cause: South Africa 1997–2017*
* Other refers to ‘previous existing disease or disease that developed during pregnancy and not due to direct obstetric causes but were aggravated by the physiologic effects of pregnancy’
Source: Dorrington R, Bradshaw D, Laubsher R, Nanna N. Rapid mortality surveillance report 2019 & 2020. Cape Town: Burden of Disease Research Unit, SAMRC, 2021
Annually, a representative portion of the South African population are asked to rate their health based on their own definition of health, and where they accessed care and their levels of satisfaction.29 In a 2019 survey, the first type of health care facility accessed by households when members were ill or injured were public clinics (65.4%), private doctors (21.0%), public hospitals (6.9%), private hospitals (3.1%) and private clinics (2.1%). Public health clinic use was highest in LP (74%), MP (81.2%) and the EC (80.9%), whereas usage in the WC (42.3%) and GP (59.4%) were the lowest. Most (77.1%) reported being very or somewhat satisfied with the services received within the public sector, compared to 97.4% for the private sector.
This is also reflected in the medical aid coverage, where it was highest in GP (24.9%) and the WC (24.1%) and lowest in LP (9.9%) and the EC (10.8%).29 Overall, a very small increase in the medical aid coverage was noted in the country since 2002 (15.9%–17.2%), but this value has remained relatively static between 2015 and 2020. The average for those living in metropolitan cities was 25.2%. The population group that reported the highest coverage were those who classified themselves as White (72.4%), followed by the Indian/Asian group (47.2%). Coverage was lowest for the Coloured group (20.6%) and Black Africans, where only one-tenth reported coverage (10.8%).
During 2020, there were no vaccines available for COVID-19 in South Africa, therefore adherence to non-pharmaceutical interventions and a series of stringent national lockdowns were the only methods available for mitigating and containing its spread. (See chapter on Emergencies and COVID-19 for more detailed discussion.) Numerous innovative data systems and reporting tools were developed to track the pandemic, and manage the country’s response. It is important however to note that the official COVID-19 case numbers are considered an under-estimation of the true number of infections32, as the national testing strategy evolved over time and prioritised certain age and disease risk groups when the country experienced a resurgence. By implication, the number of COVID-19-related deaths also reflect an under-estimate, as demonstrated by the high excess death rates. Furthermore, many infected individuals are asymptomatic or do not access testing services.
The association between TB and socio-economic conditions is well-known, with poor social and environmental conditions known to promote high infection rates. As highlighted in this chapter, TB remains a primary cause of death in South Africa and high TB prevalence rates continue to be a major cause for concern. This is discussed in detail in the Chapter on National Health Programmes. The prevalence peaks in those aged 35–44 years and in those aged 65 years and older and is lowest among those aged 15–24 years (Figure 2.9). The First South African National TB Prevalence Survey34 conducted in 2018 estimated the prevalence of bacteriologically confirmed pulmonary TB in South Africa at 852 (95% CI 679-1.026) per 100 000 population among individuals 15 years and older. Using this survey estimate, the prevalence of TB for all forms of TB and ages in South Africa was calculated adjusting for individuals younger than 15 years (29%), a rate ratio of child to adult TB (0.6) and the proportion of notified cases that are extra-pulmonary TB (9.7%). The estimated prevalence of TB (all ages, all forms) in South Africa in 2018 was 737 (95% CI 580-890) per 100 000 population. Provincial disaggregation of the data reveals that the highest incidences of TB were recorded in KZN (492.8), NC (592.5) and the WC (617.9) per 100 000 population.
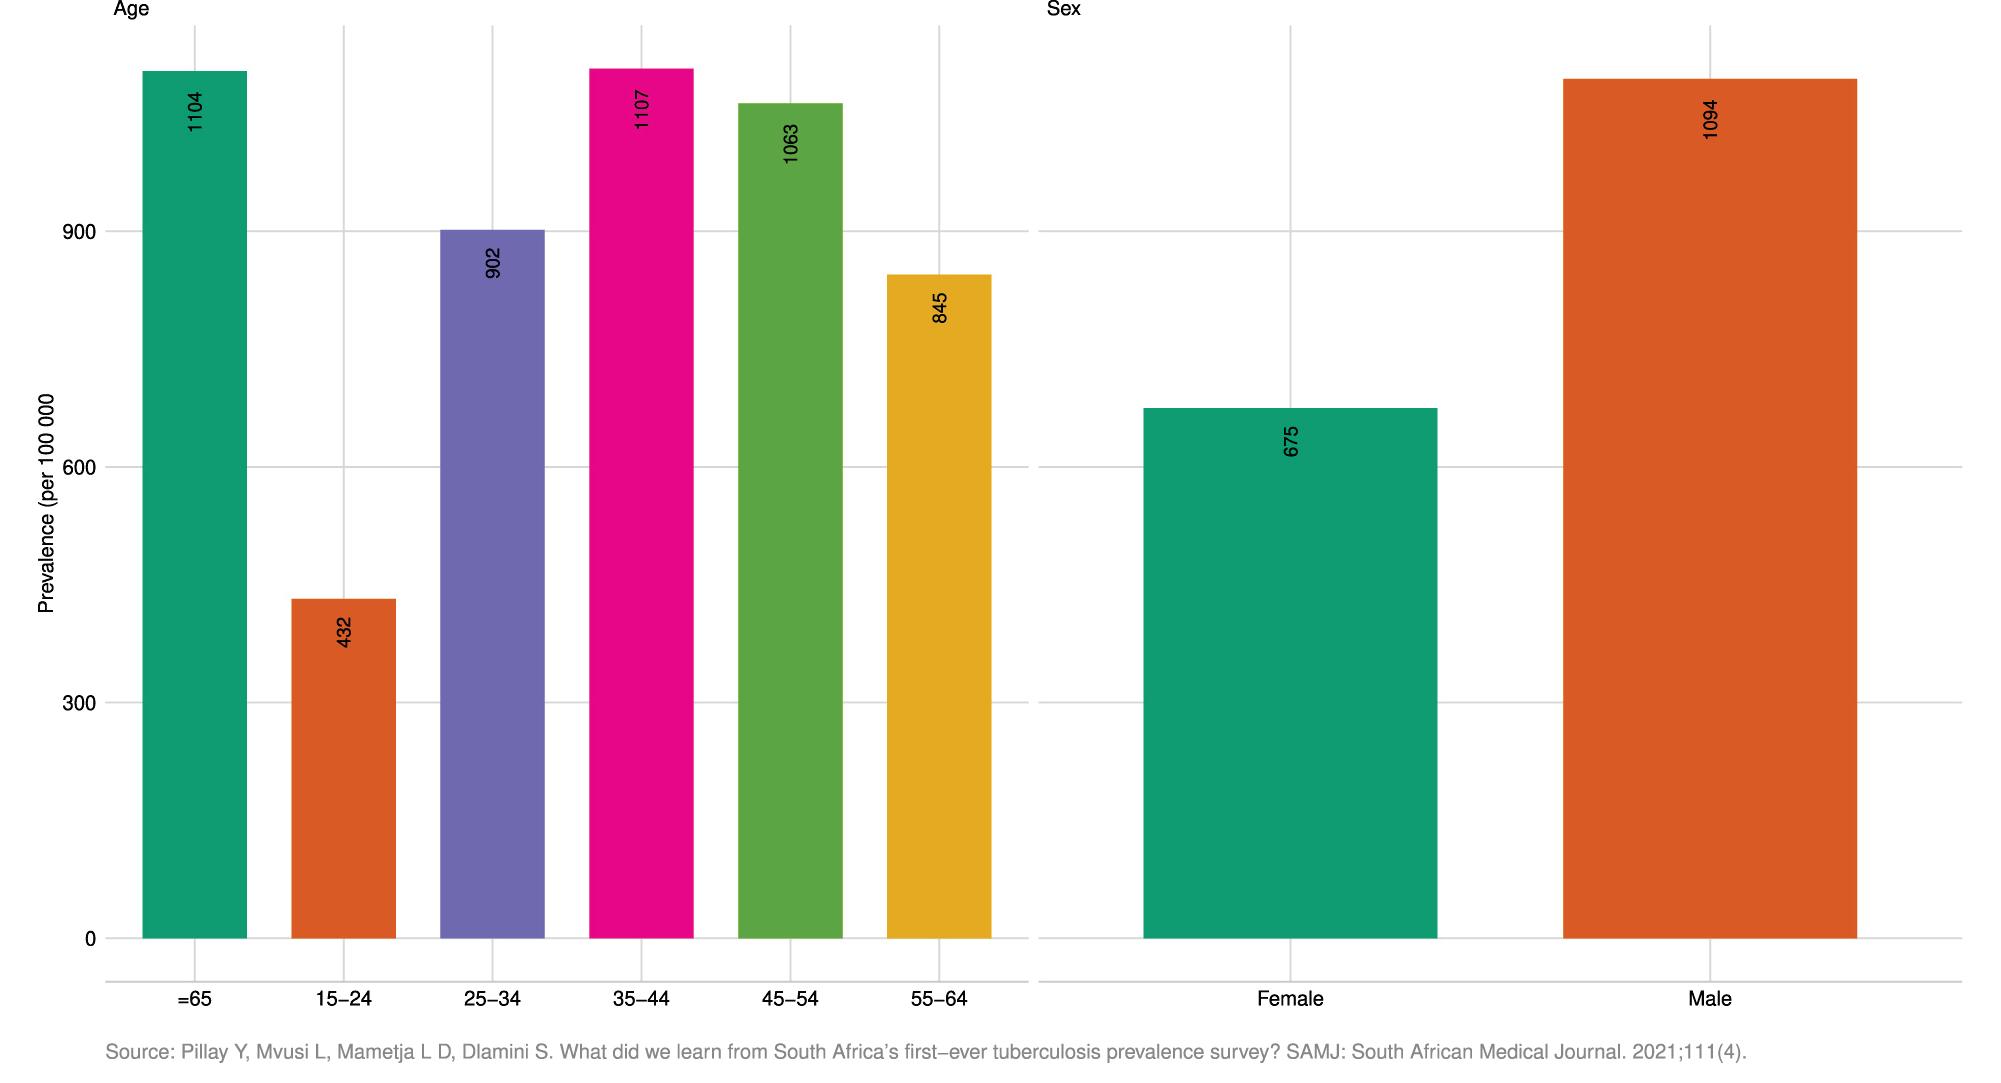
Figure 2.9 Prevalence of bacteriologically confirmed pulmonary TB among adults 15 years and older: South Africa 2018, by sex and by age group [per 100 000]
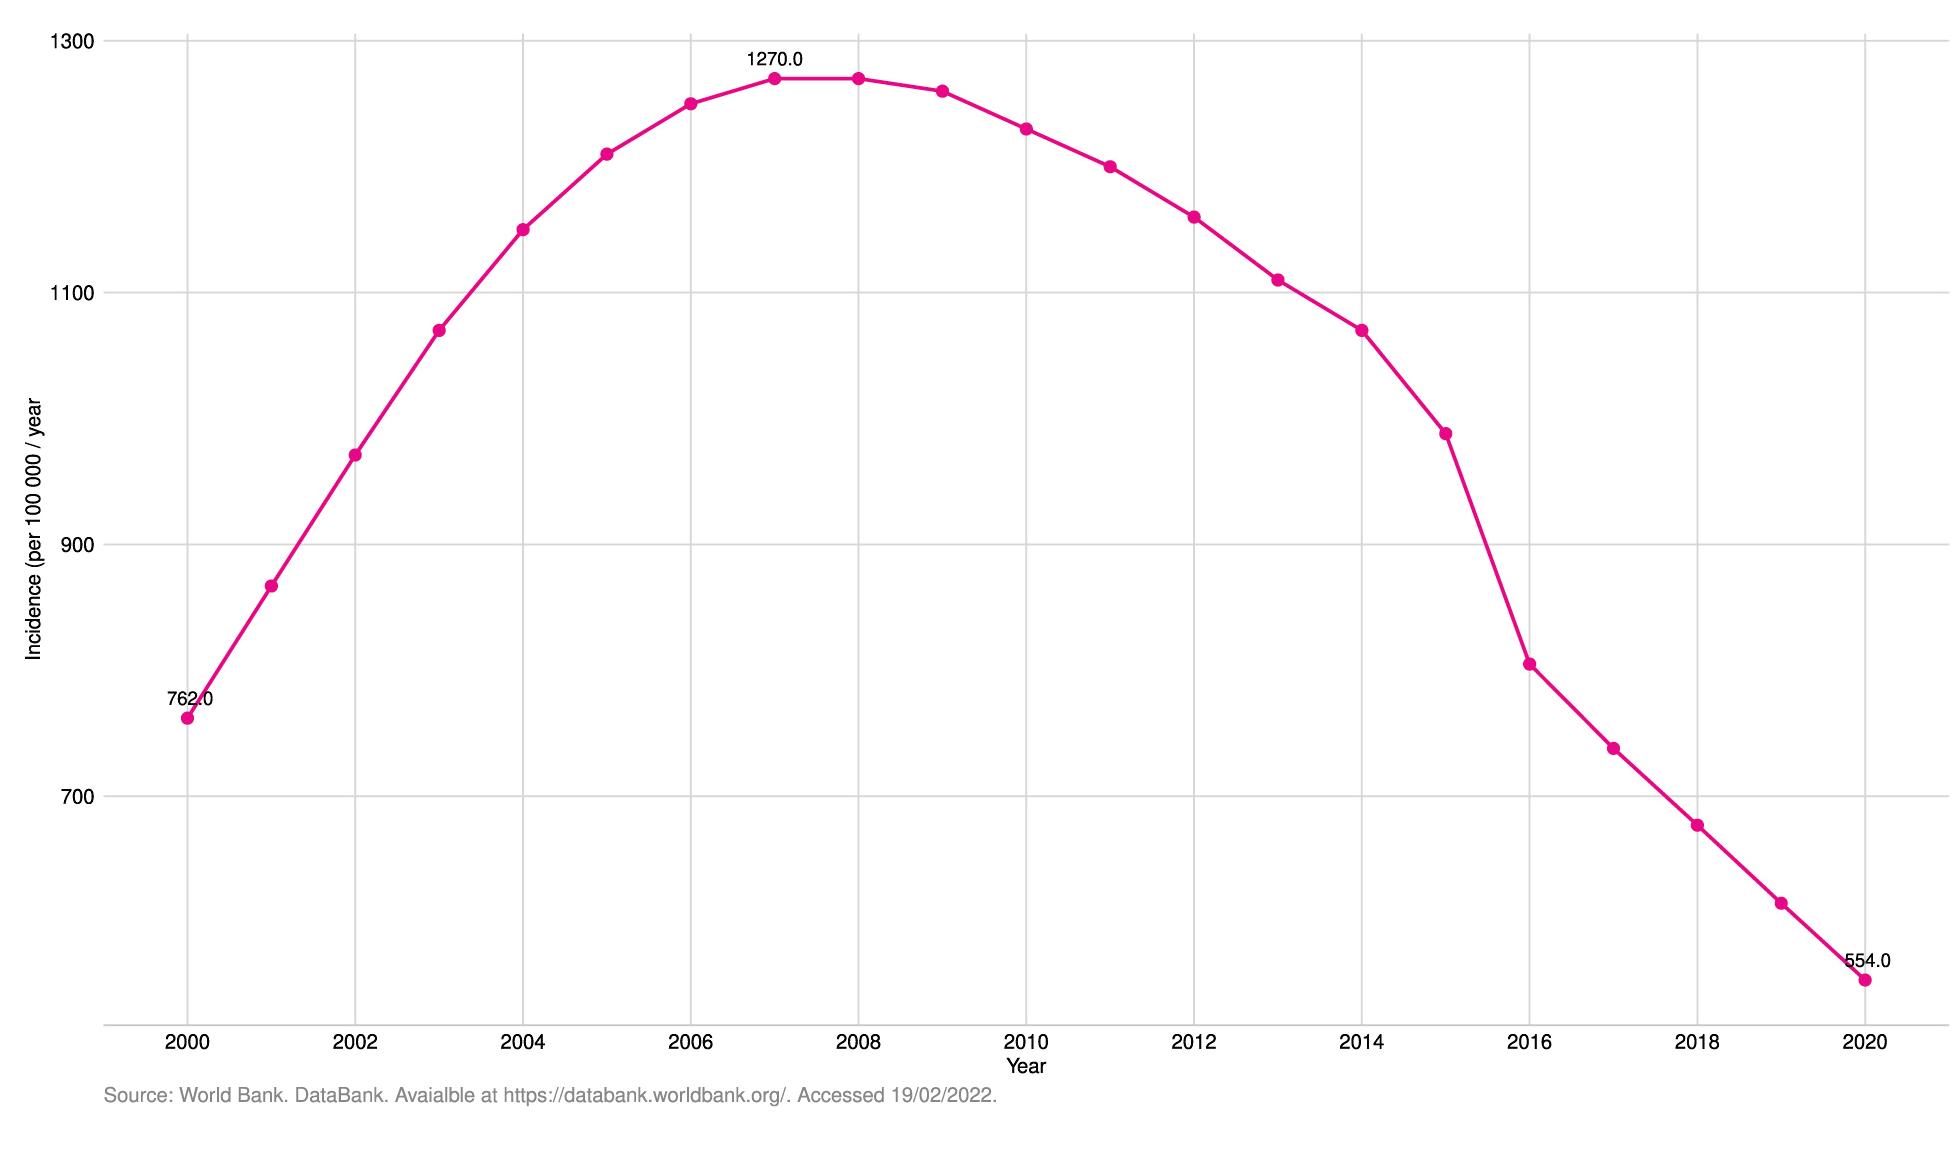
2.10 Incidence of TB: South Africa 2000–2020 [per 100 000]
Demographic and health trends: 2015-2020
Prior to the introduction of antiretrovirals, HIV had a devastating impact on the health and well-being of South Africa’s population. South Africa nevertheless still ranks highest in the world in terms of incident and prevalent HIV cases. The highest prevalence is among young women between 25 and 49 years.34 The HIV prevalence among females is more than double compared to males in the 25–29 age group, compared to much smaller differences in the older population. This is also reflected in the HIV incidence rates. The number of new infections is almost three times higher among females aged 15 to 24 years compared to males in the same age group.34
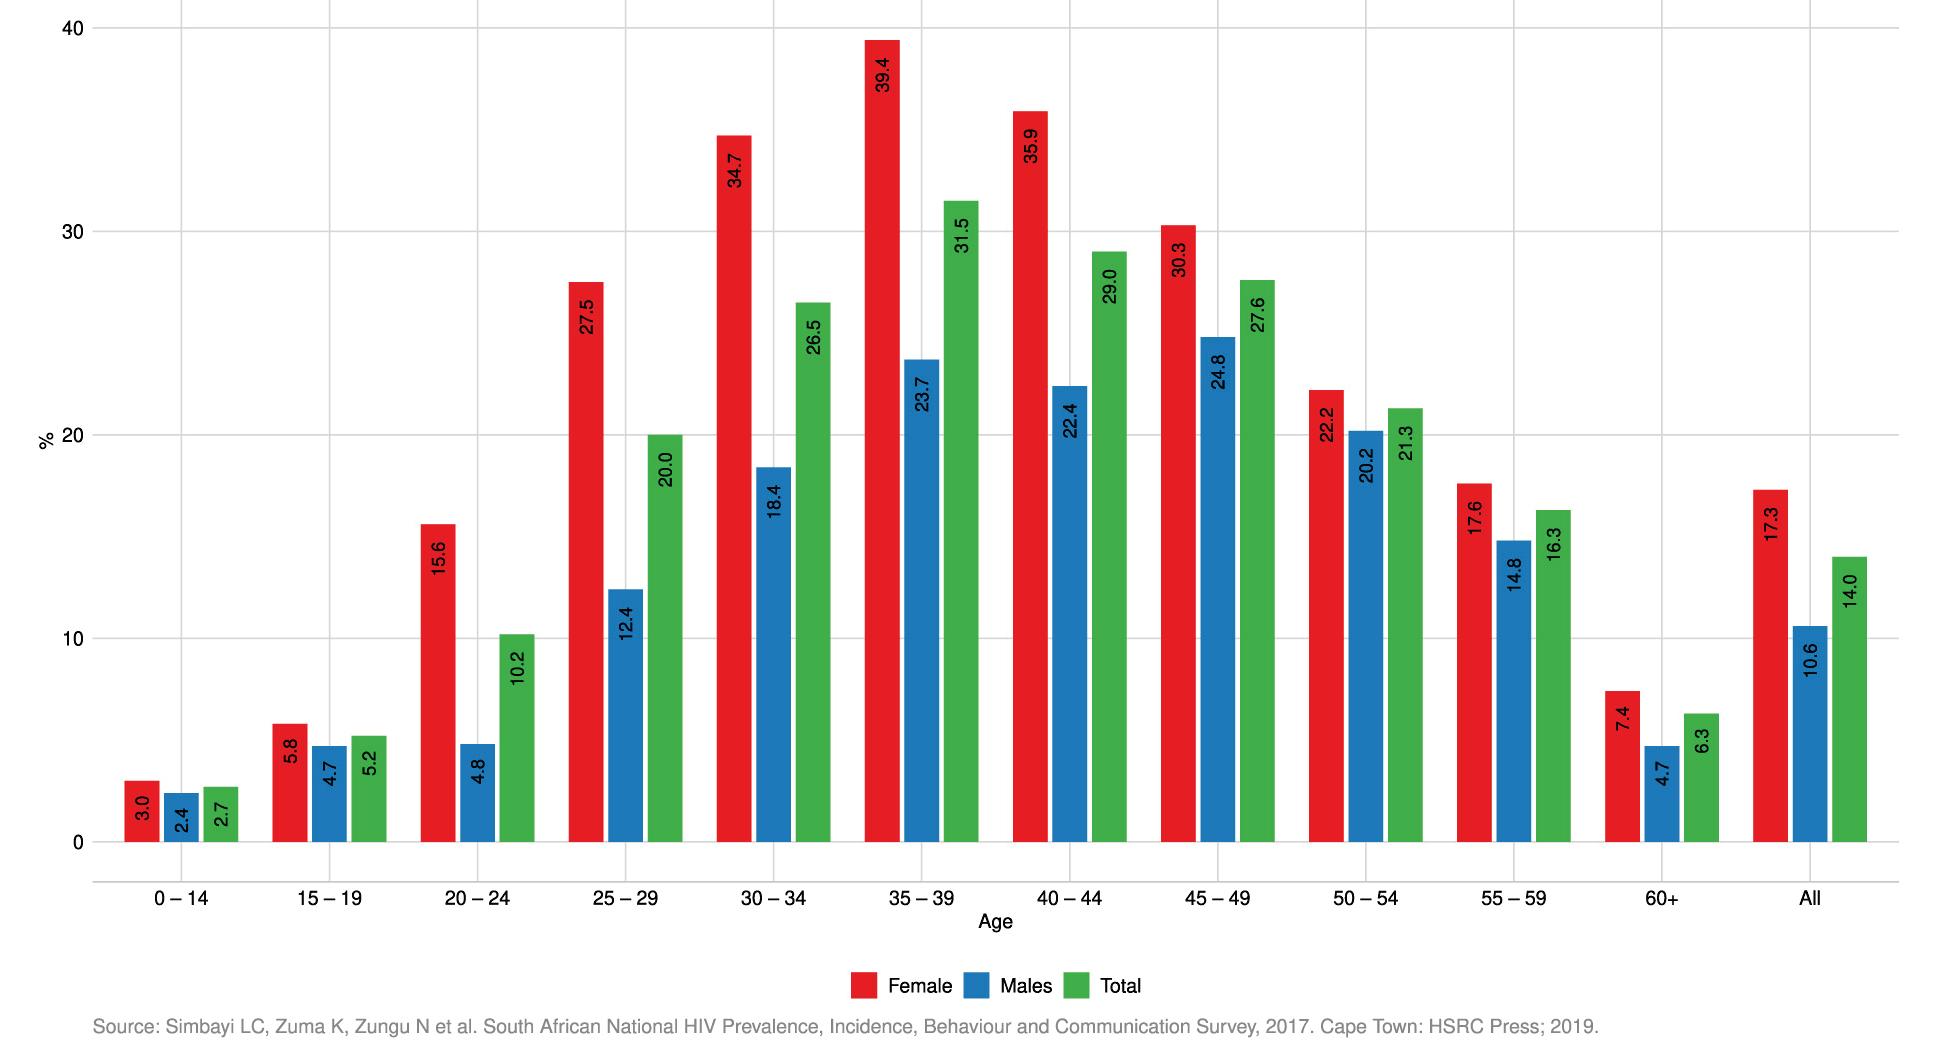
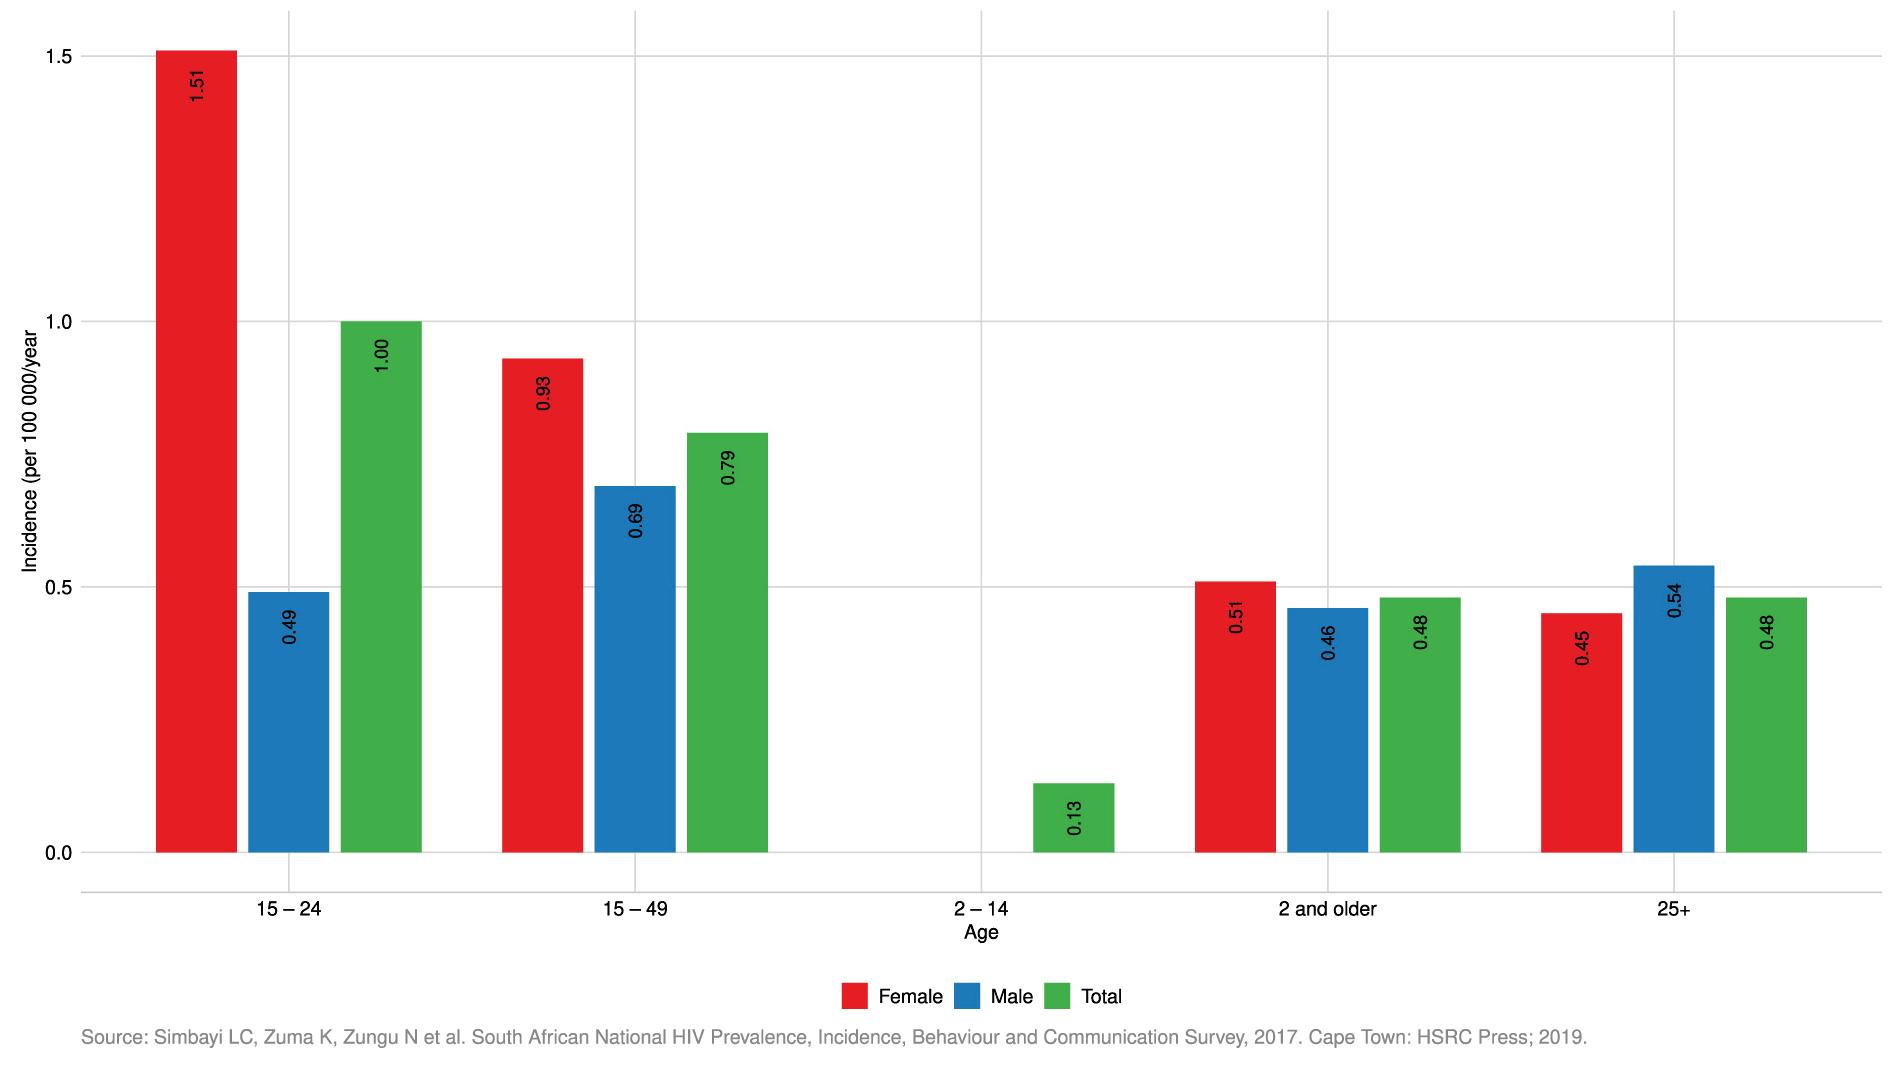
Figure 2.12 HIV Incidence: South Africa 2017, by sex and age group [per 100 000]
HIV prevalence by age and sex, South Africa, 2017
The country has been lauded for its successes in rolling out the largest Antiretroviral Therapy (ART) programme in the world, with more than 5 million people living with HIV and AIDS in care, an action that has had a significant positive impact on mortality rates over the past decade. Important to note is that the proportion of AIDS-related deaths has declined by almost half between 2002 and 2020, from 30.6% to just over 15%. Almost 85% of people living with HIV aged 15–64 years knew their HIV status at the time of the survey (first 90).35 Among those who knew their HIV status, 70.6% were on ART (second 90); among this group on ART, 87.5% had laboratory-confirmed suppressed viral load (third 90). More females than males knew their HIV status (88.9% vs 78%), were on ART (72.2% vs 67.4%) and had better viral load suppression (89.9% vs 82.1%). The successes and shortcomings of the HIV programme are discussed in detail in the chapter on National Health Programmes.
Non-communicable diseases
Self-reported NCDs saw a decrease in proportion of previous diagnoses of asthma, cancer and stroke, and an increase in hypertension, arthritis and diabetes in females.36 This is covered in more detail in the chapter on Non-Communicable Diseases, and a summary of recent trends is shown below.
Demographic and health trends: 2015-2020
Sources Statistics South Africa. GHS 2015. Pretoria, Statistics South Africa 2016 Statistics South Africa. GHS 2015. Pretoria, Statistics South Africa 2020
Figure 2.13 Persons suffering from chronic health conditions: South Africa 2015 and 2019, by sex [in 1 000s]
The prevalence of disabilityi in the population five years and older increased by 1.5 percentage points between 2015 and 2019, from 5.1% to 6.6%.37 In 2016, overall, 20% of the population aged five and older was reported to have some level of difficulty in at least one functional domain. The most common disability was having difficulty seeing (12%), which increased with age. This was followed by having difficulty walking or climbing steps (7%), and difficulty remembering or concentrating (6%). Six percent of the population aged five and older was reported to have a lot of difficulty or that they cannot do one of the functional domains at all, with the highest prevalence in those 60 years and older (23%).38
i In the General Household Survey, disability was assessed using the Washington Group questionnaire. Persons are classified as ‘disabled’ if they self-reported difficulties in two or more of the abilities assessed by the tool or were unable to perform any one activity.
South Africa is among the countries with the highest rates of intimate partner violence experienced by women in the world. However, under-reporting remains a challenge and criticism in terms of the government’s response remains.39
One in four (26%) ever-partnered women aged 18 or older have experienced physical, sexual or emotional violence committed by a partner in their lifetime. The most common form of violence experienced by women is physical violence (21%); 17% of women have experienced emotional violence, and 6% have experienced sexual violence.38 In terms of controlling behaviours, 19% of ever-partnered women report that their current or most recent partner has displayed three or more controlling behaviours.38 With regard to injuries due to partner violence, 37% of ever-partnered women who have experienced physical or sexual violence by their current or most recent partner have had injuries as a result.38
Overall, many of the demographic trends relevant to the health of South Africans have seen positive trends over the last five years, albeit from a high baseline of morbidity and mortality with marked variation across provinces. South Africa still sees a large amount of internal migration with movement from rural to urban provinces and a continuing positive influx of migrants from outside the country, mostly going to Gauteng and WC provinces. Births remain the main driver of growth however, although the overall total fertility rate is now declining.
In line with these overall trends, the health of most South Africans continues to improve, with positive trends in many of the key measures of health, including life expectancy. However, many of these positive trends will have been affected, some severely, by the impact of COVID-19. Whilst it is too early to accurately show all the relevant statistics, early indications, of life expectancy for example, show a significant impact. The substantial lag in the release of causes of death statistics hampers the public health utility of vital registration data. In addition to the immediate impact on health indices, the longer-term impact on health through worsening determinants of health, such as education, are also likely to be severe.
With regard to child health, a South African 2019 review thereof concluded that there is a pressing need to focus beyond childhood mortality to ensure that each child can thrive, focusing on in utero and early-life exposures, environmental conditions (air pollution, contaminated water and sub-optimal sanitation) and access to better-quality diets.40 This would complement efforts to improve immunisation coverage, feeding practices, systems for monitoring child health outcomes, and formalising and supporting the role of community-based health workers.
In terms of causes of death, TB still remains the highest, followed by diabetes mellitus, cardiovascular and heart disease, with HIV now ranked fifth overall following improvements in mortality from the increasing roll-out of life-long treatment. Many of the risk factors behind the rising levels of NCD are not showing signs of improvement, with increasing levels of smoking in men, and only minor declines in women. Data on alcohol intakes is less recent but has showed overall increases since 2010 in younger groups. The levels of disability are increasing as more data becomes available.
It was beyond the scope of this chapter to provide a formal and comprehensive analysis of health inequities in South Africa and it remains important to highlight some of the challenges and potential solutions to ensuring that health inequalities and inequities can be better monitored. Compared to data routinely collected from health facilities, nationally representative surveys usually allow for a finer disaggregation of health indicators across geographic and socio-demographic strata and a more comprehensive evaluation of the population health status, as they include sectors of the population who do not access the health system. On the other hand, with a few exceptions (such as the annual General Household Survey and the National Income Dynamics Study), survey data collections are only carried out with long periodicities, therefore lacking the ability to track rapid changes in the indicators of interest. Moreover, in many cases, health data in surveys are self-reported rather than based on clinical biomarkers, and therefore prone to high levels of bias, in most cases leading to an under-estimation of the real burden of ill-health and disability.
Other approaches are currently gaining traction and offer interesting possibilities to overcome, at least partially, the limitations of the current data sources in use. These include: (1) the use of modelling techniques (such as small area estimation41) to increase the spatial resolution of indicators of interest based on their relationship with other variables available at a local level; (2) the use of multidimensional indices of deprivation (such as, in South Africa, the Index of Multiple Deprivation42 and the COVID-19 Vulnerability Index43) that combine multiple variables to create measures that are robust to missing data44; and (3) the use of patient-level data from Electronic Health Record Systems that track patients who visit different health care providers. A system of this type is only partially available in South Africa, but its completion is planned as an essential step in the establishment of the National Health Insurance.45, 46
In conclusion, whilst South Africa is rich in terms of demographic and health data when compared to many other countries in Africa, there remains a lack of regular surveillance of key indicators, with continued reliance on expensive and sometimes infrequent surveys.
Demographic and health trends: 2015-2020
1. WHO (1948). Constitution. World Health Organization, Geneva. https:// www.who.int/about/governance/constitution
2. World Population Review. Available at: https://worldpopulationreview.com/ country-rankings/gini-coefficient-by-country. (Accessed: 01/08/2021)
3. Hundenborn J, Leibbrandt M, Woolard I. Drivers of inequality in South Africa. WIDER Working Paper 2018/162. 2018. UNI-WIDER 2018. https://doi.org/10.35188/UNU-WIDER/2018/604-3
4. Omotoso KO, Koch SF. Assessing changes in social determinants of health inequalities in South Africa: a decomposition analysis. International Journal for Equity in Health. 2018;17(181):1–13.
5. Maboshe M, Woolard I. (2018). Revisiting the Impact of Direct Taxes and Transfers on Poverty and Inequality in South Africa. UNU-WIDER Working Paper 79/2018. Helsinki: UNU-WIDER.
6. Ontario Public Health Association. Position statement on applying a health equity lens. Ontario Public Health Association. 2014. Available at: https:// cdn.ymaws.com/www.alphaweb.org/resource/collection/822EC60D0D03-413E-B590-AFE1AA8620A9/alPHa-OPHA_Position_Health_ Equity.pdf.[ Accessed: 14/07/2021]
7. Whitehead M, Dahlgren G. Concepts and principles for tackling social inequities in health: Levelling up Part 1. World Health Organization: Studies on social and economic determinants of population health. 2006;2:460–474. Available at: https://apps.who.int/iris/bitstream/ handle/10665/107790/E89383.pdf. (Accessed: 14/07/2021)
8. Obuaku-Igwe CC. Health inequality in South Africa: a systematic review. African Sociological Review/Revue Africaine de Sociologie. 2015;19(2): 96–131.
9. Ataguba JE, Akazili J, McIntyre D. Socioeconomic-related health inequality in South Africa: evidence from General Household Surveys. International Journal for Equity in Health. 2011;10(1):1–0.
10. Benatar S. The challenges of health disparities in South Africa. South African Medical Journal. 2013;103(3):154–155.
11. von Fintel D, Richter L. Intergenerational transfer of health inequalities: exploration of mechanisms in the Birth to Twenty cohort in South Africa. BMJ global health. 2019;4(5):e001828.
12. Nwosu CO, Oyenubi A. Income-related health inequalities associated with the coronavirus pandemic in South Africa: A decomposition analysis. International Journal for Equity in Health. 2021;20(1):1–2.
13. Ataguba JE, Day C, McIntyre D. Explaining the role of the social determinants of health on health inequality in South Africa. Glob Health Action. 2015;8:28865.
14. Zere E, McIntyre D. Inequities in under-five child malnutrition in South Africa. International Journal for Equity in Health. 2003;2(1):1–10.
15. Nkonki LL, Chopra M, Doherty TM, Jackson D, Robberstad B. Explaining household socio-economic related child health inequalities using multiple methods in three diverse settings in South Africa. International Journal for Equity in Health. 2011 Dec;10(1):1–4.
16. Day, C, Gray, A, Cois, A et al. Is South Africa closing the health gaps between districts? Monitoring progress towards universal health service coverage with routine facility data. BMC Health Serv Res 21, 194 (2021). https://doi.org/10.1186/s12913-021-06171-3
17. Gaede B, Eagar D. Progress toward equity. In: Massyn N, Day C, Peer N, Padarath A, Barron P, English R, et al., editors. District Health Barometer 2013/2014. Durban: Health Systems Trust; 2014. p. 316–38.
18. Statistics South Africa. Mid-year population estimates 2020. Statistical Release P0302. Statistics South Africa. 2020. Available at: http://www.statssa.gov. za/publications/P0302/P03022020.pdf. (Accessed: 14/07/2021)
19. https://www.worldometers.info/world-population/south-africapopulation/
20. Statistics South Africa. Mortality and causes of death in South Africa: Findings from death notification: 2018. Statistical Release P0309.3. Pretoria: Statistics South Africa; 2021.
21. Bradshaw D, Dorrington RE, Laubscher R, Moultrie TA, Groenewald P. Tracking mortality in near to real time provides essential information about the impact of the COVID-19 pandemic in South Africa in 2020. SAMJ. 2021
22. Statistics South Africa. Mid-year population estimates 2021. Statistical Release P0302. Statistics South Africa. 2021. Available at: http://www.statssa.gov. za/publications/P0302/P03022021.pdf. (Accessed: 15/08/2021)
23. Dorrington RE, Bradshaw D, Laubscher R, Nannan, N. Rapid mortality surveillance report 2018. Cape Town: South African Medical Research Council; 2018. ISBN: 978-1-928340-30-0
24. Statistics South Africa. Mortality and causes of death in South Africa, 2018: Findings from death notification. Statistical Release P0309.3. Pretoria: Statistics South Africa; 2017. Available at: https://www.statssa.gov.za/ publications/P03093/P030932017.pdf (Accessed: 02/08/2021)
25. Subramaniam T, Loganathan N, Yerushalmi E, Devadason ES, Majid M. Determinants of infant mortality in older ASEAN economies. Soc Indic Res [Internet]. 2016 December 17 (http://link.springer.com/10.1007/s11205016-1526-8 (Accessed 30 July 2017)
26. Hodge A, Firth S, Marthias T, Jimenez-Soto, E. Location matters: trends in inequalities in child mortality in Indonesia. Evidence from Repeated CrossSectional Surveys. Pan C-W, editor. PLOS ONE. 2014 July 25;9(7):e103597.
27. Dorrington RE, Bradshaw D, Laubscher R, Nannan N. Rapid mortality surveillance report 2019 & 2020. Cape Town: South African Medical Research Council; 2021. ISBN: 978-1-928340-58-4.
28. Malukeke R. Mid-year population estimates 2020. Presentation. Pretoria, July 2020. Available at: http://www.statssa.gov.za/publications/P0302/ MYPE%202020%20Presentation.pdf. (Accessed: 14/07/2021)
29. Statistics South Africa. General Household Survey 2019. Pretoria: Statistics South Africa. 2020. Available at: https://apps.who.int/iris/ bitstream/handle/10665/107790/E89383.pdf. (Accessed: 14/07/2021)
Demographic and health trends: 2015-2020
30. Moodley J, Fawcus S, Pattingson R. 21 years of confidential enquiries into maternal deaths in South Africa: reflections on maternal death assessments. Obstetrics and Gynaecology Forum. 2020;30(4). Published Online: 1 Dec 2020. https://hdl.handle.net/10520/ejc-medog-v30-n4-a2
31. WHO. Global Health Observatory. Indicator Metadata Registry List. https://www.who.int/data/gho/indicator-metadata-registry/ imr-details/4622
32. Mutevedzi PC, Kawonga M, Kwatra G, Moultrie A, Baillie V, Mabena N, et al. Estimated SARS-CoV-2 infection rate and fatality risk in Gauteng Province, South Africa: a population-based seroepidemiological survey. Int J Epidemiol [Internet]. 2021 Oct 30 [cited 2022 Apr 13]; Available from: https:// academic.oup.com/ije/advance-article/doi/10.1093/ije/dyab217/6414575
33. Pillay Y, Mvusi L, Mametja LD, Dlamini S. What did we learn from South Africa’s first-ever tuberculosis prevalence survey? SAMJ: South African Medical Journal. 2021;111(4):0.
34. Simbayi LC, Zuma K, Zungu N, Moyo S, Marinda E, Jooste S, Mabaso M, Ramlagan S, North A, van Zyl J, Mohlabane N, Dietrich C, Naidoo I and the SABSSM V Team. South African National HIV Prevalence, Incidence, Behaviour and Communication Survey, 2017. Cape Town: HSRC Press; 2019. Available at: http://repository.hsrc.ac.za/bitstream/ handle/20.500.11910/15052/11091.pdf?sequence=1(Accessed: 15/07/2021)
35. South African National HIV Prevalence, Incidence, Behaviour and Communication Survey, 2017 (last available)
36. Statistics South Africa. General Household Survey 2015. Pretoria: Statistics South Africa. 2016. Available at: https://www.statssa.gov.za/ publications/P0318/P03182015.pdf. (Accessed: 14/07/2021)
37. Kathard H, Padarath A, Galvaan R, Lorenzo T, editors. South African Health Review 2020. Durban: Health Systems Trust; 2020.
38. National Department of Health, Statistics South Africa, South African Medical Research Council, ICF. South Africa Demographic and Health Survey 2016: Final Report. Pretoria: National Department of Health; 2019. Available at: https://dhsprogram.com/publications/publication-fr337-dhs-final-reports. cfm. (Accessed: 14/07/2021)
39. Mthembu, J., Mabaso, M., Reis, S. et al. Prevalence and factors associated with intimate partner violence among the adolescent girls and young women in South Africa: findings the 2017 population based cross-sectional survey. BMC Public Health 21, 1160 (2021). https://doi.org/10.1186/s12889-02111183-z
40. Bamford L, Martin P, Slemming W, Richter L. Improving the early development of children through quality health care. In: Moeti T, Padarath A, editors. South African Health Review 2019. Durban: Health Systems Trust; 2019. URL: http://www.hst.org.za/publications/Pages/SAHR2019
41. Wakefield J, Okonek T, Pedersen J. Small Area Estimation of Health Outcomes [Preprint]. Available at: https://arxiv.org/pdf/2006.10266.pdf. (Accessed 26/08/2021)
42. Noble M, Zembe W, Wright G, Avenel D. Multiple Deprivation and Income Poverty at Small Area Level in South Africa in 2011. Cape Town: SASPI. 2013.
43. Statistics South Africa. Mapping vulnerability to COVID-19 [Internet]. Available at: http://www.statssa.gov.za/?p=13875#:~:text=The%20 South%20African%20Covid%2D19,against%20a%20set%20criteria%20being. (Accessed: 26/08/2021)
44. Peralta, A, Espinel-Flores, V, Gotsens, M, Pérez, G, Benach, J, Marí-Dell’Olmo, M. Developing a deprivation index to study geographical health inequalities in Ecuador. Revista De Saúde Pública. 2019;53, 97. https://doi. org/10.11606/s1518-8787.2019053001410
45. Katurura MC, Cilliers L. Electronic health record system in the public health care sector of South Africa: A systematic literature review. Afr J Prim Health Care Fam Med. 2018;10(1):e1–e8.
46. Naidoo S. The South African national health insurance: A revolution in health-care delivery! J Public Health. 2012;34(1):149–50.