By testing net feed intake (NFI), that is, feed going into weight gained against known genetics, we are able to establish which animals gain the most weight by eating the least amount of feed.
Feed conversion efficiencies are a primary profit driver in any beef business the only other comparable effect are weaning rates and weights.
Identification of efficiency seed stock bulls to use in your herd can have a major effect on your herds bottom line especially over a extended periods of time.
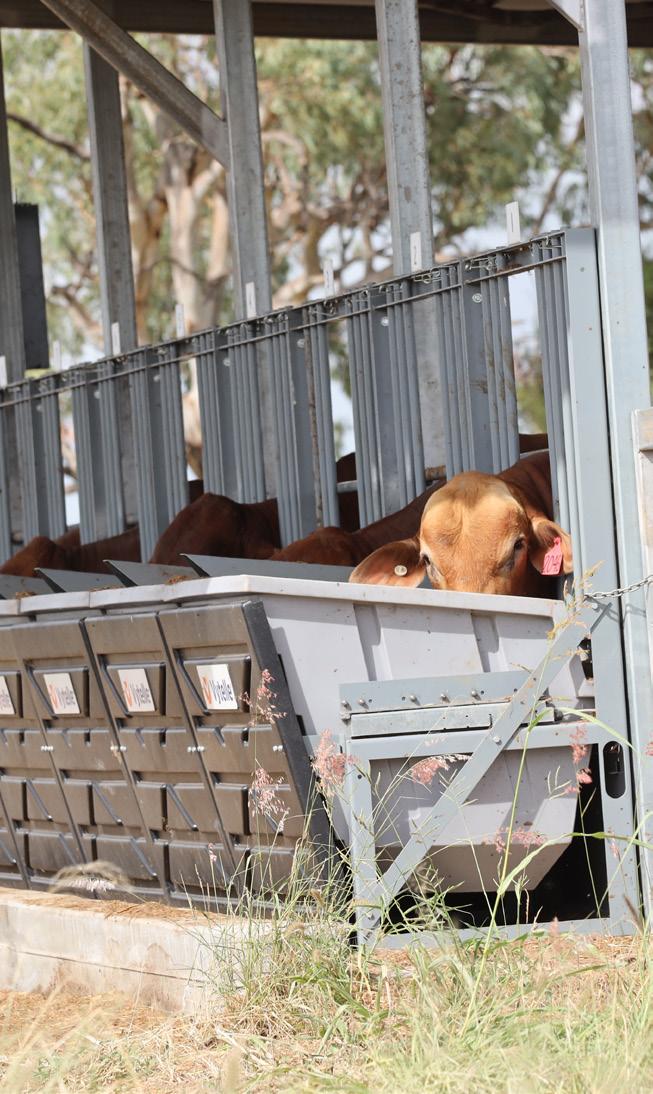
How is feed conversion calculated... 8 high-tech bins are mounted on electronic weigh-cells that take 1000 readings every three seconds. They use RFID-ear tag readers to record when each individual animal is eating and the amount of feed each animal consumes.
The in-pen weigh cells are installed near water troughs. The technology measures partial body weight, collecting up to 500 individual weights on each animal in a single day. An algorithm based on breed, sex and age then calculates a ‘live weight’ daily. Individual daily weights of feed and water intake verse actual weight gain is collected and correlated over a 50 day period. This data is then compared to others within the group. This figure is called a conversion ratio score and is expressed either under or over the group average
The Donaldson family have recently installed a Vytelle Growsafe system at their Capella district property. “Craigywarren” The first group tested was 35 Beefmaster bulls aged 17-19 months, the results were astounding.
Up to 50% variance in feed conversion with no correlation between phenotype or maturity rate noticed.
The test is under a feed yard situation but the ration was primarily fodder based and there is US research suggesting that there is a strong correlation between a feed yard situations and cattle on a grass pasture.
In feed efficiency trials Beefmaster cattle have ranked number one when compared to over 20 mainstream breeds. Their heterosis, hybrid vigour and conversion make Beefmaster an ideal crossbreeding choice.
FEED INTAKE AND PERFORMANCE
DMI: dry matter intake, an animal’s average daily dry matter intake during test. DMI is dependent on the dry matter content of the ration fed during the trial period.
Start Wt.: trial start weight with start date
End Wt.: trial end weight with end date
ADG: average daily gain
Raw F:G: feed to gain ratio, also referred to as feed conversion ratio (FCR). F:G ratio refers to the amount of feed consumed per unit of weight gain on a dry matter asis. A lower ratio is considered more favorable. While selection for F:G (FCR) results in animals that grow faster it is also associated with cattle that have a larger mature size.
Adj. F:G: adjusted feed to gain ratio, accounts for differences in animal age and size during test. This currently is the standard of feed conversion efficiency used by the Beef Improvement Federation. This value is the base F:G value multiplied by the trial group’s metabolic mid weight divided by the individual’s metabolic mid weight. A lower adjusted F:G ratio is more favorable.
RESIDUAL FEED INTAKE (RFI)
RFI: residual feed intake, RFI, is a measure of feed efficiency calculated as the difference between and animal’s actual feed intake and its predicted feed intake, for a given level of production. When RFI is used as a genetic selection tool, the resulting progeny will consume less feed for the same level of production. RFI is independent of growth, body size and other performance traits (Koch et al., 1963), selection for animals with low RFI will lead to reduced feed intake and improved feed efficiency without compromising body size, carcass quality or growth. Lower RFI values are more favorable, cattle with low RFI values are more efficient than cattle with high RFI values.
RFI Rank: an animal’s numerical rank of its phenotypic RFI within the trial group.
RADG: residual average daily gain, the difference between an animal’s actual weight gain and its predicted gain based on its dry matter intake, body weight maintenance and fat cover. Although the concept of RADG appears to be similar to RFI as they both contain the same or similar components, the two concepts work in very different ways. Residual average daily gain puts each animal’s feed intake on the same playing field and looks at differences in average daily gain while RFI puts each animal’s growth and body size on the same playing field and looks at differences in feed intake. When selecting for RADG, cattle with higher values are more desirable than those with lower values, meaning that they had greater ADG for the same amount of feed. This measure is not independent of body size so caution should be used if mature cow size is important to your herd.
RADG Rank: an animal’s numerical rank of it’s phenotypic RADG within the trial group.
EXPECTED PROGENY DIFFERENCES (EPDS)
RFI EPD: residual feed intake expected progeny difference, calculated for each individual animal based on their phenotypic RFI values and pedigree information. Lower RFI EPDs are more favorable.
RFI Accuracy: refers to the reliability of the calculated RFI EPD value. The accuracy is dependent on the amount of phenotypic and pedigree information linked to an animal. As more information is contributed to Vytelle’s efficiency database, the number of relatives to an animal can increase, resulting in an increase in accuracy. Accuracy values are between 0 and 1.
RFI %Rank: rank of an animal’s RFI EPD as a percentage of the entire RFI EPD database. Lower percent rank indicates a better RFI EPD.
ADG EPD: average daily gain expected progeny difference, calculated for each individual animal based on their phenotypic ADG values and pedigree information. Higher ADG EPDs are more favorable.
ADG Accuracy: refers to the reliability of the calculated ADG EPD value. The accuracy is dependent on the amount of phenotypic and pedigree information linked to an animal. As more information is contributed to Vytelle’s efficiency database, the number of relatives to an animal can increase, resulting in an increase in accuracy. Accuracy values are between 0 and 1.
ADG %Rank: rank of an animal’s ADG EPD as a percentage of the entire ADG EPD database. Lower percent rank indicates a better ADG EPD.
DMI EPD: dry matter intake expected progeny difference, calculated for each individual animal based on their phenotypic DMI values and pedigree information. Animals with lower DMI EPDs tend to eat less
DMI Accuracy: refers to the reliability of the calculated DMI EPD value. The accuracy is dependent on the amount of phenotypic and pedigree information linked to an animal. As more information is contributed to Vytelle’s efficiency database, the number of relatives to an animal can increase, resulting in an increase in accuracy. Accuracy values are between 0 and 1.
DMI %Rank: rank of an animal’s DMI EPD as a percentage of the entire DMI EPD database. Lower percent rank indicates a lower DMI EPD.