Evaluating Walkability to Urban Green Spaces Across Households and Demographic Groups in Austin
PROJECT INTRODUCTION AND METHOD
ABSTRACT
Urban regions are home to more than half of the global population, with projections indicating an increase to 60% by 2030. Amidst urbanization, a critical challenges has been the reduction of Urban Green Spaces(UGS), which are essential for environmental equilibrium, public health, and social wellbeing. Juwon’s seminal report on ‘park poverty’ underscores the disproportionate availability of UGS for intersectional minority groups, revealing a pattern of spatial and social inequity in urban planning.
This study employs TransCAD to examine the walkability of UGS within various Traffic Analysis Zones (TAZ) in Austin, integrating a gravity model and network distance metrics to assess UGS proximity from each TAZ and household. The value of walkability index was then compared to the disadvantaged communities through a regression analysis.
RELATED STUDIES
1. Alexis(2008) utilized GIS-based network analysis combined with statistical examination of socio-economic data to reveal that the spatial distribution of greenspace access is uneven among different societal groups in an English city.
2. Agnieszka Telega(2016) introduced a method for assessing walkability using GIS, which relies on density maps of specific urban functionalities and networks of widely accessible sidewalks.
STUDY RESULTS
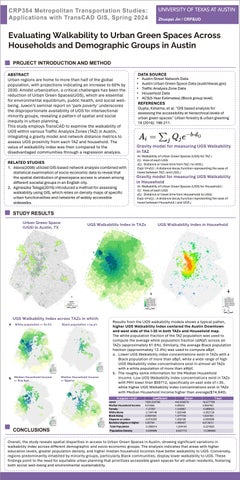
Green Space (UGS) in Austin, TX

CONCLUSIONS
DATA SOURCE
• Austin Street Network Data
• Austin Urban Green Space Data (austintexas.gov)
• Traffic Analysis Zone Data
• Household Data
• ACS(5-Year Estimates) (Block group level)
REFERENCES
Gupta, Kshama, et al. "GIS based analysis for assessing the accessibility at hierarchical levels of urban green spaces." Urban forestry & urban greening 18 (2016): 198-211.
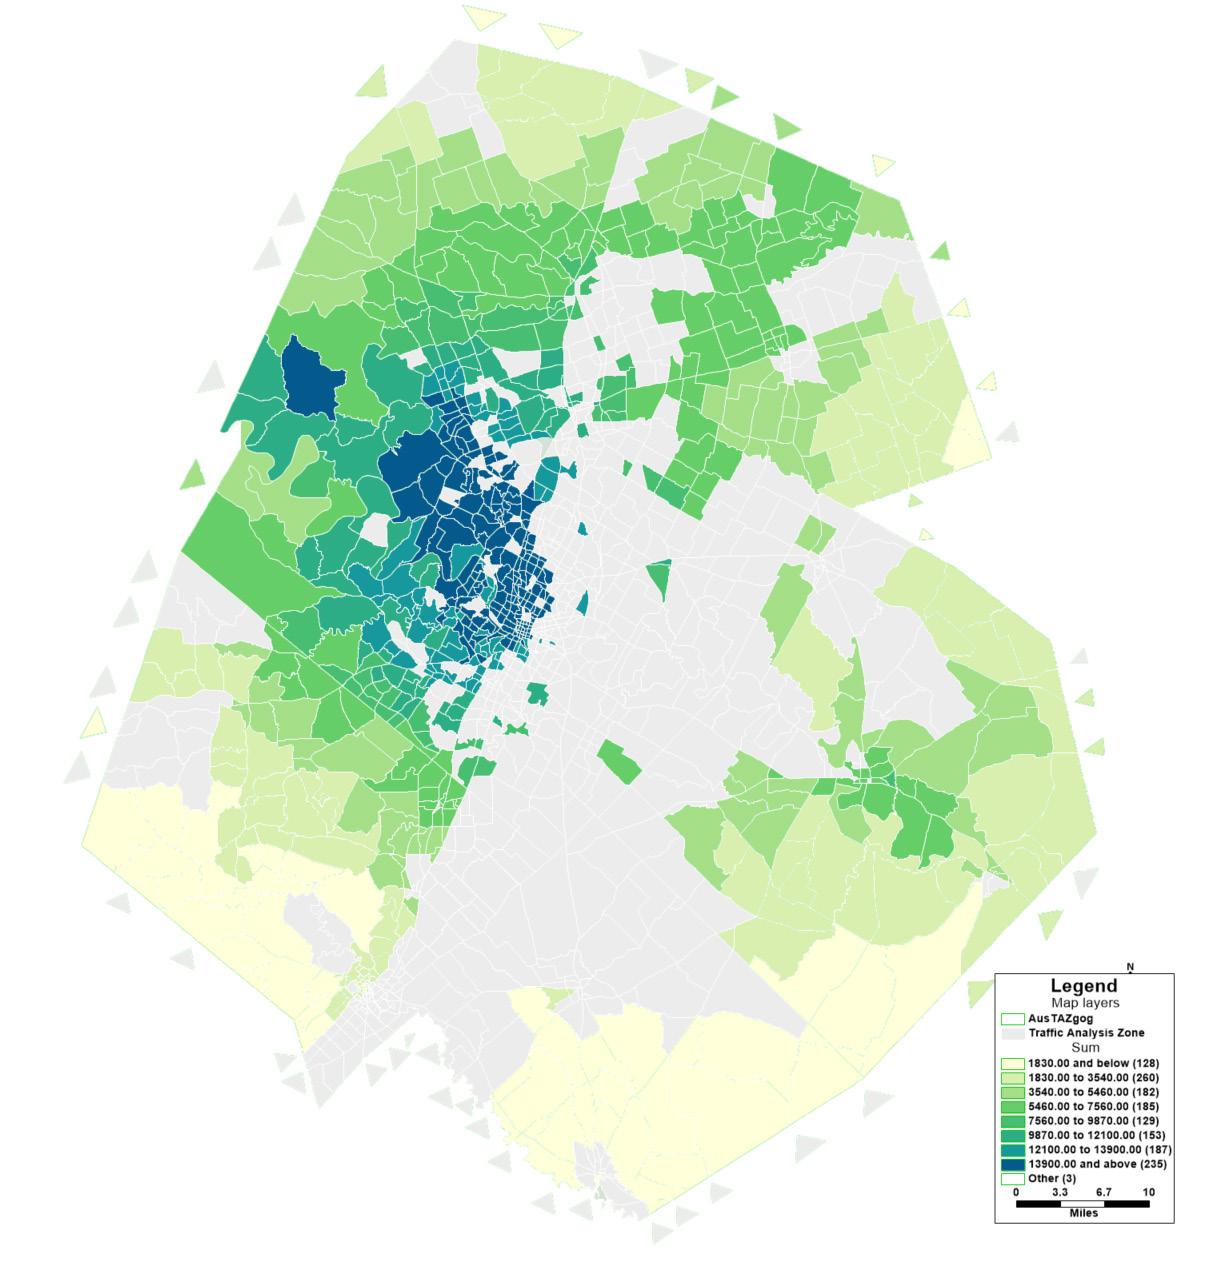
Gravity model for measuring UGS Walkability in TA Z
Ai: Walkability of Urban Green Spaces (UGS) for TAZ ����
��������: Area of each UGS
������������: Distance or travel time from TAZ ���� to UGS ���� Exp(−����×������������) : A distance decay function representing the ease of travel between TAZ ���� and UGS ����
Gravity model for measuring UGS Walkability in Household
Ai: Walkability of Urban Green Spaces (UGS) for Household ���� ��������: Area of each UGS ������������: Distance or travel time from Household���� to UGS���� Exp(−����×������������) : A distance decay function representing the ease of travel between Household ���� and UGS ����
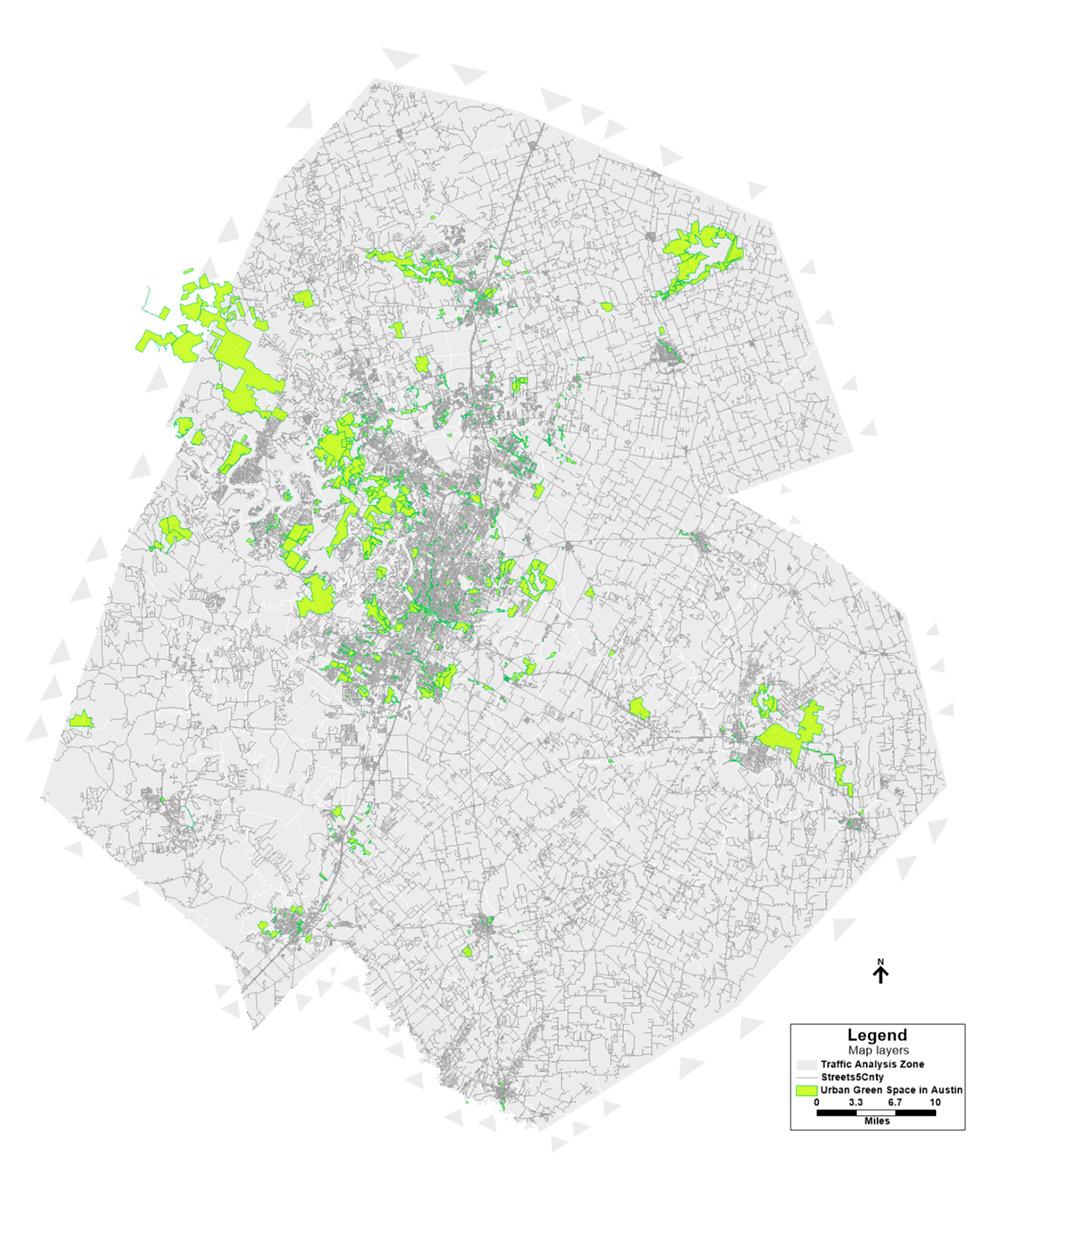
UGS Walkability Index in TAZs UGS Walkability Index in Household
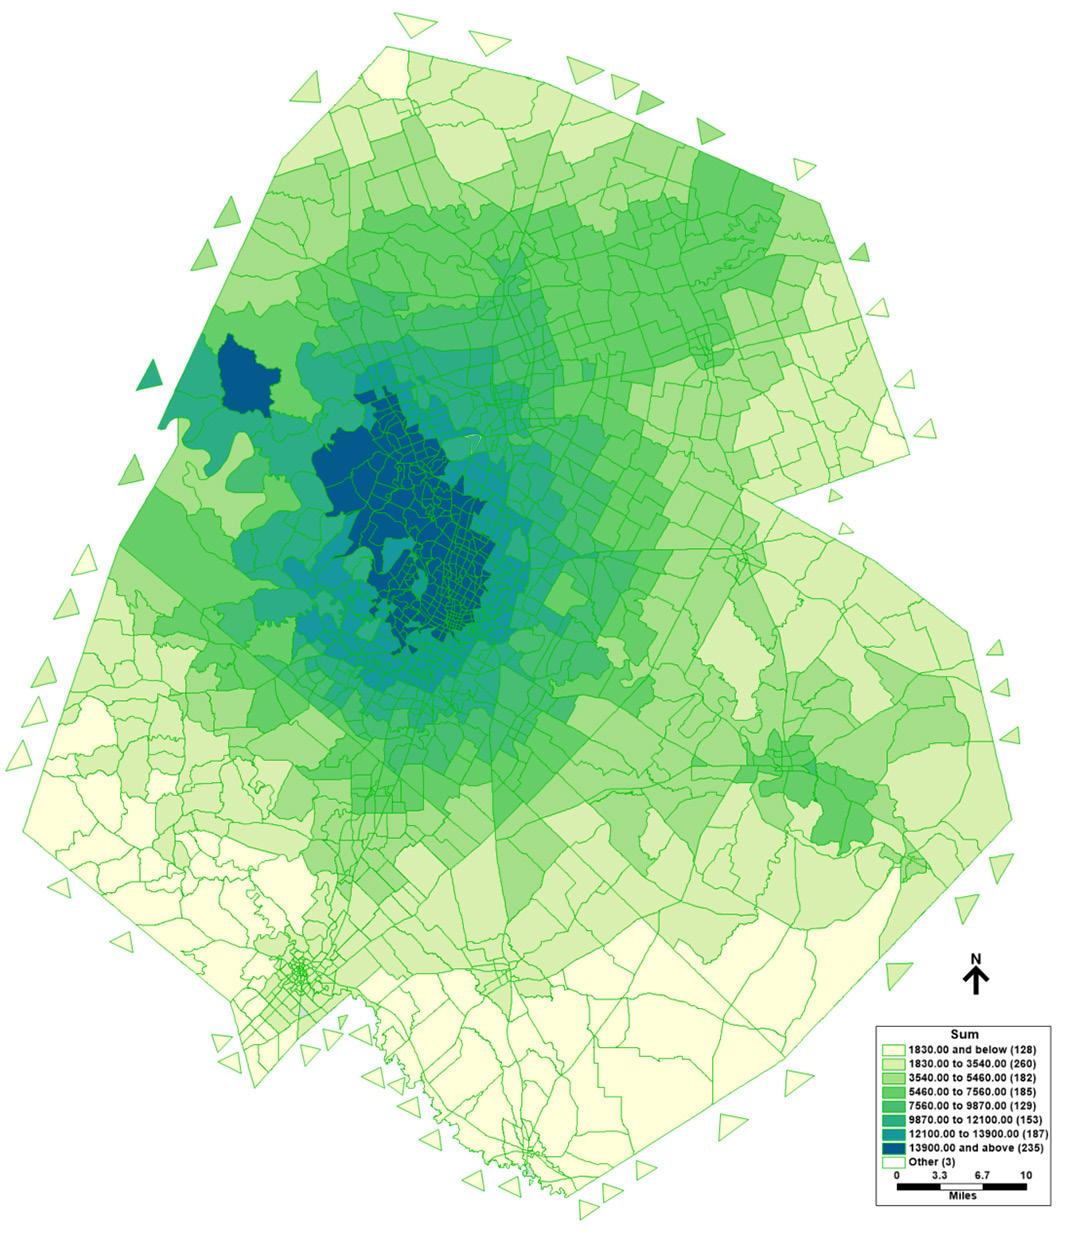

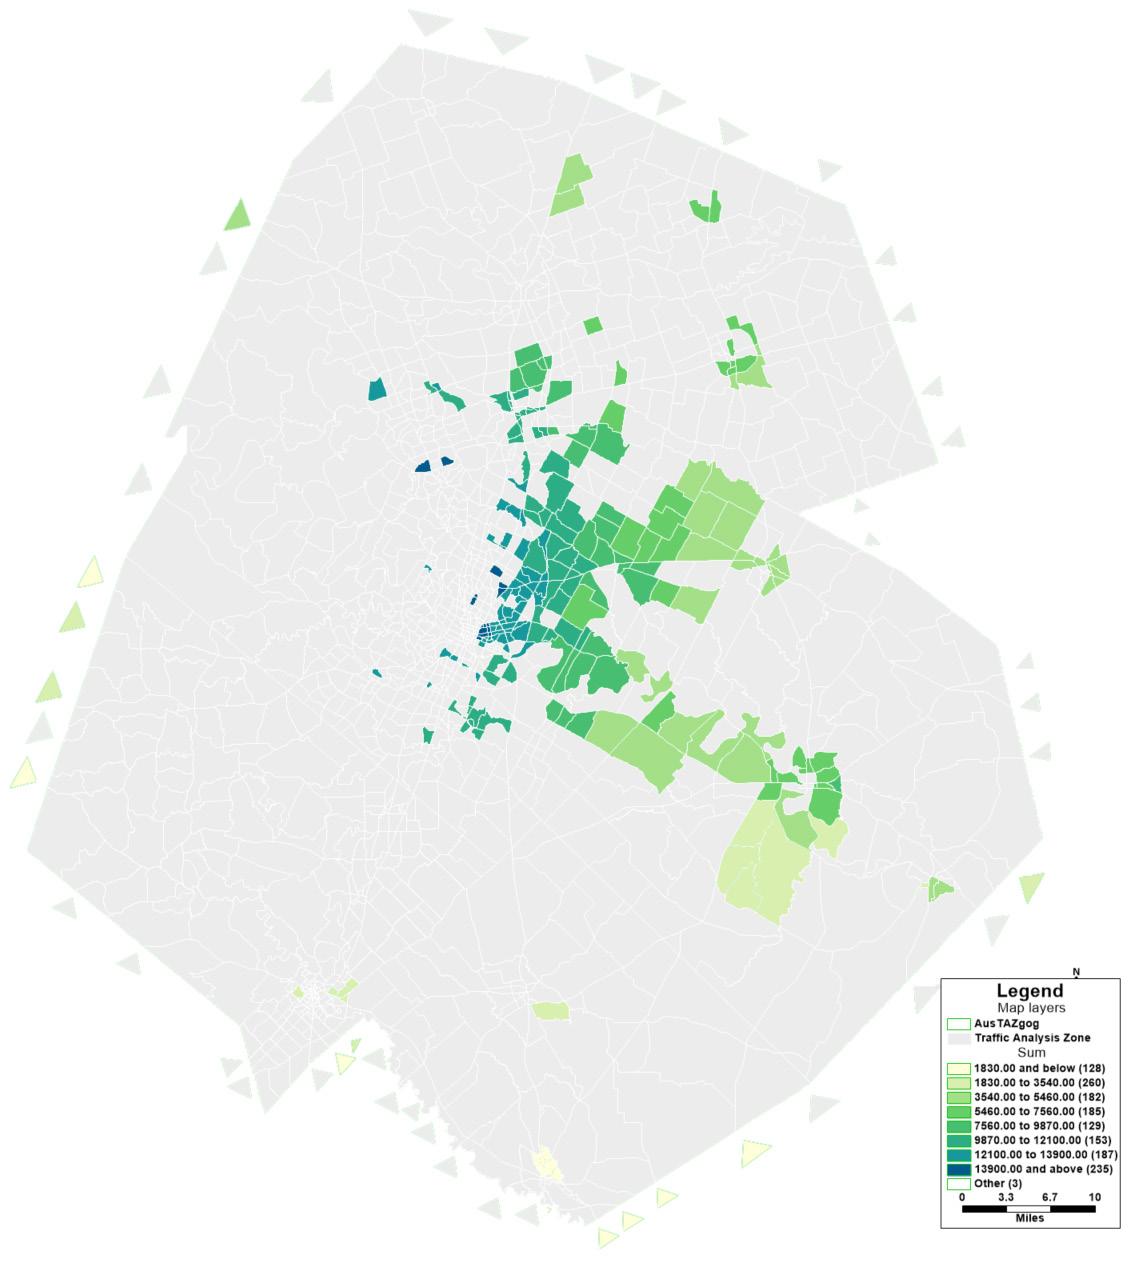

Results from the UGS walkability models shows a typical patten, higher UGS Walkability Index centered the Austin Downtown and west side of the I - 35 in both TAZs and Household map
The white population fraction of the TAZ population was used to compute the average white population fraction ( aWpf ) across all TAZs (approximately 61.6%). Similarly, the average Black population fraction (approximately 12.4%) was used to compute aBpf
a. Lower UGS Walkability index concentrations exist in TAZs with a Black population of more than aBpf, while a wide range of high UGS Walkability index concentrations exist in almost all TAZs with a white population of more than aWpf
b. The roughly same information for the Median Household Income. Low UGS Walkability index concentrations exist in TAZs with MHI lower than $59712, specifically on east side of i - 35, while higher UGS Walkability index concentrations exist in TAZs with Median Household Income higher than average($74,640).
Overall, the study reveals spatial disparities in access to Urban Green Spaces in
both
and environmental sustainability. UGS Walkability Index across TAZs in which:
-
to UGS. These