NEWS SCAN
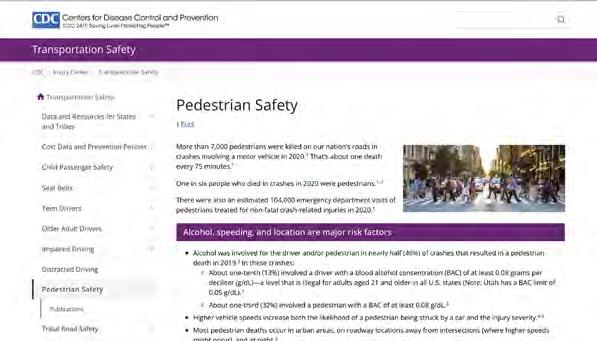
On city streets, an average of 30 people die, and more than 500 are seriously injured each year, the San Francisco Municipal Transportation Agency said.
The lives of pedestrians in San Francisco are already at risk and they are facing the risk of traffic accidents.
COMPETITORS AND ANALOGOUS EXAMPLES
Hoboken Vision Zero
Hoboken, N.J., achieved the Vision Zero goal of zero tra fc fatalities for Hoboken, New Jersey, for the seventh consecutive year.
Vision Zero San Francisco
This is a citywide policy in San Francisco that aims to eliminate traffic fatalities by making streets safer and more livable.
Walk San Francisco Foundation
This is a charitable organization, that wants nothing less than to make San Francisco the most pedestrian-friendly city in the United States.
Art in the Right of Way
These projects help calm traffic, beautify Baltimore’s neighborhoods, and increase public space for pedestrians.
Vuzix Blade Smart Glasses
This hands-free functionality allows pedestrians to stay informed of traffic, hazards, and directions while keeping their attention on their surroundings.
COMPETITORS AND ANALOGOUS EXAMPLES
COMPETITORS AND ANALOGOUS EXAMPLES
OTS
This takes a leadership role in efforts to make California roadways safe for all users
California Walks
This is a non-profit organization, California that works to expand and strengthen a network of community organizations working for pedestrian safety and community walkability through equity, engagement, education, advocacy and collaboration.
Pathways to Right-of-Ways
This is a California nonprofit organization with a vision to create a safe and healthy environment for pedestrians to accomplish the journey they desire.
Safe Kids Worldwide
This is a nonprofit organization working to help families and communities keep kids safe from injuries. And pedestrian safety is one of the injuries.
Back to Basics
This is a social awareness campaign that focuses on changing the negative and careless habits that pedestrians in Durban have when crossing the road.
Suraksha
This is a pedestrian safety device designed for women. Suraksha is a unique blend of an electronic shaver and a safety whistle that allow pedestrians to call attention in unsafe situations.
NICSY
This project is to create an app that will help everyone avoid many accidents like crashes with bikers by letting you know where they are.
Safe Backpacks for a Better World
This project has designed some backpacks with road signs for children in Africa to bring convenience and safety to their lives.
MADE YOU LOOK
This project enhances pedestrian and bicyclist visibility on the road and raises awareness of the importance of pedestrian and bicyclist safety.
GAPS AND OPPORTUNITIES
Driving in San Francisco has its own set of unique difficulties that put driving skills to the test. For instance, steep hills, puzzling one-way streets, and lack of parking.
Although many organizations and designers have made efforts to improve pedestrian safety, San Francisco still needs graphic design solutions. I think adding a reminder of accident-prone areas to drivers to improve their attention would be helpful. In addition, environmental deliverables like graphic design on the ground would be benefical to ensure pedestrians are seen and prioritized. Moreover, I think both pedestrians and drivers need sensors to help them know whether there is a car or person passing by.
TWO INSIGHTS FROM READING
The reasons why the life and safety of pedestrians are at risk include pedestrians not taking the crosswalk, distracted walking or driving, and not paying close attention to the road.
Environmental deliverables like posters, banners, and ground sign have a significant effect on increasing pedestrian safety awareness and improving behavior.
THREE INSIGHTS FROM WATCHING
90% of car crashes are a result of human error or condition.
Every 24 seconds a person is killed in a road traffic accident.
It’s necessary for children to take road safety classes.
COMPETITIVE ANALYSIS
Basic traffic rules are often more ignored.
Many vehicles have auxiliary functions like Tesla’s in-car driving visualization, but pedestrians do not, so pedestrians need a deliverable to help them keep an eye on the vehicles on the road.
Brightly colored clothing and accessories can improve the visibility of pedestrians to drivers on the road.
The environmental deliverables such as ground signs and graphics can provide visual cues to road users.
Adults aged 65 years and older and children under the age of 15 have a higher risk of pedestrian death.
The Walk San Francisco website provides district-by-district traffic safety report cards, but it does not guide people on how to use these cards. Therefore, there is a need for deliverables to apply the high-injury network to road use, such as an app.
CONNECTIONS
Ways to improve pedestrian safety include publicizing hazardous locations / San Francisco high-injury corridors, designing environmental deliverables for those locations, improving visibility for nighttime road use, and educating road users about safety.
Location is one of the main risk factors for pedestrian safety. Most American pedestrian deaths occur in urban areas, on roadway locations away from intersections (where higher speeds might occur), and at night.
Under Vision Zero the San Francisco Police Department works closely with SF Municipal Transportation Authority to help identify high-injury corridors in our City and focus our enforcement and education efforts.
Improper left turns can endanger the safety of pedestrians because the frame of the vehicles may block the driver’s view when making left turns. And traffic accidents or crashes are prone to occur at intersections.
THOUGHT LEADER
Pedestrians are the most vulnerable road users.
People themselves can be the regulators of traffic.
Pavement markings should be used to denote specific traffic uses.
QUANTITATIVE DATA
The death toll in 2022 is the highest in the past eight years.
Most traffic deaths occurred in downtown.
The Vision Zero High Injury Network represents 12% of San Francisco’s street miles.
Larger vehicles like SUVs and pickup trucks are more likely to collide with pedestrians in San Francisco due to their elevated front-end design, which increases the risk of severe injuries or fatalities.
At least three pedestrians are struck by vehicles every day in San Francisco. Sixty percent of all San Francisco traffic fatalities are pedestrians—this is about four times the national average.
WILDCARD
According to Traffic Safety Facts 2020
Data from the National Highway Traffic Safety Administration
Most of the pedestrians killed in traffic crashes were males.
Most of the pedestrian fatalities occurred in single-vehicle crashes.
The highest total percentage occurred from 6 to 8:59 p.m., followed by from 9 to 11:59 p.m.
The number of pedestrian fatalities was highest in California.
Poorly lit conditions, including dusk/dawn/ night and poor weather will endanger pedestrians’ safety.
QUESTIONS FOR CLARIFICATION
1. What are the specific reasons for the high number of injuries downtown?
2. What is the def nition of the pedestrian?
3. What are the characteristics of San Francisco roads?
4. Where does pedestrian common sense come from?
5. Is public transportation good in San Francisco?
6. Under what circumstances are pedestrians willing to choose alternative means of transport instead of walking?
7. What tools are available to alert pedestrians to road and traffic conditions?
8. How to design the most beneficial pedestrian safety?
9. Is it well known that pedestrians are the most vulnerable road users?
10. Are there pavement markings designed for pedestrians?
QUESTIONS THAT PROBE ASSUMPTIONS
1. Assuming that all road users follow traffic laws, will the lives of pedestrians be threatened?
2. Assuming that pedestrians are familiar with the streets of San Francisco, can they safely navigate the city?
3. Assuming walking is the primary mode of travel, how would traffic change?
4. Assuming vehicles have pedestrian detectors and sensors, can pedestrian safety be improved?
5. Assuming drivers are driving safely, will collisions and other accidents be reduced?
6. Assuming that pedestrians have common sense and a sense of self-preservation, does this help improve pedestrian safety?
7. Assuming that pedestrians pay full attention while walking on the road, can they avoid being injured?
8. Assuming that there is increased regulation in the city center, would it reduce traffic violations in the area?
9. Assuming that there are volunteers who are willing to warn and protect pedestrians on high-injury road sections, will this help improve pedestrian safety?
QUESTIONS THAT PROBE REASONS AND EVIDENCE
1. Why are urban roads poorly lit?
2. Why should pedestrian safety be taken seriously?
3. What are the reasons and evidence for pedestrians violating traffic rules?
4. What are the reason and evidence for drivers to violate the traffic rules?
5. What were the reason and evidence for the injury to the pedestrian?
6. Why are national tra fc signs universal?
7. Why is California the state with the most traffic deaths?
8. Why are some road surfaces uneven?
9. Why are some roads one-way?
10. Why are some roads impossible to turn?
QUESTIONS ABOUT VIEWPOINTS AND PERSPECTIVES
1. How to deal with this problem from the perspective of passers-by?
2. How is this addressed from the perspective of drivers and other road users?
3. From a graphic designer’s point of view, how do you come up with the most pedestrian-friendly solution?
4. From a public transport perspective, what are the alternative solutions?
5. What do people who believe in governments and/or policymakers think?
6. From the perspective of traffic law enforcers, how to improve pedestrian safety?
7. Has anyone seen this problem another way?
8. From an educator’s point of view, how to deal with this problem?
QUESTIONS THAT PROBE IMPLICATIONS AND CONSEQUENCES
1. Would addressing pedestrian safety in San Francisco benefit pedestrians in California, or even in the United States?
2. What are the impacts and consequences on pedestrians when they are tragically killed or injured?
3. What is the probability of a pedestrian safety problem occurring?
4. If San Francisco achieves Vision Zero, what will be the impact on the city?
5. If improving pedestrian safety is widely advocated, what will be the impact on traffic?
6. If there is a well-designed pedestrian safety manual, what effect will it have on pedestrians?
7. What would be the impact on traffic if there were an app designed for pedestrian safety?
8. What would be the impact of restricting traffic flow in the city center?
QUESTIONS ABOUT THE QUESTION
1. Is the problem clear? Is it easy to understand? Is the range appropriate?
2. Are the problem gaps and opportunities sufficient to develop design solutions?
3. Can the problem be broken down?
4. Is this the same problem as road safety?
5. Why is this question important?
6. Can this problem cause other problems?
7. Do other residents feel the same way?
8. Vehicle drivers need to pass courses and training to travel, so why don’t pedestrians need it?
9. Who is the best audience for the question?
INSIGHTS FROM SOCRATIC QUESTIONS
What are the speci fc reasons for the high injury in the city center?
Pedestrian crashes are more likely to occur in San Francisco’s denser downtown areas in inner-city neighborhoods, the Tenderloin, SOMA, Mission, and Downtown speci fcally.
Pedestrian collisions are most likely caused by driver mistakes, not pedestrian mistakes. According to the study, in 59 percent of pedestrian crashes in San Francisco, the drivers were found to be at fault, compared with 28 percent of pedestrians. More specifically, the failure of drivers to give way to pedestrians at crosswalks was the leading cause of more than 42 percent of pedestrian collisions.
INSIGHTS FROM SOCRATIC QUESTIONS
Where does pedestrian common sense come from?
Pedestrians are required to make eye contact with drivers when crossing the street. They also can find ways to improve their visibility so that drivers notice them when driving through the city, such as wearing a safety vest or clothing in a color that reflects the light.
People increasingly rely on traffic lights, but traffic lights are no substitute for common sense and personal protection.
What digital tools are there to alert pedestrians to road and tra fc conditions?
There are already a few apps on the market dedicated to improving pedestrian safety. They use cutting-edge technology to connect mobile phones to a network of intersections, schools, drivers, cyclists, and pedestrians and use visual and audible warnings to alert them to potentially dangerous road conditions. The cutting-edge technology includes scanning Bluetooth-enabled smartphones’ using smartphone sensors and facial recognition technology to identify drowsy drivers; automatically replying to messages; and using GPS, smartphone accelerometers, and wearable sensors.
Ford launched a smartphone app to make sure pedestrians don’t get run over when crossing the road. The technology alerts drivers that they are about to hit a pedestrian as long as they have the app conveniently installed on their phones.
Why are the lighting conditions of urban roads poor?
Most street lighting was designed and installed in the mid-20th century. And historic utility poles tend to go out more often than other streetlights.
Light intrusion is one reason that urban dwellers are increasingly sleep-disturbed, and it disrupts animal habits, reproduction, and migration. Properly lighting sidewalks, lighting only where needed, and toning down billboards and other clutter, will help improve pedestrian safety.
What would be the impact of restricting traffic flow in the city center?
Downtown San Francisco is a densely populated area and is the financial, administrative, shopping, and entertainment center of the region. As traffic jams persist, ride-sharing incentives will become stronger.
Cars cannot be used as the primary means of transportation to and from the city center. An alternative is needed that is convenient and more efficient.
What were the reasons and evidence for the pedestrian’s injury?
Some common causes of pedestrian accidents include
Drivers or pedestrians failing to yield the right of way
Speeding drivers
Intoxicated drivers or pedestrians
Fatigued drivers
Distracted driving or distracted walking
Jaywalking
Pedestrians failing to look both ways before crossing
Pedestrians stepping out into traffic
Pedestrians wearing dark clothing
Pedestrians working or playing in a roadway
Impaired visibility
Weather conditions
Poor road design
Vehicle defects
QUOTES FROM THE FOCUS GROUP
“Everyone has the potential to be a pedestrian at some point, whether he has a car or not.”
“Many international students, tourists, and non-natives don’t know how to safely walk around in San Francisco.”
“I have not heard of the organizations you mentioned and their work.”
“I think there is very little information provided for pedestrians, and most of the information is provided to vehicle drivers.”
“There seems to be little restraint in the behavior of pedestrians. Schools usually teach children the basics of traffic like how to read traffic lights when they are young.”
“Some drivers stop very close to pedestrians to yield to pedestrians. I once had this experience, which made me afraid of being hit by a car when I was walking.”
INSIGHTS FROM THE FOCUS GROUP
Everyone can be a pedestrian. Non-natives seem to need more information about how to safely navigate the city.
Competitors in the field mainly improve pedestrian safety through substantive measures such as promoting policies and improving infrastructure, and the content of their deliverables is not well applied or promoted.
Pedestrians know little information whereas drivers and riders have more information resources and technical support.
The code of conduct and safety training for pedestrians have not been emphasized or valued.
The awareness of pedestrians having priority road use rights needs to be strengthened.
ON-SITE RESEARCH
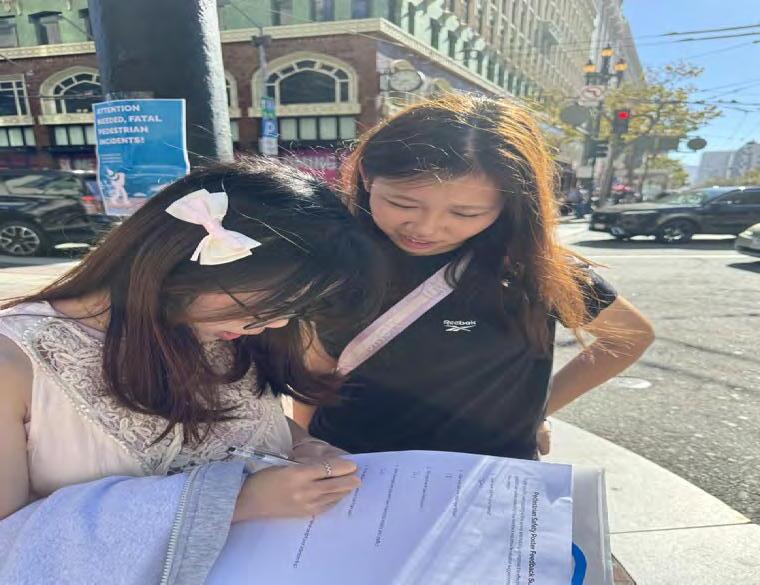
On March 16, 2024, a tragic accident at San Francisco’s West Portal claimed the lives of a family of four, including two young children, when a vehicle struck a bus stop. This devastating event highlights the urgent need for safer streets in San Francisco. WALK SF calls on residents to demand action from city leaders to prevent future tragedies.
At the site, I observed WALK SF’s efforts to create impactful change, which reinforced the importance and future potential of my project to improve pedestrian safety. The visit also inspired enhancements to my designs, which focus on eliciting an emotional response that underscores the signi fcance of protecting lives on our streets.
RESEARCH ON MARKET STREET
It has a high number of fatalities and severe injuries.
A threshold of ≥10 severe/fatal injuries per mile.
For every person traveling in a car along Market Street, four more people are walking. However, Market Street is among the 6 percent of streets responsible for over 60 percent of pedestrian deaths and serious injuries in the city.
The corner of Market and Fifth Streets is considered the most dangerous intersection in San Francisco, according to accident data from the California Highway Patrol.
Every Market Street intersection between Third and Ninth Streets is among the 15 most dangerous crossings. Other intersections with many pedestrian collisions include 16th and Mission Streets; Masonic Avenue and Oak Street; and the Tenderloin area bounded by Golden Gate Avenue and Turk, Hyde, and Jones Streets.
DELIVERABLES STRATEGY
Insight 1
Pedestrian crashes are more likely to occur in San Francisco’s denser downtown areas in inner-city neighborhoods, the Tenderloin, SOMA, Mission, and Downtown speci fcally.
Strategy 1
Inform people about the areas that have more pedestrian crashes and what to do in these areas.
Deliverables
Information Design
Visualize data on pedestrian crashes in the denser, inner-city areas of San Francisco.
Signage
Remind people to pay attention to certain areas and help them identify those areas.
Logos
Design logos for pedestrian crashes.
Typography
Use expressive typography to vividly express pedestrian crashes.
Mobile Apps
An application aimed at alerting pedestrians about crashes, traffic accidents, and highinjury areas, and informing them of what to do in these areas.
Product Design
A portable intelligent electronic product that can help pedestrians observe tra fc conditions and predict possible tra fc accidents.
Booklet
It contains infographics on pedestrian deaths and injuries to enhance pedestrian safety awareness and the attention of other road users.
Entrepreneurialism
Create a pedestrian safety company with traffic management skills and provide high-quality and professional services as well as complete tra fc control solutions and strategies.
DELIVERABLES
STRATEGY CHART
Insight 2
Pedestrians know little information, whereas drivers and riders have more information resources and technical support.
Strategy 2
Provide information resources and technical support for pedestrians.
Deliverables
Advertising and Marketing Materials
Promote products or services that provide information resources and technical support for pedestrians as the audience.
Architectural Interiors
The interior decoration of an information technology company that provides information resources and technical support for pedestrians.
Brand Identity
Design various derivatives of the brand to establish and showcase the brand’s visual image to the public.
DELIVERABLES STRATEGY CHART
Type Design
Design a set of fonts specifically designed for pedestrians to facilitate viewing from afar and under poor lighting conditions.
Front-end Web Design
The ofcial website of a company dedicated to improving pedestrian safety.
Retail Packaging
Provide information resources and technical support for pedestrians in product design packaging and delivery boxes.
Newspapers
Provide information resources and ways to obtain technical support in newspapers to the audience to increase authenticity and timeliness.
Service Design
Create a pedestrian safety service provider and plan and arrange activities for service personnel, infrastructure, communication, and material components to improve the interaction between the service provider and its users.
Insight 3
The code of conduct and safety training for pedestrians have not been emphasized or valued.
Strategy 3
Educate pedestrians on safety training and emphasize codes of conduct.
Deliverables
Advertising and Marketing Materials
Promote the importance of pedestrian safety training and a code of conduct to improve pedestrian awareness.
Signage
Guide the audience to participate in the educational event.
Brand Logos
Design logos for educational institutions that provide safety training for pedestrians to establish an image and visual system.
Type System
Use a type system to demonstrate situations that are detrimental to pedestrian safety.
Mobile Apps
This includes online courses on pedestrian safety and safety knowledge testing.
Product Design
Design clothing and accessories that can improve pedestrian visibility.
Books
The pedestrian safety manual introduces how to improve pedestrian visibility and what situations are not conducive to pedestrian walking.
Design Education
Combining theory with practice and providing safety training and education for pedestrians through stories and similar examples.
MATERIALS MATRIX
Mobile App (3 Points)
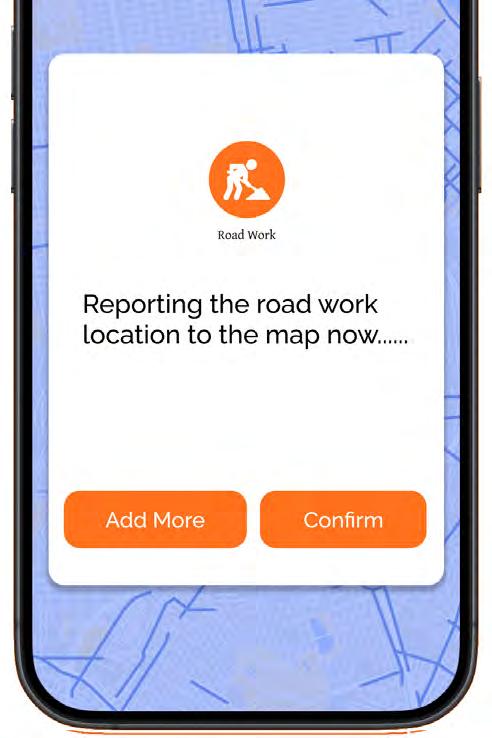
The app prototype integrates six major functions to provide comprehensive pedestrian safety services. Users can customize safe routes, upload real-time conditions, and enjoy personalized protection. It provides users with six major functions: a map of pedestrian high-injury network and tra fc fatalities, navigation, reporting, personal safety, safety ratings, and reviews.
The navigation function considers the user’s time, preferences, walking speed, etc. to recommend a variety of safe routes for them. Through noti fcations, voice broadcasts, vibration feedback, or screen prompts, users are reminded of key safety information, such as when they are approaching high-injury areas, matters needing attention along the way, and reminders to stay alert and pay attention. (approx 20 screens)
The reporting function integrates real-time traffic and incident information in the city and allows users to report real-time conditions, and factors and people that they think make pedestrians unsafe to the app by uploading on-site photos or text. The reporter will be sent feedback to let them know their reports are processed. (approx 5 screens)
The safety function includes emergency contacts, panic buttons, shared location, custom safety reminders, and alarms. (approx 5 screens)
Environmental Design (3 Points)
The environmental deliverables are designed for Market Street in San Francisco or its most dangerous intersections for pedestrians to raise safety awareness of pedestrians and drivers and reduce pedestrian accidents.
The most dangerous intersections for pedestrians on Market Street in San Francisco include those along Market Street intersection of Third and Ninth Streets, and especially the corner of Market and Fifth Streets (seven intersections in total).
Sidewalk Stickers
Remind pedestrians to be alert and cross the intersection safely. (approx 3 pages)
Vehicle Decals
Reinforce the importance of yielding to pedestrians, especially at crosswalks and intersections. (approx 3 pages)
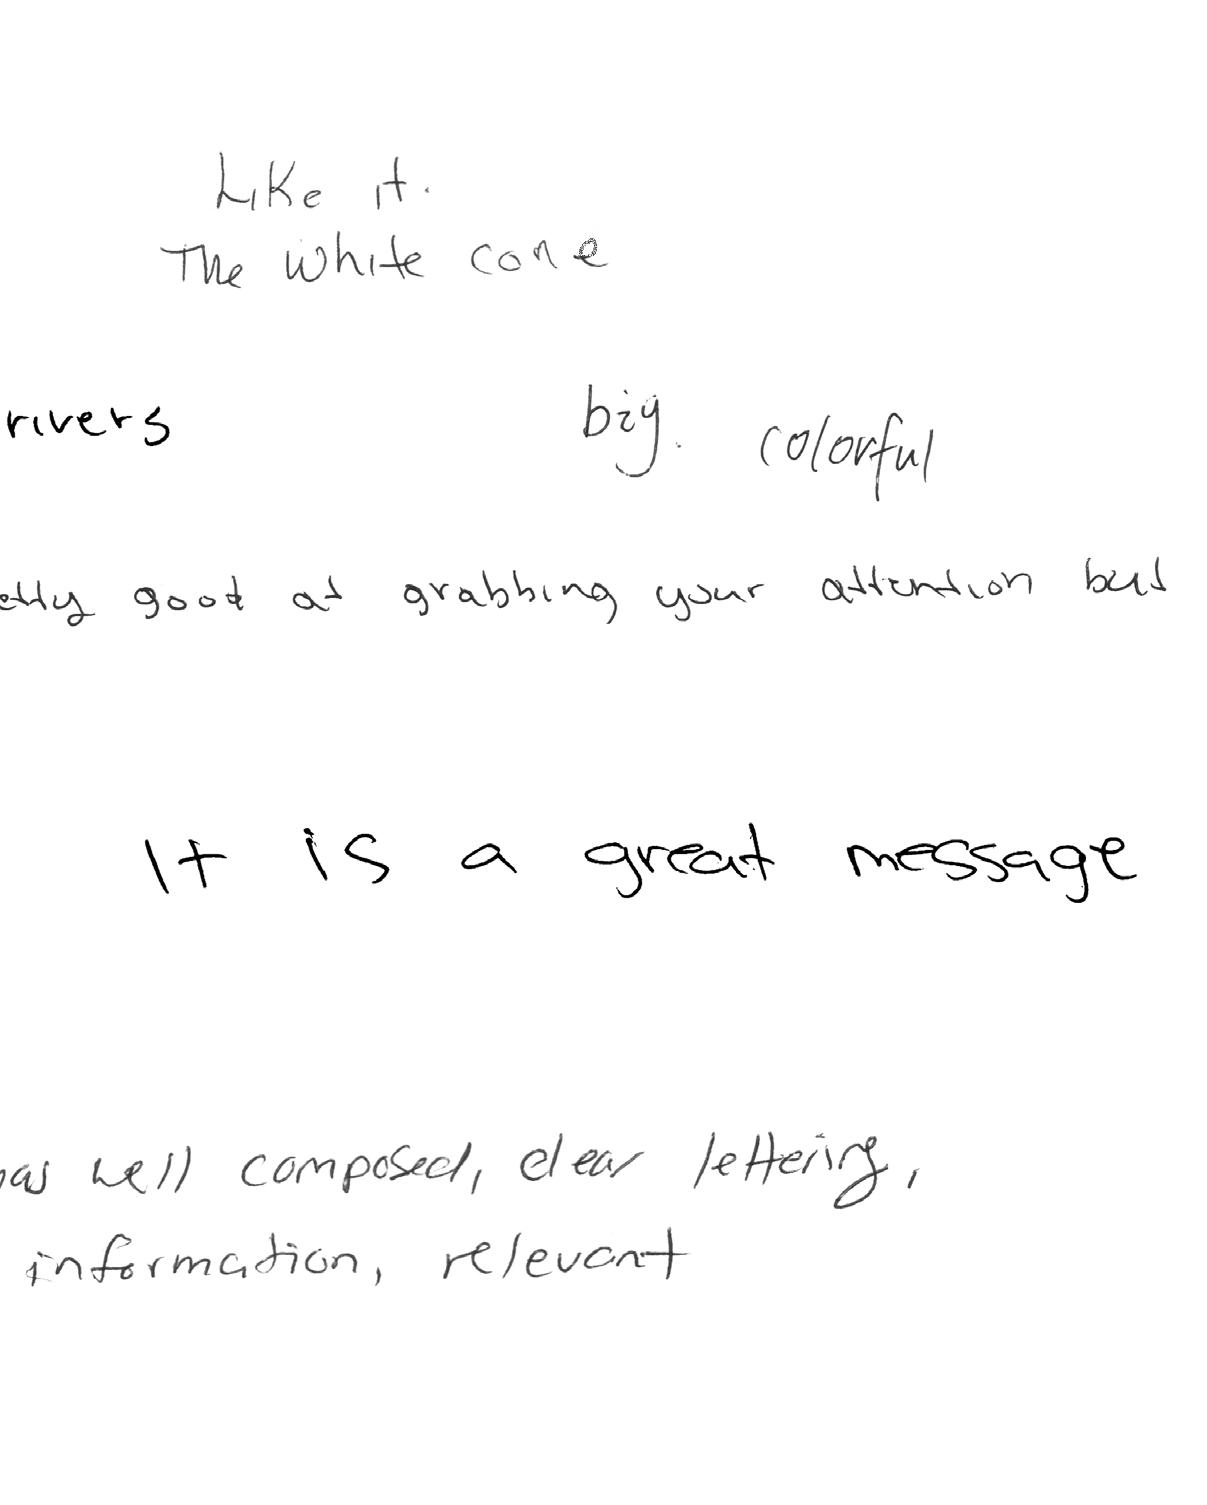
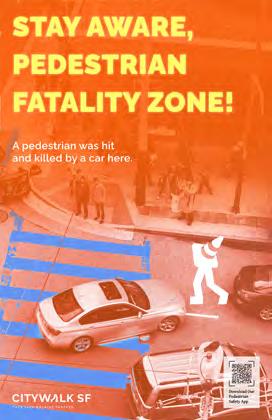
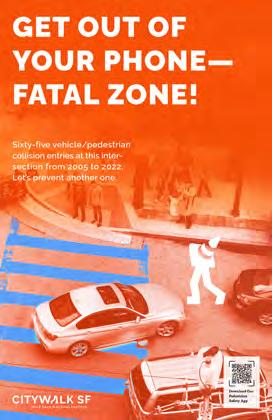
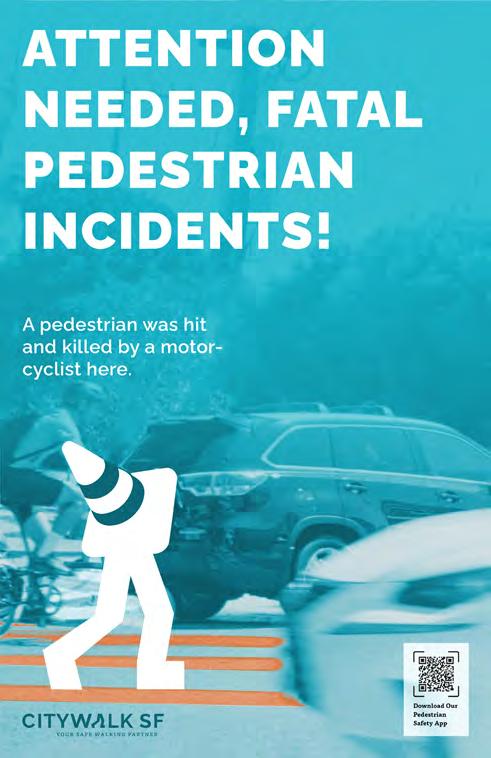
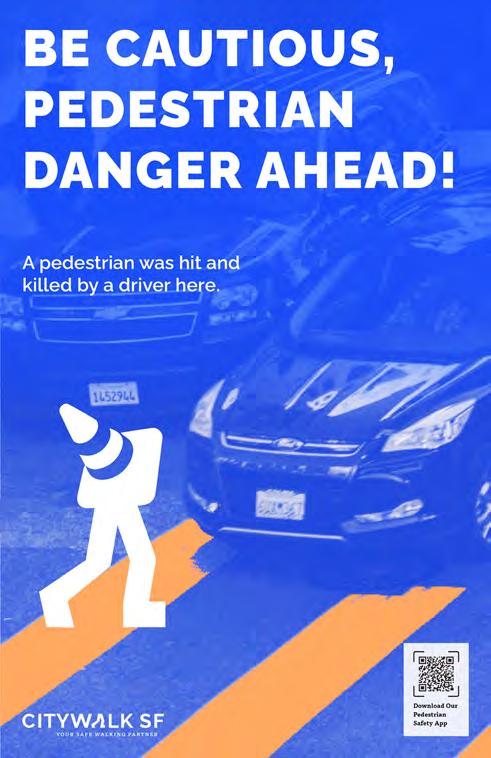
Posters, Banners, and Billboards (with lighting effects at night)
These are promotional materials at bus stops and on the street poles near those intersections.
The key contents for them include emphasizing the responsibilities of road users, drivers turning and hitting pedestrians, drivers not yielding to pedestrians, speed control, drivers and pedestrians making eye contact, improving pedestrian visibility, and pedestrians have to look both ways when crossing the road. (approx 9 pages)
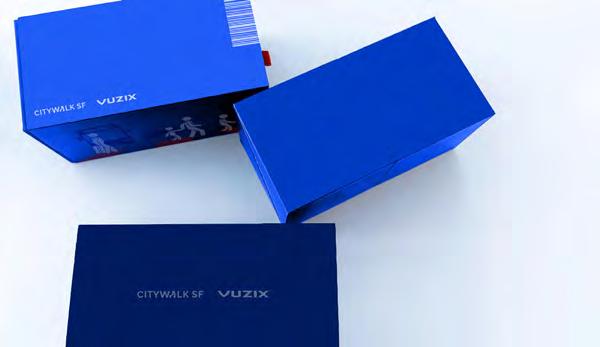
Packaging (2 Points)
It contains bright reflective and glowin-the-dark clothing and accessories that can improve pedestrian visibility, and help pedestrians observe traffic conditions and nearby vehicles.
The content will combine elements of San Francisco and a list of the most dangerous locations (listed below).
The top three high-injury areas for pedestrians: The Tenderloin, SOMA, and Market Street.
Shopping Bag
Backpack
Hoodie
T-shirt
Hat
Low-/High-Beam Flashlight
Handbell—It’s a signaling instrument for warning other road users and it’s activated by shaking.
AR Glasses —They can navigate, help pedestrians observe traffic conditions, and sense nearby vehicles.


