Summary of results
Scope 1 and 2 and 3 and Total Emissions
York University’s total emissions decreased across all scopes during the Covid-19 pandemic in 2021, resulting in a 30% reduction relative to 2020 levels (Figure 1). Scope 3 emissions experienced the most significant drop among all scopes. Emissions rebounded in 2022 and 2023, with 2023 levels exceeding those of 2020 by 1% This rebound was primarily driven by Scope 3 emissions, which include indirect emissions from sources such as purchased goods and services, commuting, business travel, and waste. In contrast, Scope 1 and 2 emissions remained relatively stable since 2021, with an approximate annual reduction of 2% combined.
Scope 3 Scope 2 Scope 1
Figure 1. Scope 1+2+3 emissions attributed to York University, from fiscal years 2016 to 2023, by scope
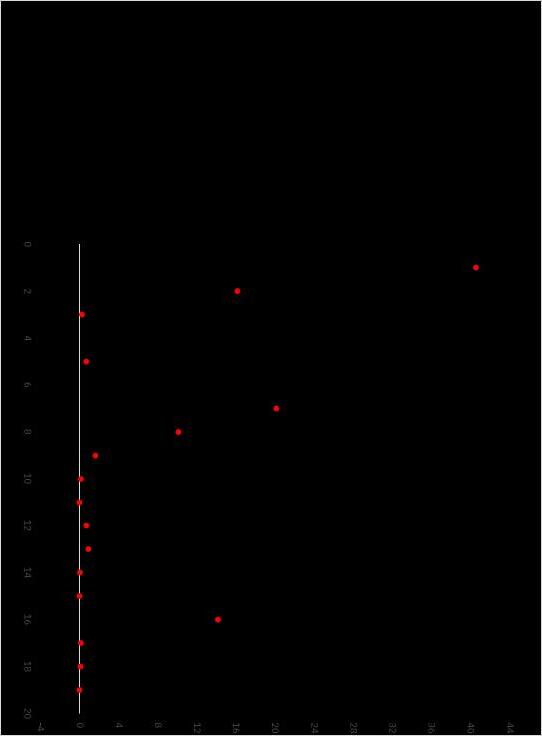
Figure 2 presents emissions by individual components, grouped by scope, in 2023 and with its range over the period from 2016-2023. Within each component’s range of emissions is identified the emissions in 2021 at the height of the Covid-19 pandemic. This helps to identify the extent to which a component was affected. Most affected were travel-related emissions, from commuting, air travel and other travel expenses. Components with the highest emissions in 2023 were the co-generation of electricity and heat (Scope 1), capital spending (Scope 3), and stationary combustion of natural gas (Scope 1). These components were also highly variable over the period of 2016-2023.
lectricity generation heat cogeneration at eele
dditional stationary combustion of natural gas
Combustion of diesel , furnace oil , and gaoline
lectricity purchased by York from electrical grid
YorkU capital expenses fund
YorkU repair and maintenance
YorkU leases of buildings, e uipment, software
YorkU air travel
YorkU reimbursed mileage
YorkU other travel expenses
YorkU purchased hospitality including food
Solid waste collected from campus
YorkU carbon offset purchases emission offset
YorkU other goods and services purchased
Commuting to campus by driving and parking
Commuting to campus by transit
YorkU water consumption
Figure 2. Greenhouse gas emissions, by component, in fiscal year 2023 (bars) compared to 2021 covid-19 lockdown year (dots) and ranges from 2016 to 2023.
Scope 1 and 2 Emissions
Similar to York University’s total emissions, the combined Scope 1 and 2 emissions experienced a notable decline across all components during the pandemic in 2021. This resulted in a 15% reduction compared to 2020 levels, with the largest reduction in stationary combustion of natural gas (Figure 3) As pandemic restrictions eased, no rebound was observed with emissions stabilizing and showing an annual reduction of 2% in 2022 and 2023. Emissions in 2023 were 20% lower than in 2020, marking the second-lowest level in the timeline, just 2% above the 2017 minimum.
In the latest reporting period (2021-2023), the co-generator has consistently been the largest contributor to Scope 1 and Scope 2 emissions, though levels have varied each year. Notably, decreases in co-generator emissions were offset by increases in additional stationary combustion and grid electricity in 2022, while increased co-generator emissions saw corresponding declines in these other sources in 2023. This inverse pattern kept the total Scope 1 and Scope 2 emissions relatively stable, resulting in small net changes over time.
Kt GHG (CO2e)
Kt GHG (CO2e)
201 Electricity purchased by York from electrical grid
103 Combustion of diesel, furnace oil and gasoline (vehicles, equipment and others)
102 Additional stationary combustion of natural gas at Keele and Glendon
101 Electricity generation & heat cogeneration at Keele
Figure 3. Scope 1+2 emissions attributed to York University, from fiscal years 2016 to 2023, by scope and component.
Scope 3 Emissions
York University’s Scope 3 emissions decreased by 40% during the pandemic in 2021, compared to 2020 (Figure 4) Reductions were observed across most components, with the largest decreases in commuting, travel, and hospitality-related emissions, due to travel and gathering restrictions However, emissions from capital expenses tripled in 2021 compared to 2020. This increase reflects an increase in capital expenses over this period, related to the construction of buildings and infrastructure at the new Markham campus, which started in summer 2020.
As restrictions eased, total Scope 3 emissions rebounded in 2022 and exceeded 2020 levels by 20% in 2023. Although commuting, travel and hospitality-related emissions rose in 2022, most of them remained below or around the 2020 pre-pandemic baseline in 2023. The only Scope 3 components that surpassed 2020 levels in 2023 were capital expenses, commuting by transit and water consumption, with capital expenses being the only one that trended lower compared to 2022.
Overall, emissions from capital spending, commuting and “other goods and services” purchased by York have been hotspots in Scope 3 emissions. While capital spending emissions have fluctuated, they represent a significant portion of Scope 3 emissions in high years and are key determinants of whether Scope 3 emissions exceed the previous year’s level. Smaller changes in other Scope 3 components have had less impact on the timeline.
Kt GHG (CO2e)
313 YorkU Water consumption
312 Commuting to campus by transit
311 Commuting to campus by driving and parking
310 YorkU other goods and services purchased
309 YorkU carbon offset purchases (emission offset)
308 Solid waste collected from campus
307 YorkU purchased hospitality including food
306 YorkU other travel expenses
305 YorkU reimbursed mileage
304 YorkU air travel
303 YorkU leases of buildings, equipment, software
302 YorkU repair and maintenance
301 YorkU capital expenses (fund 700)
Figure 4 Scope 3 emissions attributed to York University, from fiscal years 2016 to 2023, by scope and component.
Scope 3 Emissions: Investment
missions attributable to York University’s investments were supplied by the Treasurer, based on annual data from the investment consultant WTW, which uses MSCI’s methodology. This data encompasses the fixed income and equity portions of the endowment fund portfolio, covering up to 85% of the endowment fund, depending on the reporting year. Emissions were attributed as tCO2e per $M of equity and fixed-income holdings as of Q4 in each respective year. Notably, the data was only available for 2017, 2021 to 2023.
Due to limitations in the timeline and endowment portfolio coverage, investment emissions are reported separately from the rest of Scope 3 emissions. The challenge of apportioning emissions appropriately between investors (earning dividends or interest) and consumers of the good or service further complicates the reporting of investment emissions along with other Scope 3 emissions. Adding investment emissions with other scope 3 emissions risks double counting, since York can possibly be an investor in a company while also being a consumer of some of its goods or services. This issue was considered in the prior report of York’s emissions, in section 315: Emissions from York investments including endowments

One approach identified in the prior report to avoid double counting is to apportion a company’s emissions between investors and consumers. By assuming that % of the operating revenue is distributed to investors as dividends or interest, % of the company’s Scope 1 plus 2 emissions could be attributed to investors and the rest to consumers. In contrast, the typical approach is to allocate all Scope 1 plus 2 emissions to investors in proportion to their share of ownership. Emissions are reported in both approaches below.
York University’s emissions from its endowment funds demonstrated high variability over the reporting period. However, the percentage of endowment coverage increased and subsequently stabilized, allowing for a comparison between 2022 and 2023. With nearly identical endowment coverage in both years, emissions were reduced by half in 2023 (Figure 5). Under the typical approach, emissions from the endowment portfolio in 2023, at 85% coverage, were at 18.5 kt CO2e. It would be approximately equivalent to the combined emissions from the combustion of diesel, furnace oil and gasoline (103), grid electricity (201) and campus commuting by driving (311). Under the alternative approach with a typical economy-wide operating profit ratio of 10%, endowment emissions would equal to emissions of York’s leases of buildings, e uipment and software (303).
5. Greenhouse Gas Emissions attributed to York University Endowment, per fiscal year (data unavailable for 2018-2020). All emissions were distributed to investors (without any to consumers) and in proportion to an investor’s share of ownership.
Figure
Methodological changes from prior report
This section outlines changes to the methodology compared to the previous report, Measuring York’s Carbon and Ecological Footprints During Fiscal Years 2016-2020. Changes were made to improve upon the methodology, incorporate new data, update emission intensities to be more specific and accurate, adjust assumptions based on the data availability, and clarify component definitions. The full methodology can be assessed from the prior technical report.
102: Additional Stationary Combustion of Natural Gas at Keele and Glendon
• The scope category title was updated from “additional stationary combustion at eele and Glendon” to “additional stationary combustion of natural gas at Keele and Glendon.” This change clarifies that the category does not include stationary combustion of furnace oil or diesel.
• All diesel emissions are reported under scope category 103 in both the current and previous reports. This decision addresses inconsistencies in the reported amounts of diesel and furnace oil from various sources, including verified emission reports, data aggregations and attributions supplied by York’s energy team, fuel invoices, accounting records, and an incomplete timeline in the verified emission reports.
103: Combustion of diesel, furnace oil and gasoline (vehicles, equipment and others)
• The scope category title was updated from “fuel consumed by York vehicles and mobile e uipment” to “combustion of diesel, furnace oil, and gasoline vehicles, equipment and others .” This update clarifies that it includes fuel combustion from sources beyond vehicles and mobile equipment.
• Historic emission intensities were corrected due to a unit conversion error. This adjustment led to an average increase in GHG emissions of 6% (ranging from 5% to 8%) for the historical years.
201: Electricity Purchased by York from the Electrical Grid
• Due to insufficient data, consumption intensities of electricity from Statistics Canada’s National Inventory Report were used throughout the entire timeline in this report.
• In the previous report, emission intensities were based on the quantity of electricity consumed in Ontario and GHG emissions from Ontario’s electric power generation, transmission, and distribution sector.
• The change in emission intensities led to an average change of 2% (-1% to 11%) in GHG emissions for historical years, with 2020 seeing the largest change an 11% increase compared to the previous report.
Scope categories estimated using Statistics Canada’s sectoral emission intensities
301: YorkU Capital Expenses (Fund 700)
302: YorkU Repair and Maintenance
303: YorkU Leases of Buildings, Equipment, Software
306: YorkU Other Travel Expenses
307: YorkU Purchased Hospitality, Including Food
308: Solid Waste Collected from Campus
310: YorkU Other Goods and Services Purchased
• Matches between expense accounts and sectoral emission intensities were updated following a thorough review by Kiona Lo of matches made by a prior team of analysts.
• New expense accounts from the 2021-2023 expense data were added to the relevant scope categories.
• Some expense accounts which had not been assigned a scope category in the previous report were either added to the appropriate category or excluded from the estimate.
• Historic expenses were updated to include internal recovery (ICR) accounts and exclude internal transfers (if not already excluded), in line with current best practices recommended by York University's current Comptroller.
• Historic sectoral emission intensities were updated using the latest data from Statistics Canada for 2015-2020. Emission intensities beyond 2020 were adjusted using the percentage change in the Canadian Consumer Price Index (CPI) for each respective year, with 2020 as the base year, to account for inflation.
• These updates resulted in an average reduction of 13% (-42% to 13%) in GHG emissions for historical years across all affected categories. The most significant reduction occurred in category 303, due to the inclusion of ICR accounts
304: YorkU Air Travel (By Person-Type, Seat Class, Distance Flown)
• The travel start date was missing for some Concur airfare records in 2021-2023, as this field became optional in August 2021. This data is essential for allocating air travel emissions to the correct fiscal year. Missing travel start dates were estimated using the
median number of days between transaction and travel start dates for each month, based on airfare records from 2021-2023 where both dates were available in Concur.
• Emission intensities were updated using a different source. In the previous report, intensities were sourced from the US EPA with an incorrect unit conversion. For simplicity, the 2021 intensities were applied across the entire timeline. In this report, emission intensities are sourced from the UK DEFRA, which is the source of the P ’s derived intensities. The intensities were updated by fiscal year and load factor.
• The updated emission intensities reduced GHG emissions for historical years to approximately one-third of their original values, as the new intensities are about onethird of those used in the previous report.
308: Solid Waste Collected from Campus
• The phrase “net of diversion” was removed from the scope category title. This change clarifies that emissions for this category are derived from all expenses attributed to waste-related accounts.
309: YorkU carbon offset purchases (emission offset)
• In this report, emissions attributed to offsets were only reported in fiscal year 2016. Emissions in this scope category were estimated from the expense account “carbon offsets”. Discussions with the Sustainability Office and the Energy Team Financial Partner clarified that, in other years, expenses in this account were only provincial carbon taxes, without any carbon offsets. As a result, emissions were not attributed to this category for years besides 2016. In future years, we expect that York will be allocating more expenses to emission offsets, especially since tri-council granting agencies allow this as an eligible expense. For this reason, we retained this category 309 even though it was not empirically significant from 2017-2023.
310: YorkU Other Goods and Services Purchased
• With newly available data, emissions related to water usage were separated into their own scope category (313: YorkU Water Consumption) in this report. These emissions were estimated using water consumption intensities provided by the City of Toronto and York University's water usage data.
• In the previous report, water-related emissions were estimated within this scope category using water expenses and best-matched sectoral emission intensities.
311: Commuting to Campus by Driving
Changes for this component apply to 2021 to 2023, reflecting the new data period:
• The parking permit data now includes specific permit start and end dates, allowing for a more accurate representation of the duration of each permit.
• Due to the suspension of parking payments from March 20, 2020, to September 1, 2021, because of COVID-19, the number of daily parking purchases for 2021 and the first third of 2022 were estimated using 2020 data and coefficients derived from surveys on COVID-19 travel arrangements in universities. For staff and faculty, the coefficients were based on a report by Chowhan and Pike (2021) on the impacts of Covid-19 on the working arrangements of York University faculty and staff. For students, the estimates were informed by a Statistics Canada report by Doreleyers and Knighton (2020) on the impacts of COVID-19 on postsecondary students.
• These coefficients represent weighted averages of the percentage of staff, faculty, and students who attended work or classes on campus during the COVID-19 period (Table 1). It was assumed that there were no students or visitors on campus in 2021, as all inperson classes transitioned online from March 2020. The coefficients were applied by campus based on the relative proportion of staff, faculty and students who drove to campus in 2020.
• The quantities of parking permits for 2021 and the first third of 2022 were assumed to be the same as the 2020 data. These figures were adjusted for COVID-19 by modifying the commute frequency for each month the permit was valid (hereafter permit month).
• The commute frequency per permit month was updated using coefficients derived from the two COVID-19 surveys mentioned above and the 2022 YorkU transportation survey by Park and McCague (2023). These coefficients estimate the number of trips each York community member took to campus per permit month (Table 2). It was assumed that essential staff members were back on campus from September 2021 and inperson classes resumed for faculty members and students from January 2022 for ease of estimation.
Covid affected the entire year, estimated using the YU staff and faculty Covid travel arrangements survey
Covid affected the entire year, assumed 0 trips for students as all in-person classes moved online from Mar 2020
Covid affected the entire year, estimated using the YU staff and faculty Covid travel arrangements survey.
Table 2. Weighted averages of
1. Based on the 2022 YorkU transportation survey for all person types.
2. Assumed 0 trips for students, as all in-person classes moved online from March 2020.
3. Student - May-Aug 2021: Assumed 0 trips for students, as all in-person classes moved online from March 2020; Sep-Dec 2021: In-person class ratio based on Canadian PSE student survey (due to lack of specific York University data); Jan-Apr 2022: Based on the 2022 YorkU transportation survey.
4. Faculty on-campus ratio based on YU staff and faculty Covid travel arrangements survey.
5. Faculty - May-Aug 2021: Faculty on-campus ratio based on the YU staff and faculty Covid travel arrangements survey; Sep-Dec 2021: Faculty on-campus ratio based on YU staff and faculty Covid travel arrangements survey; Jan-Apr 2022: Based on the 2022 YorkU transportation survey.
6. Staff on-campus ratio based on YU staff and faculty Covid travel arrangements survey.
7. Staff - May-Aug 2021: Staff on-campus ratio based on YU staff and faculty Covid travel arrangements survey; Sep-Dec 2021: Based on the 2022 YorkU transportation survey and estimated essential worker %; Jan-Apr 2022: Based on the 2022 YorkU transportation survey.
8. On-campus vendor or staff of allied on-campus workplace
9. Assumed the same on-campus ratio as YU staff.
10. Assumed the same on-campus ratio as YU staff.
11. Assumed no visitors.
12. Visitor - May-Aug 2021: Assumed the same on-campus ratio as YU faculty, multiplied by visitor/other commutes per permit month; Sep-Dec 2021: Assumed the same on-campus ratio as YU faculty, multiplied by visitor/other commutes per permit month; Jan-Apr 2022: Based on the 2022 YorkU transportation survey.
312: Commuting to Campus by Transit
• Historic emission intensities for streetcars, and subways were updated to reflect the 2019-2023 average values provided by the Toronto Transit Commission (TTC). In contrast, historic local buses intensities were updated to the 2019 annual average value provided by the TTC, reflecting pre-pandemic emission intensities. The most significant change was observed in the bus emission intensities, which rose from 33g CO2e/pkm to 103g CO2e/pkm compared to the previous report. This adjustment resulted in almost a threefold increase in GHG emissions. Previously, bus emission intensities were based on data from the US Environmental Protection Agency (EPA). While the current intensity value appears high in comparison with previous estimates, it was assumed to be accurate as it was directly provided by the TTC and is similar to the UK DEFRA value.
• Emission intensities for local buses for fiscal 2021-2023 were derived based on the 2019 annual average TTC value and yearly average bus ridership relative to the 2019 level.
• The historic headcounts of faculty and staff for 2020, including the proportions of fulltime, part-time, and contract positions, were updated using revised data from OIPA. Staff from Glendon Student Services were included under the Glendon staff category.
• The proportions of commuters using carpooling or active transportation methods for fiscal year 2022, and onward, by postal code, were updated based on findings from the 2022 YorkU transportation survey.
• The approach to allocating daily parking trips to derive transit trips by Forward Sortation Area (FSA, the first three digits of a postal code) was updated. In the current report, daily parking trips are primarily allocated to faculty and students, based on the updated assumption that staff are less likely to use daily parking compared to parking permits when driving to campus. Previously, daily parking trips were allocated equally among all person types (faculty, staff, and students) based on the number of parking permits held by each group.
313: YorkU Water Consumption
• This new category reports data which was previously included in the broader aggregate 310: YorkU Other Goods and Services Purchased. This is discussed further in the present report under 310: YorkU Other Goods and Services Purchased.
314: Emissions from York investments including endowments
• In this report, emissions attributable to York University’s investments were supplied by the Treasurer, based on annual data from the investment consultant WTW and using MSCI’s methodology. In the prior report, investment emissions were assessed by the Board Investment Committee of the York University Endowment Fund (2021).
• In the prior report, this component was numbered 316. The present report renumbered it as 314 to sequentially follow 313. The prior report considered, but did not quantify, other downstream components which were numbered 313-315.
Conclusion
This report attributes greenhouse gas (GHG) emissions to York University in fiscal years 2016 to 2023, following the accounting convention of Scope 1 versus Scope 2 versus Scope 3. Emissions in fiscal years 2016 to 2020 reflect updated historic data and a refined methodology, when compared to emissions over this same period which had been reported previously by Miller et al (2023). Since 2020, total emissions fell and then rebounded.
During the peak of the COVID-19 pandemic in fiscal year 2021, emissions were 30% lower than 2020, dropping to approximately 106 kt CO2e. By 2023, emissions rebounded to near pre-pandemic levels, reaching 148 kt CO2e. While all scopes were affected by the pandemic, post-pandemic trends have diverged. Emissions from fuel combustion and purchased electricity (Scope 1 and 2) have gradually declined. In contrast, total indirect emissions (Scope 3) have exceeded pre-pandemic levels, reflecting details presented in the report related to purchased goods and services, commuting, business travel and waste. Scope 3 remains the largest source of emissions.
The primary hotspots of emissions for York University are concentrated in three areas: energy use (from the co-generator and stationary combustion of natural gas), purchased goods and services (capital expenses and other), and commuting (both by car and transit). These three areas are made up of six specific components, which together account for approximately 85% of the university’s total emissions in , out of a total of 17 components. Capital expenses were highly variable and significantly affected the aggregate of Scope 3 emissions.
York University’s renewed Sustainability Strategy includes a commitment to measuring and reducing emissions (York University, 2024). In support of this strategy, the GHG emissions inventory will be kept current with annual inputs of data and annual reports of results and any methodological changes. This inventory remains an impressive source of relational data which can be used to inform additional analyses and scenarios, across scopes or within one scope or component category. Requests for additional data analyses should be made through York’s sustainability office or through York’s sustainability taskforce.
References Cited
Chowhan, J., & Pike, K. (2021, May). Impacts of COVID-19 on the working arrangements of faculty and staff: Short report - highlights. York University.
Doreleyers, A., & Knighton, T. (2020, May 14). COVID-19 pandemic: Academic impacts on postsecondary students in Canada. Statistics Canada.
Miller, E., Apeksha, Angoh, S., & Holloway, E. (2023, June). Measuring York’s carbon and ecological footprints: During fiscal years 2016-2020. Ecological Footprint Initiative, York University.
Park, S., & McCague, H. (2023, March 31). Summary of findings from the 2022 York University Transportation Survey. [Unpublished]. Institute for Social Research, York University.
York University. (2024). York University Sustainability Strategy 2030: Positive Change: Connecting People, Planet and Purpose. York University.
York University Endowment Fund Board Investment Committee. (2021) Sustainable investing report. York University.