A Region in Motion: Canada’s Fastest-Growing and Youngest Metropolitan Area
A Region on Edge: Declining Wellbeing and the Fraying of Belonging A Region Reconnecting: Reinvigorating the Social Infrastructure That Holds Us Together
Territorial Acknowledgement
Waterloo Region Community Foundation (WRCF) is situated on the lands within the Haldimand Treaty of 1784, a formally ratified agreement acknowledging six miles on either side of the Grand River as treaty territory belonging to Six Nations of the Grand River. WRCF serves a region that is located within the traditional territories of the Anishinaabe, Chonnonton, and Haudenosaunee peoples. This territory is within the lands protected by the Dish with One Spoon wampum. We acknowledge the enduring presence, knowledges, and philosophies of Indigenous Peoples. We acknowledge the continuing accomplishments and contributions Indigenous Peoples make in shaping Waterloo Region. We are committed to understanding the impact of settler colonialism on the Indigenous experience in order to envision and co-create collaborative, respectful paths together in mutuality and reciprocity.
We are all at different places on this learning journey but we have to start with Truth to reach Reconciliation. The National Centre for Truth and Reconciliation has educational resources you can read.
Thank you
Waterloo Region’s Vital Signs® Report would not have been possible without the support of individuals and organizations across the communities that make up Waterloo Region. We are grateful to our sponsors and supporters for their contributions, which allowed us to truly dive deep into the data. This report was derived from numerous organizations and people – providing data, ideas, feedback, and advice that you will find throughout this document. We would like to acknowledge each of you for your contributions and hope we have not missed anyone in this list.
All opinions and interpretations in this report are the opinions, interpretations, or perspectives of the author and editorial team and do not necessarily reflect the opinions of any organizations or people we acknowledge here.
We thank everyone who provided insight.
Sponsors and supporters
LEAD AUTHOR AND RESEARCHER
Steven Ayer, Common Good Strategies
KEY ADVISOR
Eric Avner
EXECUTIVE EDITOR
Lynne Short
RESEARCH SUPPORT
Paul Anderson
William Krueger
DESIGNER
Rochelle Benoit
ADVISORS AND CONTENT CONTRIBUTORS
Kristine Allison Engage Rural
Fitsum Areguy Textile
Tara Bedard Waterloo Region Immigration Partnership
Helen Fisburn CMHA Waterloo Wellington
Troy Glover University of Waterloo
Jane Hennig Volunteer Waterloo Region
Josh Joseph City of Kitchener
Andrea Kingswood YMCA of Three Rivers
Ian McLean
Greater Kitchener Waterloo Chamber of Commerce and Chair, BestWR
Allan Mills
Extend-A-Family Waterloo Region
Oluseun Olayinka Adventure4Change
Alison Pearson Children and Youth Planning Table of Waterloo Region
Ron Schlegel Schlegel Villages
Irene Schmidt-Adeney The Ayr News
Nathan Stretch Kitchener Public Library
Dan Vandebelt Children and Youth Planning
Table of Waterloo Region / Waterloo Region Immigration Partnership
Sam Varteniuk The Registry Theatre
Monique Yuhasz YMCA of Three Rivers
Thank you to the local photographers who provided images. You will find credited images throughout the report.
Note: Additional content was provided by participants of 2024 On the Table conversations.
Why Vital Signs
Vital Signs® is a community-driven data program that is led nationally by Community Foundations of Canada, and locally by community foundations across Canada – including Waterloo Region Community Foundation (WRCF). Vital Signs® reports are used to better understand the vitality of communities, on aggregate, and also through unique experiences and realities of different groups within the community. They can be broad –and cover a range of topics OR focus on one critical issue.
In 2025, similar to previous years, WRCF has chosen to focus on one issue and do a more detailed analysis with the aim to provide focus for public debate, inspire civic engagement, and help people and organizations take action and direct resources where they will have the greatest impact.
How to use this report
START CONVERSATIONS. TAKE ACTION.
If you or your organization is moved or motivated by what you read, use this report as a starting point for positive action. You will find a list of some actions to get you started beginning on page 58 of this report.
PASS IT ON.
Share the report. Pass it on to people like your friends, colleagues, employees, students, neighbours, club members, folks you interact with at the library or community centre, or discuss highlights with an elected official at any level.
FIND OUT MORE.
Learn about the many organizations in our community working to improve our social infrastructure and see how you too can help.
CONTACT US.
We know about the issues in our community as well as the organizations working on solutions to improve them. If you would like to make a difference, we can help and guide you. www.wrcf.ca
M.Kristensen-Smith
Why Social Infrastructure
At Waterloo Region Community Foundation (WRCF), we are convinced that the strength of our community lies not only in what we build, but in how we connect. That’s why social infrastructureG – the shared spaces, shared experiences, and shared resources that enable people to connect in meaningful ways – has become central to our work.
This focus emerged from a powerful insight: Waterloo Region has one of the most transient and most rapidly growing populations in Canada. This reality, highlighted in Waterloo Region’s 2023 Vital Signs® Report, challenged us to think differently about how we foster belonging, resilience, and opportunity in a constantly evolving region. In response, WRCF has embraced social infrastructure as a strategic priority, one that reflects both the urgency of the moment and the promise of what’s possible.
Over the past months, we’ve been listening closely to our community. Through events we’ve hosted like “On The TableG Waterloo Region” and our Do More Good Dialogues, we’ve heard from residents across the region about what connection means to them. We’ve also supported and learned from a growing number of local organizations that are reimagining public spaces, strengthening relationships, and creating new opportunities for people to come together.
To further inform this work, Waterloo Region’s 2025 Vital Signs® Report brings together data, insights, and lived experiences to illuminate where the social infrastructure in our region is thriving and where gaps remain. It highlights the importance of
investing in places that foster belonging, in programs that bring people together, and in systems that make participation in community life more equitable and accessible. It also underscores the need to recognize and support the informal networks and everyday interactions that quietly but powerfully shape our collective wellbeing. Social infrastructure is not a single solution. It is a dynamic ecosystem that requires ongoing attention, collaboration, investment, and care.
This report is part of that ongoing commitment. We invite you to explore the findings, reflect on their implications, and consider how you, your organization, or your community can help strengthen the social fabric of Waterloo Region. Together, we can build a more equitable, connected, and sustainable future, one where everyone has the opportunity to thrive and to belong.
Eric Avner, President & CEO
Let’s challenge ourselves to think differently about how we foster belonging, resilience, and opportunity in a constantly evolving region. Focusing on social infrastructure reflects both the urgency of the moment and the promise of what’s possible.
Eric Avner, WRCF President & CEO
How to Read This Report: Notes on the Data
This report analyzes data that paints a picture of the state of social infrastructure in Waterloo Region.
Waterloo Region Community Foundation defines social infrastructure as the system of organizations, spaces, and experiences that enable people to connect with each other, the bridges necessary to build trust and civic participation, to create a sense of belonging and wellbeing. It’s the system that enables sustainable widespread community development.
Our region is on track to grow to over one million people by 2050. There needs to be a solid social infrastructure in place to “grow community as our community grows.”
Did we mention data? This report was built on gathering a lot of data – from a variety of sources – including discussions and interviews, and a lot of secondary sources of data. We have used local sources wherever we can, but then also included other comparisons where it makes sense or when local sources were not available. The data presented is as current as was available.
You may read a chart or some statistics hoping to also get insights or linkages to specific demographic groups in our community. We have presented some of the disaggregated data that is available, but we continue to be challenged to provide information with different lenses –including but not limited to race-based data.
Between pages 8 and 57, we’ve presented the data in three sections that you can review in detail. Pages 58 to 70, discuss actions that are being taken, and those you – and others in our community – could step up and support.
At the end of this report you will find detailed endnotes with data sources, and a glossary of some terms we use that you might not recognize. (Words in the glossary are marked in the document with a G).
Throughout the report you will find quotes from individuals across our community, who care deeply about, and are working on augmenting and improving, social infrastructure in Waterloo Region. We didn’t have the space to include all the quotes – and we couldn’t talk to everyone who is focused on this issue – but the insights we’ve included provide valuable context.
Safwan Nakum
Waterloo Region includes three cities (Cambridge, Kitchener, and Waterloo) and four townships (North Dumfries, Wellesley, Wilmot, and Woolwich). With a diverse set of data available from various sources, many times the data that is available only covers a portion of the broader region. It can get very confusing –so we’ve created this chart below as a reference tool to help you interpret the data as you read through the report.
Corrections Welcome: A Commitment to Accuracy.
While we did our best to accurately convey the content in this report, and it went through a detailed review process, mistakes can inevitably slip through. We sincerely apologize to anyone whose data was misrepresented. If this was the case, please let us know by contacting info@wrcf.ca, and we will ensure future versions do not include the same mistakes.
Summary and Key Findings
Waterloo Region is changing faster than almost anywhere else in Canada – growing younger, more diverse, and more complex by the year. Over the past decade, we’ve been the fastest-growing metropolitan area in the country. But in 2025, growth is expected to pause – and by some estimates even decline – offering a rare window to catch up on the social infrastructure that has not kept pace. Growth alone does not guarantee connection. As this report will show, life satisfaction is slipping, belonging is fraying, and the social infrastructure that once helped anchor community life in Waterloo Region needs urgent attention.
This report explores how we can renew, reinvest in, and reimagine our shared spaces to meet today’s challenges – and highlights ways each of us can contribute to a more connected and resilient region.
Yet, there are gaps in the data that impede our progress. It was difficult to pull this report together, and to get data that clearly shows what is happening across the region – and the impact on populations within the region. There is a need for data that demonstrates where investment should take place to address gaps in terms of things like: neighbourhood or community, age, race, sexual orientation, abilities, income, length of time living in the region – and more.
If something in these pages speaks to you, we hope you’ll reach out. On pages 58 to 70, you’ll find concrete ways to get involved – no matter who you are. More than a call to action, this is a call to community – together we can grow community as our community grows.
Here are highlights pulled from the data gathered through the report:
Section 1: A Region in Motion – The Fastest-Growing and Youngest Region in the Country
No other metropolitan area in Canada is growing – and changing – as quickly as Waterloo Region, driven by young adults, racialized groups, and a steady influx of people seeking opportunity and a place to put down roots.
• Waterloo Region contains Canada’s fastest-growing metropolitan area in Canada over the last decade, with the population rising from approximately 537,000 in 2014 to just under 707,000 in 2024 according to Statistics Canada estimates – a 33% increase over the decade, nearly twice the national growth rate – including more than 170,000 new residents in the last 10 years, and 114,000 in just the past five.
• The region is now the youngest metropolitan area in the country, with a median age of 35 – more than five years younger than the national average.
• Growth is driven by young adults and newcomers, with population growth among 20 to 34-year-olds occurring 4-5 times faster than the national average.
• Waterloo Region has also undergone one of the most substantial demographic shifts in the country. Few places in Canada have seen such a rapid transformation in who calls it home. Based on Census and population growth data, we estimate the number of immigrants has risen by 100,000 since 2016 and the estimated racialized population more than doubled to 230,000.
Section 2: A Region on the Rise and on Edge – Declining Life Satisfaction and Belonging
The region’s rapid transformation has created real pressures – but the data also points to where investments and action can make the biggest difference.
• Only 49% of residents in Waterloo Region report high life satisfaction, four percentage points below the national average, according to national wellbeing data from 2021 to 2024. This indicates that life satisfaction in Waterloo Region has declined more steeply than in any other part of the country from before the pandemic.
• Young people are feeling the least connected. Just 36% of residents under 30 report a strong sense of belonging – compared to 74% of seniors – and life satisfaction is significantly lower for youth than for older adults. Younger residents in Waterloo Region are also less satisfied with their neighbourhoods than their peers across Canada.
• Belonging varies sharply across the region. In the City of Waterloo, 53% of residents report a strong sense of belonging, compared to just 40% in Kitchener and Cambridge. Life satisfaction follows a similar pattern, with Kitchener (41%) and Cambridge (44%) trailing both the regional and national averages. There is a higher sense of life satisfaction and wellbeing overall in the townships – with North Dumfries trailing slightly on sense of belonging.
Section 3: Rebuilding the Ties That Bind – Social Infrastructure and the Foundations of Wellbeing
The story is far from bleak. Waterloo Region has a long tradition of investing in strong social infrastructure – from parks and libraries to cultural institutions and community spaces. This report presents growing evidence that these assets are vital to wellbeing and belonging. It also highlights that the investment in social infrastructure hasn’t fully kept pace with growth, change, or recovery.
• People who use social infrastructure most frequently are more connected and have better wellbeing. 73% of frequent participants reported high life satisfaction compared to just 51% of less engaged individuals.
• Unlike other forms of social infrastructure, parks surged in use during the pandemic. Between 2018 and 2022, the share of residents using parks, trails, and playgrounds rose from 60% to 67%. Nearly 90% say they have a park nearby – a consistent finding across geographies and demographics.
• Waterloo Region’s arts and culture sector is rebuilding – but recovery remains slow. Attendance dropped over the pandemic and through 2023 revenues were still 15% below 2018 – or 42% lower per capita after adjusting for inflation and growth. Municipal and regional arts funding also declined by 5% in real terms, translating to a one-third drop per capita once inflation-adjusted.
• Community and recreation centres play a vital role – but many residents haven’t returned. Usage fell from 63% in 2018 to 51% in 2022, and data from a major provider suggests recovery has stalled in the last few years. Barriers like cost, convenience, and lack of information remain high, with more problems reported by younger and racialized residents.
• Libraries remain among the most used community spaces, despite changing use during the pandemic. As of 2023, 231,800 residents across the region – about one in three – held active library cards, and two-thirds reported occasional use. But in-person visits were still 17% below 2019, and program attendance declined by 16%, alongside a similar drop in program offerings. Digital offerings and borrowing rose during the pandemic, but changes the nature of how people are using the library.
• An opportunity to re-engage with volunteering and giving Volunteering dropped 11 points between 2018 and 2022 with smaller declines in the donation rate. Yet the number of volunteer opportunities being posted is on the rise – suggesting that the need is growing, and so are the ways people can get involved.
• Supporting local journalism is important, but improving the region’s information infrastructure calls for more comprehensive solutions. We need a mix of digital, physical, and human approaches to ensure people can see themselves in their communities and know what’s available to them.
Everyone knows Waterloo Region is growing. But it has quietly been the fastest-growing metropolitan area in the country.
Eric Avner, WRCF President & CEO
A Region in Motion: Canada’s Fastest-Growing and
Youngest Metropolitan
Area
Growing Fast: Canada’s Fastest-Growing Metro
Waterloo Region has added 170,000 people in the last decade – including 112,000 in just the past five years. According to Statistics Canada as of July 2024, it now sits just under 707,000 residents.1 The Census Metropolitan Area (CMA)G , 2 which excludes some parts of the region with lower commuting flows, sits at 696,000 residents, making it the 10th largest metropolitan area in the country.3
From 2014 to 2024, Kitchener-Cambridge-Waterloo was the fastest-growing metropolitan area in Canada, with its population rising by 33%, including 19% just from 2019 to 2024. This growth outpaced other fast growing metropolitan areas like Calgary (28%), Moncton (29%), and Kelowna (30%), and was nearly double the national (17%) and provincial (18%) rates.4 Canada is growing faster than any other G7 or OECD country, as we noted in our 2023 report – making Waterloo Region almost certainly one of the fastest-growing metropolitan areas on the planet. But new regional forecasts suggest that growth has not only slowed, the population may have started to decline in late 2024. However long this slower growth lasts, it offers a rare window to catch up on the social infrastructure gaps that rapid growth left behind.
No other metropolitan area in Canada has matched this region’s consistently high growth over the past decade. It ranked among the fastest-growing from 2014 to 2019 and was the second-fastest from 2019 to 2024.5 While it never took the top spot in any single year, it has placed in the top five for population growth every year since 2019 –including 2nd in 2019 and 2022, and 3rd in 2023 and 2024.
No other metropolitan area in Canada has matched this region’s consistently high growth over the past decade
The challenges of growth on housing have been well-documented. Waterloo Region Community Foundation (WRCF)’s 2021 and 2023 Vital Signs® reports, focused on affordable housing, dug into many of the pressures that come with rapid growth – from recordlong waitlists for affordable housing to soaring home prices and rents, which have risen faster here than almost anywhere else in the country. The challenges that emerged during our rapid growth were many, but the respite of slowing population growth is an opportunity to invest in new social and physical infrastructure.
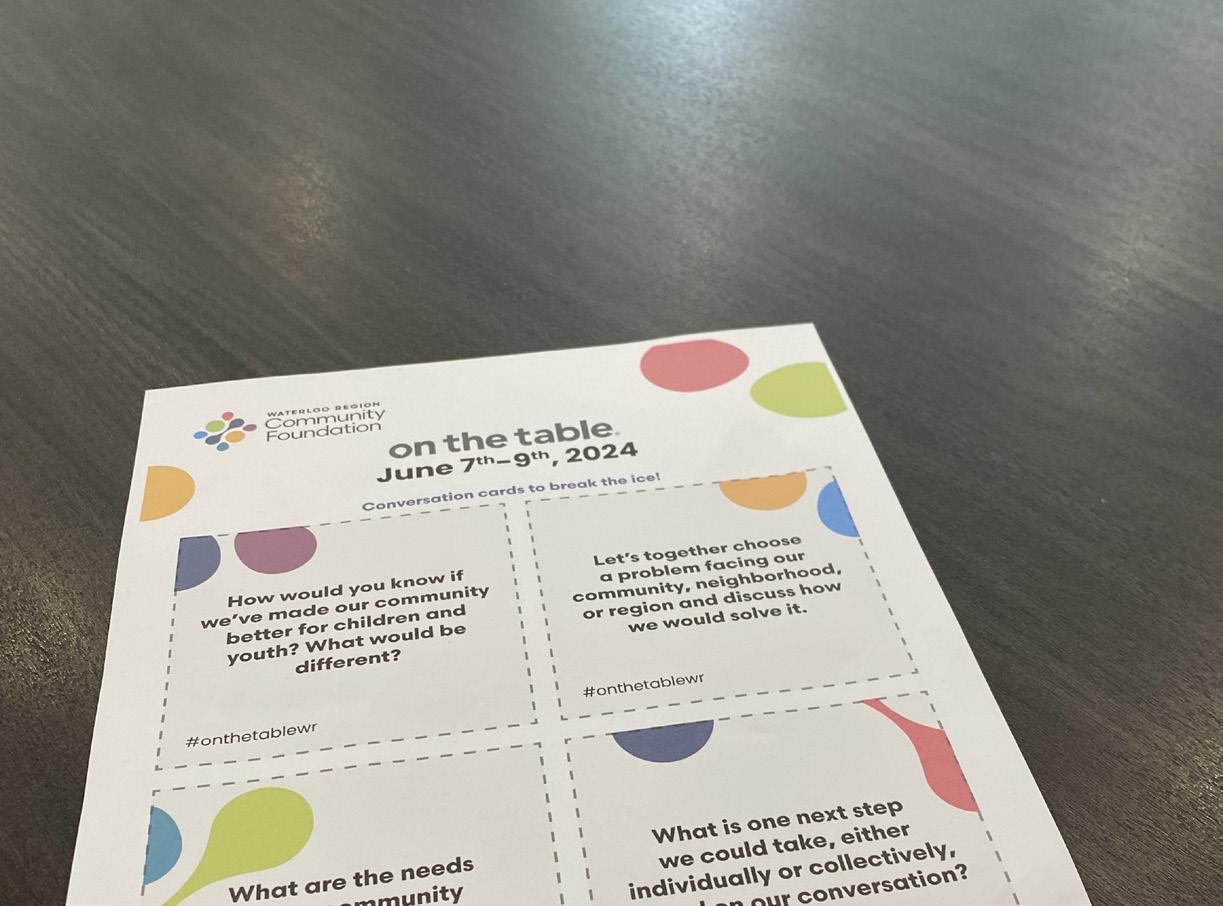
Residents widely perceive that social infrastructure has not kept pace with the region’s rapid development. It emerged as a central concern in the WRCF event: On the Table 2024 – one of the largest community engagement efforts in Waterloo Region – with more than 1,300 residents participating in 54 conversations. In these free-flowing discussions, 77% of hosts reported that improving social infrastructure was a major focus. Participants spoke about how rapid growth is making it harder to build meaningful connections, particularly as new housing and developments outstrip the availability of shared spaces, services, and opportunities to come together.
Social infrastructure refers to the system of organizations, spaces, and shared experiences that enable people to connect with each other, build trust, participate in civic life, and foster belonging and wellbeing.
The insights raised in On the Table along with many others shared by community members and frontline organizations – made it clear that this is one of the region’s most urgent challenges. In response, WRCF has made strengthening social infrastructure a key strategic pillar of its work going forward.
Ten fastest and slowest-growing metropolitan areas in Canada
Note: The chart only shows Census Metropolitan Areas (CMAs) that score in the top ten and bottom ten out of the 41 Canadian CMAs.6
Growth Questions: Why the Region’s 2024 Population Estimates Differ from Statistics Canada
Slower growth locally: While Statistics Canada estimates Waterloo Region’s population grew by 4.9% in the year ending July 1, 2024, the region itself reports a much more modest 0.6% increase from year end 2023 to year end 2024 – just 4,260 additional residents, bringing the yearend total to 678,170.7
Why the difference? The region’s estimate reflects a sharp slowdown compared to five-year – and fifteen-year averages. A key factor is the 23% drop in international student enrolment in the region following new federal caps on study permits8 and the projection that many of these students have left the region. Non-permanent residentsG contributed 25,000-28,000 people to growth in both 2023 and 2024.9 It remains to be seen how many former international students have left the region versus transitioned to other immigration statuses, but it is also clear that future growth has and will continue to slow. An August 2025 series in the Waterloo Region Record highlighted the first signs of potential population decline, with total international student enrollment dropping by over 15,000 versus previous years – corresponding with falling apartment rents, declining transit ridership, and cuts to local transit service. Temporary work permits and new permanent residents are still well above historical levels, but have also fallen from their peaks.
Population estimates are increasingly a matter of debate: It’s difficult to say whether reduced enrolment has translated to people leaving the region. While the region’s population forecasts assume significant departures, Benjamin Tal, Deputy Chief Economist at CIBC, argues that many non-permanent residents remain in Canada after their initial visas expire while awaiting status renewals or transitioning to permanent residency or visitor visas.10
Looking ahead: The region expects growth to slow further in 2025, projecting just a 0.4% increase (2,730 people)11. This forecast is based on an anticipated national slowdown, with Canada’s population growth expected to dip to 0.2% in both 2025 and 2026.
Still on the path to one million: Despite near-term slowdowns, the region maintains the long-term projection that Waterloo will reach one million residents by 2050.12
Getting Younger: Growth
Made Us the Youngest
Ten youngest and oldest metropolitan areas in Canada
In 2024, Waterloo Region had the youngest median age of any metropolitan area in Canada, five years younger than Canada as a whole
Waterloo Region’s growth has contributed to it being much younger than the rest of the country
Waterloo Region now has the youngest median ageG of any metropolitan area in Canada, five years younger than Canada as a whole. At 35, the region’s median age is more than five years younger than the national median age of 40.3. This is a decline of 3 years from 2014 to 2024, even as Canada’s median age stayed almost flat, declining by just 0.2 years. In other words, ten years ago, the region was only two years younger than the rest of the country.
Wide variation in age across the region. As of the 2021 Census, the Township of Wellesley had a median age 2.8 years younger than Waterloo Region overall, while the Township of Wilmot was 4.8 years older than the region overall.13
The average ageG fell only slightly – and that tells a more nuanced story. Waterloo Region also has the lowest average age of any metropolitan area in the country, though the change is not as striking. The region’s average age declined by just 0.3 years from 2014 to 2024, from 38.7 to 38.4.14 That small shift reflects the reality that while more young people are arriving, we are still seeing very rapid growth among older age brackets and much of the population growth is between 20 and 40, which is relatively close to the average. This is still considerably younger than the average for Canada which was 41.6 years of age.
The region has experienced staggering growth of people in their 20s and 30s
The number of 25 to 29-year-olds nearly doubled in a decade, growing at a rate three times faster than the rest of the country. From 2014 to 2024, this group surged from 39,000 to 76,000 residents – a 94% increase that makes it the largest five-year age cohort in the region today, while the rest of the country saw only 26% growth.
The number of 20 to 24-year-olds grew by 63%, growing nearly five times faster than the rest of the country, jumping from 40,000 to 65,000. This rate of growth is nearly five times the national average of 13%.
This isn’t just about international students. Growth has been strong across the board for adults in their late 20s, 30s, and early 40s. And a considerable portion of the longer-term growth has come as former international students have transitioned to permanent residents of the region. The number of 30 to 34-year-olds climbed from 38,000 to 63,000, while the number of those aged 35 to 39 rose from 36,000 to 52,000.
Among international students, many hope to – or are considering – staying in the region.
International students have played a major role in growth in recent years and whether they stay or leave has a major implication on future growth. 90% intend to remain in Canada after graduation, and more than one-third (35%) plan to potentially stay in the region permanently, while 18% don't plan to stay permanently, according to findings from the 2025 International Student Survey conducted by the Waterloo Region Immigration Partnership.16
Growth for those in their 20s and 30s is three to five times faster than the national average. Between 2014 and 2024, the 25 to 29-year-olds growth rate of 94% in the Kitchener-CambridgeWaterloo CMA was nearly four times the national rate of 26%. For 20 to 24-year-olds, the gap is even wider: 63% growth locally compared to just 13% nationally – nearly five times faster.17 In total, those from 20 to 34 grew by 76% here compared to 23% for the rest of the country – more than three times faster.
Some of the growth has also come with family formation. Growth among children aged 0 to 4 was 11 percentage points higher in the Kitchener-Cambridge-Waterloo CMA than across Canada overall (albeit at 8% versus -3% for the rest of the country), and five percentage points higher for 5 to 9-year-olds (17% vs 12%).
The number of older adults is also growing quickly. The number of residents aged 65 to 69 rose from 23,000 to 31,000 (+28%), 70 to 74 rose from 17,000 to 25,000 (+43%), 75 to 79 rose from 12,000 to 19,000 (+51%), and those aged 80 to 84 grew from 10,000 to 13,000 (+30%).
The large growth rate of older adults is actually slightly lower than the rest of the country. Among those aged 65 to 79, the growth rate is 6 to 8 percentage points lower in the KitchenerCambridge-Waterloo CMA than the rest of the country. Part of this could be because of the trend of increasing out-migration among these age cohorts that we discussed in WRCF’s 2023 Vital Signs® Report.
These trends are creating multifaceted pressures. This includes critical needs for mobility, care, adaptation of public facilities, opportunities for recreation, community engagement, and inclusion at multiple points of the age spectrum.
Population growth in Waterloo Region looks very different than the rest of the country
Kitchener-Cambridge-Waterloo
Shifting Foundations: Demographic Change Across People and Places
A dramatic demographic shift is underway. Between 2016 and 2021, the number of residents across Waterloo Region who identified as white declined by 7,000 (–3%), while the number of residents who identified as racialized increased by 59,000 (+59%), reaching 159,000 people.18 Based on Statistics Canada population estimates, the region has grown by another 93,000 people overall since the 2021 Census,19 though annual population estimates also include people who are excluded from the Census counts.
Projecting this trend forward, the racialized populationG likely grew by about 158,000 (158% growth) between 2016 and 2024, while the white population declined by approximately 14,000 (3%). These estimates should be interpreted carefully due to the differences in annual population estimates and Census population estimates (see endnotes for full details). Similar trends are seen among those born outside of Canada, which likely also almost doubled from 2016 to 2024, growing by almost 122,000, a 95% increase from 2016.
The last five years saw incredible growth in Waterloo Region, largely the result of welcoming new immigrants. The incredible diversity of the people choosing this region as their home in Canada is driving a need to change the infrastructure we build and the services we provide. The good news is that Waterloo Region is responding – with new types of recreation and other infrastructure and diverse organizations being supported to provide more linguistically and culturally appropriate supports and ways of connecting for their communities. This responsiveness will continue to be important to we build the social and other infrastructure needed as we grow towards one million residents.
Tara Bedard Executive Director, Waterloo Region Immigration Partnership
The estimated number of racialized people in Waterloo Region grew by more than 150% between 2016 and 2024
Growth has long-term implications for equity. As we show later in the report, racialized residents consistently report lower access and greater barriers to access across all forms of social infrastructure. The question is: how do we work as a region to close those gaps?
While the region as a whole has experienced remarkable population growth over the last decade, the pace and impact of that growth varies significantly by municipality. From 2014 to 2024, Kitchener and Waterloo have seen the most dramatic increases – 37% and 38%, respectively –followed by North Dumfries (27%), Woolwich (24%), and Cambridge (23%). These areas are driving the demographic shifts discussed throughout this report, including changes in age distribution, cultural diversity, and housing demand. In contrast, Wellesley (7%) and Wilmot (11%) have experienced much slower growth, suggesting that some of the region’s most pressing social and infrastructure pressures may be less acute there – at least for now.
Total growth over last decade by Municipality 2014 to 2024 Total population growth over last decade by municipality
Life satisfaction and mental health in Waterloo Region deteriorated more than the rest of Canada during the pandemic.
A Region on Edge: Declining Wellbeing
and the Fraying of Belonging
Declining Wellbeing: Falling Behind in Life Satisfaction
New national data show life satisfaction is a challenge across Waterloo Region. Launched after the start of the pandemic, Statistics Canada’s Canadian Social Survey (CSS)G was designed to monitor wellbeing across the country on a consistent set of indicators. In this new dataset, which aggregates data from 2021 to 2024, life satisfaction in Waterloo Region remains a concern, with just 45.6% reporting high life satisfaction, almost 4 percentage points lower than the national average.
2021-2024. Source: Statistics Canada Canadian Social Survey.21 Note: Canadian Social Survey data aggregates data from 2021 to 2024 to ensure adequate sample sizes at the municipal level. Definitions for each indicator are in the endnotes.22
Life satisfaction and mental health have declined more sharply in Waterloo Region than elsewhere in Canada. According to data from the Canadian Housing SurveyG, between 2018 and 2021, life satisfaction in the region fell by 6 percentage points, and poor mental health increased by 9 points – compared to smaller changes of 2 and 6 points, respectively, across the rest of Canada. As this survey collects responses only from household maintainersG, results should be interpreted with some caution, though, unlike with the CSS, we have data from before the pandemic.
Mental health was also worse in Waterloo than Canada as a whole, a trend that emerged over the pandemic. Data from the 2021 Canadian Housing Survey shows that 22% reported fair or poor mental health, 5 percentage points higher than the national average of 17%. Before the pandemic the results were almost identical at 13% with fair or poor mental health versus 11% in Canada as a whole. The same source also found life satisfaction in the region to be 6 percentage points lower than the rest of Canada, providing additional evidence that this is an issue.
Behind every statistic is a
story
— someone searching for hope, connection, wellness.
The numbers echo what we already feel: mental health and life satisfaction have declined sharply in Waterloo Region. These are not just trends — they’re real people, real pain. At CMHA Waterloo Wellington, we walk alongside our community with compassion and purpose. But rebuilding hope will take all of us, working together.
Helen Fishburn CEO, CMHA Waterloo Wellington
Join CMHA WW’s My Path - Their mission is to provide a space where you can connect with others who understand your journey, explore important topics surrounding mental health, and be encouraged to spark positive change in your life. Explore a variety of peer-led support groups, insightful webinars, and training sessions.
Kitchener-Cambridge-Waterloo CMA. Source: 2018 and 2021 Canadian Housing Survey. Analysis by the Author. Notes: This survey focuses on people responsible for housing situations and should be interpreted cautiously.23 Rest of Canada refers to Canada excluding Waterloo Region.
While we don’t have data that shows life satisfaction from Waterloo Region in the most recent year or two, trends in declining life satisfaction also appear to be ongoing based on more recent Canadian evidence. According to the World Happiness Report, life evaluations in Canada have been falling steadily since around 2016, with especially sharp declines during the pandemic years.24 Rather than rebounding post-COVID, national averages continued to drop through 2024 – placing Canada significantly lower in global rankings than in previous years. While we cannot say for sure whether this is the same in Waterloo Region, it does suggest this is an ongoing area of concern.
But its not just Waterloo Region that is struggling with life satisfaction, as Ontario as a whole is also struggling. These trends reflect broader challenges facing the province. Across Ontario, just 53% of residents report high life satisfaction – 4 points lower than the rest of the country – according to the CSS.
Other Challenges: Waterloo Region Struggles (Less) on Several Other Measures of Wellbeing
Satisfaction with one’s neighbourhood is another area where Waterloo Region fell behind during the pandemic. According to the 2021 Canadian Housing Survey, just 67.7% of residents rated their neighbourhood an 8 or higher out of 10, 5 percentage points lower than the 72.4% in the rest of Canada.26 We have no data to see how this may have evolved further as the pandemic unfolded.
Many people were struggling with low belonging early in the pandemic. In Waterloo Region, the share of residents reporting a low sense of belonging (a score of 6 or lower on an 11-point scale) was 7 percentage points higher than the national average on the 2021 Canadian Housing Survey (42% versus 35%).27 However, the Canadian Social Survey, covering more recent periods did not find a difference in the percentage of Waterloo residents with high belonging (see opening chart in this section). This data leaves us unable to determine whether this difference reflects differing methdologies, improvements over time, or whether its only rates of low belonging that is an issue for Waterloo Region.
Canada is also notable for declines in life satisfaction on an international basis and is showing no signs of improving. According to the World Happiness Survey, almost no countries have had as big a drop in life satisfaction since 2010 as Canada. This is particularly driven by those between the age of 18 to 29 and to a lesser extent those between 30 and 64. However, Canada still remains one of the countries with the highest life evaluations regularly among the highest life evaluations in the entire world.25
Diverging Experiences:
Key metrics for Waterloo Region
Wellbeing Varies Widely
By municipality
One unique feature of the new Statistics Canada data from the Canadian Social Survey is its ability to break out results by municipality. While it does not include data for the townships, it remains the only available source for comparing wellbeing in Waterloo Region’s cities to the rest of Canada with a directly comparable methodology.
High life satisfaction Strong sense of meaning and purpose
Scores on wellbeing indicators, by municipality in Waterloo Region
Rarely or never feels lonely Strong sense of belonging to local community
Key metrics for Waterloo Region
Canada Waterloo Kitchener Cambridge
High life
All three cities in Waterloo Region are scoring relatively poorly on life satisfaction. Life satisfaction is an issue across the cities in the region, with 49% of Canadians reporting high life satisfaction, compared to 47% of Waterloo residents, 44% in Cambridge, and 41% in Kitchener.
Rarely or never feels lonely Strong sense of
2021-2024. Source: Statistics Canada Canadian Social Survey. Note: Statistics Canada did not release data for the townships. Additional details available in the endnotes.28 Waterloo refers to the City of Waterloo here.
Sense of belonging is a problem for Kitchener and Cambridge, scoring 7 percentage points lower than Canada at 40% (vs 47% nationally). On the other hand, it’s a strength for the City of Waterloo where 53% report a strong sense of belonging.
Wellbeing in the townships: a strength with one exception
The Canadian Social Survey doesn’t break out the townships, but the 2022 Canadian Index of Wellbeing (CIW) survey for Waterloo Region does – and shows that all four report higher wellbeing than the region’s cities. Wellesley, in particular, stands out with the highest average scores for both life satisfaction and sense of belonging.
However, there is one exception: North Dumfries, which shows opportunities in the level of belonging reported. While its life satisfaction remains above the regional average, its sense of belonging (4.6) falls below the region overall (4.8), though the difference would not be statistically significant.
Sense of belonging by municipality
By demographics
Low life satisfaction and poor sense of belonging are concentrated among younger residents. The oldest residents are twice as likely to have a strong sense of belonging than the youngest (74% versus 36%) and are 25% more likely to have high life satisfaction.
Belonging and Life Satisfaction,
Belonging and Life Satisfaction,
High
The influx of younger residents is likely playing a critical role in declining wellbeing outcomes for Waterloo Region
Those under age 45 in Waterloo Region report significantly lower neighbourhood satisfaction than their peers across Canada, driven particularly by those under the age of 30, while older residents show no such gap, though sample sizes are small.33 Since neighbourhood satisfaction is closely linked to sense of belonging, this suggests that younger residents are experiencing more disconnection from the places they live in Waterloo Region. Given the significant growth in this demographic that we discussed earlier, this may be a side effect of the region’s rapid population increase in this age category.
Immigrants are faring better in Waterloo Region than elsewhere. In Waterloo Region, immigrant-led households reported higher life satisfaction and belonging than immigrant households nationally, in the 2021 Canadian Housing Survey.34 The opposite was true for Canadian-born residents, who scored lower than their national peers. Racialized households also reported higher scores locally than elsewhere in Canada, while non-racialized scores were lower.
Income plays a key role. The entire gap in life satisfaction and neighbourhood satisfaction compared to the national average comes from households in the bottom half of the income distribution in the 2021 Canadian Housing Survey data.35 For higher-income households, scores in Waterloo Region were in line with the rest of Canada.
Renters are particularly vulnerable. As WRCF highlighted in their 2023 Vital Signs® report, renters in Waterloo Region reported much lower levels of neighbourhood satisfaction and sense of belonging than renters elsewhere in the country. With much of the region’s new housing supply concentrated in condo developments owned by investors who rent them, these findings point to a need for stronger supports and more intentional social infrastructure in rental-heavy neighbourhoods.
Thriving Together: The Critical Role of Social Infrastructure
How do we improve life satisfaction? How do we help people feel more connected? One of the most important answers is also one of the most local: social infrastructure.
Social infrastructure includes the places and spaces – both formal and informal – that support connection, belonging, inclusion, and trust. This includes libraries, parks, community centres, recreation facilities, and the programs and relationships that bring them to life. It’s not just where people go – it’s where people connect.
WRCF’s 2024 On the Table report showed a clear consensus: residents want more social infrastructure.36 Across conversations with more than 1,300 community members, people called for more welcoming spaces, easier ability to find information about what’s going on, more access to and spaces in low-cost programs, and more opportunities to build relationships in their neighbourhoods. Many said they simply didn’t know what was available or where to go and others pointed to long waitlists, inaccessible facilities, or a lack of trusted, nearby options.
Having a physical space suitable/large enough for neighbourhood programs and events would draw more people in and would increase relationship building opportunities. Relationships are the key to building social infrastructure.
Participant at Fiddlesticks Community Centre
2024 On the Table conversation We heard from our township residents that social infrastructure is more than just buildings; it is about creating places where people can connect, share and truly belong. Barriers like transportation and limited program spaces often prevent full participation. By recognizing these challenges, we can work together as a community to bring vital resources to our rural agencies, helping them create welcoming spaces where our communities can come together and build a sense of belonging.
Used none of the social infrastructure 1 used 2 used 3 used All 4 social infrastructure types used at least Wellbeing and social connection scores by social infrastructure usage frequency (%)
Chart Title Used
People who use social infrastructure most frequently are more connected and have better wellbeing
Volunteered past 12 months Have poor/fair mental health More than 5 close friends Strong/somewhat strong sense of belonging Know many/most of your neighbours satisfaction (7+
Volunteered past 12 months Have poor/fair mental health More than 5 close friends Strong/somewhat strong sense of belonging Know many/most of your neighbours Higher life satisfaction (7+ out of 10)
City of Toronto, adults 18+, 2022. Source: Toronto Social Capital Study. Notes: Respondents were asked how frequently they used four types of social infrastructure in the last six months: 1) outdoor parks; 2) a gym, fitness, or recreational centre; 3)
scope of this report. Image adapted from: Toronto Foundation’s The Power of Us Report.
Canadian data supports a link between participation and wellbeing. The 2022 Toronto Social CapitalG Survey found that people who engage most frequently in community activities report significantly higher levels of life satisfaction, sense of belonging, trust, and neighbourly connection.37 These positive outcomes remain even after controlling for factors like age, income, and gender. For example, 73% of frequent participants reported high life satisfaction compared to just 51% of less engaged individuals. Similarly, 90% reported a strong or somewhat strong sense of belonging, versus 57% among those less involved. These highly engaged individuals also tend to volunteer more, have more friends, and know more of their neighbours. In short, people who regularly use social infrastructure are deeply embedded in their communities and benefit from broader social networks – especially in their neighbourhoods.
This isn’t just correlation – some of the differences are causation. Academic studies using randomized controlled trialsG (RCTs) show that interventions – like group programs, community classes, or volunteer opportunities – actually increase wellbeing and are not just things that people with higher wellbeing do more of.
Exercise-based group programs show consistent benefits. A recent meta-analysis found that RCTs involving group-based exercise – often held in community settings – had effects on wellbeing comparable to therapy.38 Previous reviews note that the more social components, the higher the likelihood that exercise will improve wellbeing, with exercise classes where principles of social cohesion are embedded having the great impact on wellbeing.39
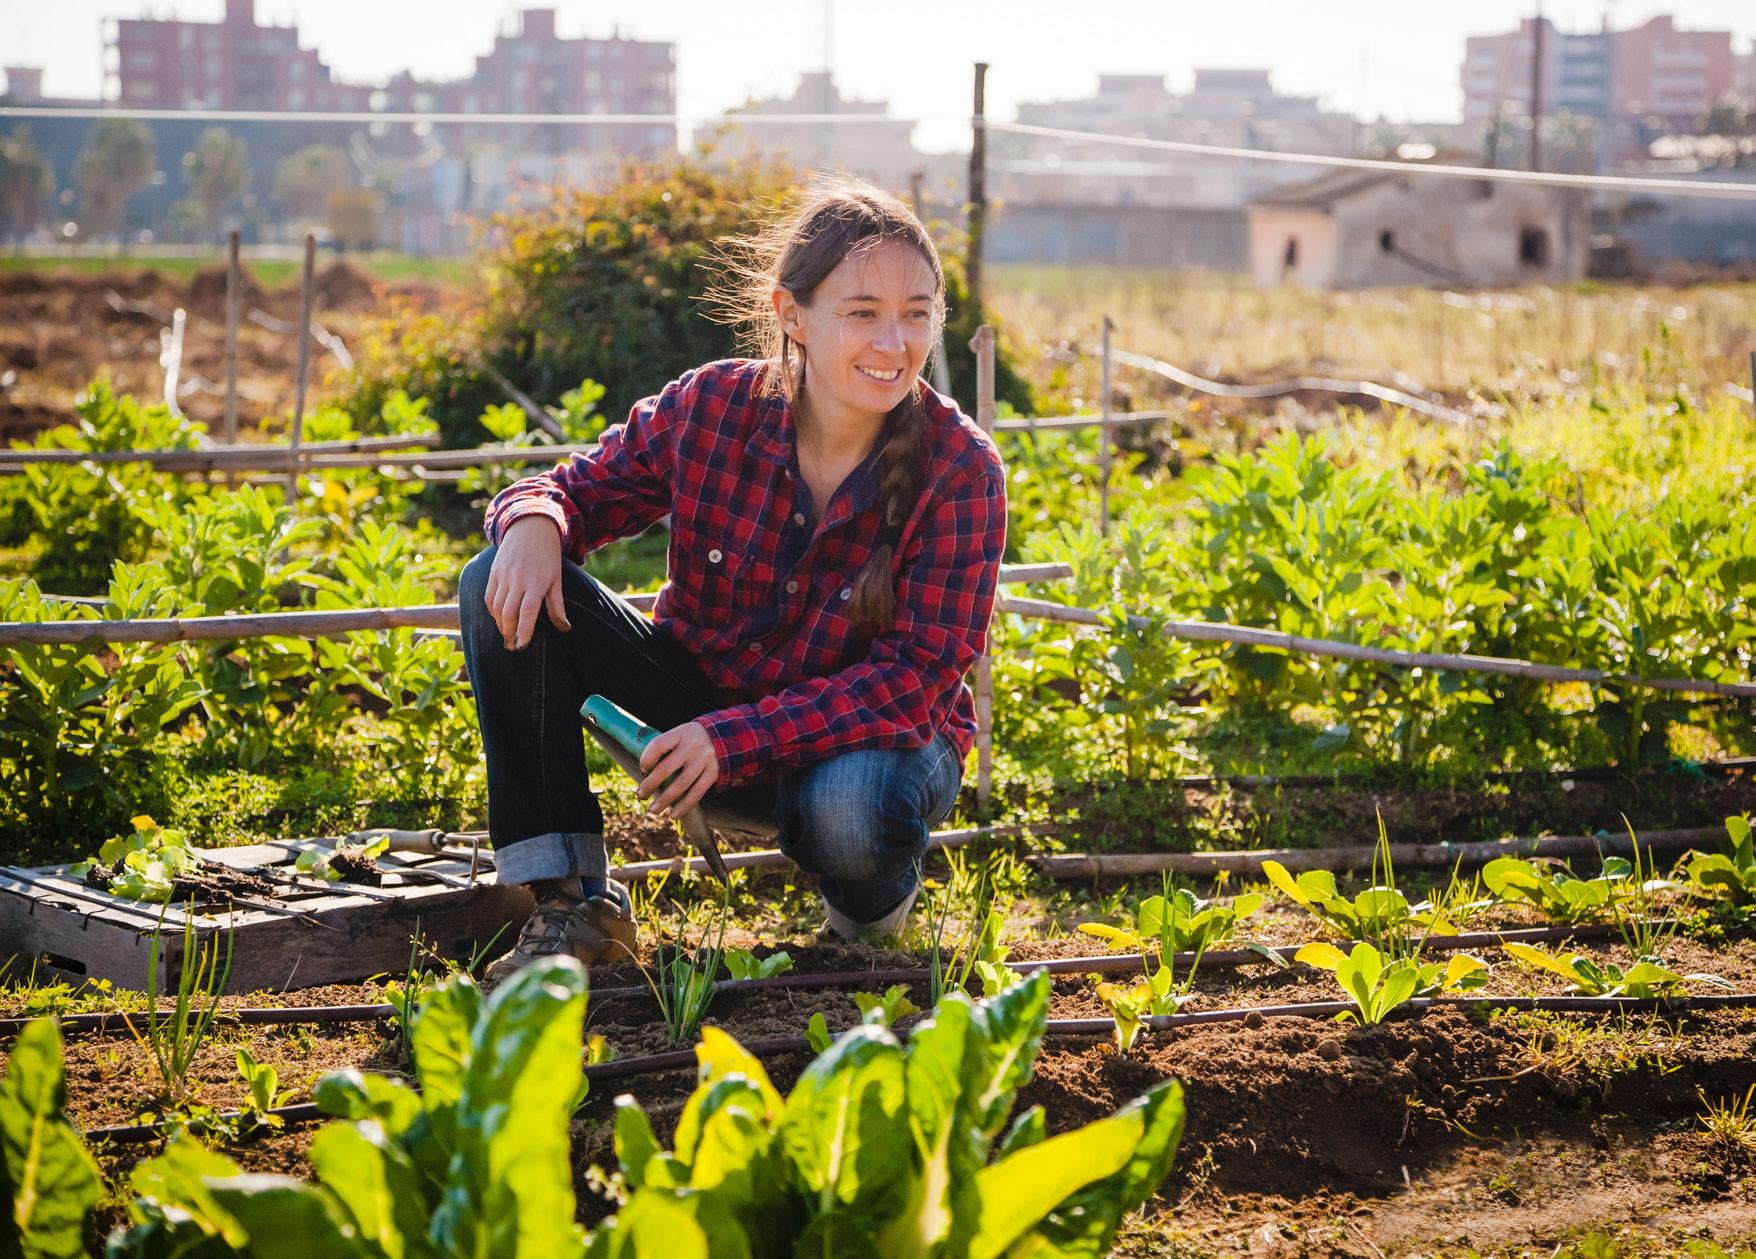
Similarly, an RCT evaluating “park prescriptions” (invitations to attend weekly group exercise classes in parks) found significant improvements in quality of life for participants.40 This is part of a broader set of evidence that social prescriptions, or encouraging people using the health care system to participate in a wide array of community activities, can lead to improvements in health outcomes through increasing people’s social connectedness.41 Another study reviewing dozens of studies on gardening showed that just spending time in gardens or participating in gardening can likewise improve health and wellbeing.42
Interventions can increase belonging, but only when there are opportunities to participate. An RCT of a 30-minute belonging intervention delivered to first-year students at 22 universities had measurable impacts on student retention and persistence – but only when students encountered real opportunities for belonging on campus, according to research presented in the journal Science. 43 The intervention was most effective at supporting those from the most at-risk groups. The message: small nudges can be powerful, but only if they land in an environment where belonging is possible.
Volunteering can help improve wellbeing – but it is most important that there is deeper engagement. Evidence for benefits of volunteering has also mounted. For example, a randomized trial with older adults found it could improve depressive symptoms. However, only those who had increased their volunteering during the first three months of a structured program saw improvements in depressive symptoms at six months.44 A mega-study with more than 250,000 respondents in 22 countries over many years reported in the European Journal of Aging noted particularly that increased volunteering was associated with improved physical health and that the health impacts of volunteering are greatest for those in the worst health.45
Many of the challenges facing Waterloo Region are not unique –but the need to solve them here is urgent. Rapid growth, limited transit in some areas, and long-standing gaps in neighbourhoodlevel amenities make this an especially important region for social infrastructure investment.
To boost wellbeing, participation needs to be regular. Mental Health Research Canada national data highlights a striking gap: 60% of people who participate in civic, community, or social service groups weekly say group participation strongly improves their wellbeing – compared to just 34% of those who participate monthly (see chart for notes). Even those involved a few times a month (53%) report far greater benefits than monthly participants.
Neighbourhood-level infrastructure is key. As multiple datasets show, the more often people go to community places, the better they feel – especially when those spaces are close to home are high-quality enough to justify the trip. This is particularly critical for those without access to regular public transit or cars.
The takeaway is clear: the wellbeing benefits of participation are tied to frequency. And in our view, that kind of regular engagement is only possible when opportunities are local – easy to get to and connected to people you see in everyday life.
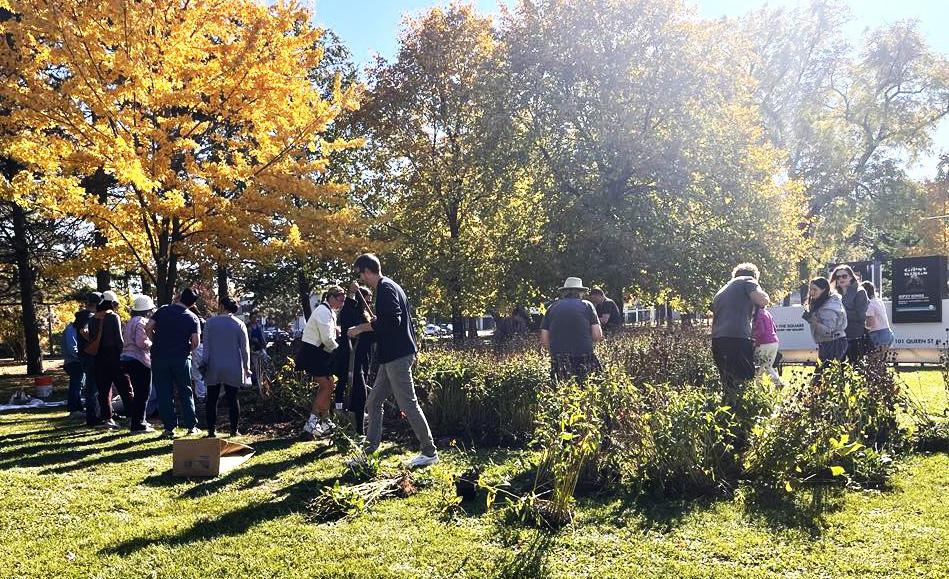
When neighbours come together to create something rooted in place, like Vera’s sensory garden and willow
sculpture,
% Strongly Agreeing That Group Participation Improves Their Wellbeing, by Frequency of Participation in Civic and Community Activities
they’re not
just building
Percent strongly agreeing that group participation improves their wellbeing, by frequency of in-person participation in civic and community activities
least
2025. Canada. Source: Mental Health Research Canada, Poll 23 (Spring 2025). Analysis by author and does not necessarily reflect the views of Mental Health Research Canada. Note: The survey also asked about other forms of in-person and online group participation that are almost certainly also contributing to people’s perception that participation in groups is improving their wellbeing but a full analysis is beyond the scope of this report.
a space, they’re building community. These local, hands-on projects connect people to each other and to nature, offering lasting moments of beauty, belonging, and shared purpose that help sustain relationships and strengthen the neighbourhood as a whole.
Josh Joseph
Manager, Neighbourhood Development Office,
City of Kitchener
Across Waterloo Region, many of the spaces and experiences that once connected us are under strain or disappearing altogether. However, within these challenges lies an opportunity to renew, reimagine, and rebuild the social infrastructure that can help our communities thrive.
Eric
Avner, WRCF President & CEO
A Region Reconnecting: Reinvigorating
the Social Infrastructure That Holds Us Together
Strengthening Roots: Reclaiming Our Shared Spaces Together
As we highlight in the previous section Thriving Together: The Critical Role of Social Infrastructure, social infrastructure can play a key role in reversing declines in wellbeing.
Throughout this section, we will document a number of declines in social infrastructure in Waterloo Region. Much of the data available for Waterloo Region usage of social infrastructure that we explore in this section only extends to 2022 or 2023 – leaving a gap between the most recent local figures and the current moment.
As we publish this report in 2025, national data shows that many of the challenges we highlight – declines in community participation, volunteering, and physical activity – have not meaningfully improved across Canada. The data also showcases how many of these problems are not unique to Waterloo Region, but they may be particularly pronounced here.
As of 2024, 58% of Canadians reported not being involved in any social or community groups – a sharp increase from just 37% in 2013, and unchanged from 2022.46 Throughout this section, we talk about similar declines around the region for many types of participation. This national persistence in disconnection gives a hint that many people in Waterloo Region have also not returned to pre-pandemic levels of engagement even if our data is sometimes slightly older in this report.
Rates of formal volunteeringG have also declined steadily nationally, dropping from 44% in 2013 to 32% in 2023, with the total number of volunteer hours falling by 28% between 2018 and 2023.47 As we discuss in our upcoming section on volunteering, participation in volunteering has dropped by 11 percentage points locally as well. Other national research found volunteering slightly trending up by 3 percentage points in 2024 versus 2022,48 but not at a statistically significant level.
Ongoing declines are also evident in other forms of civic participation. Between 2018 and 2023,49 the percentage of Canadians who reported sharing community information dropped from 98% to 80%, coordinating an event or group fell from 80% to 53%, and attending a public meeting declined from 34% to just 20%. These activities reflect important social infrastructure that connects people to their neighbours and communities – and they are weakening.
Interestingly, directly helping people has held much steadier throughout the pandemic and beyond. This decrease was due mainly to a decline in the number of volunteers who participated in improving the community (-19%). Compared with 2018, this number fell more sharply than the number of volunteers who helped others directly (-3%).50
Within the region, the data reveals a challenging yet opportunity-rich landscape for social infrastructure. Across culture, sport, learning, and civic participation, many residents are using social infrastructure less than before. Meanwhile, the fastest-growing segments of the population are often the least well-served by existing infrastructure – highlighting the urgent need to keep pace with rapid change. Some municipalities are demonstrating resilience, but others continue to lag behind their peers. This section reflects a region at a pivotal moment – with meaningful assets to build upon, but also unmistakable signs that strengthening belonging alongside social infrastructure demands more than well-meaning efforts.
With Waterloo Region projected to grow by over 300,000 people in the next 25 years, current infrastructure and services are not equipped for this transformative expansion. The Vision 1 Million Scorecard includes increasing Waterloo Region’s social infrastructure as one of the core initiatives in the focus area of placemaking and liveability, because there is a strong recognition that we need to ensure that our growth brings residents together and supports unique perspectives, new experiences, and identity.
Ian McLean President & CEO, Greater Kitchener
Waterloo Chamber of Commerce and Chair, BestWR
Wandering: Parks and Trails for Rest and Play
Parks, playgrounds, and trails are some of the most widely used elements of social infrastructure in Waterloo Region – but there’s still a lot we don’t know about how well they’re working. In this section, we look at what the data tells us about access and usage, where the biggest gaps are, and who may be left out. We also highlight the region’s unique strengths: a strong foundation of green space, a culture of use, and growing momentum to make these spaces more inclusive, connected, and meaningful for all residents.
Parks, playgrounds, and trails hold a unique place in our social infrastructure: they are used – at least occasionally – by nearly everyone. Critically, they became even more important during the pandemic. In 2022, 92% of residents reported using these spaces at least some of the time.51 Regular usage has also increased significantly, with 67% saying they used them often in 2022, up from 60% in 2018, according to surveys of around 5000 Waterloo Region residents in each year by researchers as part of the Canadian Index of Wellbeing.52 In the 2022 survey, 88% of people agreed that there is a local park nearby that is easy for them to get to, and only 7% disagreed.
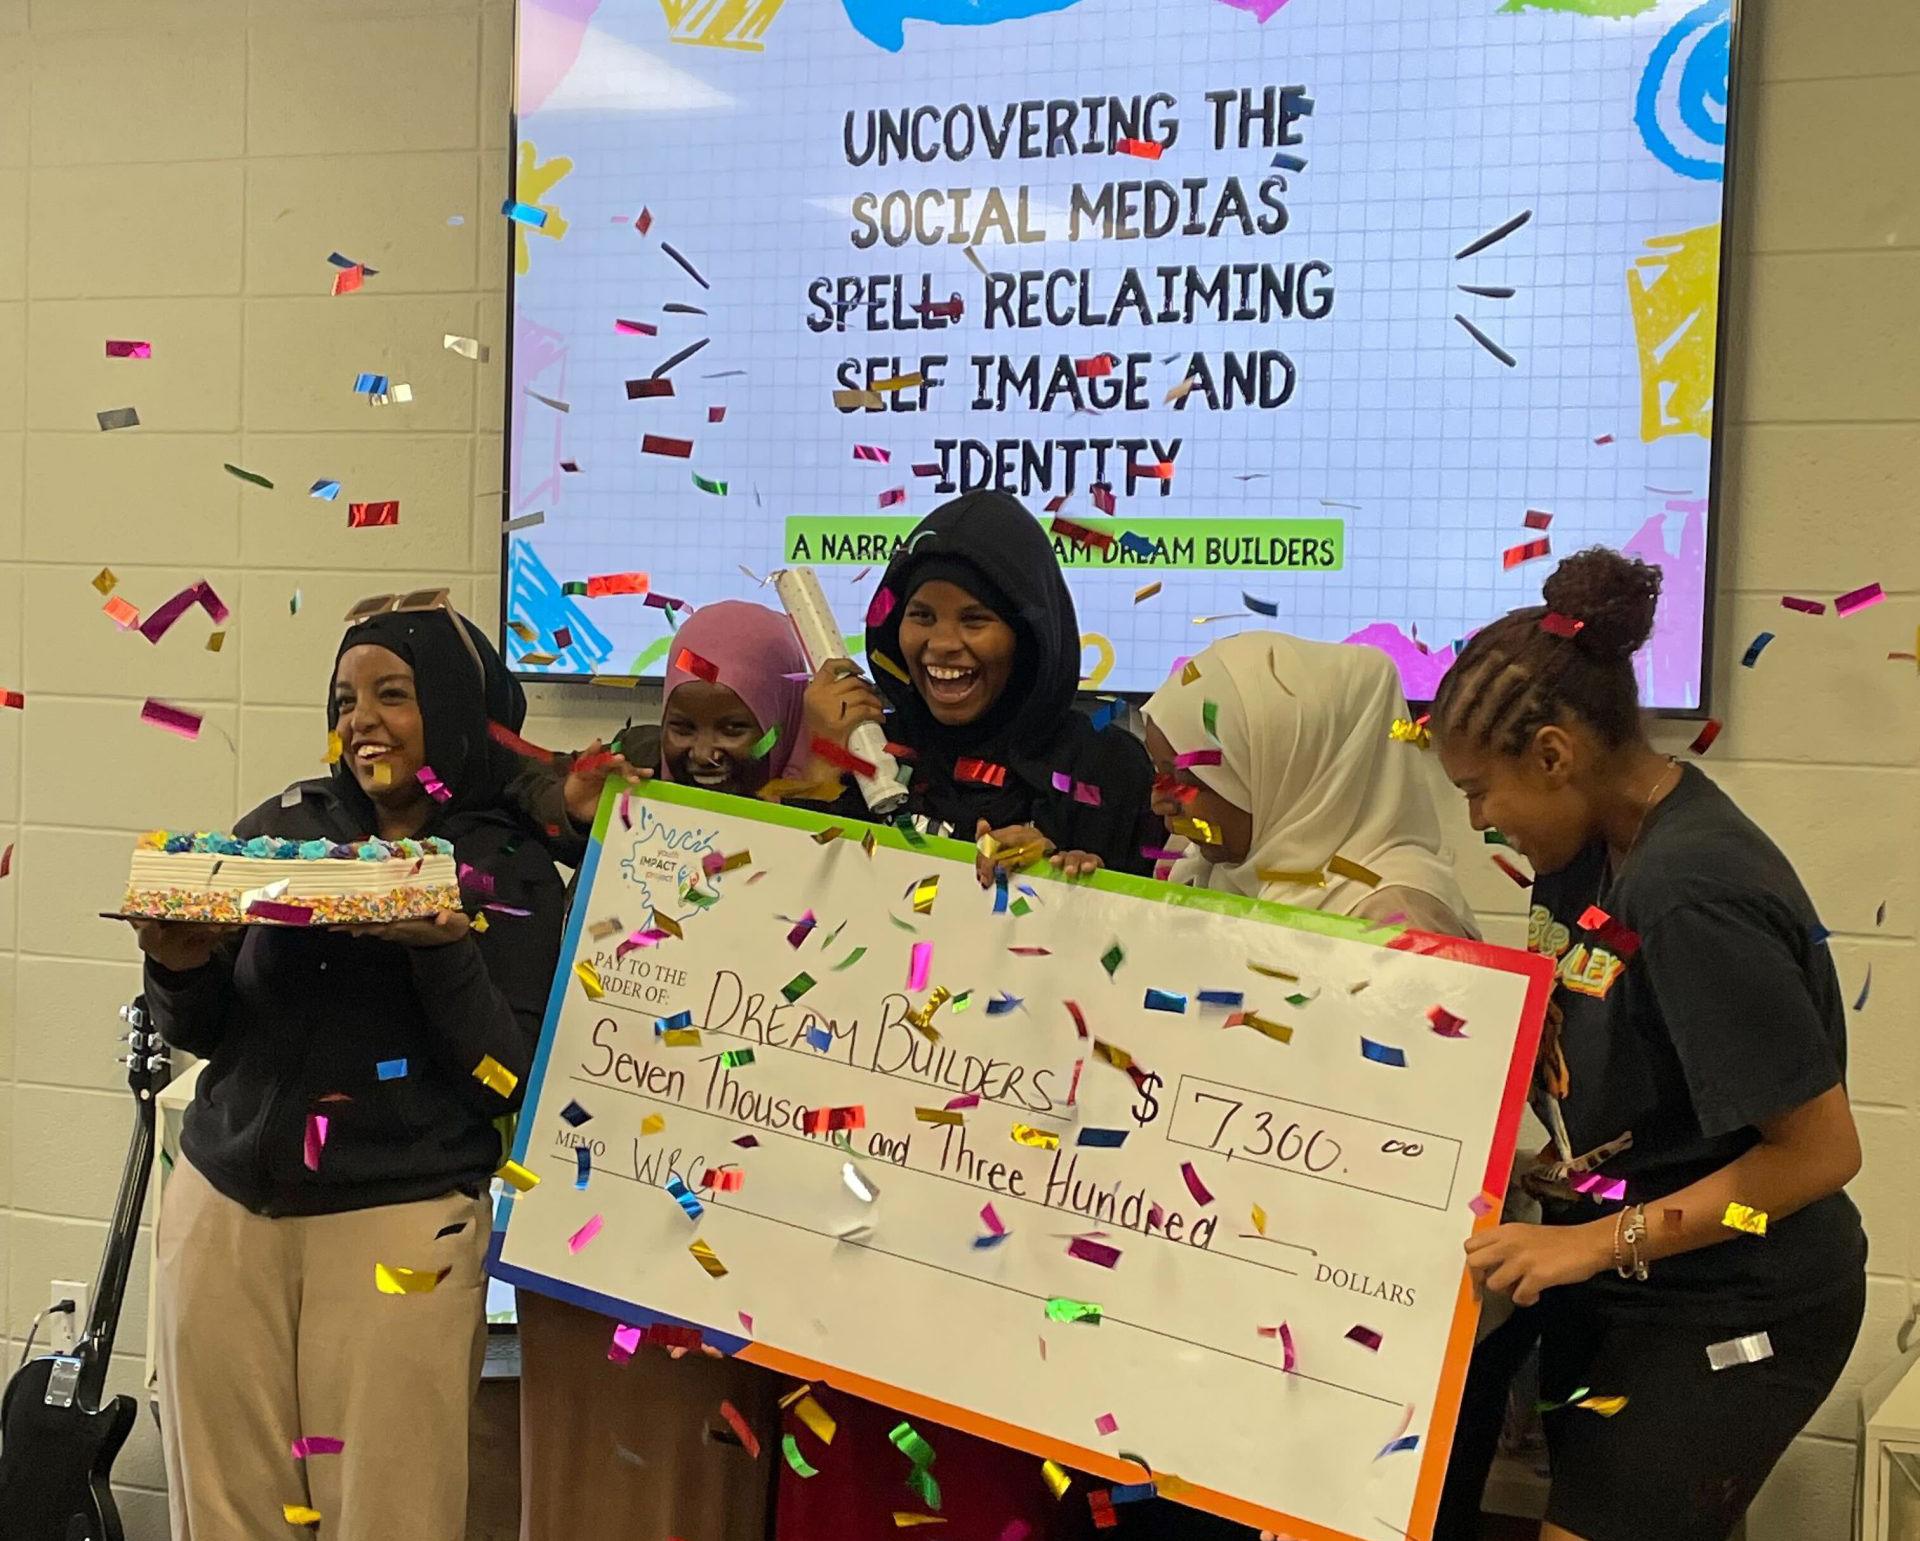
A 2023 Youth Impact Survey of children and youth in
Waterloo Region found similar results. Only 9% identified lack of access to parks as a barrier to recreation.53 However, the survey did not ask whether they viewed local parks as offering meaningful recreational opportunities.
Parks and trails are everywhere – but are hard to count.54 For example, the City of Kitchener reports more than 125 km of trails, the City of Waterloo highlights over 325 parks and green spaces and more than 12 trails,55 and Wilmot Township notes more than 218 acres of parkland56 and 58 km of trails. But with each municipality tracking and reporting differently, it’s difficult to piece together a full regional picture. However it’s measured, most residents feel like they live near a park or trail. Usage data shows these are among the most widely accessed parts of our social infrastructure.
We know how often people use parks – but not much about what makes them worth using. Surveys from 2018 and 2022 ask how often residents use parks, trails, and playgrounds, but they don’t dig into what those spaces actually offer. We still lack region-wide data on park features, quality, programming, or accessibility – key factors that determine whether a park truly supports wellbeing and connection. Still, across the region, most of our local municipalities have revised park plans developed after the pandemic, a huge opportunity to build on (see below for more details).
We know that how parks are designed matters57 – a well-executed renovation can double usage and significantly boost physical activity levels as too can outreach and community engagement.58 A randomized controlled trial of park improvements found that even modest investments of $4000 per park, paired with community feedback opportunities and local outreach, can also significantly boost park usage.59 Other research suggests that only parks of sufficient quality and size significantly increase wellbeing of people in urban settings.60 Yet despite the importance of factors like these, standardized data on these kinds of park-level details remains scarce and difficult to access.
All of Waterloo Region’s cities and townships have updated parks plans since 2022, with one exception being the City of Waterloo with a plan in the works. The townships’ plans are part of larger recreation master plans. This indicates the importance of parks as part of the region’s overall infrastructure, and an opportunity to collaborate when/if it makes sense on initiatives to identify gaps in what is provided to residents.
Percent that agree there is a park nearby that is easy to get to, by age, 2018
59% of people aged 30 to 39 strongly agreed there was a park nearby that was easy to get to compared to only 35% of those 75 and older
Strongly agree Agree
Strongly agree Agree
Links to all the plans are shared below:
Source: Canadian Index of Wellbeing: 2018 Waterloo Region Survey.61
Access to parks isn’t equal – and that shapes who benefits from them. Pre-pandemic data from a 2018 survey of Waterloo Region residents (CIW) shows that across most age groups, 80% to 90% of respondents agreed there was a park nearby and easy to get to. However, fewer felt that strongly. Strikingly, only 35% of adults aged 75 and older strongly agreed, compared to 59% of those aged 30 to 39 – the highest among all age groups. This may reflect mobility challenges rather than the actual presence of parks and highlights an opportunity to support more older adults in accessing them.
Access to parks is shaped by broader issues of equity – especially transportation and systemic barriers. People who rely on public transit were less likely to report easy access to parks, underscoring the importance of transportation infrastructure. Similarly, racialized respondents were 10 percentage points less likely than white respondents to say there was a park nearby that was easy to get to.
Percent that agree there is a park nearby that is easy to get to, by ethnic origin
Racialized or Indigenous background
Source: Canadian Index of Wellbeing: 2018 Waterloo Region Survey.63 Note: Respondents were asked their ethnic origin and in this chart were categorized as Canadian/European (e.g., English, French, German, “Canadian”, etc.) or Racialized or Indigenous (e.g., First Nations, East Indian, Chinese, African, or Caribbean, “other” origins).
Improving access to parks across the region
Proximity to parks is nearly universal across Waterloo Region, with at least 85% of residents in every municipality agreeing there is a park nearby that is easy to get to, in a 2022 survey. Woolwich leads the region at 92%, while North Dumfries is slightly lower at 85%.64 Overall, 88% of residents report having accessible parks close to home.
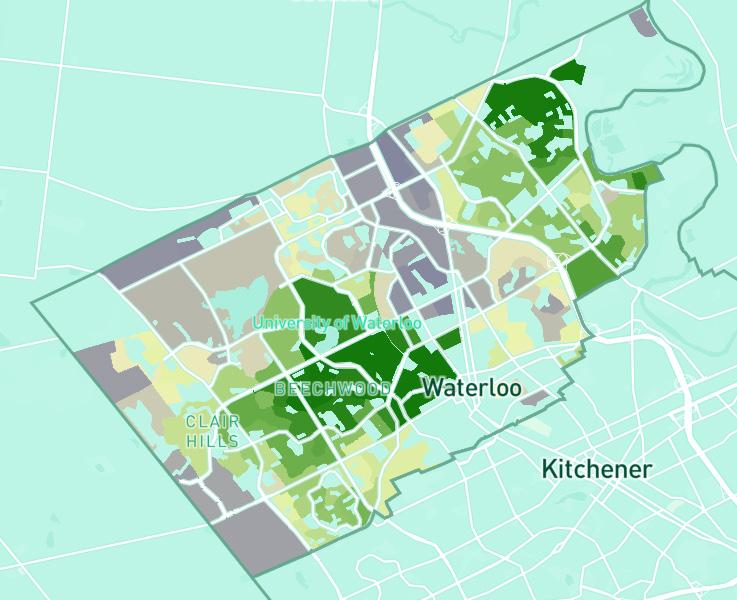
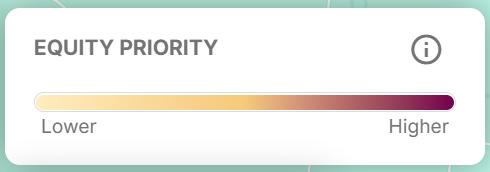
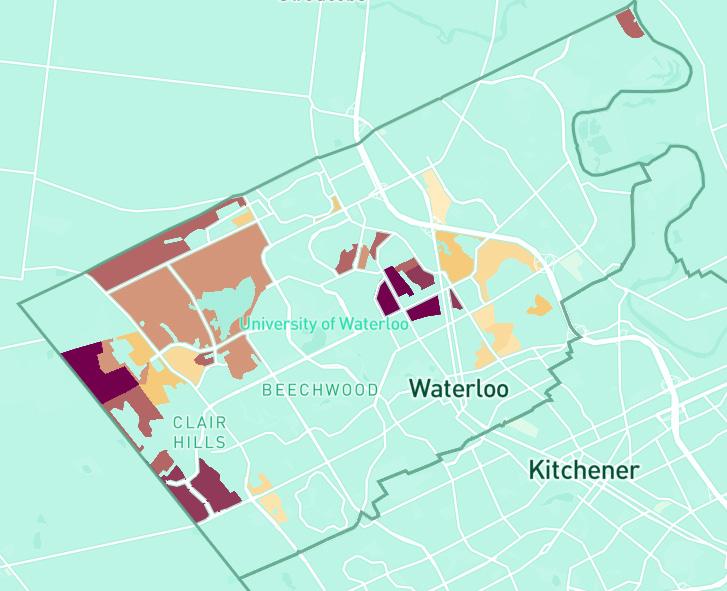
To learn whether there were areas of the city that could use more park investment, we used HealthyPlan.City. This website, developed by CANUE (the Canadian Urban Environmental Health Research Consortium), is an interactive mapping tool that identifies where environmental inequities may exist across Canadian cities. It combines demographic data – such as race, age, income, and newcomer status – with indicators of the built environment, including park access, to pinpoint areas where equity-focused investments could have the greatest impact. This tool only has data for Cambridge, Kitchener, and Waterloo. While the maps highlight potential gaps in access, they do not reflect population density or feasibility constraints, and should be viewed as a starting point for more detailed planning.
According to HealthyPlan.City:65
• In Waterloo, 49% of visible minority residents (20,800 people) live in areas identified as having equity-based park access gaps. The city ranks 11th out of 25 comparably sized municipalities (a higher score reflects more inequities). Specific neighbourhood-level data was not available (however, see maps below for additional details).
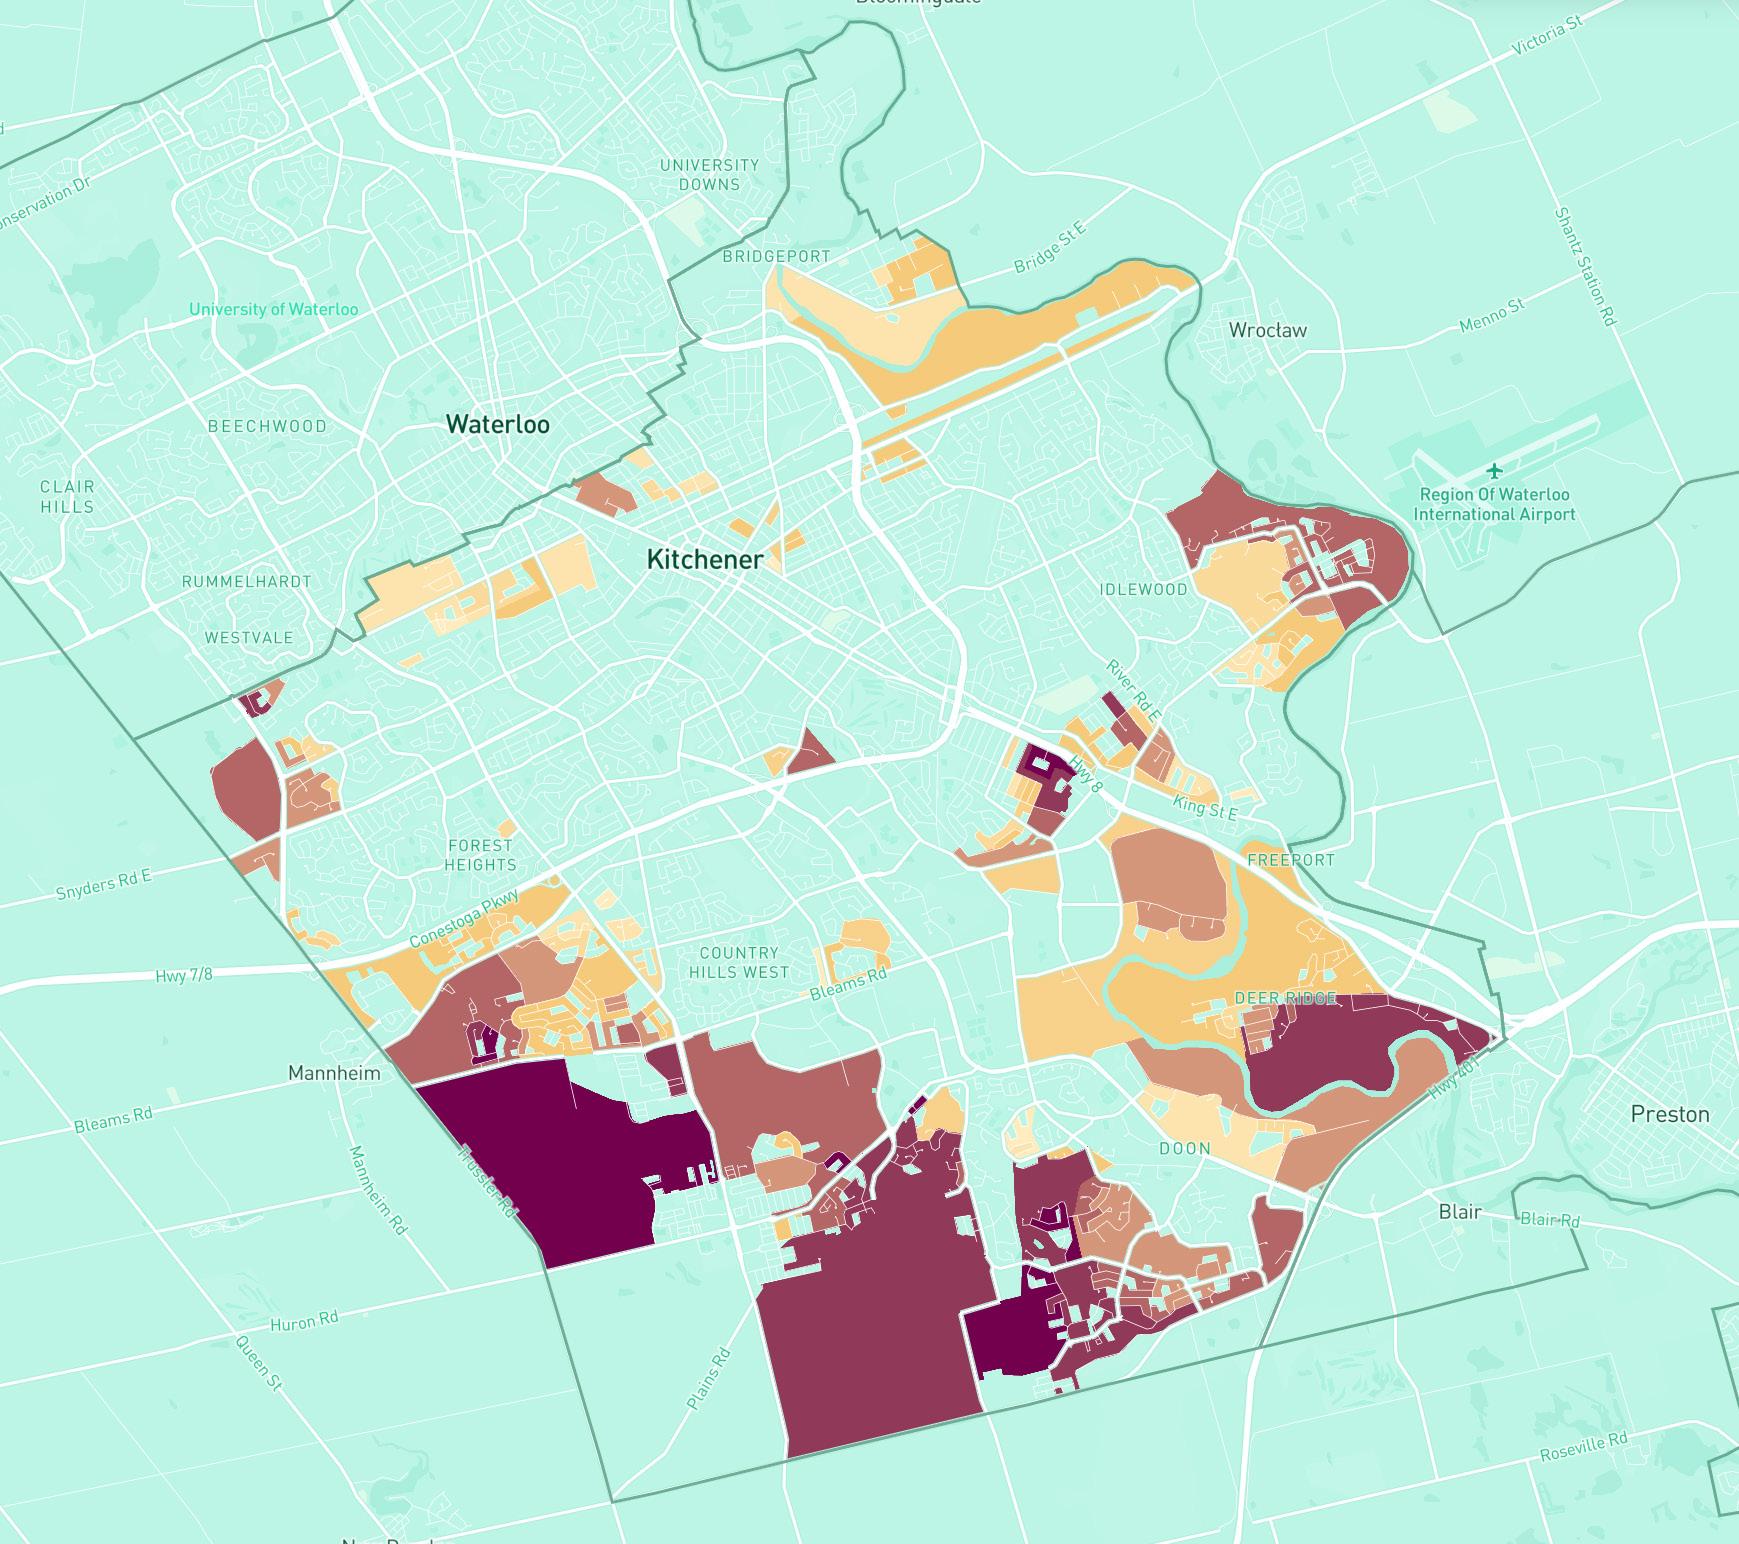
• In Kitchener, 54% of visible minority residents (over 43,000 people) live in areas where targeted investment in parks could advance racial equity. Among similarly sized Canadian cities, Kitchener ranks 11th out of 15 for need. Ward 5 stands out as the city’s highest priority neighbourhood for improving access to quality green space with Ward 4 close behind and Ward 2 slightly behind that.
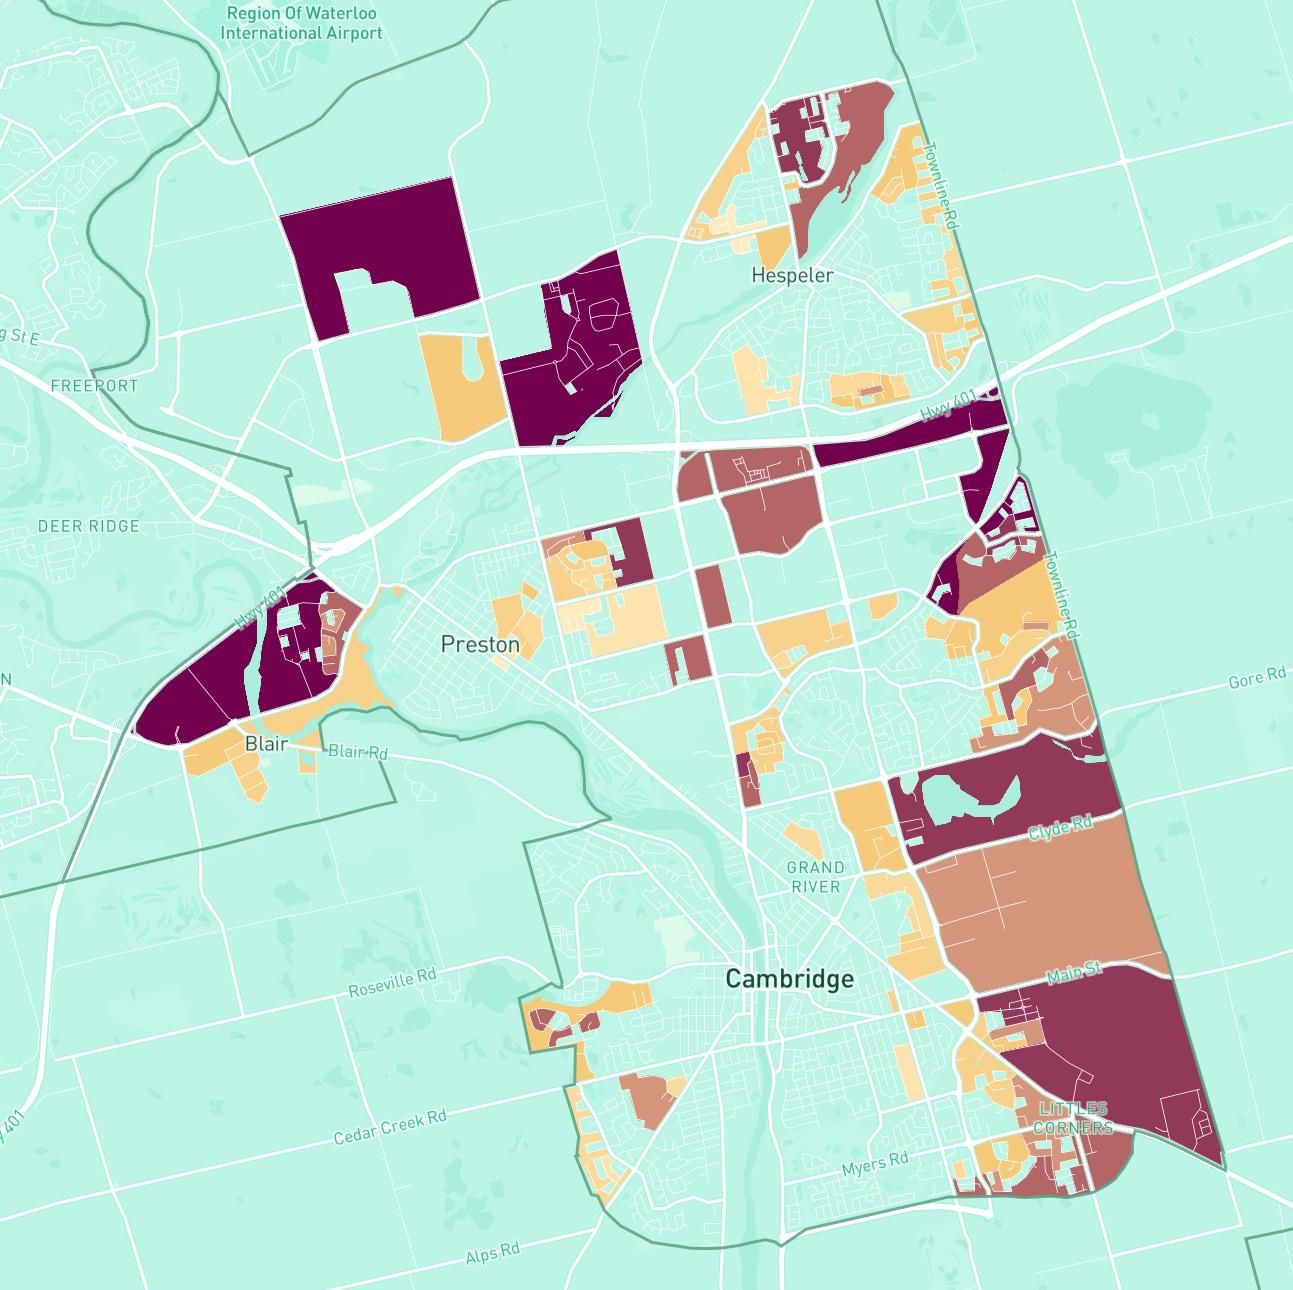
• In Cambridge, the need is even more pronounced. 67% of visible minority residents (21,900 people) live in areas where park investments could improve equity. Cambridge ranks last – 25th out of 25 – among similarly sized cities for equitable park access. The Shade’s Mills neighbourhood had great opportunities for investment to reduce inequality, according to their data.
Importantly, similar patterns of opportunity for increasing equity emerged when we looked at the same maps and data for newcomers, children, and low-income residents (not shown), underscoring shared geography and systemic disparities.
Source: Canadian Index of Wellbeing: 2022 Waterloo Region Survey.66,67
Green space is more than scenery. It supports physical activity, mental health, and social healing. For families experiencing displacement, migration stress, or racial exclusion, parks can offer sanctuary. When access is limited, these opportunities are diminished, deepening cycles of stress, inactivity, and isolation.
Read more from Oluseun in a blog she wrote about access to public spaces and social infrastructure. Where We Gather: Building Community Through Shared Spaces can be found at wrcf.ca/news/ where-we-gather-2025.
Cambridge Kitchener Waterloo North Dumfries Wellesley Wilmot Woolwich Region Overall
Percent that agree there is a park nearby that is easy to get to, by municipality
Opportunities to increase access to parks
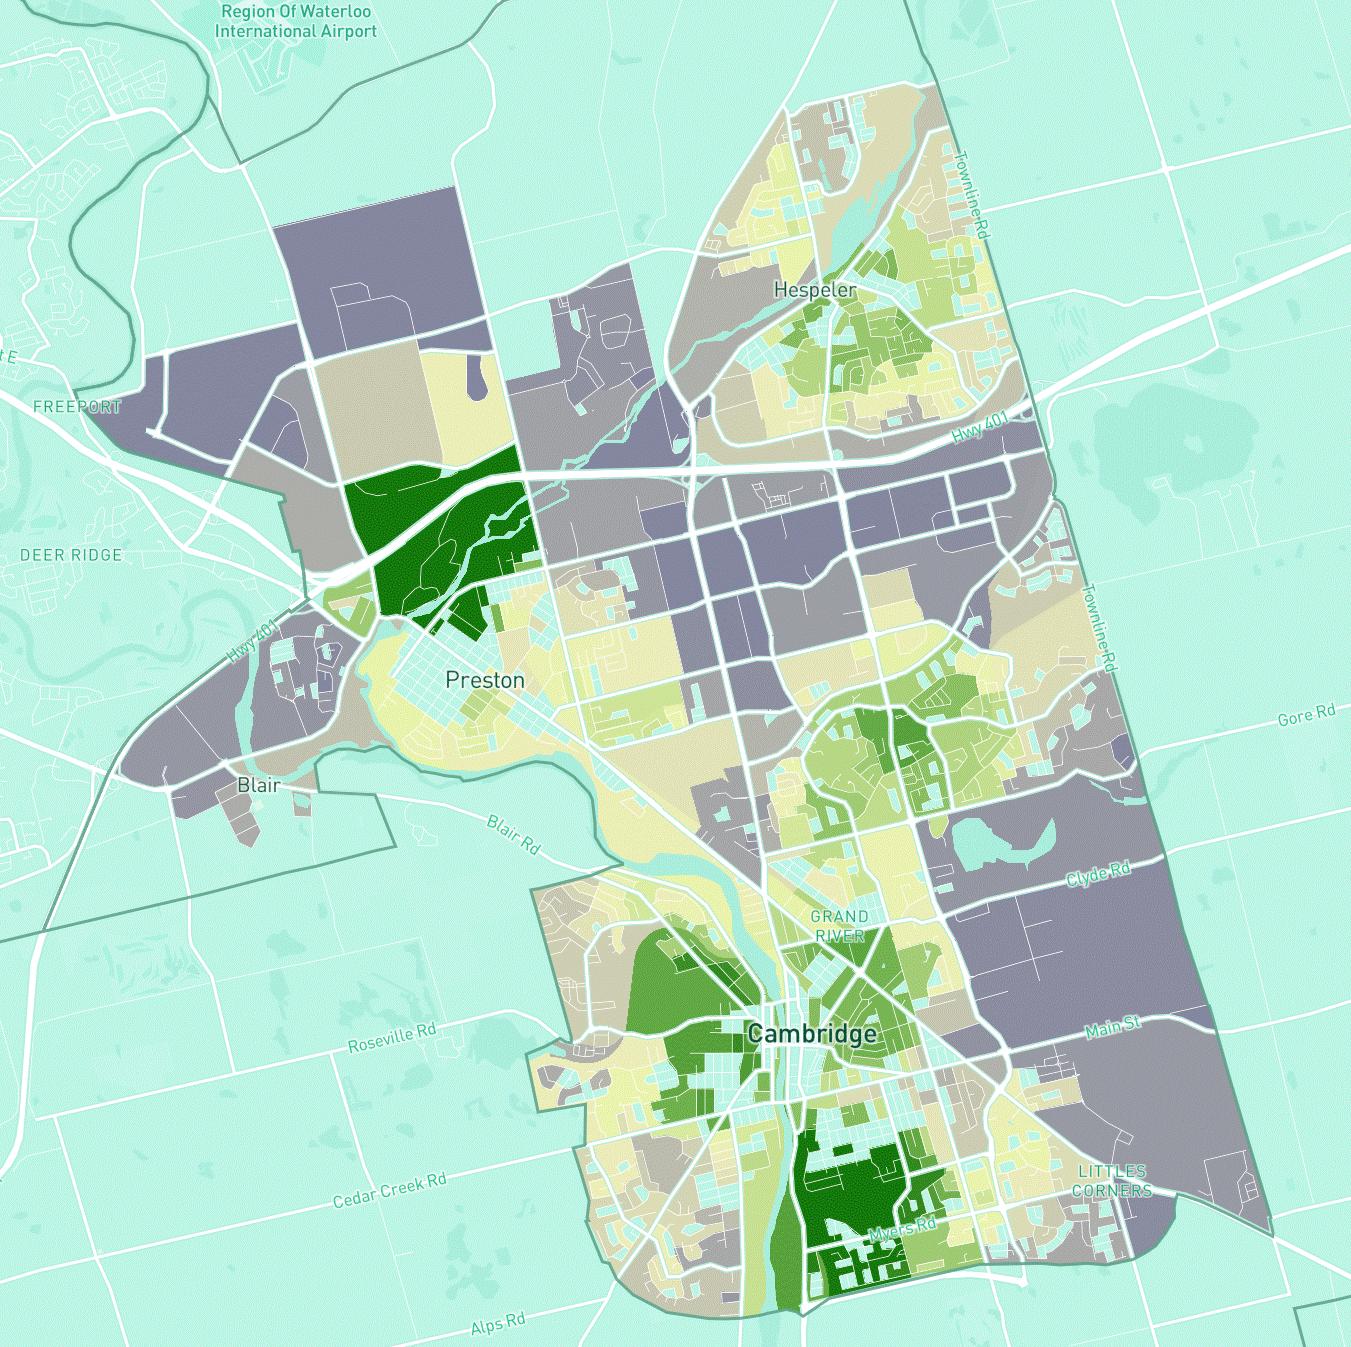
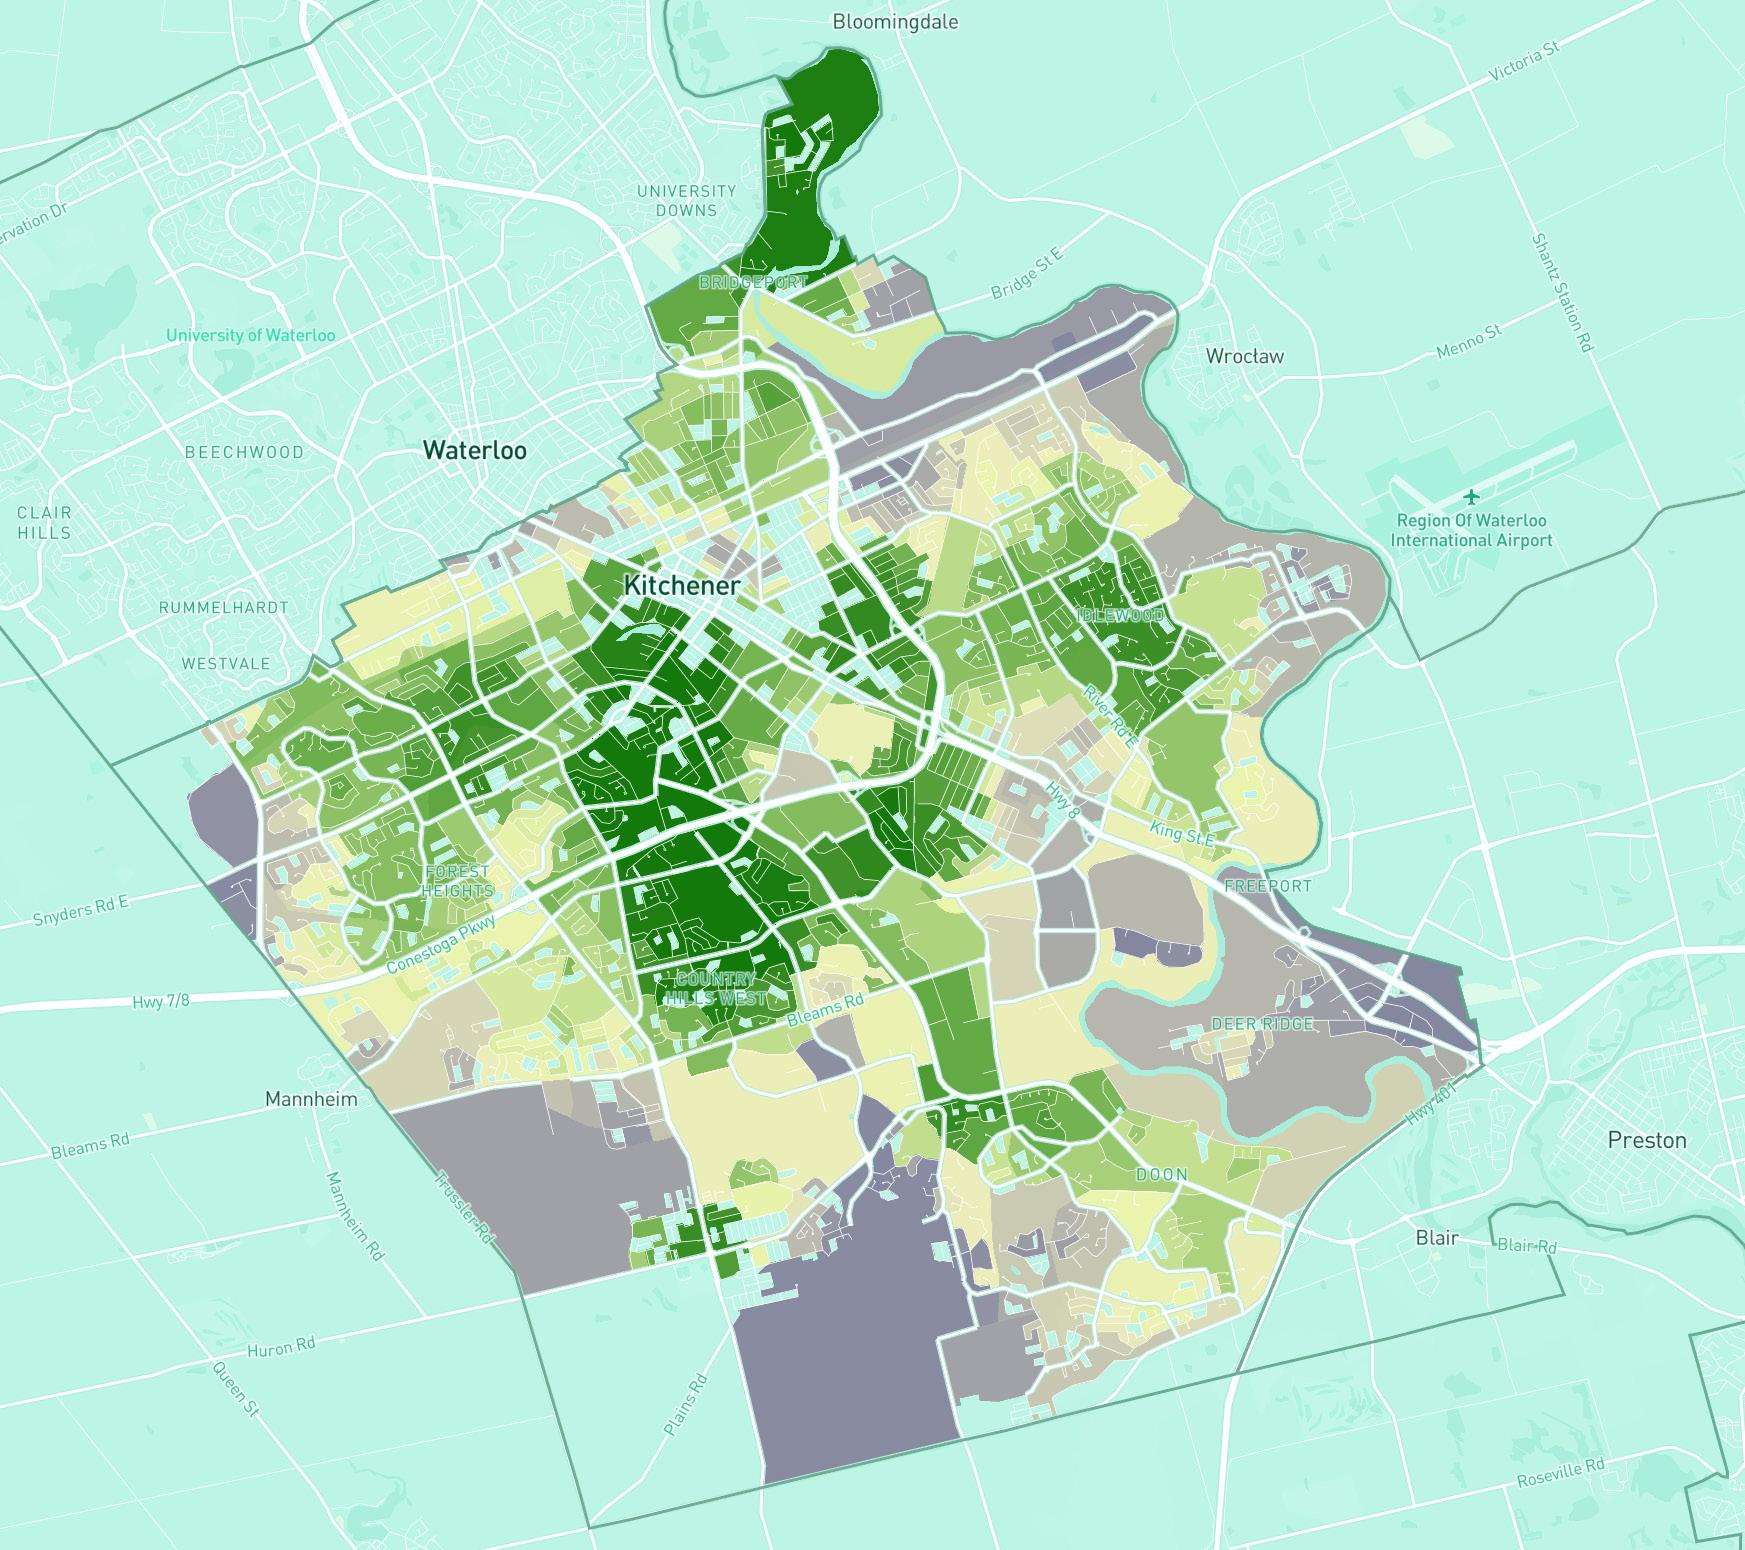
Number of parks within local municipalities
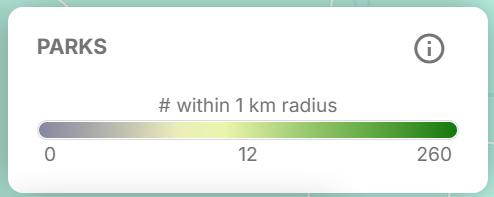
Source: HealthyPlan.City. Note: Parks refers to the density of community gardens, neighbourhood parks, and large parks within a 1 km radius, based on OpenStreetMap data from November 2022.
CAMBRIDGE
KITCHENER
WATERLOO
Priority areas for park investment to advance racial equity
CAMBRIDGE
KITCHENER
WATERLOO
Source: HealthyPlan.City. Note: Parks refers to the density of community gardens, neighbourhood parks, and large parks within a 1 km radius, based on OpenStreetMap data from November 2022.
Experiencing: Belonging Through
Sport, Recreation, Art, and Culture
Sport and recreation
Participation in community centres has dropped sharply –both in frequency and intensity – since the pandemic, raising concerns about the long-term impacts on wellbeing. In 2018, 63% of residents across Waterloo Region reported using community complexes or recreation centres. By 2022, that number had fallen to just 51%. The decline isn’t only about fewer people attending – it also reflects a reduction in how often even regular users participate, which compounds the challenges. Meanwhile, outdoor facilities like sports fields held steadier (from 38% to 36%) or sometimes even slightly increased in use, like in the case of outdoor skating rinks (from 22% to 28%), underscoring the greater resilience of open-air spaces.
Percent that used or visited in previous 12 months
Source: Canadian Index of Wellbeing: 2018 and 2022 Waterloo Region Survey.
Data from the YMCA of Three Rivers reinforces the ongoing scale of this challenge. Membership in health and fitness programs dropped by just under 50% at the peak of the pandemic and, despite some recovery, remains 25% below pre-pandemic levels for the last two years through 2025 –even as the region’s population has continued to grow.68
Community centres and YMCAs often rely on program and membership fees, making them potentially self-sustaining – but sustained declines in participation threaten both their financial viability and their role in fostering community connection. These spaces have consistently been linked to higher levels of wellbeing and belonging, particularly among those who participate more frequently.
Participation in vigorous physical activity saw a sharp decline – from 58% in 2018 to just 44% in 2022 – a 14 percentage point drop, or a relative decrease of nearly 25%. Light exercise also declined modestly, from 92% to 85%. This matters because vigorous activity is often a stronger predictor of wellbeing, and its drop reflects a broader loss of high-intensity engagement in physical routines. Many people appear to have lost pre-pandemic habits, and for some, those routines have not returned.
Our Y offers so much more than fitness programs – members tell us they find important social connections and friendships, healthy stress relief, and support and guidance in navigating health challenges. We help people age in place longer, improve the quality of their life, and reduce isolation and loneliness. In fact, we consider this critical preventative health care – an hour at the Y every week will change your life for the better! But you don’t have to take my word – scan the QR code to hear from one of our members.
Monique Yuhasz VP Health and Wellness, YMCA of Three Rivers
More than 1 in 4 members of the YMCA receive fee assistance to ensure cost is not a barrier to wellness. Apply for Fee Assistance here or, if you’re in a position to help your neighbours, donate here.
International evidence suggests that declines in physical activity are likely ongoing: One long-term study published in 2024 noted that physical activity declined during the pandemic, but did not improve again after in adult population.69 Some studies of children generally have found their levels of exercise returned to normal once school returned,70 but as we show through this report, many adults have not returned to their previous activities.
Yet there are barriers to people using these types of community centres and recreational facilities and these barriers grew slightly over the pandemic in the region. Between 2018 and 2022, the percentage of residents who felt recreational facilities were welcoming dropped from 58% to 52%. Those who agreed facilities were convenient fell from 50% to 43%. These are not huge drops, and some of the biggest opportunities were the broader barriers people were experiencing in both 2018 and 2022. For example, just 22% strongly agreed that recreation spaces felt welcoming –suggesting a significant opportunity to improve both access and perception.
Recreational cultural facilities are welcoming 2018 2022
No cost barriers to participation
Recreation/culture at convenient times
Places nearby to take classes on my own
Recreational and cultural facilities are easy to get to
Source: Canadian Index of Wellbeing: 2018 and 2022 Waterloo Region Survey.
Access challenges in a growing, changing region
As the region grows and gets younger, this part of our social infrastructure must evolve to reflect the changing interests and opportunities of our youngest residents. The evidence is clear: investments in recreation work. A growing body of research shows that improving access to parks, community centres, gyms, and trails increases physical activity – particularly vigorous activity – especially when infrastructure is paired with engaging programming.71 Group-based exercise has well-documented mental and physical health benefits,72 and the impact of these spaces can be further amplified by improving programs, making facilities more welcoming and convenient, offering lowcost or self-sustaining options, and leveraging volunteers to broaden participation.
Percent that perceive no cost barriers to participation in recreation/culture
On
the Table conversations
included
“a strong emphasis on organizing more community events and activities that cater to various age groups and interests, such as outdoor activities, sports, festivals, bake sales, spa days, and concerts… the importance of feeling invited and welcomed was repeatedly mentioned.”
Participants at Kinbridge Community Association and Cambridge Neighbourhood Table 2024 On the Table conversation
Source: Canadian Index of Wellbeing: 2018 Waterloo Region Survey.73
Note: For the cost chart, this is the percentage that disagree that cost is a barrier to participation (the data is reverse coded).
Percentage that agree recreational/cultural programs are offered at convenient times
Source: Canadian Index of Wellbeing: 2018 Waterloo Region Survey.74 Note: This chart is not reverse coded, unlike the one above.
Satisfied with arts culture and recreation opportunities Places
Satisfied with access to parks and recreational opportunities
Cost and convenience are bigger barriers for younger residents. More than a third (38%) of the youngest age cohort thought that cost was not a barrier to participation compared to at least half of all other age categories, rising to over 60% among those over 65. Perceived convenience was also much lower among those aged 39 and under compared to those 65 and older.
No cost barriers to participation
Recreatiional cultural facilities are welcoming Recreation/culture at convenient times
Agreement (or satisfaction) with various facets of recreation and culture, by ethnic origin
Canadian/European Racialized or Indigenous background
Recreational and cultural facilities are easy to get to
Satisfied with arts culture and recreation opportunities Places nearby to take classes on my own
Satisfied with access to parks and recreational opportunities
No cost barriers to participation
Recreational cultural facilities are welcoming Recreation/culture at convenient times
Canadian/European Racialized or Indigenous Background
Source: Canadian Index of Wellbeing: 2018 Waterloo Region Survey. Analysis by author. Note: The survey asked about ethnic origin and respondents were recoded with Canadian and European backgrounds coded as white. See footnote for details as well as notes on question wording.75
Racialized and Indigenous residents also reported lower access and satisfaction across nearly every measure – often by wide margins. They were 17 percentage points less likely to say facilities are easy to get to, 15 points less likely to say there are places nearby to take classes, and 13 to 14 points less satisfied with arts and culture opportunities and parks and recreational access. Smaller – but still notable – gaps of 11 percentage points emerged around cost and convenience.
Encouragingly, the gap on whether recreational and cultural facilities are welcoming was much smaller – just 4 percentage points. This may suggest that while access remains a challenge, the experience within facilities may be more equitable.
Disability is an even more substantial barrier to participation. In 2018, residents with mental or physical disabilities or chronic illnesses were 17 to 19 percentage points less likely to report satisfaction or agreement on key measures – such as access to parks and recreation, arts and culture opportunities, welcoming and accessible facilities, or affordability of participation.76 Gaps were somewhat smaller but still present when it came to proximity of amenities and availability of programs at convenient times.
The data confirms what many in developmental services have known for years: access isn’t just about ramps and doorways; it’s about belonging. When programs aren’t designed for people with disabilities in mind, they’re left navigating exclusion in spaces meant for connection. To grow our social infrastructure, accessibility must be embedded at every level, not retrofitted or treated as an afterthought. At Extend-A-Family Waterloo Region, we stay laser-focused on building relationships and belonging because building services and systems that are universally accessible benefits everyone. If our community were rooted in belonging, people with disabilities wouldn’t face such a steep hill to climb.
Allan Mills
Executive Director, Extend-A-Family Waterloo Region
Satisfaction with access to parks and recreation opportunities varied across the region. Geographical differences in satisfaction ranged from a high of 80% in Woolwich, to 76% in Wellesley – to a somewhat lower level of 70% and 69% in Kitchener and Cambridge respectively. Showing park access is appreciated across the region, but there is overall room for improvement in how residents experience local recreation access.
Improving access for children and youth
The 2023 Youth Impact Survey from the Children and Youth Planning Table reveals sharp declines in wellbeing, belonging, and participating as youth get older in Waterloo Region. Belonging drops from 82% among 9 to 12-year-olds to just 64% among 16 to 18-year-olds. Mental health follows a similar pattern – 71% of younger youth say their mental health is good, compared to just 40% of older teens. Physical health shows a 21-point gap.
Screen time surges with age as outdoor activity declines: 80% of older teens spend 3 or more hours a day on their phones, compared to just 33% of the youngest. At the same time, outdoor activity plummets – from 70% among the youngest spending 3+ hours outdoors per week to half that rate among the oldest. Most starkly, loneliness more than doubles with age: just 16% of 9 to 12-year-olds say they often feel lonely, compared to 36% of 16 to 18-yearolds.
At the Children and Youth Planning Table, everything we do is focused on improving children and youth’s sense of belonging and wellbeing. But in order for that to happen, we need strong social infrastructure – a community where young people have opportunities to connect, participate, and be heard. The Youth Impact Survey gives us a wealth of knowledge about where to focus our efforts so we can work together – children and youth, decision makers, and organizations – to build a Waterloo Region where all children and youth belong and thrive.
Alison Pearson Manager, Children and Youth Planning Table of Waterloo Region
Barriers to participation also rise with age. The most common reason older youth don’t take part is not having someone to go with (44%, up from 14% in the youngest group), followed by lack of time (38% vs. 12%) and cost (26% vs. 9%). Perceptions of recreational facilities are more consistent across age groups, though still concerning – only 49% say the quality is high, and 56% say they’re easy to get to.
Gender and sexual orientation also plays a key role in shaping access. For girls, the most common barrier to recreation is not having someone to go with (35%), followed by time (27%), and cost (20%). This barrier is even more pronounced among gender-diverse youth, 55% of whom report having no one to participate with as a reason they don’t participate. While boys also face this challenge, only 19% say it prevents them from taking part – pointing to the different social dynamics that shape how comfortable youth feel participating in recreation. There were also larger barriers for those who identified as identified as being 2SLGBTQIA+.
Fewer differences by geography, immigration status, or race. Perhaps surprisingly, youth in the townships and those who identified as newcomers and racialized youth were not significantly less likely to report participating in recreation or to say there were more barriers to participating.
In sensemaking sessions after the 2021 survey, when youth were asked what they’d like to see in their communities, many youth highlighted ideas rooted in social infrastructure – calling for better access to spaces, programs, and events that help them connect, participate, and belong. Here are a few of the proposed actions that link specifically to improving social infrastructure:
1. Identify communities where youth might be experiencing gaps in access to programs and opportunities. Increase access to community centres and provide more resources and play opportunities in these areas (e.g., youth in townships having access to same/similar programs as youth in urban municipalities).
2. Ensure that neighbourhoods across our communities have access to recreational facilities and spaces (e.g., community centres, splash pads, skate parks, community pools, basketball and tennis courts). Connect with youth to determine what activities they want available in these spaces, and that the variety and timing of those activities align with youth needs/ wants.
3. Have a centralized space (or spaces) where youth can learn about extracurriculars and ways to get involved in the community, highlighting which opportunities provide volunteer hours.
4. Provide more community events and public spaces to come together. Ensure events are widely promoted, are accessible (free or affordable), and geared towards youth (not just kids or families). Create opportunities for youth to be involved in organising these events.
5. Encourage things like community gardens, recycling or clean up activities. Make related resources easily available to youth.
See all the recommendations from their 2021 sense making sessions or see the 2023 data insights for the most recent data.
Arts and culture
Arts and culture is a growing concern in the region, with only 51% of residents satisfied with their access in 2022 – down 6 percentage points since 2018. Satisfaction was low across the board: even the highest-scoring area, the City of Waterloo, reached only 57%, while Cambridge was lowest at 42%. No community reported particularly high levels of satisfaction. Kitchener scored slightly above the regional average, while Wellesley and North Dumfries had the highest levels of dissatisfaction. In Cambridge, many residents reported feeling neutral.
Between 2018 and 2022, regular visits to arts and culture venues also declined sharply. The share of residents who ever visited a performing arts facility dropped by 11 percentage points, and visits to historic sites or museums fell by 7 points.
There were also major differences by age. Only 45% of residents under 30 were satisfied with their access to arts and culture, compared to 52% of those aged 30 to 39 and 56% of those aged 40 to 49. In contrast, over 70% of those aged 65 and older reported being satisfied.
Racialized residents also reported significantly lower satisfaction – 14 percentage points behind white residents (45% vs. 59%). The gap was smaller by immigration status, with a 6-point difference (58% for non-immigrants vs. 52% for immigrants).
Source: Canadian Index of Wellbeing: 2018 and 2022 Waterloo Region Survey.
Alexander Jacobi
Satisfaction with access to arts and cultural opportunities in the community, 2018:
By place of birth
Canadian Born Born Outside Canada
Waterloo Region. Source: Canadian Index of Wellbeing: 2018 Waterloo Region Survey. Analysis by author.
There are striking differences in how cultural institutions are used across age groups, highlighting the need to better understand the preferences of different generations –especially as the region’s population shifts. In 2018, just 12% of those under 30 regularly visited performing arts facilities, compared to 26% of those aged 75 and older. Regular visits to historic sites or museums were even lower among younger groups, while older residents were consistently more engaged with cultural spaces. These gaps suggest that we may need to evaluate whether current offerings are reflecting the interests and needs of younger residents and whether more targeted approaches may be required to foster cultural participation across all age groups.
In rural townships, a wide range of arts and culture programs is key to fostering creativity, inclusion and a strong sense of community. Yet residents tell us that limited local options and transportation gaps, especially across a large geography, often keep youth and older adults from participating. To truly serve everyone, we need accessible, flexible opportunities that reflect all interests and remove barriers so people can attend safely and easily.
With limited attendance data available post-2022, we turned to financial indicators to better assess the state of cultural infrastructure in the region – especially given the sharp decline in participation. Drawing on data from Mass Culture,77 a national arts data nonprofit, we identified 64 arts organizations located in Waterloo Region, that are also registered charities, and calculated their total revenue based on their financial disclosures from 2018 to 2023.78
Overall, total revenues for arts organizations in the region dropped by 15% between 2018 and 2023, or $5.2 million, from $34.5 million in 2018 to $29.3 million in 2023.79 This is across the board, with the median arts and culture charity seeing their revenue decline by 12% from 2018 to 2023. There are two sides to this: 38 organizations saw their revenue decline while 26 saw their revenues increase.
But the picture is even starker when adjusting for inflation and population growth.
Per capita revenue for local arts and culture organizations has declined by 38% from 2018 to 2023. Inflation surged by 17.7%80 while population surged by 16% over that time.
Waterloo Region arts and culture organizations seemed to struggle more during the pandemic than those outside the region, but the evidence is weak. Comparing average change from 2019 to 2022 from Mass Culture, arts charities in this region saw their revenue decline by 6 percentage points more than the country as a whole.81 However, our sample size remained constant over time and theirs did not, which could bias the comparison. Further, average revenue is skewed by large national and provincial organizations, which may have received more government funding during the pandemic.
Regional and municipal funding reported by arts and culture charities declined by 5% from 2018 to 2023, even as population growth and inflation soared. In total, charities located in Waterloo Region reported $4.9 million in revenue from municipal and regional government in 2023, down from $5.1 million in 2018. This translates to a per capita investment of $7.24 per resident in 2023, down from $10.32 per resident in constant dollars in 2018, a decline of 30%.
Charities have less ability to be self-sustaining as revenues from sales of goods and services – like tickets, camps, programs, and lessons – have plummeted by 41%. In 2018, they reported $15.8 million in revenue from sales of goods and services. In 2023, this revenue was only $9.3 million.
While ticket sales for conventional presenting activities have not yet returned to pre-pandemic levels, we’ve seen a dramatic uptick in rental activity at The Registry Theatre: rental revenue has not only recovered, but experienced a 50% increase from 2019. Everyday hundreds (thousands?) of Waterloo Region residents set up a camera and are mindful of things like light and sound levels, background activity, adaptors, and file formats. They are intimately acquainted with securing permits, rights to intellectual property, editing, and marketing. They are collectively producing an amount of content that dwarfs what all the major networks would have turned out 40 years ago. Supporting enterprising local Producers at a grassroots level is the best thing arts organizations can do at this time. We need to convince them that arts infrastructure does not represent an outdated and expensive approach, but instead an introduction to a community of individuals who speak their language and encounter the same obstacles. It’s up to us to convince them that working with us is better than figuring it out on their own.
Sam Varteniuk Executive Director, The Registry Theatre
Total Reported Revenue of Arts and Culture Organizations Total reported revenue of arts and culture organizations
Individual charitable support for arts and culture charities also had a massive decline during the pandemic. In 2023, charities reported only $1.07 million in revenue from tax-receipted charitable gifts, down from $3.4 million in 2018. There was a significant increase in fundraising of more than $1.1 million which partially offsets this decline.
Waterloo Region. Source: CRA T3010 Tax filings. Assembled and analyzed by author.
See all endnotes in this section for additional details.
Federal
Provincial
Tax-receipted
Fundraising
Fundraising
All
(see
All other sources (see note)
Revenue isn’t everything, but it paints a clear picture: local arts and culture organizations are in a financially precarious position. Revitalizing the sector will require more than just funding – it calls for a multi-faceted approach to re-engage the community.
We need to support arts organizations as they explore new ways to connect with audiences, especially those who may not realize what’s available or assume it’s not for them. That includes increased marketing, different storytelling approaches, activities for folks to experience art in unusual spaces, and fresh opportunities to introduce people to festivals and experiences they might not have sought out on their own.
As noted in the sports and recreation section, fewer than one in four residents strongly agree that cultural and recreational facilities feel welcoming. While few actively disagree, the ambivalence points to a deeper opportunity: to rethink how these spaces can foster a greater sense of belonging and inclusion.
Joe Lethbridge
Learning: Unlocking Opportunities in Libraries
Public libraries remain one of the most used types of social infrastructure in Waterloo Region. According to the 2022 Canadian Index of Wellbeing (CIW) survey, 37% of residents said they regularly use the library – unchanged from 2018 – and 66% said they use it at least occasionally. That makes libraries the second most frequently used cultural or recreational space in the region, after parks.
With 232,000 active library cardholders in 2023 – roughly one in three residents and a 4% increase since 2019 –Waterloo Region’s libraries continue to serve as a vital touchpoint for community connection and learning.82 This includes more than 57,000 active cardholders in Cambridge, 99,000 in Kitchener, 59,000 in Waterloo, and 16,000 across the townships. While some residents may hold cards in more than one system, the figures speak to the wide reach and relevance of public libraries across the region.
In-person library attendance has not recovered from the pandemic yet, having declined by 17%, despite a 13% population increase.83 In a fall week in 2023, libraries across Waterloo Region recorded 52,800 visits – a significant number, but down 17% from 63,600 visits in 2019. This drop mirrors broader declines in public facility usage and reflects a system that has not fully recovered from the pandemic. While significant, this is a smaller decline than the average across library systems that serve at least 50,000 people in Ontario, where the typical library saw a decline in visits of 23%.
While 2023 regional data shows in-person visits hadn’t fully recovered across all systems, Kitchener Public Library is currently seeing a different and evolving story. Our 2025 numbers show we’ve not only rebounded but, by most metrics, surpassed pre-pandemic levels of in-person visits, memberships, and digital engagement. But the real story isn’t just about recovery – it’s about transformation. The community has been irrevocably changed by COVID, and we’ve changed too. KPL hasn’t returned to public service in the same way post-lockdowns. We’ve moved away from prescriptive models toward something more relational and responsive, actively creating opportunities for people to connect with new ideas and each other in our spaces. That includes everything from bestselling author talks and award-winning food literacy programs to studio use and a dedicated Wellbeing and Community Connections team. We’ve even expanded into after-hours rentals and offerings to meet community demand for music, weddings, cultural celebrations, academic gatherings, and ceremony. In 2025, we opened a standalone NetZero library in Southwest Kitchener – Kitchener’s fastest-growing neighbourhood. It’s exciting to watch the library grow in step with the changing needs of the city we serve.
Nathan Stretch Senior Manager, Community Development and Insights, Kitchener Public Library
Digital circulation increased even as in-person visits declined. From 2019 to 2023, the libraries saw far more digital engagement and decreased in-person engagement. While libraries did a phenomenal job of adapting to the needs of people during the pandemic, this does change the nature of the experience in a way that may be less conducive to building community.
Program data shows an even steeper decline relative to the rest of the province. Attendance at library programs across the region fell 16% between 2019 and 2023 – more than twice the 7% drop seen across large Ontario library systems with at least 50,000 people. The number of programs offered dropped 20%, again roughly double the provincial average.84 In 2023, more than 229,000 people participated in just over 9,000 programs, down from 271,900 attendees across 11,230 programs in 2019.
Cambridge particularly stands out for having high program attendance, with 107,000 people participating, more than Kitchener despite having half the population. It has one of the highest program participation rates to population rates across the entire province.
Book club attendance, a potentially key offering for building deeper community connection, is down 41% region-wide. Book club programming has become a much rarer offering, which could account for the large drop in attendance. There is some emerging evidence that shared reading and book clubs can improve wellbeing among adults,85 older adults,86 and even co-workers in primary health settings.87
The Waterloo Region Library system, which serves the townships, is struggling relatively speaking. It has seen the steepest declines of any library system in the region – including the largest drops in program attendance, programs offered, and in-person visits. It also has the lowest ratio of visits to people in the region by a large margin.
These findings signal that even as libraries remain vital community spaces, they may need renewed attention and investment to restore pre-pandemic levels of connection and use.
Contributing: Rebuilding the Spirit of Volunteering and Giving
Fewer volunteers among widespread need
Volunteering remains well below pre-pandemic levels in Waterloo Region. According to the 2022 Canadian Index of Wellbeing survey, just 49% of residents reported volunteering, down 11 percentage points from 2018. Even 49% of people volunteering is a higher volunteer rate than typically found in most surveys of volunteerism, likely reflecting the self-selecting nature of respondents willing to complete a comprehensive survey about their experiences in the region. Still, the size of the decline aligns with national trends before and after the pandemic.
National data suggests that volunteerism has not meaningfully recovered in recent years. According to the federal government’s General Social SurveyG on Giving, Volunteering and Participating, formal volunteering declined by 9% between 2018 and 2023, while the total number of hours volunteered fell by 28%.88 Informal helping – such as assisting friends, neighbours, or acquaintances – declined more slowly, from 74% of Canadians in 2018 to 66% in 2023.
Some sources have suggested anecdotally that mutual aid and informal support surged during the pandemic, as communities mobilized to help vulnerable individuals. These observations may still be compatible with national data, which show that Canadians in 2023 were nearly as likely to help individuals (a modest 3 percentage point decline from 2018), but significantly less likely to get involved in broader community initiatives (a 19-point decline).89 When formal and informal volunteeringG are combined, total hours volunteered still dropped by 18% between 2018 and 2023 – indicating a continued downward trend in civic participation overall.
More recent local data suggests these challenges have persisted with fewer people interested in volunteering while the number of opportunities continues to increase. Volunteer Waterloo Region, which operates the region’s central volunteer opportunity portal, reports that online engagement remains far below pre-pandemic levels:
• Unique visitors to the site were down 34% in 2024 compared to 2019;90
• Overall page views declined 19%;
• Volunteer positions posted increased 19%, suggesting a growing gap between community needs and participation.
Historically, volunteering has contributed over 50% of the human resources of the community benefit sector. While we tend to think of volunteering in terms of supporting social services, volunteers have been fundamental to our national and local social infrastructure. While volunteering for a social cause is vital to a vibrant community, I think we tend to forget that volunteering is also fundamental to sports and recreation, festivals, arts and cultural programming, health care, faith communities, and so much more. We have built a country that is unique in the world because we have always valued volunteerism as a connecting mechanism for communities where people want to live, work, and play. This priority is experiencing a setback that is impacting many local organizations. They are reorganizing or closing programs, they are closing doors when programs are needed most. Volunteer Waterloo Region is working with our local community and our counterparts across the province to reinvigorate the attitudes and culture surrounding volunteering so that our programs and services in Waterloo Region remain strong.
Jane Hennig Executive Director, Volunteer Waterloo Region
Findings from the 2024 Ontario Nonprofit Network Survey for Waterloo Region reinforce this message:91
Volunteer recruitment challenges
• 53% of organizations reported struggles specifically with either recruiting or retaining volunteers.
• Among those with volunteer-related issues, 87% cited difficulty recruiting new volunteers and 65% noted challenges in re-engaging past volunteers.
Contributing to program reductions
• Staffing and volunteer shortages have forced 58% of organizations to scale back programs, 42% to introduce waitlists, and 10% to discontinue services entirely.
Donations: many more people, (slightly) fewer donors
The share of Waterloo Region residents claiming charitable donations on their tax returns has steadily declined – from 21% of tax filers in 2019 to just 17.7% in 2023, representing a 19% decline in the rate.92 Over that same period, the number of tax filers in the region rose sharply – from 410,060 to 484,900, an 18% increase. Yet the number of people reporting donations remained essentially flat, hovering around 85,000. In other words, even as the population has grown, the donor base has not kept pace. If the donation rate had remained constant, there would be 30,300 more charitable donors in 2023 than there were.
Number of tax files and number of charitable donors on the tax returns
Number of tax filers
Number of charitable donors
Kitchener-Waterloo-Cambridge CMA. Source: Statistics Canada. Table 11-10-0002-01 Tax filers with charitable donations by sex and age.
Waterloo Region is losing donors faster than the rest of the country even as donation rates remain slightly higher. From 2019 to 2023, the donation rate dropped by 19% (from 21.0% to 17.7%), while the rest of the country saw a decline of 13% (from 19.0% to 16.8%).
A longer-term analysis of tax data between 2004 and now shows that Waterloo Region has seen one of the steepest declines in giving rates in the country. Looking historically, in 2004 as an example, 29.9% of tax filers claimed a donation in Waterloo Region, reflecting the extent of the decline. While national donation rates have also trended downward (25.4% of tax filers claiming a donation in 2004), the drop locally has been especially pronounced, partially because the region historically had a very high donation rate. The decreased role of religion could be playing a role in this decline.
This decline has serious implications for local social infrastructure. Donors help fund vital programs, services, and spaces – like community centres, cultural events, youth programs, and nonprofit supports. As the donor base shrinks, it becomes harder for organizations to maintain the activities that help residents connect and thrive.
And the issue may run deeper than dollars. If you don’t feel connected to the place you live, you’re less likely to volunteer – and even less likely to donate. Giving is often an expression of trust, identification, and belonging. When people don’t see themselves reflected in local institutions or feel disengaged from community life, they may withdraw their support – financially and otherwise.
Discovering: Making
What’s Available Visible
While many regions across Canada have lost most of their local media, Waterloo Region has retained a remarkably diverse and robust media ecosystem. The Waterloo Region Record continues to publish daily, and several weekly community newspapers remain in print, including The Ayr News and the Woolwich Observer. Local television is well-covered by CTV Kitchener and Rogers TV, while CBC provides both radio and digital news tailored to the region.
A range of local radio stations, including 570 NewsRadio and community broadcasters like CKMS and CKWR, offer news, talk, and cultural programming. And there are local podcasts, like Midtown Radio, and local alternative print publications, like The Community Edition. This combination of print, radio, TV, other audio, and online outlets makes Waterloo Region an exception in the current media landscape, where many communities have seen many of their similar local media institutions shutter.
Still, in WRCF’s On the Table conversations, one theme came up again and again: people don’t know what’s available in their community and that there are fewer opportunities to get traditional local media than their used to be. Whether it’s programs, services, or public spaces, the information gap is real – and it’s getting wider as the region’s media ecosystem shrinks.
There is a lack of a central location for information – opportunities exist but you have to know where to go looking for the information. We need a HUB in Waterloo Region for this information – capitalize on technology.
Participant at a 2024 On the Table conversation
The end of many printed papers may have contributed. In 2023, Metroland Media, which owned many of the region’s weekly community papers, filed for creditor protection. The Cambridge Times, Waterloo Chronicle, and New Hamburg Independent all ceased print publication and shifted to digital-only.93 In total, 605 jobs were lost across Ontario – including 83 journalists – gutting local reporting capacity across smaller communities.
A few digital-first outlets have stepped in. CambridgeToday.ca launched in 2021 with two staff members. Midtown Radio, a volunteer-run community station founded in 2019, offers 24/7 streaming with a focus on local music and arts. TL;WR provides a weekly list of what to do – events, music, food, and more in Waterloo Region. Textile, a community arts collective and mentorship program focused on new and emerging writers and artists in Waterloo Region, has developed The Walldog to create space for critical arts writing and research.
Supporting local journalism is important, but improving the region’s information infrastructure calls for more comprehensive solutions. We need a mix of digital, physical, and human approaches to ensure people can see themselves in their communities and know what’s available to them.
The Ayr News has been serving the community since 1854 and has been owned by the Schmidt family since 1913. It has always been our role to keep members of our community connected and informed through local reporting. Our staff not only reports the news, but we are part of the community and serve on local committees and volunteer at events.
Whether
cheering on the successes of our residents in the arts or sports, or keeping them up-to-date on the decisions made by local municipal councils, The Ayr News strives to provide our readers with factual local reporting from people who live in the community.
Running a local newspaper has become more challenging as people rely on the internet and social media to get their news, which more often than not, isn’t factual and lacks local content.
Irene Schmidt-Adeney Writer and Reporter, Ayr News
Alex Kinsella
Residents and organizations suggested several practical steps:
• Centralized, accessible platforms that list programs, services, events, and opportunities – ideally co-created or supported by municipalities, libraries, and trusted nonprofits
• Community connectors and ambassadors who can share information in-person and build trust, especially in lower-income, newcomer, and rural communities where digital access may be limited
• Visible, in-person information infrastructure like physical bulletin boards in parks, libraries, community centres, transit stops, and social housing
• Investments in hyperlocal media – whether through nonprofit newsrooms, community radio, school newspapers, or grantsupported local reporting partnerships
• Support for multilingual and culturally-specific communication, so that residents can access news and updates in ways that reflect their identities and lived realities
• More coordination across platforms – so staying informed doesn’t feel like a part-time job
Ultimately, access to local information is foundational social infrastructure. If people don’t know what’s out there, they can’t participate in civic life, access help, or connect with one another. Closing the information gap will take coordination across governments, community groups, funders, and residents – but it’s essential to building a region that works for everyone.
There’s a crucial difference between coverage and criticism. Coverage tells you what happened; criticism helps communities think more deeply about why it matters. Good critique isn’t about tearing people down – it’s about fostering healthy discourse that helps artists and audiences grow together. Local media should build this capacity for critical engagement, but too often we’re waiting for institutions that created these gaps to solve them. Through Black Talk and our publishing work, Textile proves communities can create their own platforms for the voices mainstream media overlooks. Curation in public spaces and arts programming with youth are vital components of this discourse, creating new pathways for meaningful cultural conversation.
Fitsum Areguy Co-founder and Co-director, Textile
If municipalities and funders are committed to advancing fair access to public space, meaningful engagement with the lived experiences and insights of grassroots communities is essential. This includes working collaboratively with community-led organizations in the planning and redesign of public spaces and recognizing their role as key partners in fostering inclusion and belonging for when and where people gather.
Supporting culturally relevant outdoor and recreational programming, especially in underserved areas, is a vital step toward this goal. Equally important is moving beyond short-term, project-based funding to invest in the long-term operational capacity of grassroots organizations doing this critical work.
We also invite regional stakeholders to champion community-based research and storytelling that centres the voices of racialized and newcomer residents, and to cultivate partnerships grounded in reciprocity, trust, and sustained commitment.
As our region grows to one million people, we can build a region and grow our community so everyone feels connected to others, and that they belong.
A Region Working Together: Efforts to Strengthen Social Infrastructure
Let’s Learn More, Keep Discussing, and Take Action Together to Grow and Improve our Social Infrastructure
Waterloo Region is changing faster than almost anywhere else in Canada – growing younger, more diverse, and more complex by the year. But growth alone does not guarantee connection. As this report has shown, life satisfaction is slipping, belonging is fraying, and the social infrastructure that once helped anchor community life has not kept pace.
It was difficult to pull this report together, and to get data that clearly showed what is happening across the region – and the impact on populations within the region. There is a need for data that shows where investment should take place to address gaps in terms of: neighbourhood or community, age, race, sexual orientation, abilities, income, length of time living in the region – and more.
Yet this moment is not just a warning – it is an invitation. Across the region, residents are calling for more welcoming, inclusive, and accessible spaces to connect. And many are already responding. WRCF is investing in local organizations, supporting youth-led initiatives, and making social infrastructure a strategic priority. Others are also stepping up: from municipalities renovating parks, to nonprofits reimagining arts programming, to new partnerships expanding volunteer and learning opportunities.
We invite you to join us – whether as a funder, partner, advocate, researcher, or neighbour. The path forward lies in collective action: developing ways to improve how we collect, disaggregate, and interpret our data, and then reinvest in the places, programs, and people that help us
be part of something bigger. As our region grows to one million people, we can build a region and grow our community so everyone feels connected to others, and that they belong.
In this section we are going to highlight some of the work that is already happening across the region. We will also give you the opportunity to learn from others who are focused on social infrastructure. This doesn’t represent everything that is going on – but we’ve tried to give you a taste that will hopefully get you interested in learning, discussing, and then taking action.
Shared experiences
Examples of experiences people can be part of that are happening locally in Waterloo Region:
Clubs and associations – There are a wide range of clubs that people can join with far ranging activities from knitting to cycling to the local Pokémon Go Community. A search on social media, or the bulletin board at a community centre, can highlight a range of options. Here’s an example of what we found if you wanted to participate in Lawn Bowling clubs:
Elmira Lawn Bowling Club elmiralawnbowlingclub.org
Heritage Lawn Bowling Club heritagegreens.ca
Kitchener Lawn Bowling Club kitchenerlawnbowling.wordpress.com
Preston Lawn Bowling Club prestonbowls.org
Festivals – Waterloo Region is known for hosting a wide range of festivals throughout the year. There are too many to list here, but we tried to pick 11 that were located in all of our municipalities and a wide range of ways to connect, learn, and have fun!
Afrovibes Festival afrovibesthefestival.com
Elmira Maple Syrup Festival elmiramaplesyrupfestival.com
Emancipation Day Celebration (Rhythm and Blues Cambridge) rhythmbluescambridge.com/upcoming-events
Grand River Pride grandriverpride.ca
Impact International Theatre Festival mtspace.ca/impact-theatre-festival
Wellesley Apple Butter & Cheese Festival wellesleyabcfestival.ca
Tiffany Chow
Events, activities, and learning opportunities to advance Truth & Reconciliation Calls to Action
Participate in events supporting National Indigenous Peoples Day. 2025 examples are included in this list provided through CBC KW
Reflect and learn about the impact of residential schools on Indigenous communities. One example is to participate in learning and events linked to September 30th, the National Day for Truth and Reconciliation, also know as Orange Shirt Day. To learn more about Orange Shirt Day, visit orangeshirtday.org.
Attend a local Pow Wow. Examples include those hosted at the University of Waterloo (uwaterloo.ca/indigenous/ annual-pow-wow) and Conestoga College (blogs1. conestogac.on.ca/events/2025/03/fifteenth_annual_ traditional_p.php).
Support Indigenous art by doing things like:
• Attending artists workshops and exhibits, like those held at Longhouse Labs (longhouselabs.ca) or exhibitions, which are often hosted at the Kitchener-Waterloo Art Gallery.
• Purchasing art at an Indigenous Art Market –instagram.com/iamkitchener
• Seeking out Indigenous art installations throughout the region – like the three murals by Indigenous artists currently displayed in the Domestic Arrivals Building at the Region of Waterloo International Airport and the Indigenous mural at the University of Waterloo, in the Dana Porter Lobby
Porch parties – Featuring live music, these events happen throughout the region. Here’s a list of just a few:
Ayr Porchfest ayrporchfest.ca
Grand Porch Party grandporch.wordpress.com
Hohner Avenue Porch Party hohnerporchparty.yolasite.com
Neighbours Day (in Kitchener) kitchener.ca/en/arts-culture-and-events/neighbours-day.aspx
Preston Porch Party facebook.com/events/beaver-street-cambridge-ontario/7thannual-preston-porch-party/1388141828791547
Schneider Creek Porch Party scporchparty.weebly.com
Sporting events – Waterloo Region is home to some great sports teams that you can cheer on with other members of our community. In addition to minor, junior, and other national league sports in all municipalities, a few to consider are:
Kitchener Rangers, Ontario Hockey League chl.ca/ohl-rangers
Kitchener Panthers, Intercounty Baseball League kitchenerpanthers.com/home
KW Titans, National Basketball League of Canada kwtitans.com
There are also great sports to watch at the University of Waterloo (athletics.uwaterloo.ca), Wilfrid Laurier University (laurierathletics.com/index.aspx), and Conestoga College (conestogacondors.ca/information/Athletics_Overview)
Check out the Youth Hub – an example of an Extend-A-Family Waterloo Region program that brings people together in inclusive spaces for the fostering of relationship development and belonging.
Youth Hub is a new fully-inclusive program developed for children with or without disabilities aged 13-17 offered in partnership with the Kitchener Public Library. Youth can drop-in at the designated space within the Main Branch of the KPL, which was chosen for its central location, public transit access, and ability to engage individuals from equity deserving groups including but not limited to: newcomers, racialized groups, 2SLGBTQIA+ individuals, and lowincome families. Youth attending pick the activities and support people and Librarians are there to help facilitate chosen activities.
To learn more about other inclusive programs and partnerships that foster belonging, visit their website: eafwr.on.ca/programs
5 Organizations to watch/tools to use
Impactful work in elevating experiences leading to stronger social infrastructure.
1. City Membership Toolkit – How cities can cultivate a sense of local community membership among their residents. democracypolicy.network/agenda/strong-people/ strong-communities/city-membership – see below for more information.
2. GenWell – Population-level connection campaigns intended to provide people in Canada with the reminder, excuse, and permission to build stronger social connections. genwell.ca/campaigns
3. Local Trust: Community Response to Loneliness Toolkit – A UK initiative including tips, activities, and inspiration to assist with creating positive communities where social connections can thrive. localtrust.org.uk/big-local/programme-guidance/acommunity-response-to-loneliness
4. The Joy Experiments – A space to discover a new narrative, strategy, and creative process for building the great cities of the future. thejoyexperiments.com
5. Warm Cookies of the Revolution – The “World’s First Civic Health Club” gets residents engaged in crucial civic issues by creating innovative and fun arts and cultural programs. warmcookiesoftherevolution.org
Initiatives to establish basic infrastructure of “City Membership.”
1. Promote “neighbourhood membership” through microspaces, microgrants, and neighbourhood leadership programs.
2. Establish a “Welcoming Liaisons” program.
3. Create official municipal “Welcome Kits.”
6. Create municipal alumni groups.
Note: we’ve included 6 of the 13 initiatives to spark some thought, and also changed the word “city” to “municipality in the list above to better reflect Waterloo Region.
4. Host civic activities fairs.
5. Establish municipality homecomings.
Shared places and spaces
Examples of places and spaces that people can go to participate in activities across Waterloo Region:
Business Improvement Associations (BIAs) – BIAs activate the “cores” of the three cities with a wide-range of things to do.
Community centres, recreation centres, and parks –Information about these facilities are managed separately by each municipality – offering a range of services, and support in neighbourhoods throughout communities across the region. Visit the seven websites for the municipalities and you will find links to places you can go in your local community:
City of Cambridge cambridge.ca
City of Kitchener kitchener.ca
City of Waterloo waterloo.ca
Township of North Dumfries northdumfries.ca
Township of Wellesley wellesley.ca
Township of Wilmot wilmot.ca
Township of Woolwich woolwich.ca
Check out the framework of Havens, Hubs, and Hangouts that form a complete Social Infrastructure Network –designed by Gehl Studio: gehlpeople.com/projects/ social-infrastructure
Engage Rural – Activities happening in spaces in the four townships in Waterloo Region can be found by visiting Engage Rural’s social media sites. facebook.com/EngageRural
Libraries
The Region of Waterloo Library offers library services, programs and events to the Townships of North Dumfries, Wellesley, Wilmot, and Woolwich. rwlibrary.ca
Cambridge Public Library cambridgepl.ca
Kitchener Public Library kpl.org
Waterloo Public Library wpl.ca
Programs offered through all of the region’s municipalities for community members to “make stuff happen” in their neighbourhood. Examples from the region’s three cities include:
City of Cambridge – Community Connections Grants cambridge.ca/en/parks-recreation-culture/funding-andgrants.aspx
City of Kitchener – Love My Hood lovemyhood.ca
City of Waterloo – Neighbourhood Fund waterloo.ca/en/neighbourhoods/neighbourhood-fund. aspx
Trails – Explore Waterloo Region has put together a list of trails in all seven municipalities. You could also visit Grand Valley Trails to plan your own hike, sign up for a guided hike, or volunteer with their association.
Love My Hood has made it easier for residents to bring forward their own ideas – whether it’s a new amenity in a park or an event to bring people together. These resident-led projects leave a lasting mark, transforming not just physical spaces, but relationships within neighbourhoods.
Josh
Joseph Manager, Neighbourhood Development Office, City of Kitchener
Poorni Ramakrishnan
5 Organizations to watch/tools to use
Impactful work in supporting and growing places and spaces to build connections between people – and strengthen social infrastructure.
1. 7GenCities – Collaborative focusing on the physical, digital, and social infrastructure requirements to ensure humans, and more than humans, over the next seven generations, will thrive in just, radically inclusive, caring, and regenerative communities.
7gencities.org
2. 8 80 Cities – Pilot projects and research to show that if everything we do in our cities is great for an 8-year-old and an 80-year-old, then it will be better for all people. 880cities.org
3. Activate Your Neighbourhood – Guide to help rethink neighbourhood spaces to support physical activity and social connections. activateyourneighbourhood.ca – see below for more information
Excerpt from Activate Your Neighbourhoods.
Emily Talen, from the University of Chicago, writes that a good neighbourhood has eight qualities:
1. It has a name.
2. Residents know where it is, what it is, whether they belong to it.
3. It has at least one place that serves as a centre.
4. It has a generally agreed upon space or area.
4. Canada’s Placemaking Community – A hub for people who believe that inclusive spaces and experiences can connect communities. Includes a toolkit for placemakers. placemakingcommunity.ca
5. Projects for Public Spaces – Examples, tools, and discussions to help create community-powered public spaces around the world.
pps.org/about
5. It has everyday facilities and services, although it is not self-contained.
6. It is connected to areas within and outside the defined area.
7. It has or is open to diversity.
8. It has a way for residents to be involved in its affairs, and an ability to speak with a collective voice.
Shared platforms and tools
Examples of platforms and tools that have been created for people to use that will help activate and grow social infrastructure across Waterloo Region:
Children and Youth Planning Table Guides – Youth engagement resources like “So you want to start a youth council?” and the “Takeover Guide,” which supports youth takeover experiences. childrenandyouthplanningtable.ca/resourcesresearch/#resources
Connected KW – Volunteer-run community guide that curates events and resources for anyone living in Waterloo Region. connectedkw.com
• This site includes a page with links to a map of public art across Waterloo Region connectedkw. com/maps/public-art-in-waterloo-region
#ElderWisdom Guide – Your guide to hosting your own program to share the wisdom of elders in your community. elderwisdom.ca
GatherWR – AI tool that provides a simple way for anyone to discover places and spaces to bring people together in Waterloo Region. gatherwr.ca
One Million Neighbours Waterloo Region – A vision for an inclusive, resilient, and abundant future led by non-profits and community groups, built primarily over the course of 8 roundtable discussions in 2024 and 2025. onemillionneighbours.ca/vision
The greatest untapped resource in Canada, if not the world, is the collective wisdom of our elders. Ageism remains one of the most pervasive and harmful forms of discrimination – and it affects us all. By listening to the voices of older adults and creating space for shared connection, we move toward a more inclusive, respectful, and age-friendly society.
Ron Schlegel Schlegel Villages
ReConnect Waterloo Region – Connecting people with a list of events and activities across Waterloo Region. environmentaldefence.ca/reconnect-waterloo-region
The Belonging Collective Community Calendar – A space that shares free and low-cost events designed to welcome everyone. Access it if you are looking for inclusive, public events that help build connection, belonging, and accessibility for all. kwhab.ca/the-belonging-collective
Vision 1 Million Scorecard – Scorecard working to measure just how prepared Waterloo Region is to hold an estimated population of 1 million people by 2050. bestwr.org/vision_1_million.pdf
5 Organizations to watch/tools to use
Impactful work on how we can measure impact of activities to strengthen social infrastructure.
1. Evergreen’s Places4Wellbeing – A methodology for measuring the wellbeing impacts of public places. evergreen.ca/resource-hub/resources/places4wellbeing
2. Happy Cities’ Public Life Study Tool – Used to measure how people feel and act in shared spaces. happycities.com/public-life-study-tool
3. Local News Map – Tracks what is happening to local newspapers, broadcast outlets, and online/digital news sources in places across Canada. localnewsresearchproject.ca/category/local-news-mapdata
4. Measuring Main Streets – Tool to help explore what’s working, what’s not and what’s next for Canada’s main streets, empowering city builders from the neighbourhood to the national scale. measuringmainstreets.ca
5. Reimagining the Civic Commons’ Measure What Matters –DIY toolkit for those interested in capturing and quantifying the beneficial social impacts of a city’s public places. civiccommons.us/2019/01/measure-matters-diy-toolkit
Building social infrastructure starts with recognizing what’s already working.
Through Waterloom: A Social Fabric Project, we’re curating a shared map of people, places, and practices that strengthen social connection across Waterloo Region. By creating a platform to highlight these efforts and spark new conversations, we’re helping people and organizations in Waterloo Region see themselves as part of a coordinated effort to address the deepening crises of social isolation and loneliness locally.
Troy
D. Glover, Ph.D. Professor, Department of Recreation and Leisure Studies, and Director, Healthy Communities Research Network, University of Waterloo
Want to Keep Learning about Social Infrastructure?
Here’s a list of additional resources you might want to check out!
Shared experiences and social connection
2022 Social Connection in Canada – Report commissioned by Community Foundations of Canada. environicsinstitute.org/projects/project-details/connectionengagement-and-well-being
Action Guide for Building Socially Connected Communities –Guide to help create tailored social connection strategies for communities. action4connection.org
Apathy is Boring – Non-partisan, charitable organization that supports and educates youth to be active and contributing citizens in Canada’s democracy. apathyisboring.com
Canadian Alliance for Social Connection and Health –Inter-institutional, community-academic alliance of researchers and practitioners committed to addressing loneliness and social isolation. casch.org
CoGenerate – Effort to bridge generational divides to reduce social isolation. cogenerate.org/loneliness
Foundation for Social Connection – The leading U.S. organization focused on addressing the crisis of disconnection. social-connection.org
Recipes for Connection – Former U.S. Surgeon General’s work to demonstrate how building connection through gathering can lead to better health and well-being.
The Chatty Café Scheme – UK non-profit organization tackling loneliness. In-person, online and telephone connection opportunities. thechattycafescheme.co.uk
The Longest Table – Free, community event that brings people together for a shared meal and conversation. It’s a simple way to create moments of joy and begin building stronger neighborhoods. longesttablecommunity.org
The People’s Supper – Equips communities with the tools they need to build trust across lines of difference and to overcome sources of rupture and long-simmering conflicts. thepeoplessupper.org/about-us
United States Chamber of Connection – New civic institution dedicated to building and sustaining the core infrastructure needed to address the greatest issue facing society today –our lack of connection. chamberofconnection.org
Weave: the Social Fabric Project – Initiative led by Aspen Institute that tackles the problem of broken social trust by connecting, supporting, and investing in local leaders stepping up to weave a new, inclusive social fabric where they live.
WHO Commission on Social Connection – Landmark 2025 report: “From Loneliness to Social Connection: Charting a Path to Healthier Societies” and resources. who.int/groups/commission-on-social-connection/report
Walking the streets today, we feel the impact of collective effort, of a large ensemble of people and personalities adding tones and texture within every bar of the composition. Building community is very much like playing music: jamming with eyes and ears wide open, listening deeply and being generous with every player, building bridges and friendships through every refrain.
(p.231) Mitchell Cohen. 2025. Rhythms of Change: Reflections on the Regent Park Revitalization
Shared Places and Spaces
Better Block Foundation – Nonprofit that educates, equips, and empowers communities and their leaders to reshape and reactivate built environments to promote the growth of healthy and vibrant neighbourhoods. betterblock.org
Happy Cities – Urban planning, research, and engagement firm based in Vancouver and Halifax. They work with cities, developers, and non-profits around the world to design public spaces, streets, and housing that nurture wellbeing for all community members. happycities.com
Public Space Evaluation Toolkit – Series of indicators to quantify the benefits of public space improvements. evergreen.ca/resource-hub/umbrella_resources/publicspace-evaluation-toolkit
Reimagining the Civic Commons – Multi-city multi-foundation network looking to transform a city’s parks, libraries, trails, and main streets into places that strengthen communities. civiccommons.us
The Bentway – Vibrant Hubs aren’t just places for gathering –they’re powerful public health tools that can reverse troubling health trends.
And, this is just a sample of resources available. If you know of any – send them to us at info@wrcf.ca. We will keep adding to the list and store it on wrcf.ca/socialinfrastructure
Give Where You Live: Support Social Infrastructure in Waterloo Region
Will you join us by donating to local projects working to improve Social Infrastructure?
WRCF has worked with eight community partners who’ve each identified projects linked to the themes in this Vital Signs® Report, projects that can improve social infrastructure across Waterloo Region.
WRGive.ca is a new online giving platform that will be accepting donations between September 24th and October 29th.
Whether you have $10 or $1,000 to give – together we can make a difference. Let’s work together to grow our community as our community grows. Let’s help everyone feel connected to others in our community. Let’s ensure everyone feels they belong in Waterloo Region.
Learn more by visiting wrgive.ca.
Glossary
Average Age - Calculated by summing the ages of all individuals in the group and then dividing by the total number of individuals.
Canadian Housing Survey (CHS) - A national survey by Statistics Canada focused on housing conditions, affordability, and neighbourhood perceptions. It collects responses from household maintainers, including indicators like life satisfaction and mental health.
Canadian Social Survey (CSS) - A Statistics Canada survey launched in 2021 that measures Canadians’ wellbeing across multiple indicators, including life satisfaction, trust, belonging, and social connection. It provides timely, consistent tracking of social trends.
Census Metropolitan Area (CMA) - A geographic region defined by Statistics Canada that includes an urban core of at least 100,000 people, along with nearby municipalities that are socially and economically integrated through commuting flows.
Formal Volunteering - Participation in organized, unpaid activities usually arranged through a nonprofit, charity, or institution. Often tracked by surveys and critical to the functioning of many community services.
General Social Survey (GSS) - A longstanding Statistics Canada survey that collects data on Canadians’ social engagement, including volunteering, charitable giving, and civic participation. A key source of national trends.
Household Maintainer - The individual responsible for housing payments (rent or mortgage) in a dwelling. Many surveys, like the CHS, only collect data from this person, which can affect demographic representation.
Informal Helping / Informal VolunteeringUnpaid assistance provided to others outside of a formal organization, like helping neighbours, friends, or family with tasks, errands, or care. A key part of social support networks.
Median Age - The age at which half of the population is younger and half is older. It is a central indicator used to understand the age structure of a population or region.
Non-permanent Resident - A person residing in Canada on a temporary basis, such as international students, temporary foreign workers, or asylum seekers. They are included in census data but not considered permanent residents.
On the Table - A region-wide community engagement initiative led by WRCF, where residents gather over food to discuss what matters most to them, encouraging community connection.
Public Use Microdata File (PUMF) - An anonymized dataset released by Statistics Canada that allows researchers to analyze individual-level responses from national surveys while protecting participant confidentiality.
Racialized Population / Visible Minority - Terms used in Canadian data to refer to individuals who identify as non-white or as members of racial or ethnic minority groups. ‘Visible minority’ is the official census term, though ‘racialized’ is often preferred.
Randomized Controlled Trial (RCT) - A scientific method used to evaluate whether a program or intervention causes an effect, by randomly assigning participants to either a treatment group or a control group.
Social Capital - The networks of relationships, trust, and norms of reciprocity that enable individuals and communities to function effectively. Higher social capital is associated with better wellbeing and civic life.
Social Infrastructure - The places, organizations, and experiences that support human connection, inclusion, and community life, such as libraries, parks, community centres, and the programs that bring them to life.
Endnotes and References
1. How to cite: Statistics Canada. Table 17-10-0152-01 Population estimates, July 1, by census division, 2021 boundaries. https://doi.org/10.25318/ 1710015201-eng
2. A Census Metropolitan Area is Statistics Canada’s way of looking at a big city’s broader neighbourhood networks. It includes an urban core and the surrounding towns and communities around it that share high commuting flow. In Waterloo Region it includes the entire Region except for Wellesley. The Toronto CMA, includes Mississauga, Brampton, Vaughan, and Ajax.
3. Statistics Canada. Table 17-10-0148-01 Population estimates, July 1, by census metropolitan area and census agglomeration, 2021 boundaries. https://doi.org/10.25318/1710014801-eng
4. Statistics Canada - Annual Demographic Estimates. Note: Analysis by Author. Estimates are constantly revised so this reflects the state of the data as of June 2025, when this analysis was conducted.
6. 2024 figures are preliminary and subject to revision. These estimates are as of July 1st of each year.
7. Region of Waterloo. (2025, May 6). Growth analysis bulletin: Year end 2024 population and household estimates for Waterloo Region [Bulletin]. Region of Waterloo. https://www.regionofwaterloo.ca/en/ regional-government/resources/Bulletin---YearEnd-2024-Population-and-Household-Estimatesfor-Waterloo.pdf
8. Same source as 7.
9. Statistics Canada. Table 17-10-0153-01 Components of population change by census division, 2021 boundaries. DOI: https://doi.org/ 10.25318/1710015301-eng
10. Tal, B. (2025). Population growth projections: Are we repeating past mistakes? CIBC Thought Leadership. https://thoughtleadership.cibc.com/ article/population-growth-projections-are-werepeating-past-mistakes
11. See note 6.
12. While the projection for 2051 was not mentioned in the Region of Waterloo’s 2024 Growth Forecast itself, it was mentioned in the note accompanying it.
13. Region of Waterloo. (n.d.). Population by age. Waterloo Region Community Profile. Retrieved June 25, 2025, from https://wr-communityprofile-rmw.hub.arcgis.com/pages/ population-by-age
14. Average age and median age are both from Statistics Canada - Annual Demographic Estimates.
15. See previous charts for discussion of some of the limitations of the Annual Demographic Estimates. Estimates are as of July 1st and are preliminary and will be revised based on subsequent data.
16. Data from the 2025 International Student Survey was provided by Dan Vandebelt.
17. All estimates from Statistics Canada - Annual Demographic Estimates. Analysis by author.
18. From the 2016 and 2021 Canadian Census.
19. This is using the preliminary 2024 forecast from the annual demographic estimates.
20. This is a simple forecast based on the population composition in 2016, 2021, and 2024. It assumes a consistent rate of change over time, projecting that the growth trends observed between 2016 and 2021 for immigrants and racialized populations continued at a similar pace through 2024. However, there are important limitations to consider. Most notably, Statistics Canada’s annual population estimate for Waterloo Region in 2021 is approximately 27,000 higher than the Census count, due to challenges in achieving a complete Census response. As a result, Census-based forecasts are not directly comparable to the population estimates used elsewhere in this document since Statistics Canada believes their Census estimates produce an undercount. In addition, roughly 8,000 individuals in the Census lack reported racialized or immigration status
and are therefore excluded from the forecast and overall population totals in the chart. Those born outside Canada include both those who are immigrants and those who are non-permanent residents.
21. Quality of life indicators by census subdivision https://gaia.statcan.gc.ca/csge/infc/app/ index-qol-en.html. Estimates for Canada were derived by calculating a weighted average of the provinces since a Canadian total was not provided. The data used in this dashboard are from the Canadian Social Survey (CSS), using pooled estimates across 13 waves collected between April 2021 and June 2024. The Canadian Social Survey is a voluntary, cross-sectional, quarterly survey that collects information on well-being, health, time use, confidence in institutions, and other social issues. The target population for the CSS is all non-institutionalized persons aged 15 or older living off-reserve within the 10 provinces of Canada.
22. High life satisfaction: Proportion of the population who selected 8, 9 or 10 when asked the following question: “Using a scale of 0 to 10, where 0 means “Very dissatisfied” and 10 means “Very satisfied”, how do you feel about your life as a whole right now?”
Strong sense of meaning and purpose: Proportion of the population who selected 8, 9 or 10 when asked the following question: “Using a scale of 0 to 10, where 0 means “Not at all” and 10 means “Completely”, to what extent do you feel the things you do in your life are worthwhile?”
Rarely or never feels lonely: Proportion of the population who selected “Rarely” or “Never” when asked the following question: “How often do you feel lonely?
Strong sense of belonging to local community: Proportion of the population who selected “Very strong” or “Somewhat strong” when asked the following question: “How would you describe your sense of belonging to your local community?”
23. This data is from the Canadian Housing Survey Public Use Microdata File with analysis by the author. Life satisfaction was calculated consistently as the Canadian Social Survey. Since this measures the person responsible for housing maintenance, it shouldn’t be compared to general public surveys—household roles and demographics may differ. In single-person households, responses are identical, but young people living with parents, for example, would be out of scope. Given rising issues around housing affordability in Waterloo Region, it is possible that responses around mental health and life satisfaction were negatively impacted in the 2021 housing survey, which contributed to worse results.
24. This was based on the 3-year averages of life evaluations from the data found here: https://data. worldhappiness.report/chart
25. Helliwell, J. F., Layard, R., Sachs, J. D., De Neve, J.-E., Aknin, L. B., & Wang, S. (Eds.). (2024). World Happiness Report 2024. University of Oxford: Wellbeing Research Centre.
26. 2021 Canadian Housing Survey Public Use Microdata File. Analysis by the Author.
27. 2021 Canadian Housing Survey Public Use Microdata File. Analysis by the Author.
28. Note: Canadian Social Survey data aggregates data from 2021 to 2024 to ensure adequate sample sizes at the municipal level. The data for Canada was not released but was generated using data from the provinces by calculating a weighted average. Definitions for each indicator are in the footnotes.
29. For life satisfaction, respondents were asked to score their life satisfaction on a 11-point scale where 0 reflects very dissatisfied 10 reflects very satisfied. For belonging, it was measured on a 7-point scale where 1 is weak belonging and 7 is strong belonging. North Dumfries, Wilmot, and Wellesley all had less than 200 respondents while Woolwich had 313, while the other municipalities all had more than 1000, so results should be interpreted with caution.
30. For life satisfaction, respondents were asked to score their life satisfaction on a 11-point scale where 0 reflects very dissatisfied 10 reflects very satisfied. For belonging, it was measured on a 7-point scale where 1 is weak belonging and 7 is strong belonging. North Dumfries, Wilmot, and Wellesley all had less than 200 respondents while Woolwich had 313, while the other municipalities all had more than 1000, so results should be interpreted with caution.
31. The strong sense of belonging and high life satisfaction questions were based off the same wording and same analysis strategy as those reported above in the Canadian Social Survey. However, since this measures the person responsible for housing maintenance, it shouldn’t be compared to general public surveys—household roles and demographics may differ. In singleperson households, responses are identical, but young people living with parents, for example, would be out of scope.
32. The strong sense of belonging and high life satisfaction questions were based off the same wording and same analysis strategy as those reported above in the Canadian Social Survey. However, since this measures the person responsible for housing maintenance, it shouldn’t be compared to general public surveys—household roles and demographics may differ. In singleperson households, responses are identical, but young people living with parents, for example, would be out of scope.
33. See Chart for details. Note that sample sizes are small, but they are statistically significant.
34. 2021 Canadian Housing Survey Public Use Microdata File. Analysis by author.
35. 2021 Canadian Housing Survey Public Use Microdata File. Analysis by author.
36. Ayer, S., & Waterloo Region Community Foundation. (2024). On the Table Waterloo Region: Reflections & Insights about Waterloo Region [PDF]. https://www.wrcf.ca/s/On-the-TableWaterloo-Region-2024-Report-FINAL-compressed. pdf
37. Ayer, S., & Toronto Foundation. (2023). The Power of Us: Toronto’s Vital Signs Report 2023 [PDF]. https://torontofoundation.ca/wp-content/ uploads/2023/11/TF-VitalSigns2023-Tagged-Nov14. pdf
38. Rebar, A. L., Stanton, R., Geard, D., Short, C., Duncan, M. J., & Vandelanotte, C. (2015). A meta-meta-analysis of the effect of physical activity on depression and anxiety in non-clinical adult populations. Health Psychology Review, 9(3), 366–378. https://doi.org/10.1080/17437199.2015.102 2901
39. Burke, S. M., Carron, A. V., Eys, M. A., Ntoumanis, N., & Estabrooks, P. A. (2006). Group versus individual approach? A meta-analysis of the effectiveness of interventions to promote physical activity. Journal of sport & exercise psychology, 2, 19-35.
40. Müller-Riemenschneider, F., Petrunoff, N., Yao, J., Ng, A., Sia, A., Ramiah, A., ... & Uijtdewilligen, L. (2020). Effectiveness of prescribing physical activity in parks to improve health and wellbeing-the park prescription randomized controlled trial. International Journal of Behavioral Nutrition and Physical Activity, 17, 1-14.
41. Wakefield, J. R. H., Kellezi, B., Stevenson, C., McNamara, N., Bowe, M., Wilson, I., ... & Mair, E. (2022). Social Prescribing as ‘Social Cure’: A longitudinal study of the health benefits of social connectedness within a Social Prescribing pathway. Journal of health psychology, 27(2), 386-396.
42. Howarth, M., Brettle, A., Hardman, M., & Maden, M. (2020). What is the evidence for the impact of gardens and gardening on health and well-being: a scoping review and evidence-based logic model to guide healthcare strategy decision making on the use of gardening approaches as a social prescription. BMJ open, 10(7), e036923.
43. Walton, G. M., Murphy, M. C., Logel, C., Yeager, D. S., Goyer, J. P., Brady, S. T., ... & Krol, N. (2023). Where and with whom does a brief social-belonging intervention promote progress in college?. Science, 380(6644), 499-505.
44. Jiang, D., Warner, L. M., Chong, A. M. L., Li, T., Wolff, J. K., & Chou, K. L. (2021). Benefits of volunteering on psychological well-being in older adulthood: evidence from a randomized controlled trial. Aging & Mental Health, 25(4), 641-649.
45. de Wit, A., Qu, H., & Bekkers, R. (2022). The health advantage of volunteering is larger for older and less healthy volunteers in Europe: A mega-analysis. European Journal of Ageing, 19(4), 1189-1200.
46. From an 2025 analysis for YMCA Canada: “Trends in Community: An External View.” This was from the 2013 GSS, a 2024 YMCA Canada Survey, and a 2022 Survey by Community Foundations of Canada all using the same question about group participation.
47. Statistics Canada. (2025, June 23). Volunteering and donations, 2023. The Daily. https://www150. statcan.gc.ca/n1/daily-quotidien/250623/ dq250623b-eng.htm
48. Based on analysis for a soon to be published report for Volunteer Canada on Volunteering habits of older adults written by the author.
49. Statistics Canada. (2025, June 23). Volunteering and charitable giving, 2018 to 2023. The Daily. https://www150.statcan.gc.ca/n1/dailyquotidien/250623/dq250623b-eng.htm Volunteering in Canada, 2004 to 2013.
50. Statistics Canada. (2025, June 23). Volunteering and charitable giving in Canada, 2018 to 2023. The Daily. https://www150.statcan.gc.ca/n1/dailyquotidien/250623/dq250623b-eng.htm
51. Source: The 2018 data is based on analysis conducted by the author using the raw dataset, which included 5,029 respondents from Waterloo Region. The 2022 data is drawn from the report How are Residents of Waterloo Region Really Doing? Residents’ wellbeing after three years into COVID-19 by the Canadian Index of Wellbeing, based on responses from 4,936 residents.
52. Source: The 2018 data is based on analysis conducted by the author using the raw dataset, which included 5,029 respondents from Waterloo Region. The 2022 data is drawn from the report How are Residents of Waterloo Region Really Doing? Residents’ wellbeing after three years into COVID-19 by the Canadian Index of Wellbeing, based on responses from 4,936 residents.
53. Reports available for download here: Youth Impact Survey Results - Children and Youth Planning Table
54. See details here: Trails in Waterloo Region - Explore Waterloo Region
55. Trails in Waterloo Region - Explore Waterloo Region. For parkland, see Parks - City of Waterloo
56. Parks - Wilmot Township
57. Syamili, M. S., Takala, T., Korrensalo, A., & Tuittila, E. S. (2023). Happiness in urban green spaces: A systematic literature review. Urban Forestry & Urban Greening, 86, 128042.
58. Cohen, D. A., Han, B., Isacoff, J., Shulaker, B., Williamson, S., Marsh, T., McKenzie, T. L., Weir, M., & Bhatia, R. (2015). Impact of Park Renovations on Park Use and Park-Based Physical Activity. Journal of Physical Activity and Health, 12(2), 289-295. Retrieved Jun 11, 2025, from https://doi.org/10.1123/ jpah.2013-0165
59. Cohen, D. A., Han, B., Derose, K. P., Williamson, S., Marsh, T., & McKenzie, T. L. (2013). Physical activity in parks: a randomized controlled trial using community engagement. American journal of preventive medicine, 45(5), 590-597.
60. Sharifi, F., Nygaard, A., & Stone, W. M. (2021). Heterogeneity in the subjective well-being impact of access to urban green space. Sustainable Cities and Society, 74, 103244.
61. Analysis by author from the data file. See previous notes for details on the 2018 CIW survey of Waterloo Region with more than 5000 respondents. The 2022 dataset was not available for analysis by age.
62. Strongly agree combines those who very strongly and strongly agree. This was a 7-point scale with responses to the statement “There is a local park nearby that is easy for me to get to.”
63. Analysis by author from the data file. See previous notes for details on the 2018 CIW survey of Waterloo Region with more than 5000 respondents.
64. Canadian Index of Wellbeing. (2022). How are residents of Waterloo Region really doing? Residents’ wellbeing after three years into COVID-19. University of Waterloo.
65. All data cited here is sourced directly from HealthyPlan.City and has been reproduced as faithfully as possible to avoid misinterpretation, though it was all based on additional work by the author. The website offers a wide range of additional tools and resources, and we encourage readers to explore its many features related to social infrastructure and beyond.
66. The 2022 data is drawn from the report How are Residents of Waterloo Region Really Doing? Residents’ wellbeing after three years into COVID-19 by the Canadian Index of Wellbeing, based on responses from 4,936 residents.
67. Note: This was a 7-point scale with anyone who scored 5 to 7 reflecting agreement with the statement “There is a local park nearby that is easy for me to get to.”
68. Data provided by Andrea Kingswood of YMCA of Three Rivers. It refers to the total membership across all 6 of their locations including ones outside of Waterloo Region (4 locations are within Waterloo Region).
69. Kerstis, B., Elvén, M., Nilsson, K. W., von Heideken Wågert, P., Stier, J., Dahlen, M., & Lindberg, D. (2024). Prevalence and Determinants of Changes in Physical Activity and Sedentary Behavior during and after the COVID-19 Pandemic: A Swedish Repeated Cross-Sectional Study. International Journal of Environmental Research and Public Health, 21(8), 960.
70. E.g. Singh, K., Armstrong, S. C., Wagner, B. E., Counts, J., Skinner, A., Kay, M., ... & Dunn, J. (2024). Physical activity and sleep changes among children during the COVID-19 pandemic. NPJ Digital Medicine, 7(1), 70. Or Kopp, P. M., Möhler, E., & Gröpel, P. (2024). Physical activity and mental health in school-aged children: a prospective two-wave study during the easing of the COVID-19 restrictions. Child and Adolescent Psychiatry and Mental Health, 18(1), 4.
71. E.g. Høyer-Kruse, J., Schmidt, E. B., Hansen, A. F., & Pedersen, M. R. L. (2024). The interplay between social environment and opportunities for physical activity within the built environment: a scoping review. BMC Public Health, 24(1), 2361.
72. Burke, S. M., Carron, A. V., Eys, M. A., Ntoumanis, N., & Estabrooks, P. A. (2006). Group versus individual approach? A meta-analysis of the effectiveness of interventions to promote physical activity. Journal of sport & exercise psychology, 2, 19-35.
73. Analysis by author from the 2018 data file. See previous notes for details on the 2018 CIW survey of Waterloo Region with more than 5000 respondents. The 2022 dataset was not available for analysis by age.
74. Analysis by author from the 2018 data file. See previous notes for details on the 2018 CIW survey of Waterloo Region with more than 5000 respondents. The 2022 dataset was not available for analysis by age.
75. Chart reflects either agreement or satisfaction, depending on the question. Cost was reverse coded with the answers in the chart reflecting those who disagreed with the statement that cost prevents participation.
76. Analysis by author from the 2018 CIW data file. See previous notes for details on the 2018 CIW survey of Waterloo Region with more than 5000 respondents. The 2022 dataset was not available for analysis by disability.
77. Thank you to the team at Mass Culture who provided access to their tool that allowed us to do the analysis. They have an amazing dashboarding tool that is very useful for those trying to understand trends in arts and culture.
78. We downloaded all charities’ annual information returns for the last decade and evaluated how their revenue had changed. The year reported here is based on their fiscal year end date. For example, someone with a fiscal year end of January 30th, 2022 would be included in 2022 despite most of their revenue being generated in 2021. We also supplemented this with audited financial data from Oktoberfest, one of Waterloo Region’s largest festivals which had full financial statements available online. Drayon Theatre was removed since it was not located within the Region physically, despite substantial presence here, and its disproportionately large size with an unclear share of it falling within the Region. Attempts to include other nonprofit festivals were hindered by limited public financial disclosure.
79. We used the total revenue line from their annual returns. It is worth noting that the individual revenue line items did not add up to the total, because some charities did not list all of their individual revenue items.
80. Author’s calculations based on data in subsequent lines from Bank of Canada and Statistic Canada’s population estimates for 2023 and 2018. https:// www.bankofcanada.ca/rates/related/inflationcalculator/
81. From their DNA platform. https://massculture.ca/ dna/access-the-dna-platform/ It includes the average organizational revenue for 2018 and 2022 for their entire database.
82. Source: Ontario Annual Survey of Public Libraries. Analysis of raw data for 2019 and 2023 by author.
83. Ontario Annual Survey of Public Libraries. Analysis of raw data for 2019 and 2023 by author. Each fall, Ontario libraries report one typical week of activity (excluding holidays) per service point. This data feeds into the next year’s Annual Survey. A service point must be public-facing, open regularly, have a permanent collection, and be staffed. All visits are recorded. Data is not yet available for 2024 on the website.
84. Ontario Annual Survey of Public Libraries. Analysis of raw data for 2019 and 2023 by author. Programs span a wide range—from structured workshops and classes to casual drop-ins and online events— making it difficult to draw clear comparisons over time or across systems. Variations in how libraries define, categorize, and report programs can introduce inconsistencies into the data. Library program data includes in-person, virtual, recorded, and kit-based sessions. Attendance may reflect registrations, screen counts, views (1+ min), or kit distribution (1 attendee per kit). Libraries vary in how they define, deliver, and count programs, making direct comparisons unreliable. Use trends directionally and interpret with caution.
85. Järvholm, K., Ohlsson, A., Bernhardsson, K., Gustafsson, A. W., Johnsson, P., Malmström, M., ... & Forslid, T. (2025). Shared reading as an intervention to improve health and well-being in adults: a scoping review. Frontiers in Psychology, 16, 1484839.
86. Milani, C., Biagi, C., Palmieri, E., Rosi, C., Buresta, D., Iocca, F., ... & Bonaccorsi, G. (2025). Shared reading interventions to promote psychosocial well-being in older adults: a systematic review. Health Promotion International, 40(2), daaf036.
87. Kelsey, E. A., West, C. P., Fischer, K. M., & Croghan, I. T. (2023). Well-being in the workplace: a book club among health care workers during the COVID-19 pandemic. Journal of Primary Care & Community Health, 14, 21501319231161441.
88. Statistics Canada. (2025, June 23). Volunteering and charitable giving, 2018 to 2023. The Daily. https://www150.statcan.gc.ca/n1/daily-quotidien/ 250623/dq250623b-eng.htm Volunteering in Canada, 2004 to 2013.
89. Statistics Canada. (2025, June 23). Volunteering and charitable giving, 2018 to 2023. The Daily. https://www150.statcan.gc.ca/n1/daily-quotidien/ 250623/dq250623b-eng.htm Volunteering in Canada, 2004 to 2013.
90. Staff at Volunteer Waterloo Region note that the decline in unique visitors should be interpreted with caution due to inconsistencies in traffic tracking over time — but the trend is still cause for concern.
91. The survey only asked if organizations were located in Kitchener and Waterloo and there were only 60 respondents from Kitchener and Cambridge. For full data see: https://theonn.ca/wp-content/ uploads/2024/10/Primary-Public-ONN-SurveyData-Sheet-External-OCT-2024.xlsx
92. Statistics Canada. Table 11-10-0002-01 Tax filers with charitable donations by sex and age.
93. Baker, J. K. (2023, September 17). Four local newspapers will no longer put out print editions. CTV News. Retrieved from https://www.ctvnews. ca/kitchener/article/four-local-newspapers-willno-longer-put out print editions/
There are some things that are true of every place, every people, every generation.
Where there are people, there is the general mayhem of children, the joyous chaos of their screams.
Where there are people, laughter doesn’t beg for a purpose. She just is.
Where there are people, we are painfully, acutely drawn into love, and we dispense cruelty in equal measure.
But what if we chose to believe that we weren’t so different.
That we all want the same things—mirrors, moments, memories. Hubs. Havens. Hangouts.
Homes.
Excerpt from the poem The Reason written and performed by Donnique Williams at WRCF’s Do More Good Dialogue: Reweaving Our Social Fabric.
To watch a video of Donnique Williams’ spoken word performance, visit youtu.be/i8KOKJWyvys
If you would like to learn more about Donnique, visit instagram.com/donniquecreates
About Waterloo Region Community Foundation
Waterloo Region Community Foundation (WRCF) collaborates with partners to ensure our communities are equitable, connected, and
sustainable; and people are thriving. We strengthen local organizations, spaces, and experiences to increase connection with communities across the three cities and four townships of Waterloo Region. We make it easy for people to do more good. We work with individuals and companies to support the organizations and issues they care about.
WRCF is focused on Granting, Investing, and Mobilizing to make measurable and sustainable impacts. Gifts are directed to WRCF’s endowed funds, with the income generated being distributed in partnership with Fundholders through grants and investments that support a wide range of charitable causes that drive positive change within our community. We are growing our assets in a socially-responsible way without compromising financial returns, and transitioning to a 100% mission-aligned portfolio. These investments include directing at least 10% of our portfolio to impact investments.
As a leading community-building organization, we also work to amplify voices and issues of importance by mobilizing conversations and sharing information, which leads people to action, while approaching our work with an equity mindset. In 2025, WRCF continues to focus on improving social infrastructure in Waterloo Region. www.wrcf.ca
AboutVitalSigns
Vital Signs® is a community check-up conducted by community foundations across Canada that measures the vitality of our communities and identifies significant trends in a range of areas critical to quality of life. Vital Signs® is coordinated nationally by Community Foundations of Canada. The Vital Signs® trademark is used with permission from Community Foundations of Canada.