Gas Flaring and Methane Emissions Facts and Trends
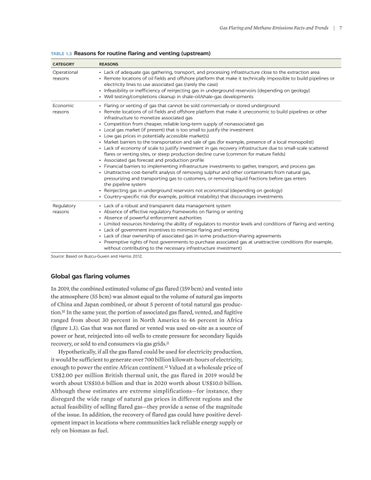
TABLE 1.3
|
Reasons for routine flaring and venting (upstream)
CATEGORY
REASONS
Operational reasons
• Lack of adequate gas gathering, transport, and processing infrastructure close to the extraction area • Remote locations of oil fields and offshore platform that make it technically impossible to build pipelines or electricity lines to use associated gas (rarely the case) • Infeasibility or inefficiency of reinjecting gas in underground reservoirs (depending on geology) • Well testing/completions cleanup in shale-oil/shale-gas developments
Economic reasons
• Flaring or venting of gas that cannot be sold commercially or stored underground • Remote locations of oil fields and offshore platform that make it uneconomic to build pipelines or other infrastructure to monetize associated gas • Competition from cheaper, reliable long-term supply of nonassociated gas • Local gas market (if present) that is too small to justify the investment • Low gas prices in potentially accessible market(s) • Market barriers to the transportation and sale of gas (for example, presence of a local monopolist) • Lack of economy of scale to justify investment in gas recovery infrastructure due to small-scale scattered flares or venting sites, or steep production decline curve (common for mature fields) • Associated gas forecast and production profile • Financial barriers to implementing infrastructure investments to gather, transport, and process gas • Unattractive cost-benefit analysis of removing sulphur and other contaminants from natural gas, pressurizing and transporting gas to customers, or removing liquid fractions before gas enters the pipeline system • Reinjecting gas in underground reservoirs not economical (depending on geology) • Country-specific risk (for example, political instability) that discourages investments
Regulatory reasons
• • • • • • •
Lack of a robust and transparent data management system Absence of effective regulatory frameworks on flaring or venting Absence of powerful enforcement authorities Limited resources hindering the ability of regulators to monitor levels and conditions of flaring and venting Lack of government incentives to minimize flaring and venting Lack of clear ownership of associated gas in some production-sharing agreements Preemptive rights of host governments to purchase associated gas at unattractive conditions (for example, without contributing to the necessary infrastructure investment)
Source: Based on Buzcu-Guven and Harriss 2012.
Global gas flaring volumes In 2019, the combined estimated volume of gas flared (159 bcm) and vented into the atmosphere (55 bcm) was almost equal to the volume of natural gas imports of China and Japan combined, or about 5 percent of total natural gas production.10 In the same year, the portion of associated gas flared, vented, and fugitive ranged from about 30 percent in North America to 46 percent in Africa (figure 1.3). Gas that was not flared or vented was used on-site as a source of power or heat, reinjected into oil wells to create pressure for secondary liquids recovery, or sold to end consumers via gas grids.11 Hypothetically, if all the gas flared could be used for electricity production, it would be sufficient to generate over 700 billion kilowatt-hours of electricity, enough to power the entire African continent.12 Valued at a wholesale price of US$2.00 per million British thermal unit, the gas flared in 2019 would be worth about US$10.6 billion and that in 2020 worth about US$10.0 billion. Although these estimates are extreme simplifications—for instance, they disregard the wide range of natural gas prices in different regions and the actual feasibility of selling flared gas—they provide a sense of the magnitude of the issue. In addition, the recovery of flared gas could have positive development impact in locations where communities lack reliable energy supply or rely on biomass as fuel.
7

