Case Studies
FIGURE 4.4
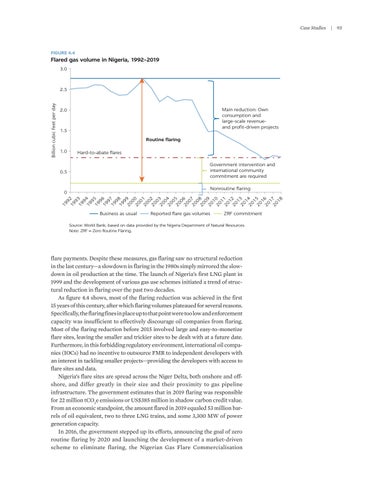
Flared gas volume in Nigeria, 1992–2019 3.0
Billion cubic feet per day
2.5
Main reduction: Own consumption and large-scale revenueand profit-driven projects
2.0
1.5 Routine flaring 1.0
Hard-to-abate flares Government intervention and international community commitment are required
0.5
Nonroutine flaring
19
9 19 2 9 19 3 9 19 4 9 19 5 9 19 6 9 19 7 9 19 8 9 20 9 0 20 0 0 20 1 0 20 2 0 20 3 0 20 4 0 20 5 0 20 6 0 20 7 0 20 8 0 20 9 1 20 0 1 20 1 1 20 2 1 20 3 1 20 4 1 20 5 1 20 6 1 20 7 18
0
Business as usual
Reported flare gas volumes
ZRF commitment
Source: World Bank, based on data provided by the Nigeria Department of Natural Resources. Note: ZRF = Zero Routine Flaring.
flare payments. Despite these measures, gas flaring saw no structural reduction in the last century—a slowdown in flaring in the 1980s simply mirrored the slowdown in oil production at the time. The launch of Nigeria’s first LNG plant in 1999 and the development of various gas use schemes initiated a trend of structural reduction in flaring over the past two decades. As figure 4.4 shows, most of the flaring reduction was achieved in the first 15 years of this century, after which flaring volumes plateaued for several reasons. Specifically, the flaring fines in place up to that point were too low and enforcement capacity was insufficient to effectively discourage oil companies from flaring. Most of the flaring reduction before 2015 involved large and easy-to-monetize flare sites, leaving the smaller and trickier sites to be dealt with at a future date. Furthermore, in this forbidding regulatory environment, international oil companies (IOCs) had no incentive to outsource FMR to independent developers with an interest in tackling smaller projects—providing the developers with access to flare sites and data. Nigeria’s flare sites are spread across the Niger Delta, both onshore and offshore, and differ greatly in their size and their proximity to gas pipeline infrastructure. The government estimates that in 2019 flaring was responsible for 22 million tCO2e emissions or US$385 million in shadow carbon credit value. From an economic standpoint, the amount flared in 2019 equaled 53 million barrels of oil equivalent, two to three LNG trains, and some 3,300 MW of power generation capacity. In 2016, the government stepped up its efforts, announcing the goal of zero routine flaring by 2020 and launching the development of a market-driven scheme to eliminate flaring, the Nigerian Gas Flare Commercialisation
|
93

