44
|
HEALTH FINANCING REFORM IN UKRAINE
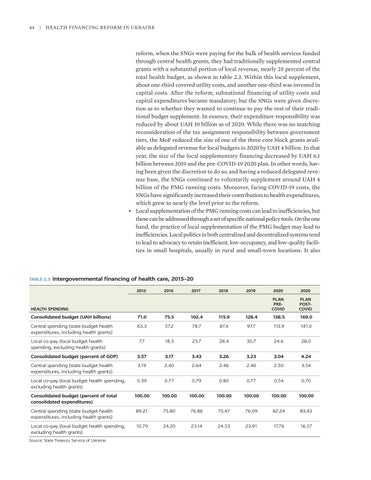
reform, when the SNGs were paying for the bulk of health services funded through central health grants, they had traditionally supplemented central grants with a substantial portion of local revenue, nearly 25 percent of the total health budget, as shown in table 2.3. Within this local supplement, about one-third covered utility costs, and another one-third was invested in capital costs. After the reform, subnational financing of utility costs and capital expenditures became mandatory, but the SNGs were given discretion as to whether they wanted to continue to pay the rest of their traditional budget supplement. In essence, their expenditure responsibility was reduced by about UAH 10 billion as of 2020. While there was no matching reconsideration of the tax assignment responsibility between government tiers, the MoF reduced the size of one of the three core block grants available as delegated revenue for local budgets in 2020 by UAH 4 billion. In that year, the size of the local supplementary financing decreased by UAH 6.1 billion between 2019 and the pre-COVID-19 2020 plan. In other words, having been given the discretion to do so, and having a reduced delegated revenue base, the SNGs continued to voluntarily supplement around UAH 4 billion of the PMG running costs. Moreover, facing COVID-19 costs, the SNGs have significantly increased their contribution to health expenditures, which grew to nearly the level prior to the reform. • Local supplementation of the PMG running costs can lead to inefficiencies, but these can be addressed through a set of specific national policy tools. On the one hand, the practice of local supplementation of the PMG budget may lead to inefficiencies. Local politics in both centralized and decentralized systems tend to lead to advocacy to retain inefficient, low-occupancy, and low-quality facilities in small hospitals, usually in rural and small-town locations. It also
TABLE 2.3
Intergovernmental financing of health care, 2015–20 2015
2016
2017
2018
2019
HEALTH SPENDING
2020
2020
PLAN PRECOVID
PLAN POSTCOVID
Consolidated budget (UAH billions)
71.0
75.5
102.4
115.9
128.4
138.5
169.0
Central spending (state budget health expenditures, including health grants)
63.3
57.2
78.7
87.4
97.7
113.9
141.0
7.7
18.3
23.7
28.4
30.7
24.6
28.0
Consolidated budget (percent of GDP)
3.57
3.17
3.43
3.26
3.23
3.04
4.24
Central spending (state budget health expenditures, including health grants)
3.19
2.40
2.64
2.46
2.46
2.50
3.54
Local co-pay (local budget health spending, excluding health grants)
0.39
0.77
0.79
0.80
0.77
0.54
0.70
100.00
100.00
100.00
100.00
100.00
100.00
100.00
Central spending (state budget health expenditures, including health grants)
89.21
75.80
76.86
75.47
76.09
82.24
83.43
Local co-pay (local budget health spending, excluding health grants)
10.79
24.20
23.14
24.53
23.91
17.76
16.57
Local co-pay (local budget health spending, excluding health grants)
Consolidated budget (percent of total consolidated expenditures)
Source: State Treasury Service of Ukraine.
