The Quality of Health and Education Systems Across Africa

Page 80

The Quality of Health and Education Systems Across Africa

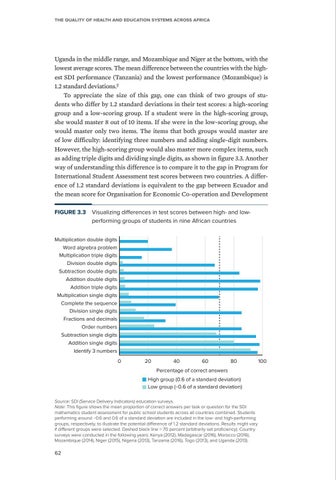
Uganda in the middle range, and Mozambique and Niger at the bottom, with the lowest average scores. The mean difference between the countries with the highest SDI performance (Tanzania) and the lowest performance (Mozambique) is 1.2 standard deviations.9 To appreciate the size of this gap, one can think of two groups of students who differ by 1.2 standard deviations in their test scores: a high-scoring group and a low-scoring group. If a student were in the high-scoring group, she would master 8 out of 10 items. If she were in the low-scoring group, she would ­master only two items. The items that both groups would master are of low difficulty: identifying three numbers and adding single-digit numbers. However, the high-scoring group would also master more complex items, such as adding triple digits and dividing single digits, as shown in figure 3.3. Another way of understanding this difference is to compare it to the gap in Program for International Student Assessment test scores between two countries. A difference of 1.2 standard deviations is equivalent to the gap between Ecuador and the mean score for Organisation for Economic Co-operation and Development FIGURE 3.3  Visualizing differences in test scores between high- and lowperforming groups of students in nine African countries Multiplication double digits Word algrebra problem Multiplication triple digits Division double digits Subtraction double digits Addition double digits Addition triple digits Multiplication single digits Complete the sequence Division single digits Fractions and decimals Order numbers Subtraction single digits Addition single digits Identify 3 numbers 0

20

40

60

80

Percentage of correct answers High group (0.6 of a standard deviation) Low group (−0.6 of a standard deviation) Source: SDI (Service Delivery Indicators) education surveys. Note: This figure shows the mean proportion of correct answers per task or question for the SDI mathematics student assessment for public school students across all countries combined. Students performing around −0.6 and 0.6 of a standard deviation are included in the low- and high-performing groups, respectively, to illustrate the potential difference of 1.2 standard deviations. Results might vary if different groups were selected. Dashed black line = 70 percent (arbitrarily set proficiency). Country surveys were conducted in the following years: Kenya (2012), Madagascar (2016), Morocco (2016), Mozambique (2014), Niger (2015), Nigeria (2013), Tanzania (2016), Togo (2013), and Uganda (2013).

62

100


Turn static files into dynamic content formats.

Create a flipbook

Articles inside

Appendix D: Methodological groundwork for the SDI teacher and student assessments

6min
pages 165-169

C.1 Example of a typical SDI education survey instrument

4min
pages 161-164

Appendix C: Survey methodology

7min
pages 157-160

B.1 Typical sampling strategy process for SDI surveys

7min
pages 152-156

Appendix B: Sampling procedures

1min
page 151

A.6 Definition of a correct treatment

4min
page 146

A.3 Definition and calculation of health indicators

3min
page 142

A.4 Definition of education indicators

4min
pages 143-144

SDI surveys: Turning measurement into momentum for reform

4min
pages 132-133

Rethinking service delivery

4min
pages 130-131

Results in action: How SDI surveys inform program operations

8min
pages 120-123

References

6min
pages 126-129

A wider perspective: Measurement as a public good for research

2min
page 124

Notes

2min
page 125

Improving comparability of SDI surveys over time

4min
pages 118-119

Understanding interactions with family background

4min
pages 116-117

Addressing determinants of provider performance

6min
pages 113-115

Adapting SDI surveys to different country contexts

14min
pages 106-112

References

8min
pages 101-105

concern during COVID-19

3min
page 90

Are basic requirements for learning in place?

4min
pages 82-83

location

2min
page 95

Notes

5min
pages 99-100

High- and low-performing schools: How can countries narrow the gaps?

2min
page 89

low-performing groups of students in nine African countries

1min
page 80

3.1 How does language of instruction affect test scores?

2min
page 81

Sample, methods, and framework

2min
page 73

SDI education surveys: Seeing basic education from the students’ perspective

2min
page 72

Background: Reimagining what education can achieve

1min
page 71

References

9min
pages 67-70

Conclusions: What will it take to improve service delivery in health?

6min
pages 63-65

African countries, by country and type of equipment

1min
page 58

Notes

2min
page 66

medicines in six African countries, by country and type of facility

1min
page 60

infrastructure

1min
page 56

Will health care providers be present in the health facility?

2min
page 42

Will health care providers be ready to provide quality care?

4min
pages 48-49

Sample, methods, and framework

2min
page 40

Will the necessary infrastructure, equipment, supplies, and medicines be available?

1min
page 54

Structure of this chapter

2min
page 39

location

1min
page 55

SDI health surveys: A finger on the pulse of primary health care

2min
page 38

by country and health facility ownership

1min
page 43

1.1 What do Service Delivery Indicators surveys measure?

4min
pages 29-30

COVID-19: Challenging the resilience of health and education systems

4min
pages 26-27

Human capital at the core of development

1min
page 25

References

1min
pages 23-24

Aims and structure of the book

2min
page 32

Data to drive change

2min
page 22

Background: An opportunity to transform primary health care

1min
page 37

Learning from the Service Delivery Indicators surveys

2min
page 28
Issuu converts static files into: digital portfolios, online yearbooks, online catalogs, digital photo albums and more. Sign up and create your flipbook.