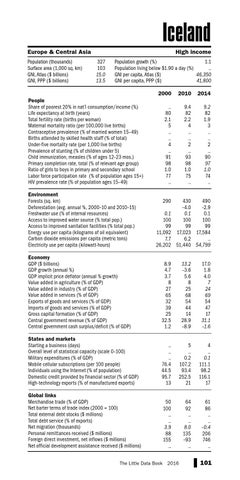
Iceland Europe & Central Asia Population (thousands) Surface area (1,000 sq. km) GNI, Atlas ($ billions) GNI, PPP ($ billions)
High income 327 103 15.0 13.5
Population growth (%) 1.1 Population living below $1.90 a day (%) .. GNI per capita, Atlas ($) 46,350 GNI per capita, PPP ($) 41,800
People Share of poorest 20% in nat’l consumption/income (%) Life expectancy at birth (years) Total fertility rate (births per woman) Maternal mortality ratio (per 100,000 live births) Contraceptive prevalence (% of married women 15–49) Births attended by skilled health staff (% of total) Under-five mortality rate (per 1,000 live births) Prevalence of stunting (% of children under 5) Child immunization, measles (% of ages 12–23 mos.) Primary completion rate, total (% of relevant age group) Ratio of girls to boys in primary and secondary school Labor force participation rate (% of population ages 15+) HIV prevalence rate (% of population ages 15–49) Environment Forests (sq. km) Deforestation (avg. annual %, 2000–10 and 2010–15) Freshwater use (% of internal resources) Access to improved water source (% total pop.) Access to improved sanitation facilities (% total pop.) Energy use per capita (kilograms of oil equivalent) Carbon dioxide emissions per capita (metric tons) Electricity use per capita (kilowatt-hours)
2000
2010
2014
.. 80 2.1 5 .. .. 4 .. 91 98 1.0 77 ..
9.4 82 2.2 4 .. .. 2 .. 93 98 1.0 75 ..
9.2 82 1.9 3 .. .. 2 .. 90 97 1.0 74 ..
290 0.1 100 99 11,092 7.7 26,202
430 490 –4.0 –2.9 0.1 0.1 100 100 99 99 17,023 17,584 6.2 .. 51,440 54,799
Economy GDP ($ billions) GDP growth (annual %) GDP implicit price deflator (annual % growth) Value added in agriculture (% of GDP) Value added in industry (% of GDP) Value added in services (% of GDP) Exports of goods and services (% of GDP) Imports of goods and services (% of GDP) Gross capital formation (% of GDP) Central government revenue (% of GDP) Central government cash surplus/deficit (% of GDP)
8.9 4.7 3.7 8 27 65 32 39 25 32.5 1.2
13.2 –3.6 5.6 8 25 68 54 44 14 28.9 –8.9
17.0 1.8 4.0 7 24 69 54 47 17 31.1 –1.6
States and markets Starting a business (days) Overall level of statistical capacity (scale 0–100) Military expenditures (% of GDP) Mobile cellular subscriptions (per 100 people) Individuals using the Internet (% of population) Domestic credit provided by financial sector (% of GDP) High-technology exports (% of manufactured exports)
.. .. .. 76.4 44.5 95.7 13
5 .. 0.2 107.2 93.4 252.5 21
4 .. 0.1 111.1 98.2 116.1 17
Global links Merchandise trade (% of GDP) Net barter terms of trade index (2000 = 100) Total external debt stocks ($ millions) Total debt service (% of exports) Net migration (thousands) Personal remittances received ($ millions) Foreign direct investment, net inflows ($ millions) Net official development assistance received ($ millions)
50 100 .. .. 3.9 88 155 ..
64 92 .. .. 8.0 135 –93 ..
61 86 .. .. –0.4 206 746 ..
The Little Data Book 2016
101